
Mutational Analysis of Field Cancerization in Bladder Cancer
Abstract
BACKGROUND:
Morphologically normal tissue, adjacent to tumors, contains multiple molecular changes, the so-called field cancerization. The multifocal and recurrent nature of bladder cancer has been hypothesized to originate from this. However, further studies are required to explore the mutational composition of normal tissue adjacent to tumors.
OBJECTIVE:
To analyze field cancerization in bladder cancer patients using a non-tumor guided approach.
METHODS:
We investigated the mutational landscape of normal appearing urothelium and paired bladder tumors from four patients by applying deep-targeted sequencing.
RESULTS:
Sequencing of 509 cancer driver genes revealed the presence of 2– 13 mutations exclusively localized in normal tissue (average target read depth 634×). Furthermore, 6– 13 mutations were shared between tumor and normal samples and 8– 75 mutations were exclusively detected in tumor samples. More mutations were observed in normal samples from patients with multifocal disease compared to patients with unifocal disease. Mutations in normal samples had lower variant allele fractions (VAF) compared to tumor mutations (p < 2.2*10–16). Furthermore, significant differences in the type of nucleotide changes between tumor, normal and shared mutations (p = 2.2*10–5) were observed, and mutations in APOBEC context were observed primarily among tumor mutations (p = 0.02). No differences in functional impact between normal, shared and tumor mutations were observed (p = 0.61).
CONCLUSION:
Overall, these findings support the presence of more than one field in the bladder, and document non-tumor specific driver mutations to be present in normal appearing bladder tissue.
Introduction
By applying whole exome sequencing and deep-targeted sequencing on bladder tumors, it was recently shown that tumors developed years apart in the same patients share multiple mutations and hence are clonally related [1– 3]. Furthermore, apparently normal urothelium has been documented to contain mutations with low variant allele frequencies (∼3%) that are typically observed at high frequencies in tumors (clonal mutations) [1– 3]. Multiple studies have investigated genomic alterations in normal appearing bladder tissue from cystectomy specimens, however using technologies that do not allow detection of low-frequency mutations. The genomic alterations observed in these studies include recurrent copy number alterations of chromosomes 5, 9, 13, 16, and 17 as well as recurrent mutations or loss of RB1 and TP53 [4– 9]. These findings corroborate the suggestions of the presence of field cancerization in the bladder. In addition, several studies in other tissue types have also revealed the presence of mutations in known cancer driver genes in apparently healthy tissue and pre-cancer lesions [10– 13].
Approximately 50% of both primary and recurrent bladder tumors in non-muscle invasive bladder cancer (NMIBC) are multifocal [14]. Moreover, recurrent bladder cancer (BC) is common as the majority of the patients with NMIBC relapse within five years [15, 16]. Approximately 75% of patients with BC present with NMIBC, and 5– 25% of these will progress to muscle-invasive bladder cancer (MIBC) [16, 17]. Multifocality and the frequent recurrences of BC are hypothesized to originate from field cancerization of the bladder urothelium [18]. This concept was first described in oral squamous epithelium in 1953 by Slaughter et al. as an explanation of the high local recurrence rate of oral cancers [19]. More recent, field cancerization has been described as an underlying mechanism for tumor development in various cancer types, including BC [20].
Field cancerization is understood as one or more areas, or fields, with mutated cells. The transformed cells may appear normal or dysplastic [20, 21]. Different paths for the development of field cancerization have been proposed. These include intraepithelial migration and/or luminal seeding of carcinoma cells from existing tumors followed by implantation of these cells in the urothelium. Fields arising from these cells will hence resemble the tumor [22]. Another explanation is that transformed stem cells, embedded in the urothelium, clonally expand and lead to the formation of fields of transformed cells, which may develop into a tumor [18, 23]. In our previous study of bladder cancer field cancerization, we proposed a theory of multiple fields being present in the bladder [2] where parallel expansion of different mutated stem cells might lead to multiple transformed fields intermixed in the bladder urothelium. Tumors will mirror the genetic alterations from the field from which it arose [2].
Previously, we analyzed mutations in adjacent normal tissue restricted to mutations observed in the tumor samples, and consequently, non-tumor specific mutations were not investigated [2]. In this study, we characterized mutations in normal appearing urothelium adjacent to tumors by deep-targeted sequencing. We detected high-impact mutations in known driver genes that were not observed in the tumor. Furthermore, we observed mutations shared between tumor and normal samples (tumor field effect) as well as mutations specific to the tumors (mutations acquired later in development).
Results
We performed deep-targeted sequencing of DNA obtained from four patients (patients 1 to 4) with advanced bladder cancer, treated with radical cystectomy (see Supplementary Fig. S1 and Supplementary Table S1 for detailed disease courses). From each patient, DNA was procured from bulk tumor biopsies (n = 2– 7) and laser microdissected (LMD) biopsies of normal appearing urothelium (n = 6– 11) (See Supplementary Table S2 for overview of samples and sequencing information). Individual bulk tumor samples were previously analyzed by whole exome sequencing (WES) followed by deep-targeted amplicon sequencing of LMD tumor and normal samples guided by the original WES of bulk tumor [2]. In this present study, we expand on our previous study to include the analysis of mutations uniquely present in normal appearing adjacent tissue by deep-targeted sequencing (Fig. 1).
Deep targeted sequencing
Fig.1
Study design. Upper part: analyses performed previously. WES was performed on bulk tumor samples. Multiple tumor and normal biopsies were laser microdissected (LMD) and subjected to deep-targeted amplicon sequencing guided by the bulk tumor WES. Lower part: present study (black box). Tumor and normal DNA samples were pooled and subjected to deep-targeted amplicon sequencing. Mutation calls were analyzed and grouped into T-Mutations, N-Mutations, and S-Mutations.
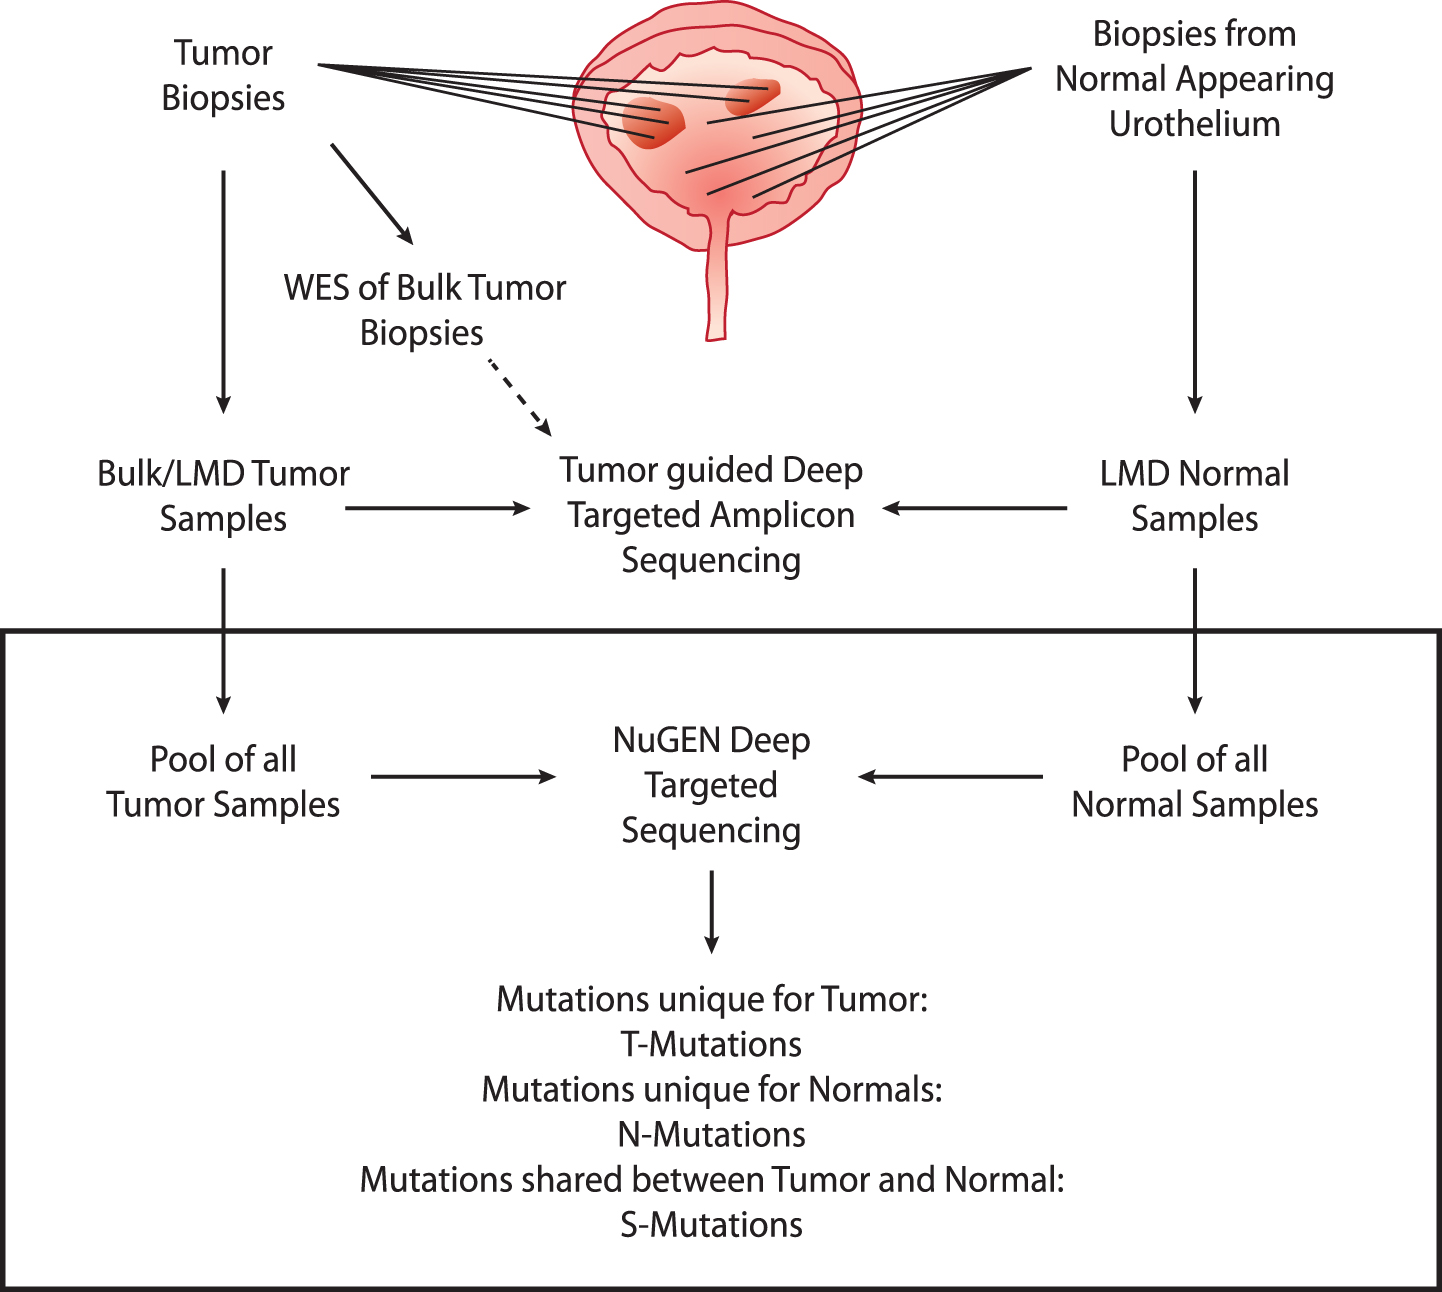
Extracted DNA from tumors and remaining DNA from LMD normal samples were pooled resulting in one pool of tumor DNA (tumor pool) and one pool of normal DNA (normal pool) for each of the four patients. We performed deep-targeted amplicon sequencing of 509 cancer genes on both pools and on matched leukocyte DNA as reference. We obtained a raw average target read depth of 634× (range: 360– 1073). To ensure low error-rates and thereby facilitate robust mutation calls, we employed unique molecular identifiers (UMI), resulting in a consolidated average target read depth of 69× (range: 36– 129). The coverage reduction is in accordance with previous studies [24, 25]. In total, MuTect2 identified 131– 283 point mutations and indels in the pools from the four patients. Mutations were classified as unique to normal (N-Mutations), unique to tumors (T-Mutations) or shared (S-Mutations). N- and T-Mutations were subjected to read-counting in associated sequencing data to assess presence of mutations below the detection threshold of MuTect2, resulting in reclassification of 66– 102 mutations (from unique to shared) (see Supp. Figure S3). The final set consisted of 2– 13 N-mutations, 8– 75 T-mutations, and 6– 13 S-mutations (Figs. 1 and 2). For tumor pools, we observed a mean tumor mutation burden (TMB) of 17 mutations per Mb (range: 6– 33). Despite of the low mutation numbers and differences introduced due to varying read depths, sample representation or sequencing approach, this TMB is higher than previous WES and panel based studies, respectively (TCGA [26, 27]: 7.7 and 8.2 mutations per Mb; Zehir et al. [28]: 9.45 mutations per Mb) - probably due to the high coverage sequencing performed here, which will identify more subclonal mutations.
Fig.2
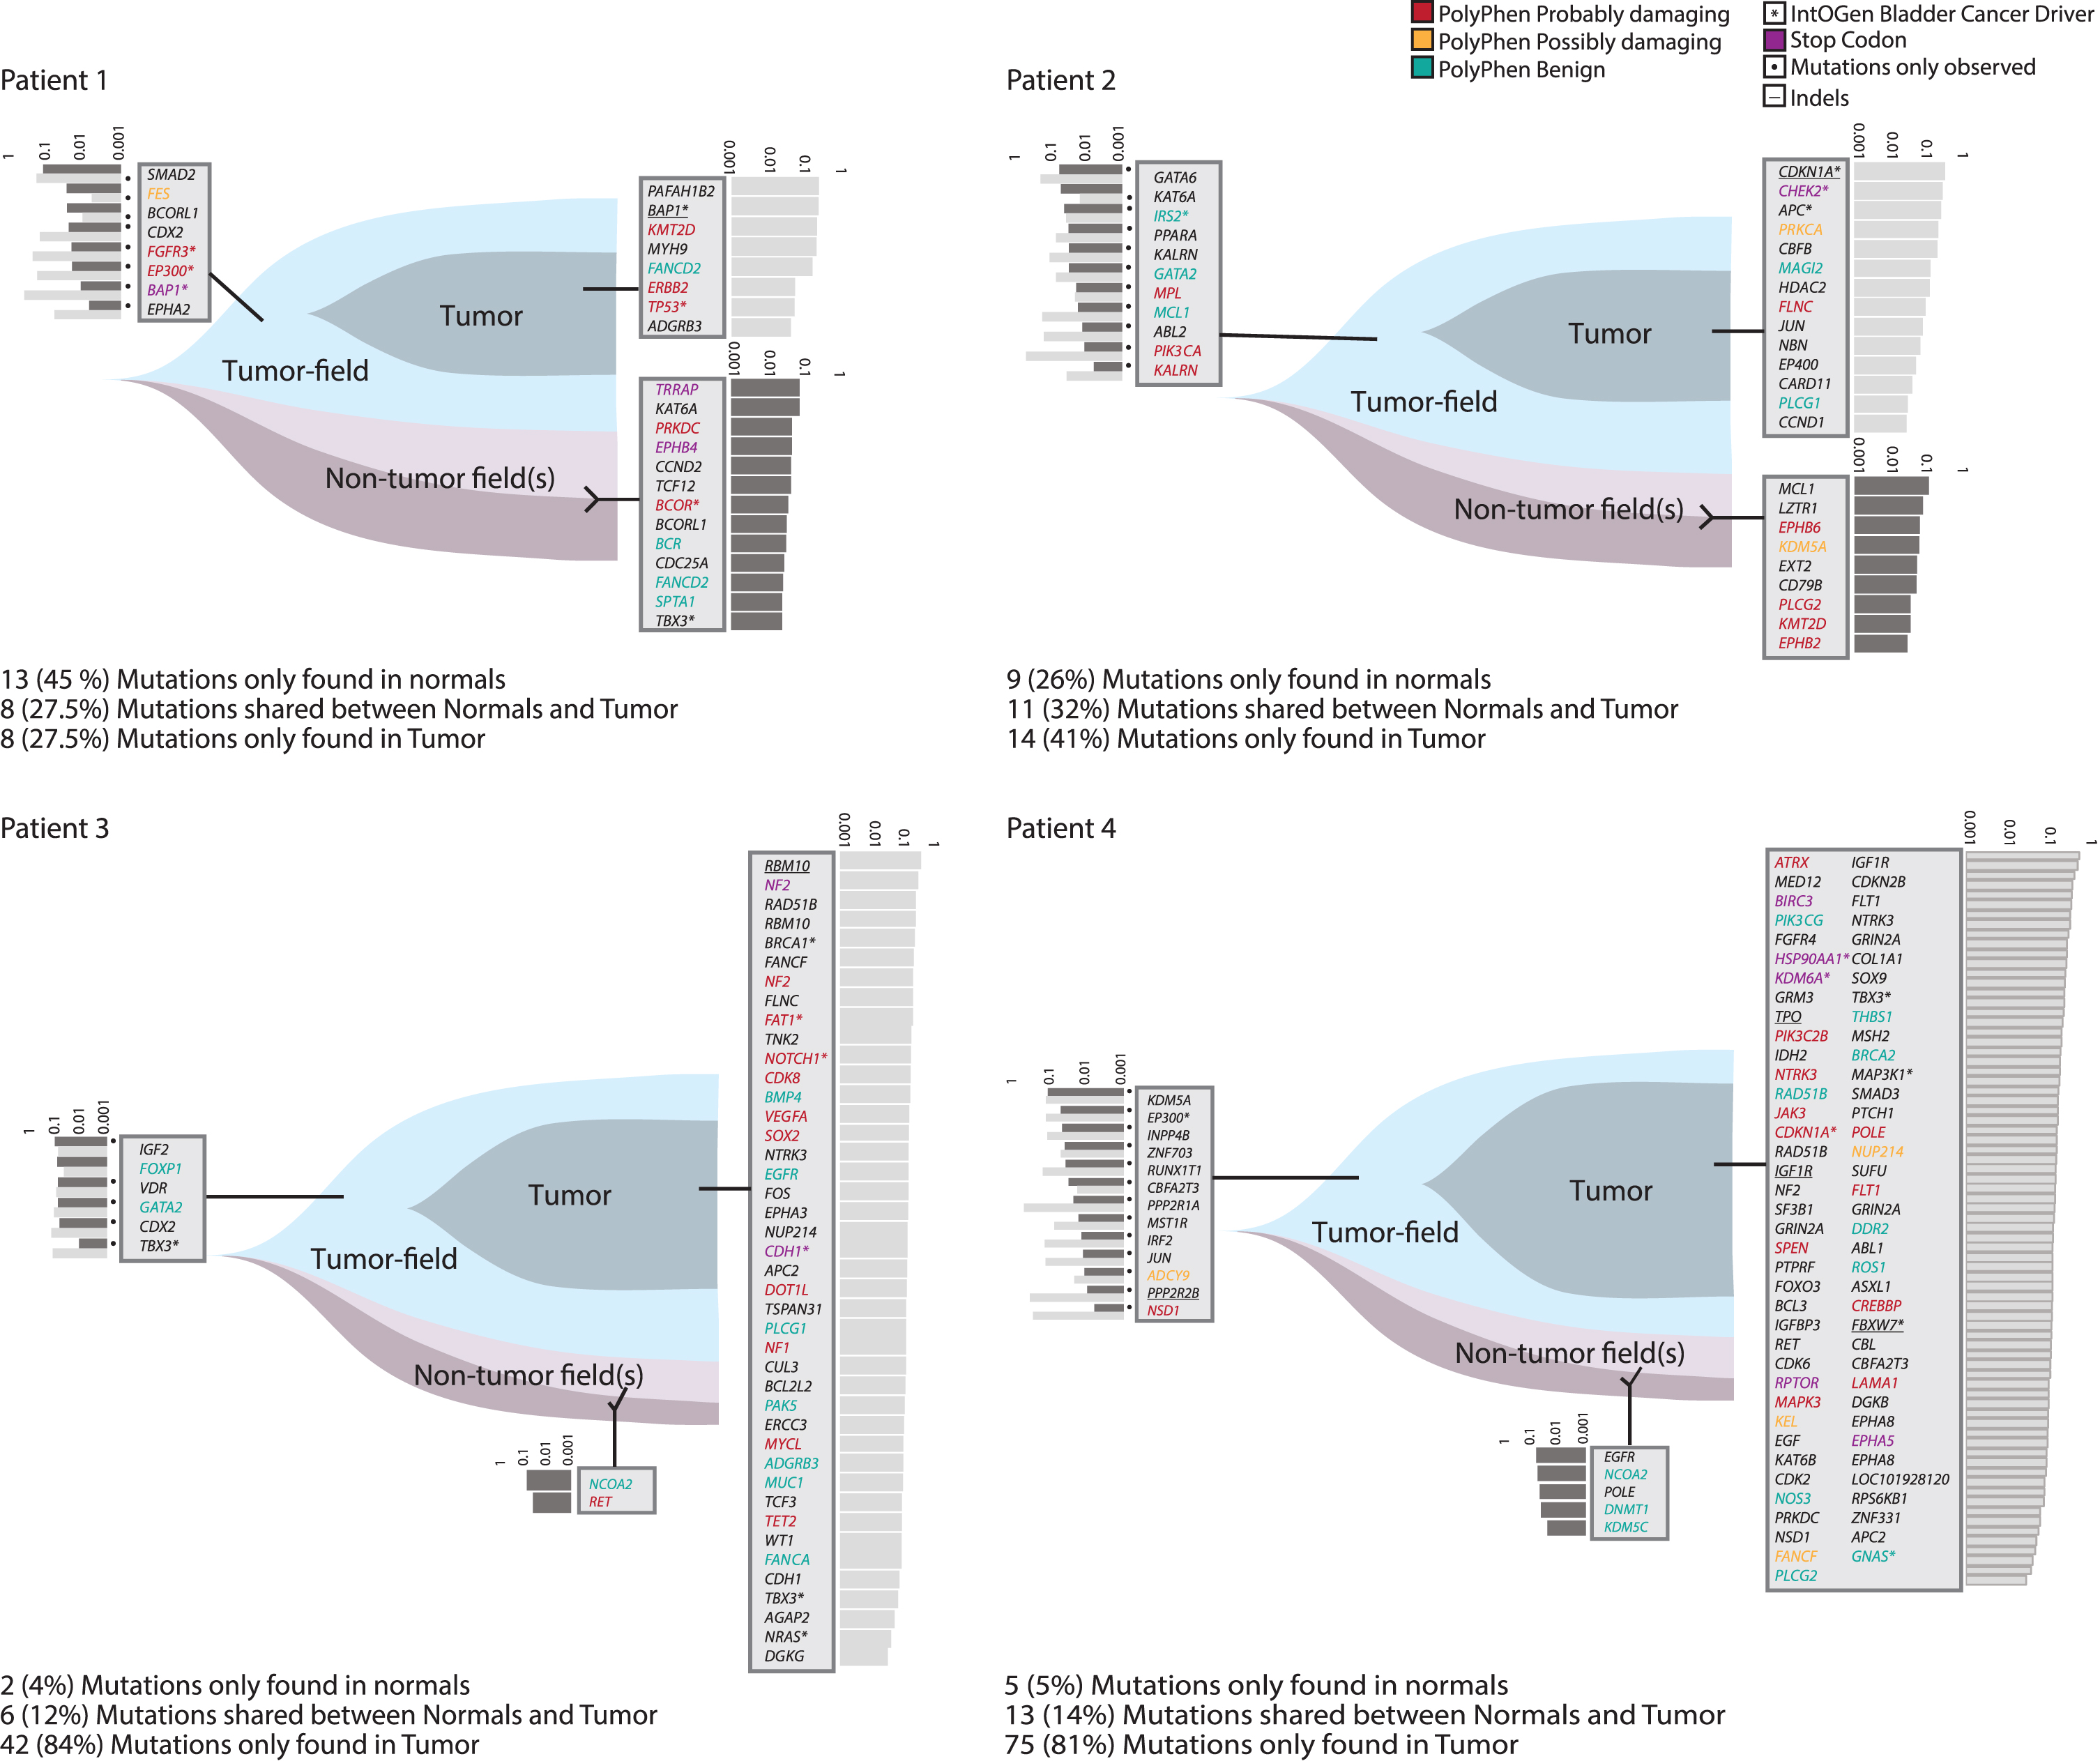
Analysis of field cancerization. Analysis of patients 1– 4. Field cancerization visualized using T-Mutations, N-Mutations, and S-Mutations. Gene names and variant allele fractions (VAF) are displayed. Every gene name corresponds to one point mutation or indel (indels are underlined). VAFs are illustrated as light grey bars (VAF measured in tumor) and dark grey (VAF measured in normal). Assignable mutations have been attributed to a PolyPhen category marked in red, yellow or green according to category. One mutation in GATA2 was shared between patients 2 and 3, and 37 genes were mutated twice or more across samples.
Analysis of field cancerization
Patients 1 and 2 presented with multifocal disease, whereas patients 3 and 4 had unifocal disease. In patients 1 and 2, 35% (22/63) of the mutations were N-Mutations, and 30% (19/63) were S-Mutations. Mutations called in patients 3 and 4 were mainly T-Mutations, with only 5% (7/143) being N-Mutations and 13% (19/143) S-Mutations - suggesting that uni- and multifocal patients may show different levels of field cancerization. However, this needs to be confirmed in a bigger dataset.
VAFs for mutations in normal samples were significantly lower than for mutations in tumor samples (p < 2.2*10–16, Unpaired T-test) (Fig. 3a). Inspecting only called mutations in the tumor pool, there was no significant difference between VAFs for T-Mutations and S-Mutations (p = 0.08, Unpaired T-test).
Fig.3
Analysis of mutational impact and VAF. All analyses were performed on the combined set of mutations from all patients. The total number of mutations in each category is indicated. (a) Variant allele fractions from N-, T-, and S-Mutations. For S-Mutations, variant allele fractions are measured both in the normal samples and in the tumor samples and both are indicated. (b) Predicted impact of mutations among N-, T-, and S-Mutations grouped into missense (moderate impact), nonsense (premature stop codon; high impact), other high impact, indels (high/moderate impact), and low/modifier impact mutations. Low/modifier includes UTR variants and synonymous mutations. (c) Predicted impact of mutations in N-, T-, and S-Mutations grouped into synonymous and non-synonymous (mutations predicted to have a high or moderate impact) mutations.
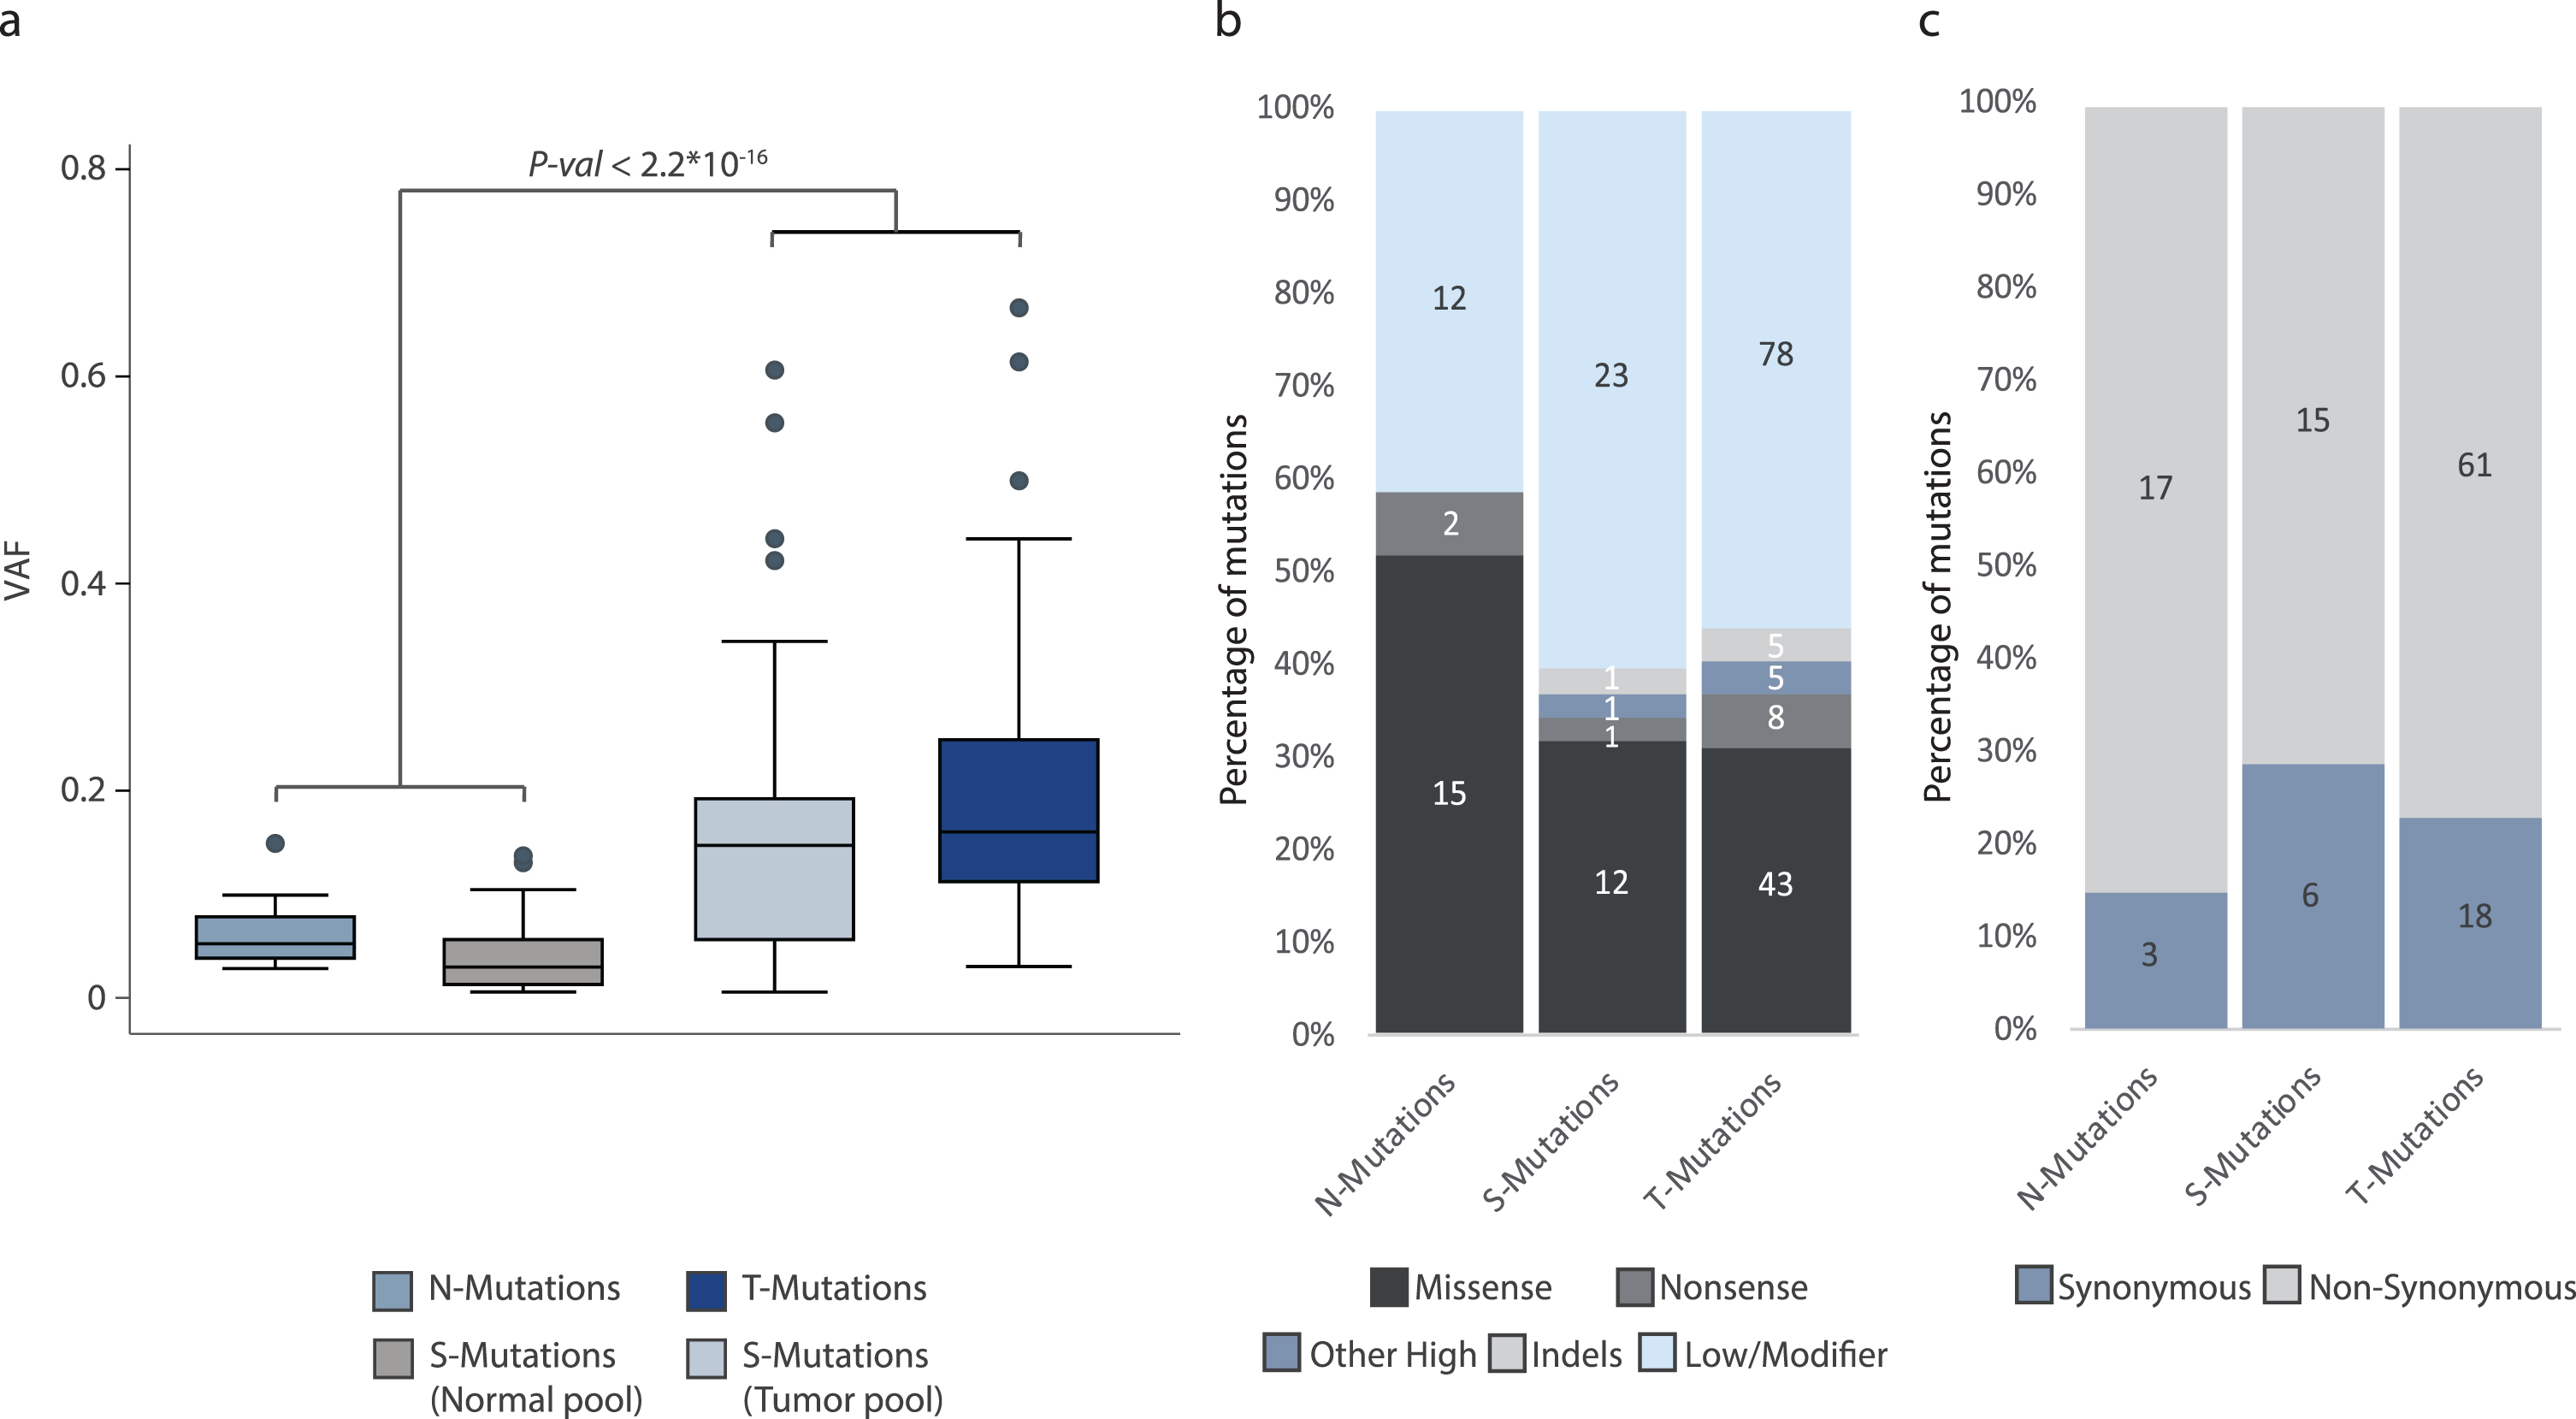
Finally, we used the SnpEff software to annotate the mutations. We observed no difference in the functional impact of the mutations observed in the three mutation categories. This was observed both when assessing mutations categorized as missense (moderate impact), nonsense (premature stop codon, high impact), other high impact, indels (high/moderate impact), and low/modifier impact mutations (p = 0.61, Fisher’s Exact Test), and when analyzing synonymous and non-synonymous mutations (p = 0.56, Fisher’s Exact Test) (Fig. 3b and 3c, respectively).
Table 1
Overview of patients, samples, and mutations. Mutations in the S-Mutations group have only been called in at least one of the pools and observed (pile-up) in the other one if not called. Variant allele fractions are based on the pile-up counts
| Patient 1 | Patient 2 | Patient 3 | Patient 4 | |
| Focality | Multifocal | Multifocal | Unifocal | Unifocal |
| T Stage (Clinical) | T3b | T3b | T3b | T2b |
| Grade | High | High | High | High |
| N Status | 1 | 0 | 0 | 0 |
| Total number of mutations | 29 | 34 | 50 | 93 |
| No. N-Mutations | 13 (45%) | 9 (26%) | 2 (4%) | 5 (5%) |
| No. T-Mutations | 8 (27.5%) | 14 (41%) | 42 (84%) | 75 (81%) |
| No. S-Mutations | 8 (27.5%) | 11 (32%) | 6 (12%) | 13 (14%) |
| Mutated bladder cancer driver genes | ||||
| N-Mutations | BCOR, TBX3 | – | – | – |
| T-Mutations | BAP1, TP53 | CDKN1A, CHEK2, | BRCA1, FAT1, NOTCH1, | HSP90AA1, KDM6A, CDKN1A, |
| APC | CDH1, TBX3, NRAS | TBX3, MAP3K1, FBXW7, GNAS | ||
| S-Mutations | FGFR3, EP300, BAP1 | IRS2 | TBX3 | EP300 |
| Premature stop codons | ||||
| N-Mutations | TRRAP, EPHB4 | – | – | – |
| T-Mutations | – | CHEK2 | NF2, CDH1 | BIRC3, HSP90AA1, KDM6A, |
| RPTOR, EPHA5 | ||||
| S-Mutations | BAP1 | – | – | – |
| Variant allele fractions (median (min-max)) | ||||
| N-Mutations | 0.044 (0.029– 0.091) | 0.067 (0.035– 0.15) | 0.070 (0.049– 0.091) | 0.059 (0.049– 0.091) |
| T-Mutations | 0.23 (0.049– 0.31) | 0.13 (0.031– 0.40) | 0.17 (0.039– 0.50) | 0.16 (0.032– 0.67) |
| S-Mutations (Normal pool) | 0.025 (0.0074– 0.14) | 0.033 (0.0064– 0.063) | 0.10 (0.014– 0.13) | 0.025 (0.0065– 0.13) |
| S-Mutations (Tumor pool) | 0.18 (0.0063– 0.44) | 0.077 (0.016– 0.56) | 0.13 (0.057– 0.19) | 0.15 (0.020– 0.61) |
Mutations in known BC driver genes were detected in all mutation groups, most of them being among T-Mutations. In patient 1, two N-mutations were observed in BC driver genes. Damaging mutations according to PolyPhen classification [29] were present in all mutation groups. We detected the introduction of premature stop codons, mainly in the T-Mutation group. However, for patient 1, premature stop codons were solely observed within the N- and S-Mutations (see Fig. 2 and Table 1).
Interestingly, we observed N-Mutations in genes known to have a role in cancer development. To corroborate our findings, we investigated the genes affected by non-synonymous mutations in 1889 patients with a total of 1934 samples from 11 different BC studies using cBioPortal. In total, 0.6% to 23% (mean 4%) of the bladder tumors harbored mutations in the same set of genes. The six most frequently non-synonymous mutated N-Mutation genes in the BC datasets were KMT2D (23%), SPTA1 (8%), TRRAP (7%), PRKDC (6%), POLE (4%), and {KDM5A (4%).∥
Validation of mutations by WES and ddPCR
Validation of mutations was performed using two different approaches. Firstly, WES data of tumor samples was used to validate mutations detected by our deep-targeted sequencing approach. In general, we observed consistency in VAFs measured by the two platforms, and most positions were covered across all samples (Spearman correlation = 0.78, p-val = 2.2*10–16; Fig. 4a and 4b).∥Secondly, we used ddPCR to validate the presence/absence of selected alterations in normal and tumor samples. Five alterations in FGFR3, PIK3CA, STAG2, PFKP, and CDH11, previously observed in tumor and normal samples along with alterations in CDKN1A, RBM10, and C11orf70 solely detected in tumor samples [2] and three additional N-Mutations in DDB2, EPHB4, and EPHB2 were chosen for ddPCR validation. For every patient, tumor mutations were analyzed by ddPCR in 6– 11 samples from the normal appearing urothelium depending on the number of procured specimens. Except for a deletion in RBM10, all tumor alterations were detected at low frequencies in normal samples (Fig. 4c). VAFs from ddPCR were compared to deep-targeted amplicon sequencing of the same samples and a correlation coefficient of 0.93 was observed. For N-Mutation analysis, DNA extracted from 4– 7 tumor areas were analyzed and none of the mutations were detected in any of the tumor samples analyzed by ddPCR (Fig. 4d), which validated the normal tissue specificity.∥
Analysis of mutational context
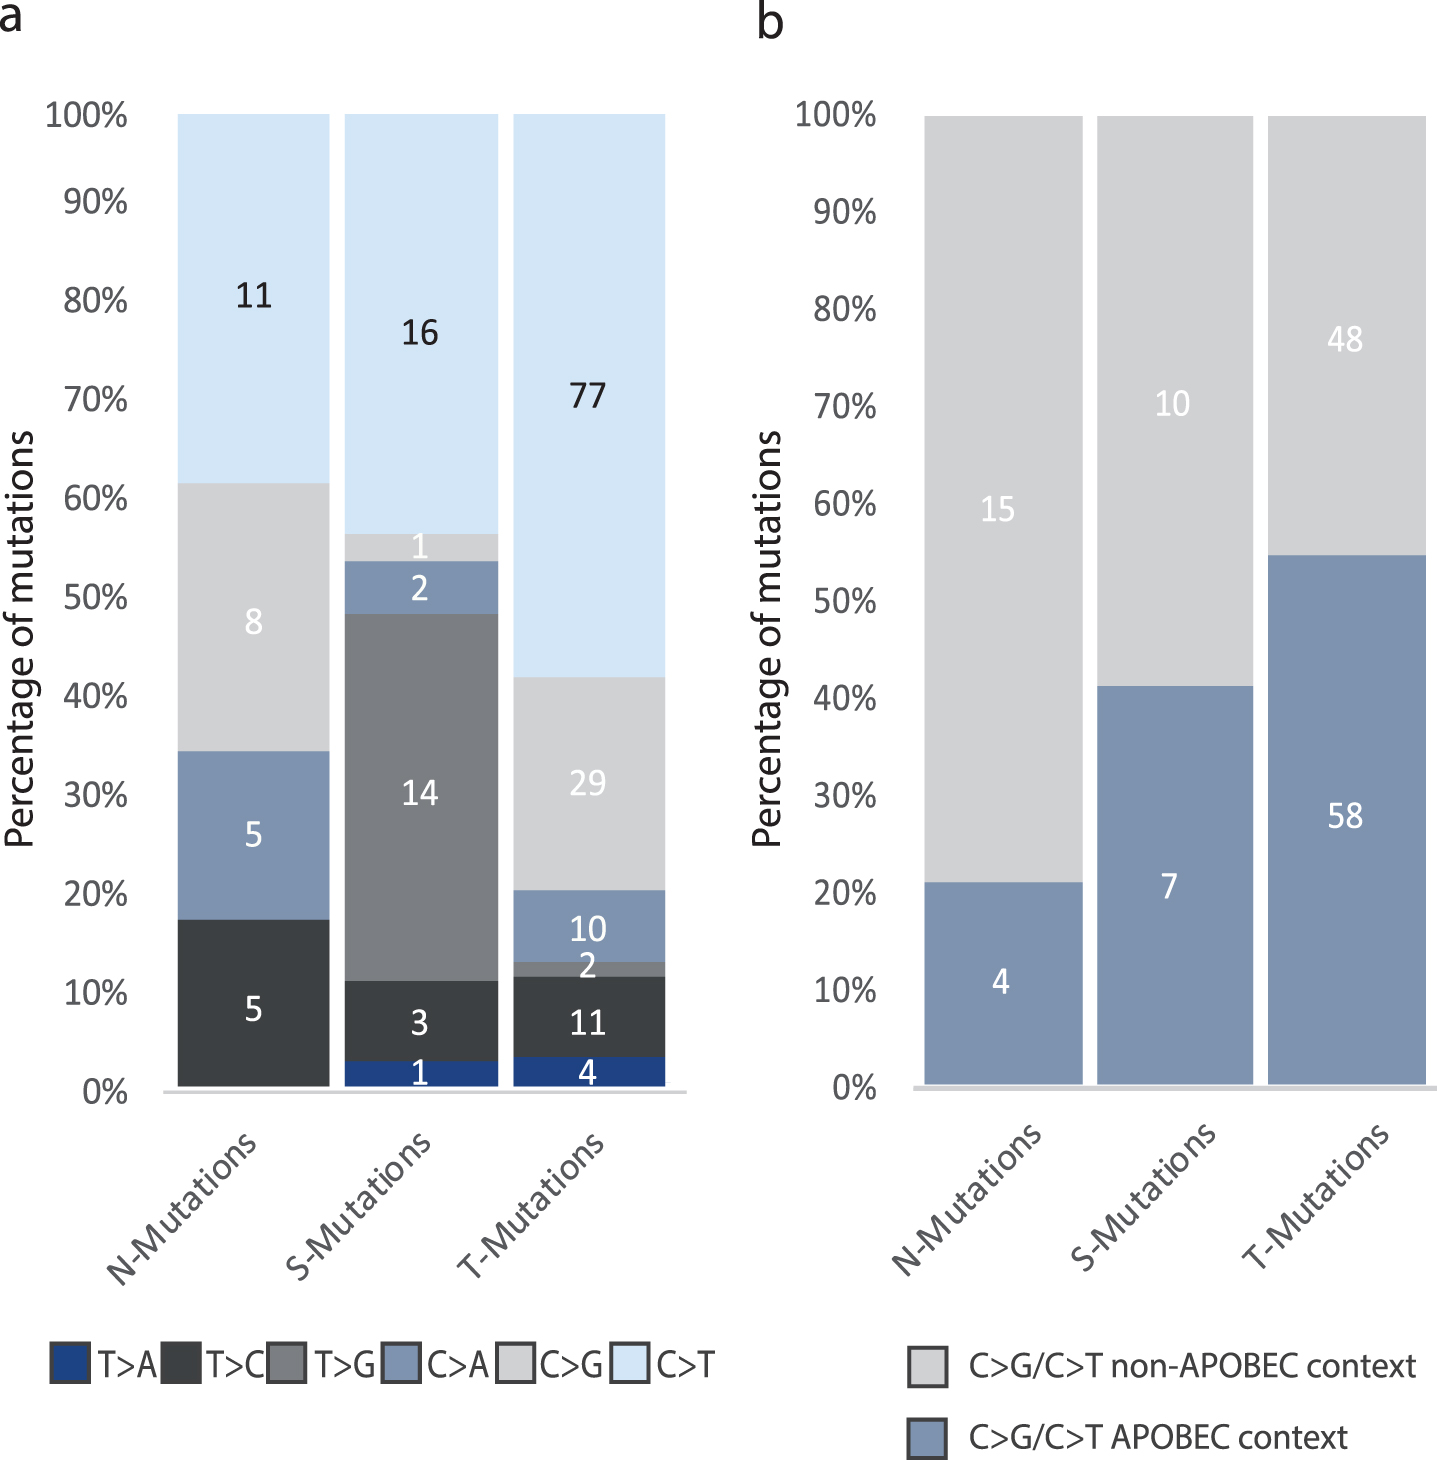
We performed a combined analysis of the mutations detected in the four patients as the individual patients harbored too few mutations for robust statistical analyses. We observed a significant difference in the six single-base substitutions between the three groups of mutations (p = 2.1*10–5, Fisher’s Exact Test): 58% of T-Mutations were C > T changes compared to approximately 40% of both N- and S-Mutations. Furthermore, we observed no T > G mutations in N-Mutations, whereas 38% of S-Mutations and 1.5% of T-Mutations were T > G base pair substitutions. C > G mutations were present among N-Mutations and T-Mutations at 28% and 22% frequency, respectively, compared to 3% in S-Mutations (Fig. 5a).∥Next, we assessed the proportion of APOBEC related mutagenesis. C > T/G mutations in a TCW context, where W is either T or A, were evaluated as representing the APOBEC signature [30]. We observed a significant difference between the proportion of N-, S-, and T-Mutations in APOBEC related context (p = 0.0011, Fisher’s Exact Test). In addition, we observed a significant difference when comparing C > T/C>G mutations in an APOBEC-related context and C > T/C>G in non-APOBEC related context in N-, S-, and T-Mutations \enlargethispage 2pt(p = 0.02, Fisher’s Exact Test) (Fig. 5b).
Discussion
Here we characterized the field cancerization in four patients with advanced BC and addressed the question of multiple mutated fields being present within the bladder. Field cancerization was observed in all four patients analyzed (two with multifocal disease and two with unifocal disease), being more pronounced in patients with multifocal disease compared to patients with unifocal disease. It should be noted that the number of mutations and patients is relatively small.
We found that the normal appearing urothelium harbored private mutations not detected in the tumor samples. We suggest that these mutations represent one or more fields that have not led to tumor development. Additionally, we detected mutations that were shared between normal and tumor samples, representing mutations from the field developing into a tumor. Mutations unique to tumor samples were also present, indicating further genomic evolution of the tumor after initial development from the field.
Different origins of these mutated cells have been proposed [21]. These include intraepithelial migration and/or luminal seeding of carcinoma cells from existing tumors followed by implantation of the carcinoma cells. Another theory is that the field develops before the tumor from an altered stem cell leading to a population of mutated daughter cells forming a transformed field [20, 21]. Our analysis showed that mutations were present at low frequencies in the normal appearing samples. Few tumor cells present in the normal epithelial cells originating from seeding/migration could explain the low frequencies observed but they cannot explain the presence of mutations unique for the normal samples. Another possible explanation for the presence of unique mutations in normal samples is that these unique mutations originate from a non-tumor transformed field intermixed with normal cells and the tumor field. These different mutated cell lineages can arise if two or more self-renewing cells (e.g. stem cells) accumulate mutations independently and expand in parallel, creating multiple transformed fields [2, 23, 31]. Presence of low frequencies normal-specific mutations could also be explained by spontaneous mutations in single epithelial cells. It is however extremely unlikely as mutations have been called using at least three consensus reads with different UMIs, i.e. 3 different molecules or cells. Furthermore, it is highly unlikely to observe multiple cells with the same spontaneous mutation or many single cells having gene amplification of mutated genes.
Fig.4
Validation of mutations. (a) All mutations were evaluated in previously generated WES data from tumors, recurrences, and metastases from the four patients (patients 1 and 2 shown, patients 3 and 4 in Supplementary Fig. S4). Obtained VAFs are marked (yellow to red ranging from >0 to 0.6). For WES data, at least five reads at a given position were required for validation (indicated in grey). Dark blue indicates no alternate alleles on the position. LN = lymph node. Targ. seq. = Targeted sequencing. (b) VAFs obtained by cancer panel sequencing of tumor compared to mean VAFs from WES on tumor samples from all four patients. Recurrences and metastases were excluded from calculation of the mean as these samples were not included in the tumor pools. Spearman correlation was calculated. (c) Validation of previously identified tumor mutations [2] by ddPCR on DNA from normal samples. Multiple assays for specific mutations were included for the four patients and the fraction of mutated sequences identified using ddPCR is shown (%). * indicates that the value is out of scale (max value = 14.8%). (d) Validation of absence of N-Mutations in DNA from tumor samples by ddPCR analysis. A positive control (synthesized oligo) for each assay was included as well as negative controls (H2O and HT1197 bladder cancer cell line). The purple line indicates cutoff set for positive droplets. Droplets positive for mutation are marked in blue and negative droplets are indicated by grey.
![Validation of mutations. (a) All mutations were evaluated in previously generated WES data from tumors, recurrences, and metastases from the four patients (patients 1 and 2 shown, patients 3 and 4 in Supplementary Fig. S4). Obtained VAFs are marked (yellow to red ranging from >0 to 0.6). For WES data, at least five reads at a given position were required for validation (indicated in grey). Dark blue indicates no alternate alleles on the position. LN = lymph node. Targ. seq. = Targeted sequencing. (b) VAFs obtained by cancer panel sequencing of tumor compared to mean VAFs from WES on tumor samples from all four patients. Recurrences and metastases were excluded from calculation of the mean as these samples were not included in the tumor pools. Spearman correlation was calculated. (c) Validation of previously identified tumor mutations [2] by ddPCR on DNA from normal samples. Multiple assays for specific mutations were included for the four patients and the fraction of mutated sequences identified using ddPCR is shown (%). * indicates that the value is out of scale (max value = 14.8%). (d) Validation of absence of N-Mutations in DNA from tumor samples by ddPCR analysis. A positive control (synthesized oligo) for each assay was included as well as negative controls (H2O and HT1197 bladder cancer cell line). The purple line indicates cutoff set for positive droplets. Droplets positive for mutation are marked in blue and negative droplets are indicated by grey.](https://content.iospress.com:443/media/blc/2020/6-3/blc-6-3-blc200282/blc-6-blc200282-g004.jpg)
Fig.5
Analysis of mutational context. All analyses were performed on the combined set of mutations from all patients. The total number of mutations in each category is indicated. (a) The six single-base substitutions counted among N-, T-, and S-Mutations. (d) Number of C > G and C > T mutations among N-, T-, and S-Mutations in APOBEC context.
If recurrent tumors develop from fields that arose from the same mutated stem cell, these will be clonally related [2]. This could hence explain the clonal origin of metachronous bladder tumors [1] as well as paired upper tract and bladder urothelial tumors [32].
Increasing evidence supports the theory of mutations being present in normal tissue. Two studies from Martincorena et al. [11, 13] have revealed the presence of non-tumor specific mutations in normal tissue from esophagus and skin, respectively. Similar results have been reported for both liver [33], colon [34], and B lymphocytes [35]. These results indicate that normal cells harbor mutations without necessarily developing into a tumor. In B-lymphocytes, the number of mutations was shown to increase with age in healthy individuals, which may explain the increasing risk of cancer as age increases [35]. To our knowledge, no previously published studies on BC have focused on mutations in normal appearing bladder tissue without being restricted to mutations observed in the tumor. Heide et al. [36] performed multiregional WES on samples from whole cystectomies and detected mutations in normal samples as well and characterized early disease drivers. However, in this work no driver mutations specific for normal appearing urothelium were reported, though alterations related to mutational signatures S1 and S5 were identified in normal urothelium from one patient. Our study was performed using normal appearing urothelium for non-tumor guided detection of mutations by deep-targeting approaches. Additionally, in this study, we included UMIs [25] in the sequencing and applied a stringent threshold in order to differentiate low frequency mutations from sequencing errors.
We observed that the expected impact of N-, S- and T-Mutations was the same across all three groups, though, we would have expected S-Mutations and T-Mutations to have a higher impact than N-Mutations, as these two groups drive initial tumor formation and later tumor evolution. In the Martincorena et al studies, high impact mutations, missense mutations, and cancer driver mutations were also observed in normal tissue from non-cancerous individuals [11, 13]. Consequently, these findings may imply that tumor formation is more dependent on the affected genes, combination of genes, and the order in which mutations occur [37]. Additionally, from our analysis it is not possible to know how many mutations are present in the individual cell, and future studies utilizing single cell sequencing are needed to delineate the genomic changes per cell. In order to characterize the role of S-mutations in the development of multifocal and unifocal bladder tumors, a higher number of bladder tumors and adjacent normal tissue must be analyzed. Furthermore, additional analyses of tumors and healthy bladders should be included in order to investigate the role and importance of N-mutations for BC development and the presence of N-mutations in healthy individuals. In addition, it should be noted that confounding factors such as number of patients and samples and uniformity of read depth may impact on the observed differences between samples.
We observed that mutations in APOBEC context were mainly present in the T-Mutation group. Furthermore, most of the non-APOBEC related C > T mutations observed in the normal samples were found in a CpG context (7/11) and may hence be related to the age related signature 1, in accordance with the fact that mutations accumulate in normal cells over time [38].
As stated previously, results from our and other studies have shown that mutations do indeed occur in normal cells without leading to cancer. We hypothesize that field cancerization may have prognostic and predictive value, though it is necessary to delineate which mutations will actually lead to cancer development. Field cancerization may affect screening initiatives for early detection of cancer using e.g. analysis of mutated DNA in urine and plasma. Detection of high impact mutations might not imply that patients have cancer. A recent study detected mutations in cfDNA from individuals without cancer, documenting the need for using tumor guided approaches [39].
In conclusion, this study sheds light on the field cancerization in BC, and documents that non-tumor specific mutations are present in normal appearing tissue. A limitation to this study is that biological samples from only four patients were analyzed. It will be necessary to analyze tissue from additional patients to be able to better describe the field cancerization and its role in tumor development, disease recurrence and aggressiveness, and e.g. BCG treatment efficacy. Moreover, novel methods for single cell analysis may be powerful supplements to better understand the biology of field cancerization.
Patients and methods
Clinical samples
Patients included in the study were diagnosed with primary BC and underwent open radical cystectomy and extended lymph node dissection to the aortic bifurcation. The patients had not received neoadjuvant chemotherapy or radiation therapy before cystectomy. Tissue biopsies were embedded in TissueTek OCTtrademark Compound (Sakura, Finetek, Vaerloese, Denmark), snap-frozen in liquid nitrogen and stored at – 80°C. Two to seven biopsies were obtained from tumors from each patient together with six to 12 biopsies taken throughout the normal appearing urothelium. Blood samples were stored in EDTA tubes at – 80°C. Areas of tumor and normal urothelium were LMD for all patients to ensure cell content specificity of the samples. Precise LMD procurement of tissue minimized the risk that normal samples contained malignant cells. Images of the locations of normal and tumor samples from cystectomies are provided in [2]. LMD and DNA extraction from bulk and LMD samples and blood samples were performed as described previously [2]. Patients were treated at Aarhus University Hospital in 2014 and provided informed written consent. The study was approved by The Danish National Committees on Health Research Ethics (#1300174). All methods in the study were carried out in accordance with the approved guidelines and regulations.
Targeted sequencing and data processing
Targeted sequencing was performed on pools of normal samples and pools of tumor samples using the NuGEN Ovation® Cancer Panel 2.0 Target Enrichment System (509 genes; NuGEN Technologies) [40]. DNA from normal samples and tumor samples from each patient was pooled prior to library generation in order to obtain enough input material. Tumor pools for all patients consisted of 1 : 1 amounts of bulk tumor DNA. Normal pools consisted of varying amounts of DNA from the different normal cell samples due to limitations in sample amounts. Libraries were prepared from 500 ng DNA (Qubit), as previously described [25]. Libraries were amplified using 21 PCR cycles and subsequently pooled eight at a time and single-end sequenced (150 bp) on an Illumina NextSeq 500 (High output).
Sequencing data was aligned and mapped, as previously described [25]. In brief, reads with identical UMIs and mapping positions were collapsed to create high confidence consensus reads. If less than three reads shared UMIs and mapping positions, they were discarded (Supplementary Fig. S2) as this has been documented to an appropriate number for preserving optimal data yield and ensuring call reliability [24]. All mutations were called using MuTect2 with default parameters. No additional filters were applied as mutation calls are inherently robust when the MuTect2 pipeline is applied to UMI-read collapsed sequencing data. In order to rule out any evidence of a possible contamination from the tumor tissue to the normal tissue and vice-versa, all called mutations in only one pool (normal or tumor) were assessed using bam-readcount in the other pool from the same patient. Mutation locations where we observed an alternate allele in the other pool were put in the S-mutation group. Next, mutations with alternate alleles observed in more than one read in any previously generated WES tumor data from the same patients (not UMI corrected) [1, 2] were discarded (see Supp. Figure S3). In addition, a total of 102– 190 mutations were discarded based on high positional error-rates either based on IGV inspection, due to presence of 3rd or 4th bases, or due to non concordance in base changes between tumor and normal samples for S-Mutations to ensure only reliable mutations were considered (see Supp. Figure S3).
Mean TMB was calculated from the total number of S- and T-Mutations from the four patients. The NuGEN Ovation® Cancer Panel 2.0 covers app. 2.64 Mb. Mean TMB for bladder tumors in the study by Zehir et al [28] was calculated from the mean number of single nucleotide variants (SNVs) per patient. We estimated the MSK-Impact panel to cover app. 1.36 Mb.
Filtering of mutations
Initially, mutations were categorized in three different sets based on whether they were called (MuTect2) or observed (using pileup tools) only in normal samples (Normal specific mutations - N-Mutations), only in tumor samples (Tumor specific mutations or T-Mutations) or in both pools (Shared mutations or S-Mutations) using the cancer panel sequencing (Supplementary Fig. S3). To ensure normal sample specificity, initial N-Mutations were evaluated in previously generated WES data. Mutations were discarded if present with two or more alternate reads in any of the corresponding tumor samples.
Any positions with more than two alleles were excluded and all remaining mutations were reviewed manually using the Integrative Genomics Viewer (IGV) [41].
Functional assignment
We identified mutations in known BC driver genes defined in IntOGen (BBGLab)[42] and assigned the functional impact to mutations using snpEff v4.3 and PolyPhen-2 (whenever possible) [29, 43, 44].
Digital Droplet PCR (ddPCR)
For the validation of N-Mutations, an oligo covering the whole mutated amplicon of interest (positive control) was designed due to insufficient sample amounts. ddPCR and data analysis were performed as previously described [45]. Assays targeting regions on chromosome 16 and 3 were used for quantification of total DNA copies as these regions are rarely subject to copy number alterations in BC [46]. DNA from the bladder cancer cell line HT1197 from ATCC was used as a negative control. The cell line tested negative for mycoplasma January 21st 2017 and experiments were conducted following that. The cell line was authenticated using IdentiCell and does not appear in the International Cell Line Authentication Committee (ICLAC) database as commonly misidentified. The cell line was a gift from Dr. Dan Theodorescu. Primer and probe sequences for analyzed alterations are listed in Supplementary Table S3. N-Mutations for ddPCR analysis were selected based on presence in normal samples (targ. seq) with relatively high VAF and high confidence reads and absence tumor samples (targ. seq). S-mutations were chosen from clonal presence in tumor (WES) and normal samples (targ. seq) (FGFR3, PIK3CA, STAG2, PFKP, and CDH11) or due to presence in tumor samples and availability of assays (RBM10, C11orf70, and CDKN1A).
Statistical analysis
The Shapiro-Wilk test or Quantile-Quantile plot (QQ-plot) was used to test for normality of the data. Statistical analyses were performed using unpaired t-test on log-transformed parametric data with Welch correction for data with significantly different standard deviations. For categorical variables, Fisher’s Exact test was used. Correlation was calculated using Spearman. Statistical significance was set at p < 0.05. All statistical analyses were performed using R (R version 3.5.1).
DATA AVAILABILITY
The raw sequencing datasets generated during the current study are not publicly available due to local Danish legislation on data sharing. However, processed datasets are available from the corresponding author on reasonable request.
ACKNOWLEDGMENTS
The authors have no acknowledgments.
FUNDING
This work was funded by the Danish Cancer Research Foundation, the Danish Cancer Society, and the Danish Cancer Biobank (grant numbers are not applicable).
AUTHOR CONTRIBUTIONS
M.B.H.T. and J.B.J. collected patient material. T.S. performed clinical follow up. M.B.H.T. performed LMD experiments and DNA-extraction. T.S. and I.N. performed experimental work. T.S., E.C., and P.L. performed bioinformatic analyses. L.D., I.N., P.L., and T.S. designed the study and interpreted data. T.S. drafted the manuscript with input from all authors.
CONFLICT OF INTEREST
L.D. has sponsored research agreements with Natera and Ferring, and has an advisory/consulting role at Ferring. J.B.J. is proctor for Intuitive Surgery, member of advisory board for Olympus Europe, Cephaid and Ferring, and has sponsored research agreements with Medac, Photocure ASA, Cephaid and Ferring.
SUPPLEMENTARY MATERIAL
[1] Included in this document are the following supplementary materials:
Supplementary Fig. S1: Disease courses of the four patients.
Supplementary Fig. S2: UMI-based read collapsing.
Supplementary Fig. S3: Filtering of mutations.
Supplementary Fig. S4: Comparison of variant allele fractions obtained from the sequencing of normal and tumor samples using cancer panel targeted sequencing and from WES of tumor samples and recurrences from patients 3 and 4.
Supplementary Table S1: Clinical and pathological information.
Supplementary Table S2: Overview of samples, cancer panel targeted sequencing, and WES
Supplementary Table S3: Primers and probes for ddPCR analyses
Primer sequences for detection of tumor mutations in normal samples by ddPCR
The supplementary material is available in the electronic version of this article: https://dx.doi.org/10.3233/BLC-200282.
REFERENCES
[1] | Lamy P , Nordentoft I , Birkenkamp-Demtröder K , et al. Paired Exome Analysis Reveals Clonal Evolution and Potential Therapeutic Targets in Urothelial Carcinoma. Cancer Res (2016) ;76: :5894–906. |
[2] | Thomsen MBH , Nordentoft I , Lamy P , et al. Comprehensive multiregional analysis of molecular heterogeneity in bladder cancer. Sci Rep (2017) ;7: :11702. |
[3] | Nordentoft I , Lamy P , Birkenkamp-Demtröder K , et al. Mutational context and diverse clonal development in early and late bladder cancer. Cell Rep (2014) ;7: :1649–63. |
[4] | Chaturvedi V , Li L , Hodges S , et al. Superimposed histologic and genetic mapping of chromosome 17 alterations in human urinary bladder neoplasia. Oncogene (1997) ;14: :2059–70. |
[5] | Czerniak B , Chaturvedi V , Li L , et al. Superimposed histologic and genetic mapping of chromosome 9 in progression of human urinary bladder neoplasia: implications for a genetic model of multistep urothelial carcinogenesis and early detection of urinary bladder cancer. Oncogene (1999) ;18: :1185–96. |
[6] | Czerniak B , Li L , Chaturvedi V , et al. Genetic modeling of human urinary bladder carcinogenesis. Genes Chromosomes Cancer (2000) ;27: :392–402. |
[7] | Kram A , Li L , Zhang RD , et al. Mapping and genome sequence analysis of chromosome 5 regions involved in bladder cancer progression. Lab Invest (2001) ;81: :1039–48. |
[8] | Majewski T , Lee S , Jeong J , et al. Understanding the development of human bladder cancer by using a whole-organ genomic mapping strategy. Lab Invest (2008) ;88: :694–721. |
[9] | Yoon DS , Li L , Zhang RD , et al. Genetic mapping and DNA sequence-based analysis of deleted regions on chromosome 16 involved in progression of bladder cancer from occult preneoplastic conditions to invasive disease. Oncogene (2001) ;20: :5005–14. |
[10] | Weaver JMJ , Ross-Innes CS , Shannon N , et al. Ordering of mutations in preinvasive disease stages of esophageal carcinogenesis. Nat Genet (2014) ;46: :837–43. |
[11] | Martincorena I , Roshan A , Gerstung M , et al. Tumor evolution. High burden and pervasive positive selection of somatic mutations in normal human skin. Science (2015) ;348: :880–6. |
[12] | Wood HM , Conway C , Daly C , et al. The clonal relationships between pre-cancer and cancer revealed by ultra-deep sequencing. J Pathol (2015) ;237: :296–306. |
[13] | Martincorena I , Fowler JC , Wabik A , et al. Somatic mutant clones colonize the human esophagus with age. Science. Epub ahead of print 18 October 2018 10.1126/science.aau3879. |
[14] | Ströck V , Holmäng S . A Prospective Study of the Size, Number and Histopathology of New and Recurrent Bladder Tumors. Urology Practice (2015) ;2: :260–4. |
[15] | Sylvester RJ , Oosterlinck W , Holmang S , et al. Systematic Review and Individual Patient Data Meta-analysis of Randomized Trials Comparing a Single Immediate Instillation of Chemotherapy After Transurethral Resection with Transurethral Resection Alone in Patients with Stage pTa-pT1 Urothelial Carcinoma of the Bladder: Which Patients Benefit from the Instillation? Eur Urol (2016) ;69: :231–44. |
[16] | Kamat AM , Ba\u gcıoğlu M , Huri E . What is new in non-muscle-invasive bladder cancer in ? Turk J Urol (2017) ;43: :9–13. |
[17] | Babjuk M , Böhle A , Burger M , et al. EAU Guidelines on Non-Muscle-invasive Urothelial Carcinoma of the Bladder: Update 2016. Eur Urol (2017) ;71: :447–61. |
[18] | Höglund M . Bladder cancer, a two phased disease? Semin Cancer Biol (2007) ;17: :225–32. |
[19] | Slaughter DP , Southwick HW , Smejkal W . ‘Field cancerization’ in oral stratified squamous epithelium. Clinical implications of multicentric origin. Cancer (1953) ;6: :963–8. |
[20] | Curtius K , Wright NA , Graham TA . An evolutionary perspective on field cancerization. Nat Rev Cancer (2018) ;18: :19–32. |
[21] | Braakhuis BJM , Tabor MP , Kummer JA , et al. A genetic explanation of Slaughter’s concept of field cancerization: evidence and clinical implications. Cancer Res (2003) ;63: :1727–30. |
[22] | Harris AL , Neal DE . Bladder cancer–field versus clonal origin. The New England journal of medicine (1992) ;326: :759–61. |
[23] | Höglund M . On the origin of syn- and metachronous urothelial carcinomas. Eur Urol. (2007) ;51: :1185–93. discussion 1193. |
[24] | Kennedy SR , Schmitt MW , Fox EJ , et al. Detecting ultralow-frequency mutations by Duplex Sequencing. Nat Protoc (2014) ;9: :2586–606. |
[25] | Christensen E , Nordentoft I , Vang S , et al. Optimized targeted sequencing of cell-free plasma DNA from bladder cancer patients. Sci Rep (2018) ;8: :1917. |
[26] | Cancer Genome Atlas Research Network.Comprehensive molecular characterization of urothelial bladder carcinoma. Nature (2014) ;507: :315–22. |
[27] | Robertson AG , Kim J , Al-Ahmadie H , et al. Comprehensive Molecular Characterization of Muscle-Invasive Bladder Cancer. Cell (2017) ;171: :540–556.e25. |
[28] | Zehir A , Benayed R , Shah RH , et al. Mutational landscape of metastatic cancer revealed from prospective clinical sequencing of 10,000 patients. Nat Med (2017) ;23: :703–13. |
[29] | Adzhubei IA , Schmidt S , Peshkin L , et alA method and server for predicting damaging missense mutations. Nature Methods (2010) ;7: :248–9. |
[30] | Roberts SA , Lawrence MS , Klimczak LJ , et al. An APOBEC cytidine deaminase mutagenesis pattern is widespread in human cancers. Nat Genet (2013) ;45: :970–6. |
[31] | Pardal R , Clarke MF , Morrison SJ . Applying the principles of stem-cell biology to cancer. Nat Rev Cancer (2003) ;3: :895–902. |
[32] | Audenet F , Isharwal S , Cha EK , et al. Clonal Relatedness and Mutational Differences between Upper Tract and Bladder Urothelial Carcinoma. Clin Cancer Res. Epub ahead of print 23 October 2018 10.1158/1078-0432.CCR-18-2039. |
[33] | Brunner SF , Roberts ND , Wylie LA , et al. Somatic mutations and clonal dynamics in healthy and cirrhotic human liver. Nature (2019) ;574: :538–42. |
[34] | Lee-Six H , Olafsson S , Ellis P , et al. The landscape of somatic mutation in normal colorectal epithelial cells. Nature (2019) ;574: :532–7. |
[35] | Zhang L , Dong X , Lee M , et alSingle-cell whole-genome sequencing reveals the functional landscape of somatic mutations in B lymphocytes across the human lifespan. Proc Natl Acad Sci U S A (2019) ;116: :9014–9. |
[36] | Heide T , Maurer A , Eipel M , et al. Multiregion human bladder cancer sequencing reveals tumour evolution, bladder cancer phenotypes and implications for targeted therapy. J Pathol (2019) ;248: :230–42. |
[37] | Levine AJ , Jenkins NA , Copeland NG . The Roles of Initiating Truncal Mutations in Human Cancers: The Order of Mutations and Tumor Cell Type Matters. Cancer Cell (2019) ;35: :10–15. |
[38] | Alexandrov LB , Nik-Zainal S , Wedge DC , et al. Signatures of mutational processes in human cancer. Nature (2013) ;500: :415–21. |
[39] | Phallen J , Sausen M , Adleff V , et al. Direct detection of early-stage cancers using circulating tumor DNA. Sci Transl Med; 9. Epub ahead of print 16 August 2017 10.1126/scitranslmed.aan2415. |
[40] | Li H , Durbin R . Fast and accurate short read alignment with Burrows-Wheeler transform. Bioinformatics (2009) ;25: :1754–60. |
[41] | Robinson JT , Thorvaldsdóttir H , Wenger AM , et al. Variant Review with the Integrative Genomics Viewer. Cancer Res (2017) ;77: :e31–e34. |
[42] | Gonzalez-Perez A , Perez-Llamas C , Deu-Pons J , et al. IntOGen-mutations identifies cancer drivers across tumor types. Nat Methods (2013) ;10: :1081–2. |
[43] | Schepeler T , Lamy P , Hvidberg V , et al. A high resolution genomic portrait of bladder cancer: correlation between genomic aberrations and the DNA damage response. Oncogene (2013) ;32: :3577–86. |
[44] | Cingolani P , Platts A , Wang LL , et al. A program for annotating and predicting the effects of single nucleotide polymorphisms, SnpEff: SNPs in the genome of Drosophila melanogaster strain w1118; iso-2; iso-3. Fly (2012) ;6: :80–92. |
[45] | Birkenkamp-Demtröder K , Christensen E , Nordentoft I , et al. Monitoring Treatment Response and Metastatic Relapse in Advanced Bladder Cancer by Liquid Biopsy Analysis. Eur Urol (2018) ;73: :535–40. |
[46] | Schepeler T , Lamy P , Hvidberg V , et al. A high resolution genomic portrait of bladder cancer: correlation between genomic aberrations and the DNA damage response. Oncogene (2013) ;32: :3577–86. |


