
Non-Coding Mutations in Urothelial Bladder Cancer: Biological and Clinical Relevance and Potential Utility as Biomarkers
Abstract
BACKGROUND & OBJECTIVE:
Whole genome sequencing has identified recurrent non-coding mutations that may be important in carcinogenesis. We investigate the frequency of 5 such non-coding mutation hotspots in urothelial bladder cancers (UBCs) and assess their potential for UBC detection and prognostication.
METHODS:
DNA extracted from 302 UBCs was subjected to targeted next generation sequencing of non-coding mutation hotspots in GPR126, PLEKHS1, TBC1D12, LEPROTL1 and WDR74. The frequency of mutations, and associations with stage, grade, age, gender, smoking status, clinical outcomes, mutation signatures and gene expression were analysed using χ2 tests, logistic regression and Cox proportional hazards models.
RESULTS:
Non-coding mutations were common across all stages and grades of UBC. The frequencies were: GPR126 53.0%, PLEKHS1 38.7%, TBC1D12 25.5%, LEPROTL1 23.8% and WDR74 17.2%. There was an average of 1.6 mutations per UBC, and 74% of UBCs harboured at least one mutation. They frequently co-occur, and commonly accompany an APOBEC mutational signature. The mutations are not strongly associated with clinical parameters and are, most likely, early events in the development of UBC.
CONCLUSIONS:
Mutations at these 5 non-coding hotspots are common in UBC. Due to their high frequency across stages and grades of disease, they should be included in UBC diagnostic biomarker panels.
BACKGROUND
UBC is a common and heterogeneous malignancy [1, 2]. It is considered to develop along one of two routes - a papillary/low-grade pathway characterised by activation of oncogenes and a diploid genome, and a carcinoma in situ (CIS)/high-grade pathway with aneuploidy and a high mutation burden [3]. Gene expression profiling can be used to separate UBCs into up to 6 subtypes [4]; even within these pathways and subtypes, considerable molecular and clinical heterogeneity exists.
UBC is most frequently visually diagnosed by flexible cystoscopy and confirmed by pathological examination of transurethral resection or biopsy specimens. At presentation, 75–80% of cases are non-muscle invasive bladder cancer (NMIBC: stages Ta/T1/Tis) [5], currently classed as being at low-, intermediate- or high-risk of recurrence and/or progression to muscle-invasive bladder cancer (MIBC: stages T2+) based on stage, grade, size, multiplicity, concurrent CIS and prior recurrence rate [6]. NMIBC patients are subject to long-term surveillance by flexible cystoscopy, which is both uncomfortable for patients and expensive for healthcare providers.
Detection of UBC-related genomic alterations in urine could enable non-invasive testing for UBC. We, and others, have been investigating targeted deep-sequencing of somatic mutations to develop such a test [7–10]. Ideally one would target the minimum number of mutations to maximise read depth, reduce sequencing costs, and avoid false positive results. Coding mutations are common in many genes such as FGFR3, PIK3CA, KDM6A, STAG2 and TP53 (present in 20–50% of UBCs) [2, 10]. However, more frequently mutated than any of these genes is the TERT promoter [11–14]. TERT encodes the catalytic subunit of the telomerase complex which is upregulated in the majority of cancers and is essential for telomere maintenance and overcoming senescence [15]. Mutations in the TERT promoter at chr5:1,295,228 and chr5:1,295,250 (hg19), 124 and 146 bp upstream of the transcription start site, generate consensus binding motifs for ETS transcription factors, increasing TERT expression and activity, and are associated with worse prognosis in UBC patients [16, 17].
Recurrent mutations in other non-coding regions have recently been identified in analyses of whole genome sequencing (WGS) data. Weinhold et al. identified non-coding variants in PLEKHS1 and WDR74 in addition to the TERT promoter [18]. WGS analyses have also identified non-coding variants in TBC1D12, LEPROTL1 and GPR126 [19, 20]. In a WGS study of 65 UBCs, Wu et al confirmed the presence of recurrent non-coding mutations in GPR126, PLEKHS1, TBC1D12, WDR74 and LEPROTL1, and went on to validate GPR126 mutations in a further 196 UBCs [21]. Non-coding mutations in GPR126 have also been investigated in a cohort of 103 UBCs [22], and non-coding mutations in PLEKHS1 in a separate cohort of 81 UBCs [7]. These studies suggest that these mutations may be suitable for inclusion in a UBC detection test due to their frequency and occurrence at discrete hotspots.
In this study we use targeted deep-sequencing to analyse non-coding regions in GPR126, PLEKHS1, TBC1D12, LEPROTL1 and WDR74 in tumours from 302 UBC patients. These regions were selected on the basis of published reports, albeit in a limited number of UBCs in some cases, that they are frequently mutated [18–22]. However, these hotspots/putative hotspots have not been studied in combination in a large cohort of UBC patients. We report the frequencies of these mutations across stages and grades of disease and associations with clinical outcomes. We also analyse the distributions of the mutations relative to one another, relative to mutational signatures, their effects on gene expression and isoform usage, and their potential as biomarkers for UBC.
MATERIALS AND METHODS
Patients and sample processing
Fresh-frozen tumours and whole blood were collected as part of the West Midlands Bladder Cancer Prognosis Programme (BCPP, ethics approval 06/MRE04/65). Patients were recruited consecutively from 2005 to 2011 from ten hospitals in the West Midlands (UK), and gave informed consent for enrolment based upon initial cystoscopic findings suggestive of primary UBC. All patients were newly-diagnosed and treatment-naïve at biospecimen collection, and were subsequently treated and monitored according to contemporary European Association of Urology (EAU) guidelines (including re-resection where indicated). Inclusion and exclusion criteria are detailed elsewhere [23]. Where necessary, tumour grade and stage records were amended according to results of early re-resection or cystectomy. We used the 1973 grade classification as it was in universal use in the UK at the time of patient recruitment, is the basis for the EORTC and EAU NMIBC risk tables, and has comparable utility to the 2004/2016 classification [24]. For quality assurance, 10% of diagnostic formalin-fixedparaffin-embedded tumour samples were retrieved from local histopathology departments and underwent expert pathological review. All included tumours were purely or predominantly urothelial carcinomas. Tissues were collected at transurethral resection (TURBT), snap-frozen, and stored at – 80°C. DNA was extracted from tissues (25 mg) and blood (100μl) using DNeasy Blood and Tissue kits (Qiagen). RNA was extracted from tissues using RNeasy kits (Qiagen). Patient information is shown in Table 1.
Table 1
Patient characteristics
| No. cases | Grade (G1/G2/G3) | Gender (M/F) | Mean age (years) | Smoking (never, ever, current, unknown) | |
| Overall | 302 | 61/73/168 | 237/65 | 70.8 | 49/167/66/20 |
| pTa | 140 | 61/59/20 | 106/34 | 68.8 | 26/74/29/11 |
| pT1 | 88 | 0/14/74 | 79/9 | 71.1 | 14/49/23/2 |
| MIBC | 73 | 0/0/73 | 51/22 | 74.3 | 9/44/13/7 |
302 UBC patients were studied: 229 NMIBC patients (including one patient with solitary CIS) and 73 MIBC patients. According to EAU risk stratification there were 34 LR-NMIBC, 67 IR-NMIBC and 128 HR-NMIBC.
Non-coding mutation sequencing
Amplicon libraries were prepared by multiplex-PCR using the primers shown in Table S1 and 30 cycles of target– specific PCR using Phusion high-fidelity polymerase. Sample specific barcodes were then incorporated in a second 15-cycle PCR. Libraries were pooled, cleaned, mixed with 50% PhiX and sequenced on a NextSeq mid-output flow-cell to a mean depth of 9000x. Reads were aligned to hg19 using bowtie2 version 2.2.6 in local mode. Readcounts for each base at each position were extracted using bam-readcount, with a minimum mapping quality of 20 and a minimum base quality of 30 (-q 20 -b 30). Variant detection was based on non-reference reads ≥2.5% of the total read depth and a minimum of 10 non-reference reads [9]. Recurrent mutations were defined as base substitutions occurring in ≥2 UBCs (≥1 paired blood sample was sequenced for each recurrent mutation to exclude polymorphisms).
Additional sequencing
Sequencing of hotspots in 23 genes had previously been performed for all 302 UBCs in this study [10]. In addition, RNAseq data had been generated for 63 of the UBCs and exome sequencing data for 71 of the UBCs prior to the current investigation (manuscripts in preparation). RNA libraries were prepared using Truseq Stranded Total RNA with Ribo-zero Gold (Illumina) and exome libraries using Nextera Rapid Capture (Illumina). Exome data was quality checked with GATK (Genome Analysis Tool Kit; v.3.6) and aligned to GRCh37 using BWA (v.0.7.15). Somatic SNVs were called from pileup of reads using binomial test comparing the number of mutant and reference reads at the SNV site in the tumour and the germline samples to that in the background of all germline samples. For each somatic SNV the adjacent base upstream and downstream was extracted to obtain the tri-nucleotide context and deconstructSigs (v.1.8.0) used to infer the contribution of each of the 30 COSMIC mutational signatures [25]. RNA-seq data was aligned to GRCh37 and reads counted with STAR aligner (v2.5.2b). Normalisation of read counts and differential expression analysis between wt and mutated samples (controlling for grade, stage and sequencing platform) was performed using DESeq2 (v.1.18.1) in Bioconductor. Gene set enrichment analysis was done using GAGE (v.2.28.2) in Bioconductor with Gene Ontology, KEGG and MSigDB gene set databases. Isoform expression was quantified using Salmon (version 0.12.0 using standard parameters) on Gencode version 29 isoform definitions [26].
Statistical analysis
Mutation frequencies were compared across patient groups using χ2 tests or logistic regression models, where appropriate. The effect of mutated genes on disease-specific survival, overall survival and, for NMIBC, recurrence-free interval was examined using Kaplan-Meier curves and the Cox proportional hazards model.
RESULTS
Mutation hotspots
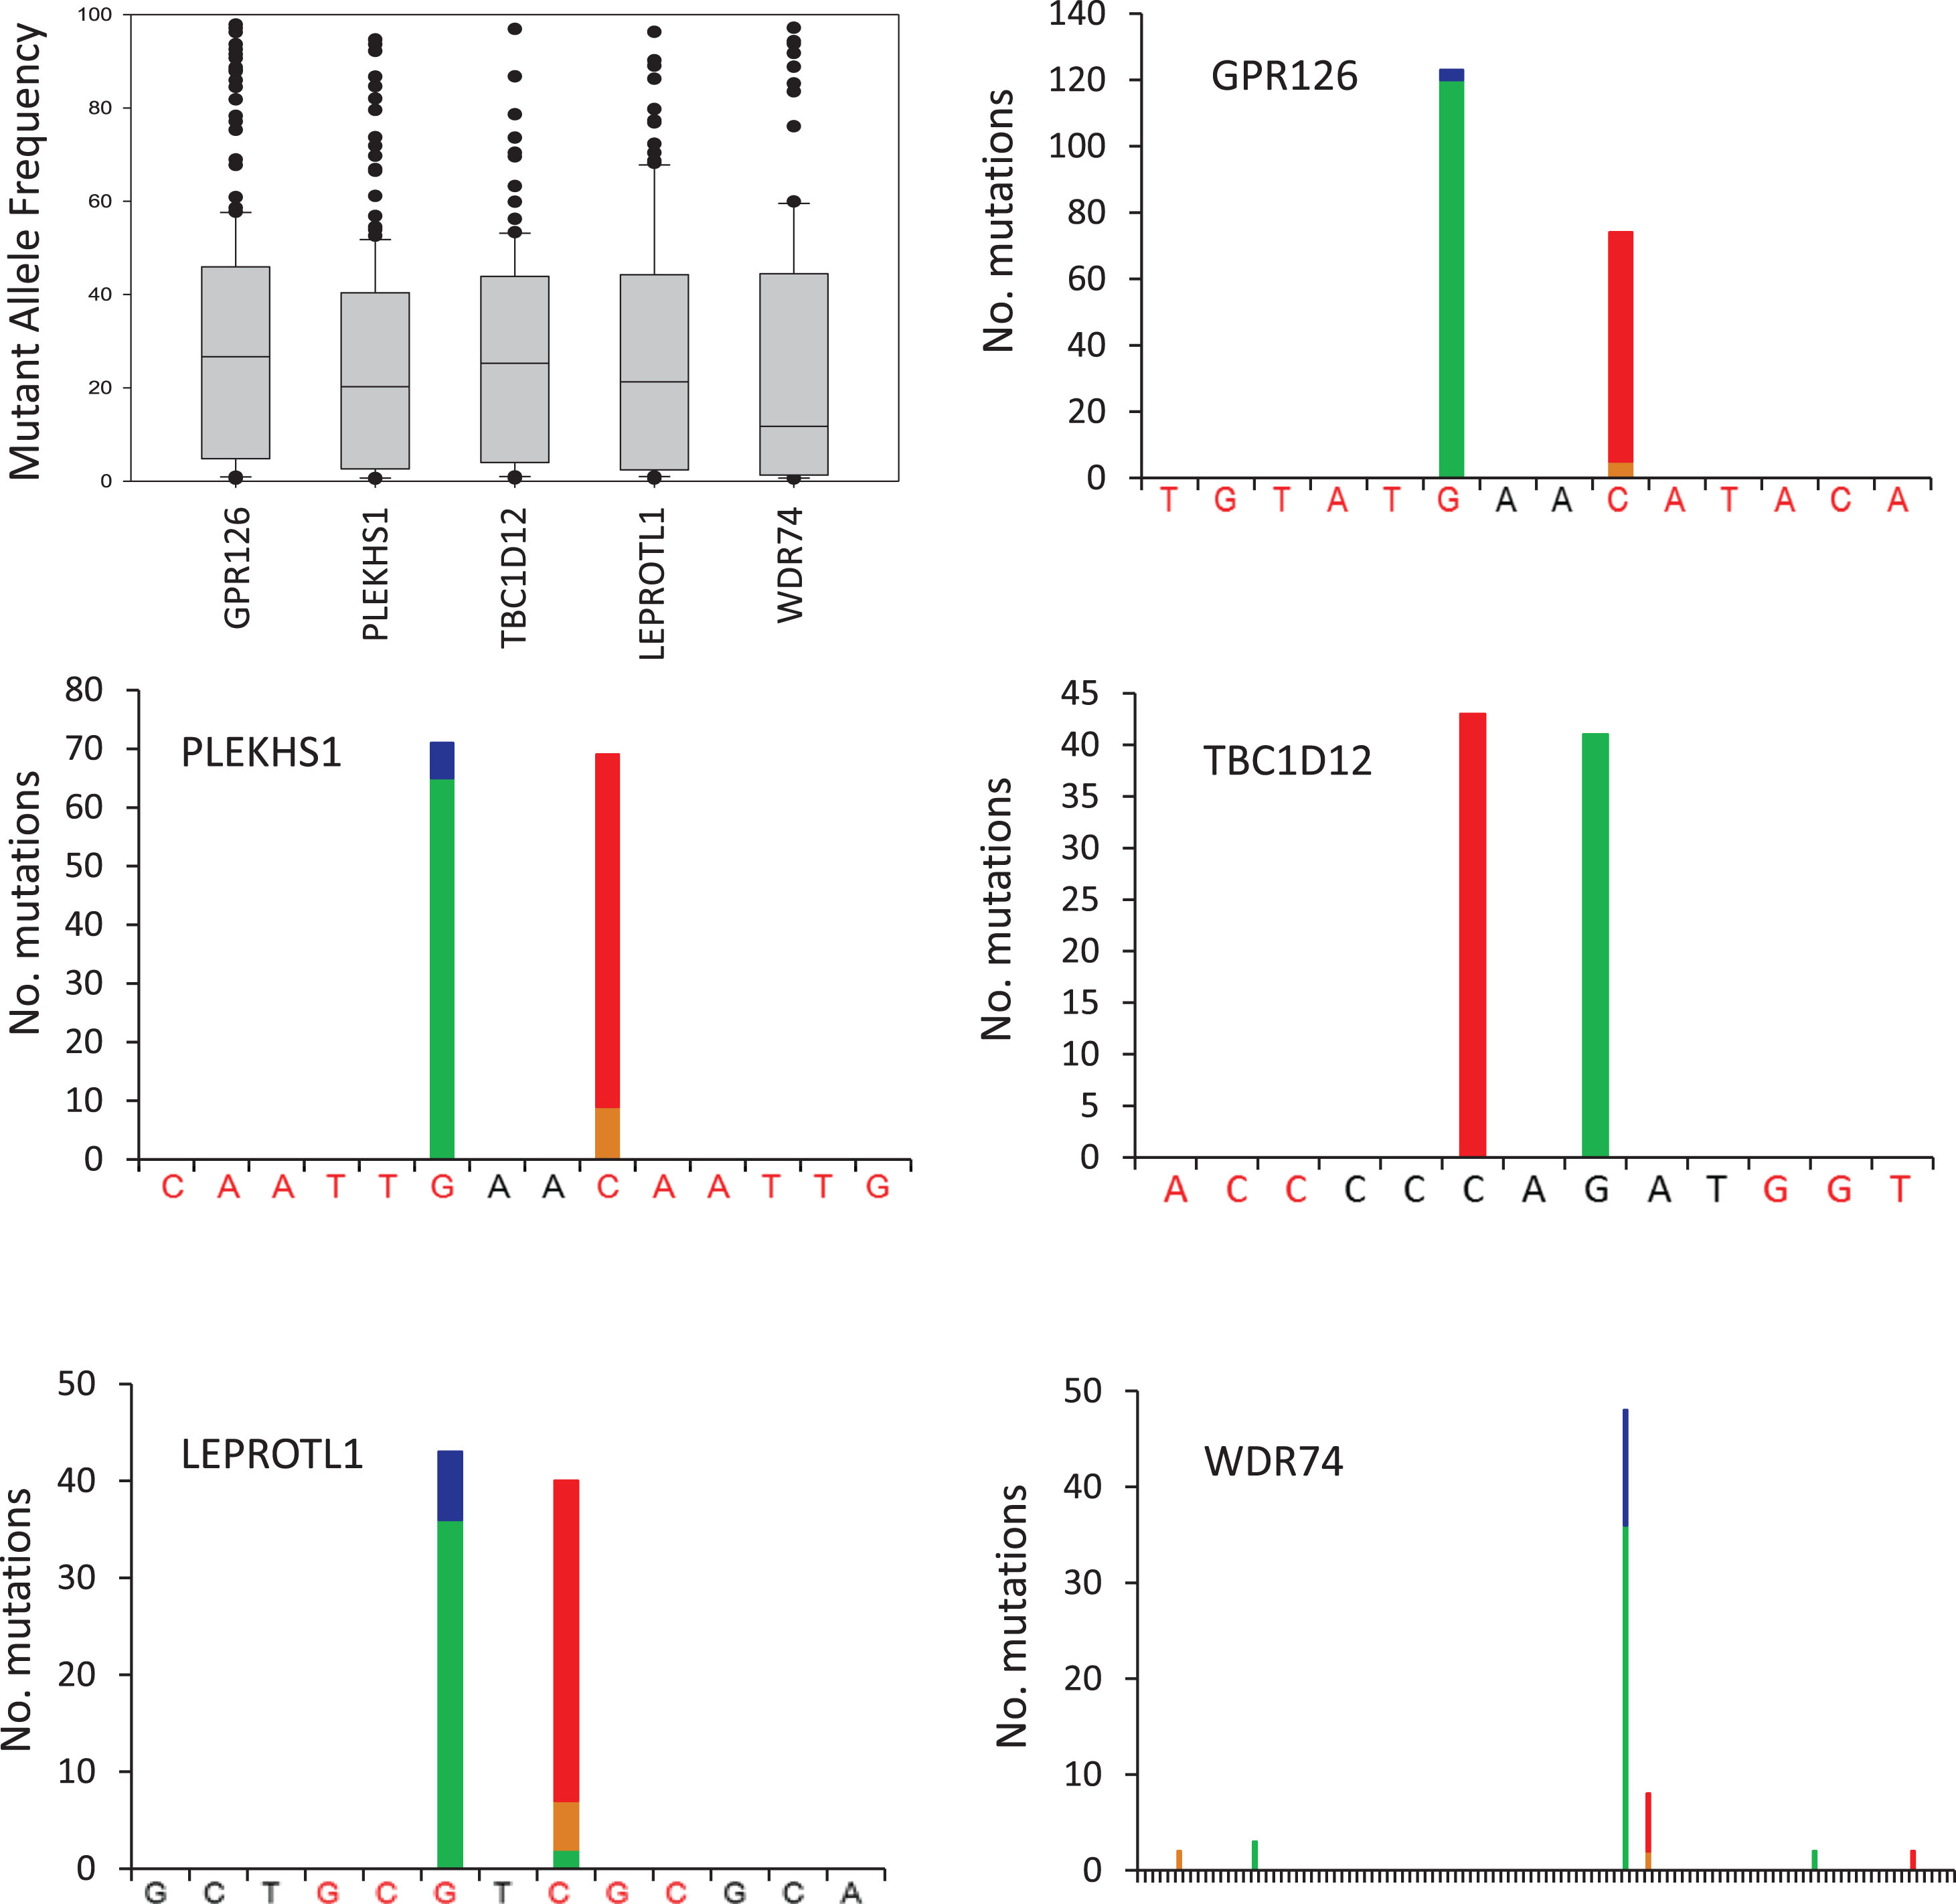
The mutations detected within each amplicon are shown in Fig. 1. The median mutant allele frequencies for GPR126, PLEKHS1, TBC1D12 and LEPROTL1 ranged from 20–27% whilst the median mutant allele frequency was somewhat lower for WDR74 at 12%. These frequencies suggest that the mutations are present in the majorityof cancer cells within each tumour rather than only in minor subclones. GPR126 was the most frequently mutated amplicon with mutations occurring in 53.0% of UBCs, comprised mainly of a G/A substitution at chr6:142706206 (n = 118) or C/T at chr6:142706209 (n = 69) located between exons 6 and 7, as previously reported [22]. PLEKHS1 was mutated in 38.7% of UBCs, with the most common events being G/A at chr10:115511590 (n = 65) and C/T at chr10:115511593 (n = 58) located between exons 1 and 2. TBC1D12 was mutated in 25.5% of UBCs, with C/T at chr10:96162368 and G/A at chr10:96162370 immediately upstream of the start codon with mutations occurring 43 and 41 times respectively. LEPROTL1 was mutated in 23.8% of UBCs, with the most common events being G/A at chr8:29952919 (n = 36) and C/T at chr8:29952921 (n = 33) upstream of the start codon. Mutations in WDR74 were observed in 17.2% of patients and occurred predominantly at chr11:62609254 (34 cases of G/A and 12 cases of G/C) and at chr11:62609257 (6 cases of C/T and 2 cases of C/G), both upstream of the start codon. Thus, the mutation hotspots in these 5 genes are all comprised of 2 discrete sites with 1 or 2 bases in-between and, with the exception of WDR74, both sites exhibiting similar mutation rates. In 82% of mutated amplicons, only one site is mutated (18% doubly mutated). All of the mutation hotspots are flanked by palindromic sequences that might form loop structures (see Fig. 1).
Fig.1
Recurrent non-coding mutations in UBC. The boxplot shows the mutant allele frequencies for all recurrent mutations detected in each gene. The bar charts show the number, type and position of recurrent mutations detected in each gene. Green bar = base change to A, blue = to C, brown = to G, red = to T. Palindromic sequences are highlighted red. The WDR74 plot covers 105 bp. Variants present in a single UBC and polymorphisms were not included in analyses but are shown in Table S2.
Associations with stage, grade, age, gender and smoking
Across the patient cohort, 223 UBCs had ≥1 mutated amplicon (73.8%) with an average of 1.6 mutated amplicons per UBC. All of the hotspots are mutated across all stages and grades of disease (Fig. S1 and Table S3), with ≥1 mutation present in 63.9%, 69.9% and 79.2% of grade 1, 2 and 3 UBCs, respectively. All of the mutations were more common in older patients, although this only reached statistical significance for TBC1D12 and GPR126 (p = <0.01 and 0.02 respectively). All of the mutations were more common in males than females, although this only reached statistical significance for GPR126 and LEPROTL1 (p = 0.018 and 0.033 respectively). None of the mutations were strongly associated with tobacco smoking, although GPR126, PLEKHS1 and TBC1D12 mutation rates were significantly lower in smokers than in ex-smokers or never smokers (Table S3). GPR126 mutations were strongly associated with increasing stage and grade of disease (Fig. S1), and were more frequent in larger and multifocal tumours (Table S3).
Mutations and gene expression
Median levels of expression for the genes in wt and mutant UBCs (n = 71), and in grade 1 and grade 3 UBCs, are shown in Table S4. The expression of GPR126 is lower in GPR126 mutant UBCs (p = 0.047), and substantially lower in grade 3 disease than grade 1 disease (p = 0.005). Although not statistically significant, median PLEKHS1 expression was lower in PLEKHS1 mutant UBCs than in wt UBCs but was significantly higher in grade 3 disease than grade 1 disease (p = 0.041) (Fig. S2). Genome wide analysis did not identify many differentially expressed genes between wt and mutant UBCs but gene set enrichment analysis did detect some altered pathways. The most significantly upregulated pathways included “cell cycle” for LEPROT1 and TBC1D12 mutants, mitochondrial genes were upregulated in GPR126 and WDR74 mutants and “cell adhesion” was downregulated in PLEKHS1 mutants (Supplemental Data). Our RNAseq dataset predominantly comprised NMIBC and we thus opted to use the 117 genes used by Hedegaard et al for NMIBC subtyping [27], to cluster our UBCs (Fig. 2) rather than a subtyping method based on MIBC (e.g. (2)). The mutation frequency was 24% in group 1 (mostly low grade pTa), 37% in group 3 (mostly high grade NMIBC) and significantly higher (50%) in group 2 (high grade pT1 and MIBC) (p < 0.001). We also utilised RNAseq data to investigate if non-coding mutations in any of the genes influence gene isoform expression; however, none of the mutations had an influence (Fig. 3 and S3).
Fig.2
The distribution of recurrent non-coding mutations across expression subtypes. Samples were clustered on the expression of 117 genes as described by Hedegaard et al. [28]. Expression levels are z-scores of regularized log counts, and the samples are clustered with Pheatmap (v.1.0.10) using complete linkage hierarchical clustering and Euclidian distance.
![The distribution of recurrent non-coding mutations across expression subtypes. Samples were clustered on the expression of 117 genes as described by Hedegaard et al. [28]. Expression levels are z-scores of regularized log counts, and the samples are clustered with Pheatmap (v.1.0.10) using complete linkage hierarchical clustering and Euclidian distance.](https://content.iospress.com:443/media/blc/2019/5-4/blc-5-4-blc190251/blc-5-blc190251-g002.jpg)
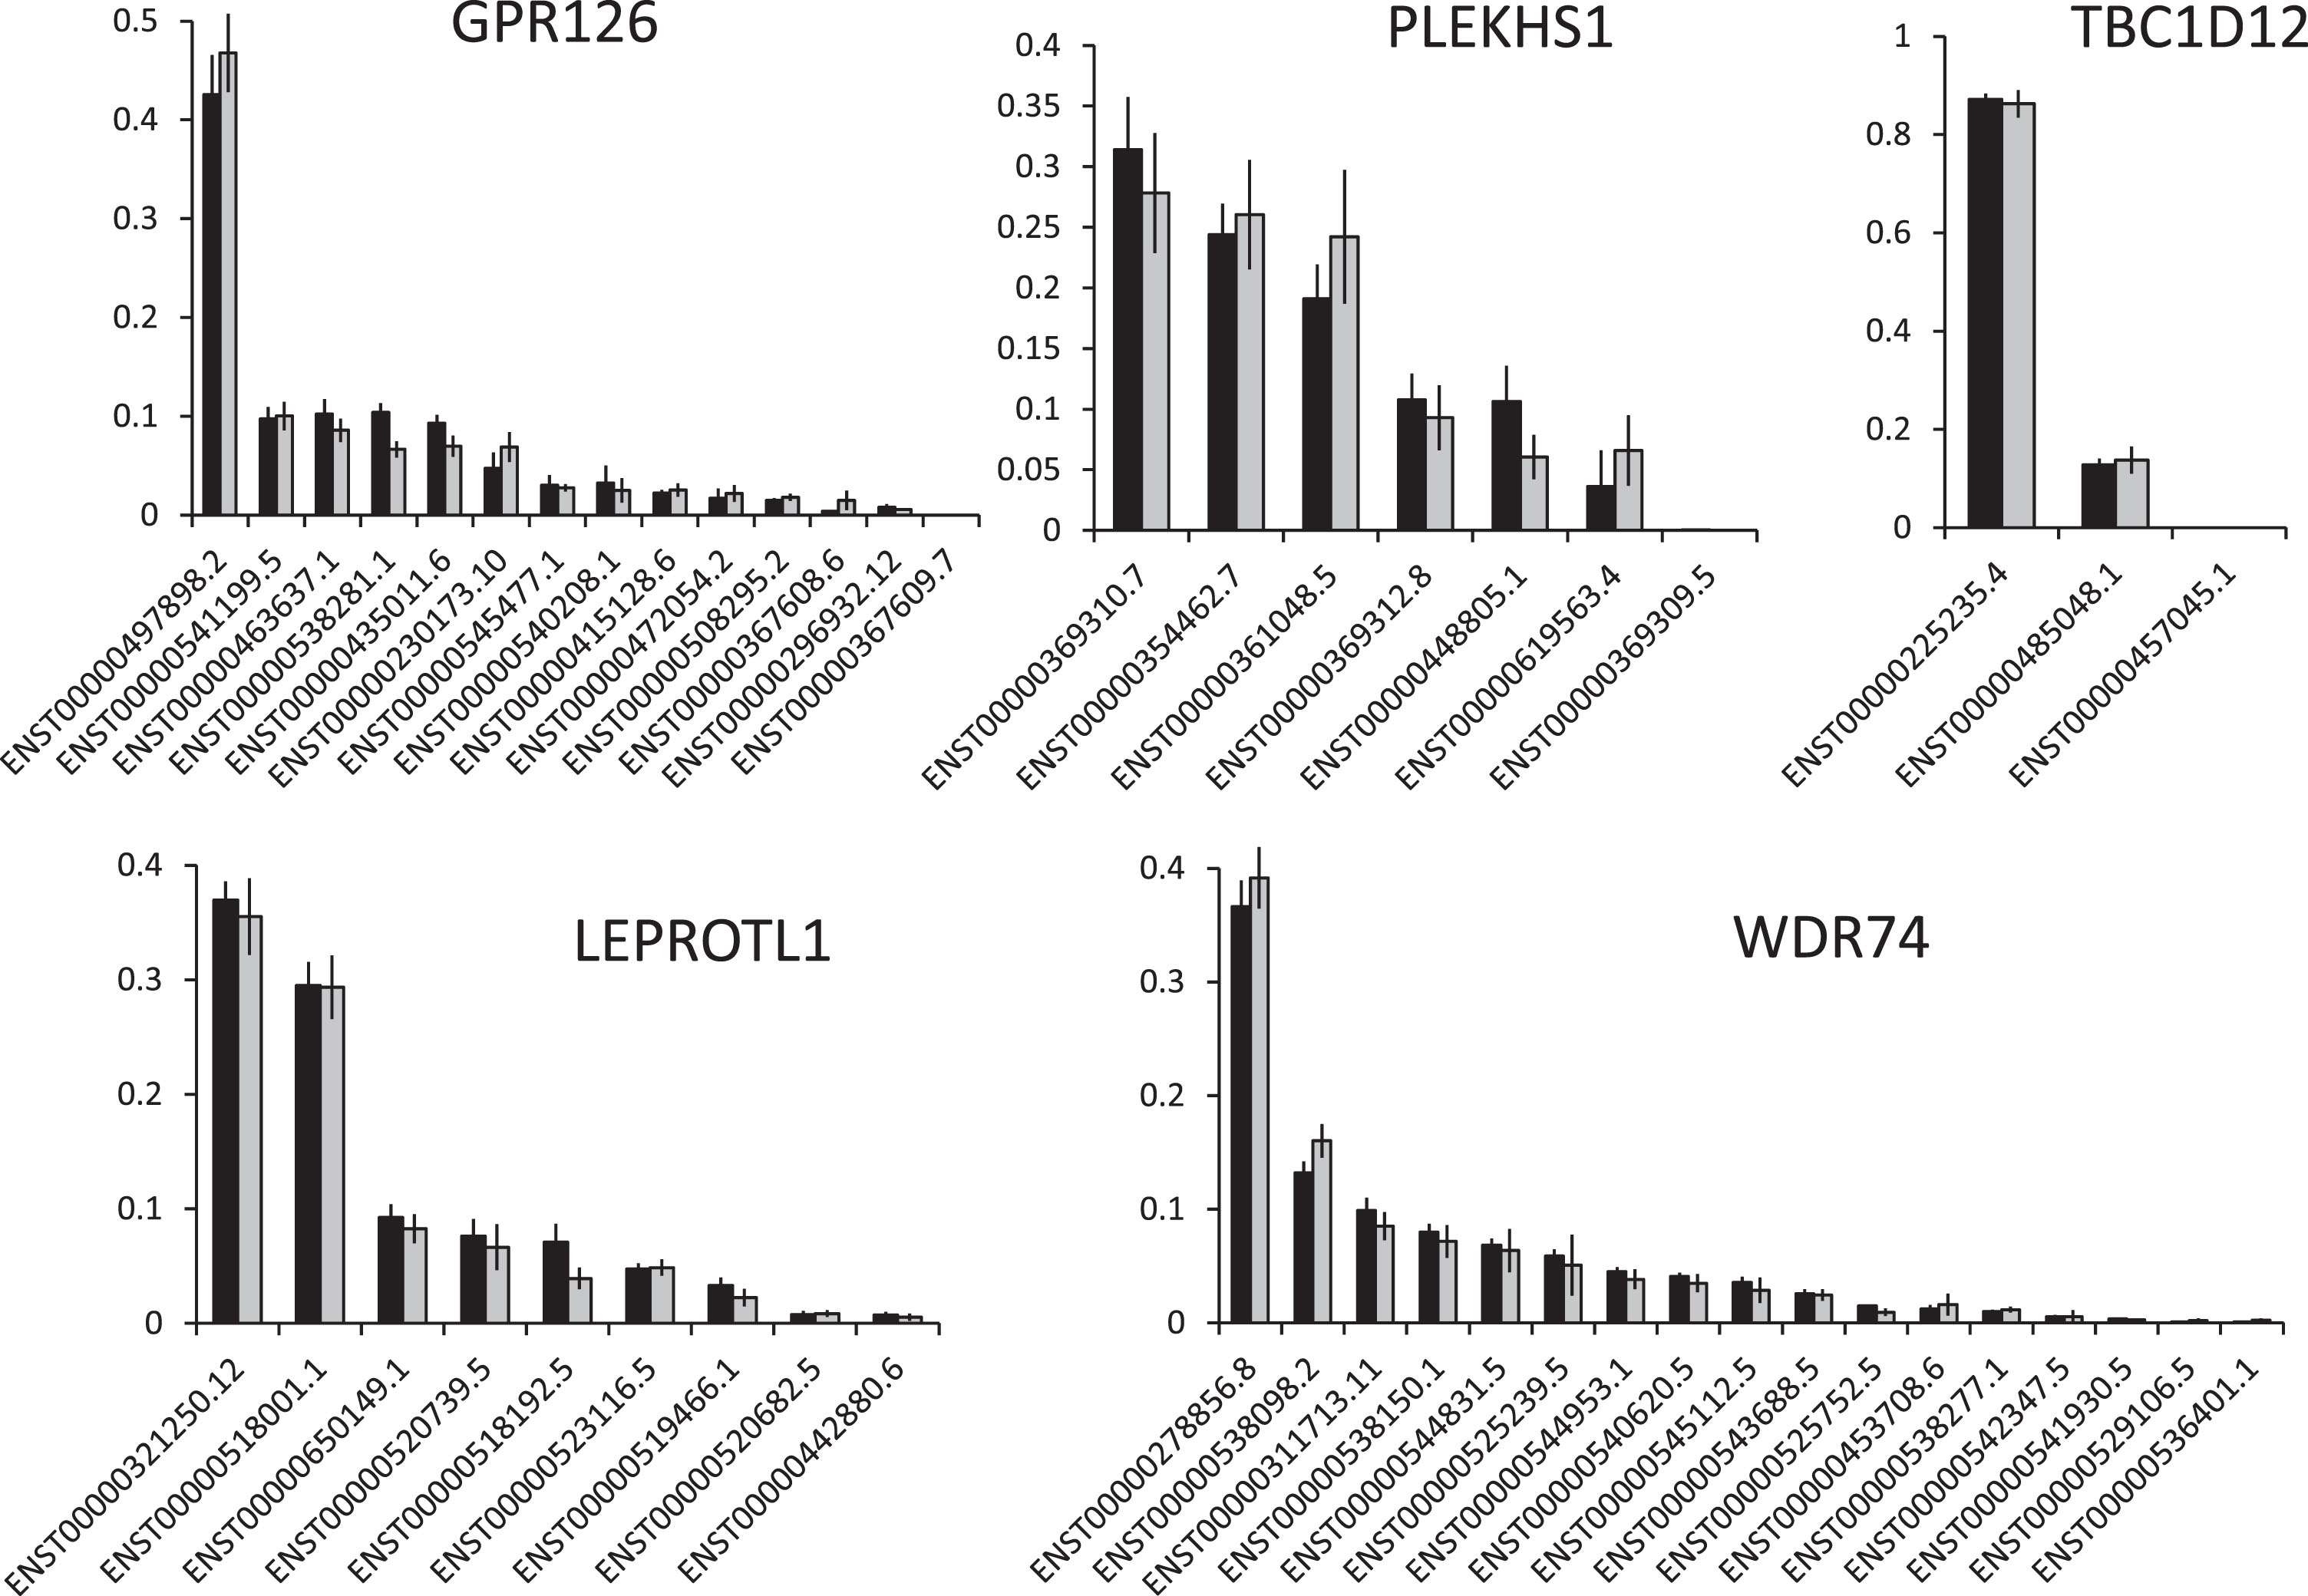
Fig.3
The effects of non-coding mutations on isoform usage. The graphs show the mean (+/– SEM) level of each transcript for each gene as a fraction of all transcripts. Black bars = wt UBCs, grey bars = mutant UBCs.
3.4Non-coding mutations tend to co-occur and are associated with an APOBEC signature
When tested in a pair-wise fashion, mutations in the 5 genes show highly significant co-occurrence (with the exception of WDR74 & LEPROTL1 and WDR74 & TBC1D12). Mutational signatures were calculated for 71 of the UBCs based on exome sequencing data and separate logistic regression models were fitted to determine the effect of the fraction of APOBEC signature on the likelihood of having mutations in the 5 genes (Supplemental Analysis Section 1.2.2). Non-coding mutations in 4 of the genes (GPR126, PLEKHS1, LEPROTL1 and TBC1D12) were strongly associated with APOBEC signatures (p < 0.01, Fig. 4 and Supplemental Section 2.1.2)). Thus, it seems likely that APOBEC activity is the common cause, potentially explaining why these mutations are early and widespread events in UBC.
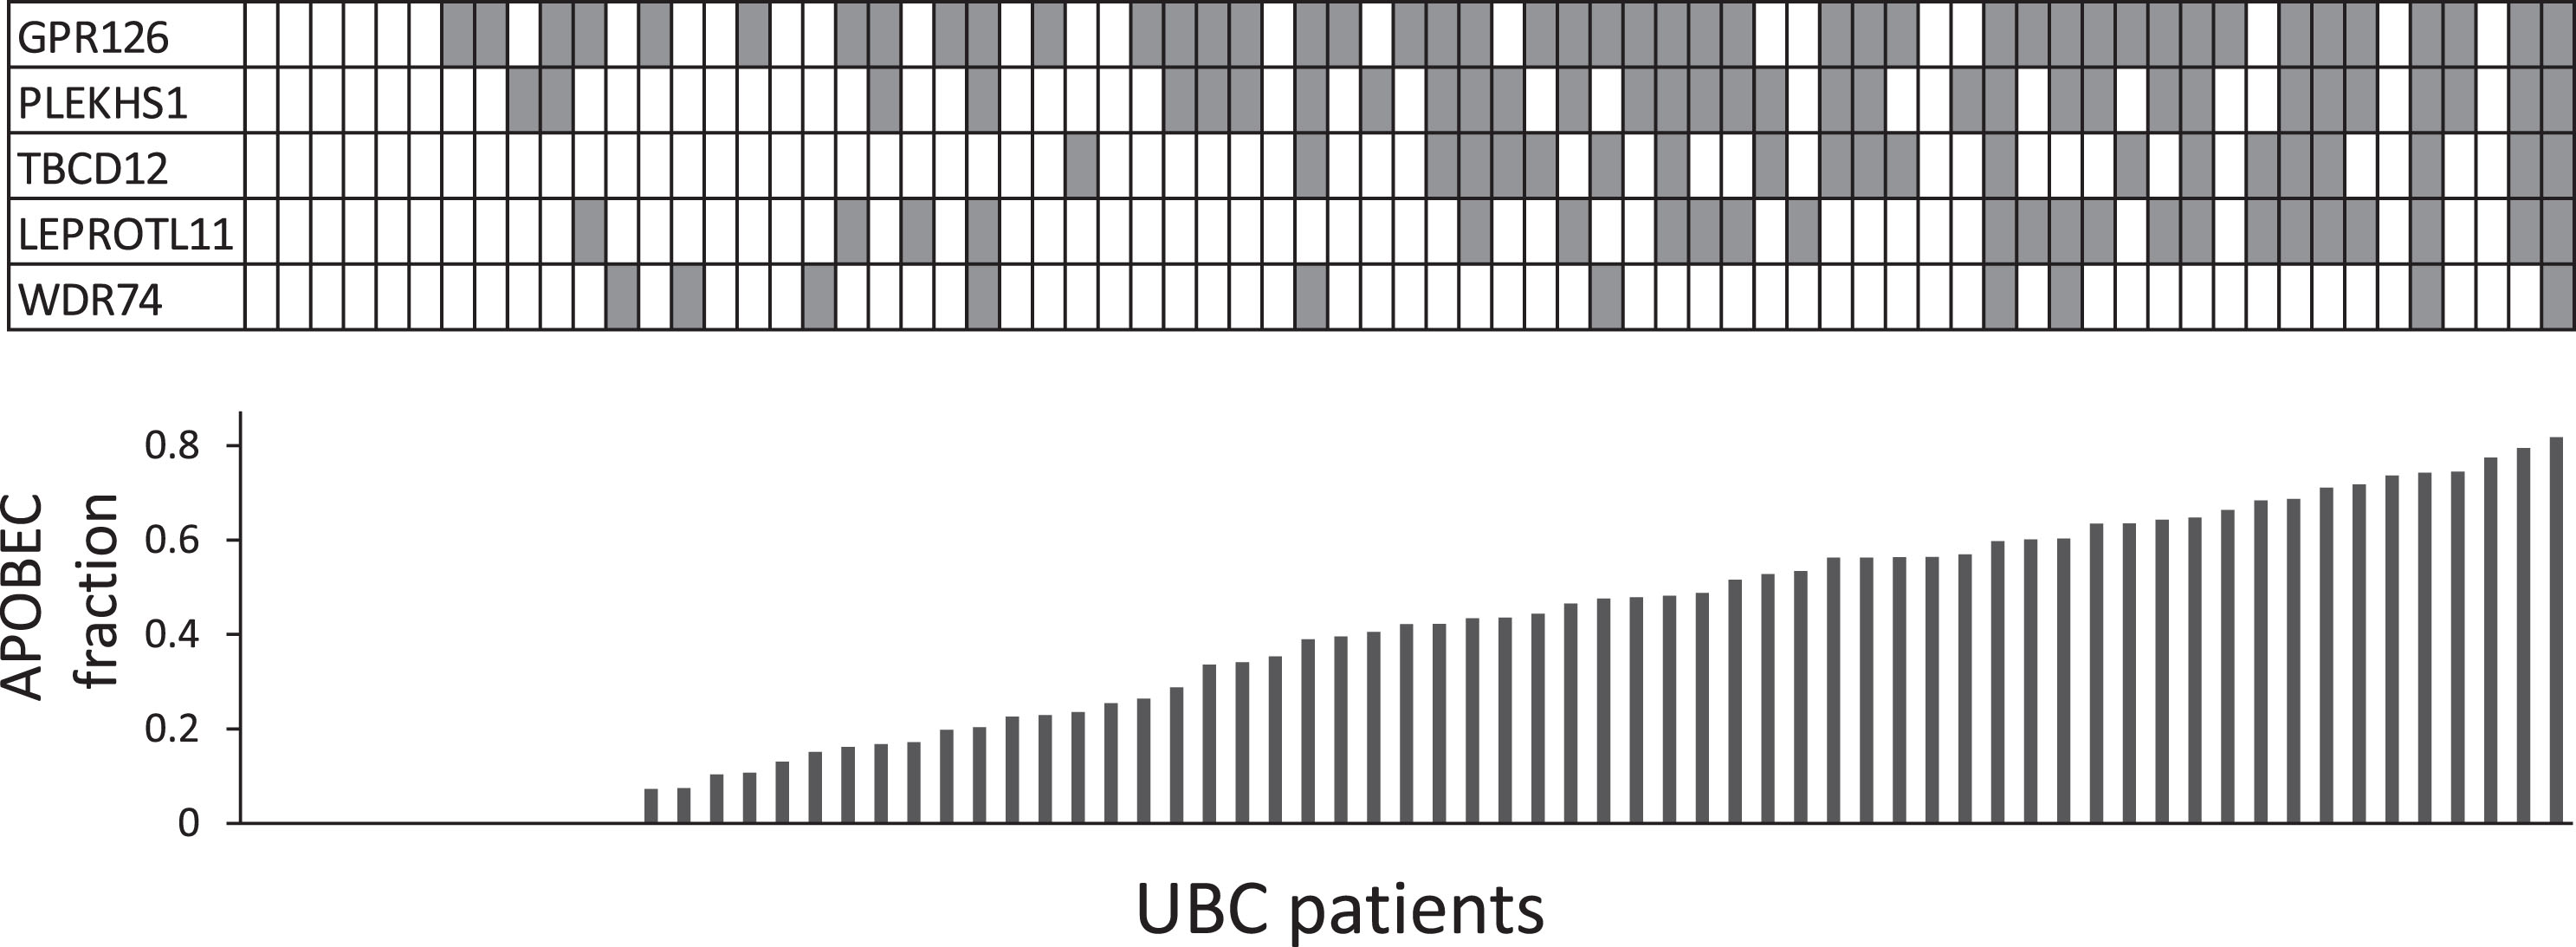
Fig.4
Co-occurrence of recurrent non-coding mutations and APOBEC signature. Each column in the table represents a UBC case; shaded boxes indicate mutations. The histogram shows the fraction of the mutational burden attributable to ABOBEC activity (COSMIC signatures 2+13) from exome data for each UBC.
Combining common non-coding and coding mutations
A panel comprised of the non-coding mutation hotspots in the 5 genes could detect 73.8% of all UBCs. The patient characteristics of mutation negative and positive cases were broadly similar although the mutation negative cases were on average 3.7 years younger and slightly enriched for lower stage and grade disease. In the same cohort of patients TERT, FGFR3 or TP53 are mutated in 90.7% of cases (data from [10]). Combining both sets of genes produces an 8-gene panel that is mutated in 95.4% of UBCs (Fig. S4) and might prove useful for the non-invasive detection of UBC via urinary DNA.
Associations with clinical outcomes
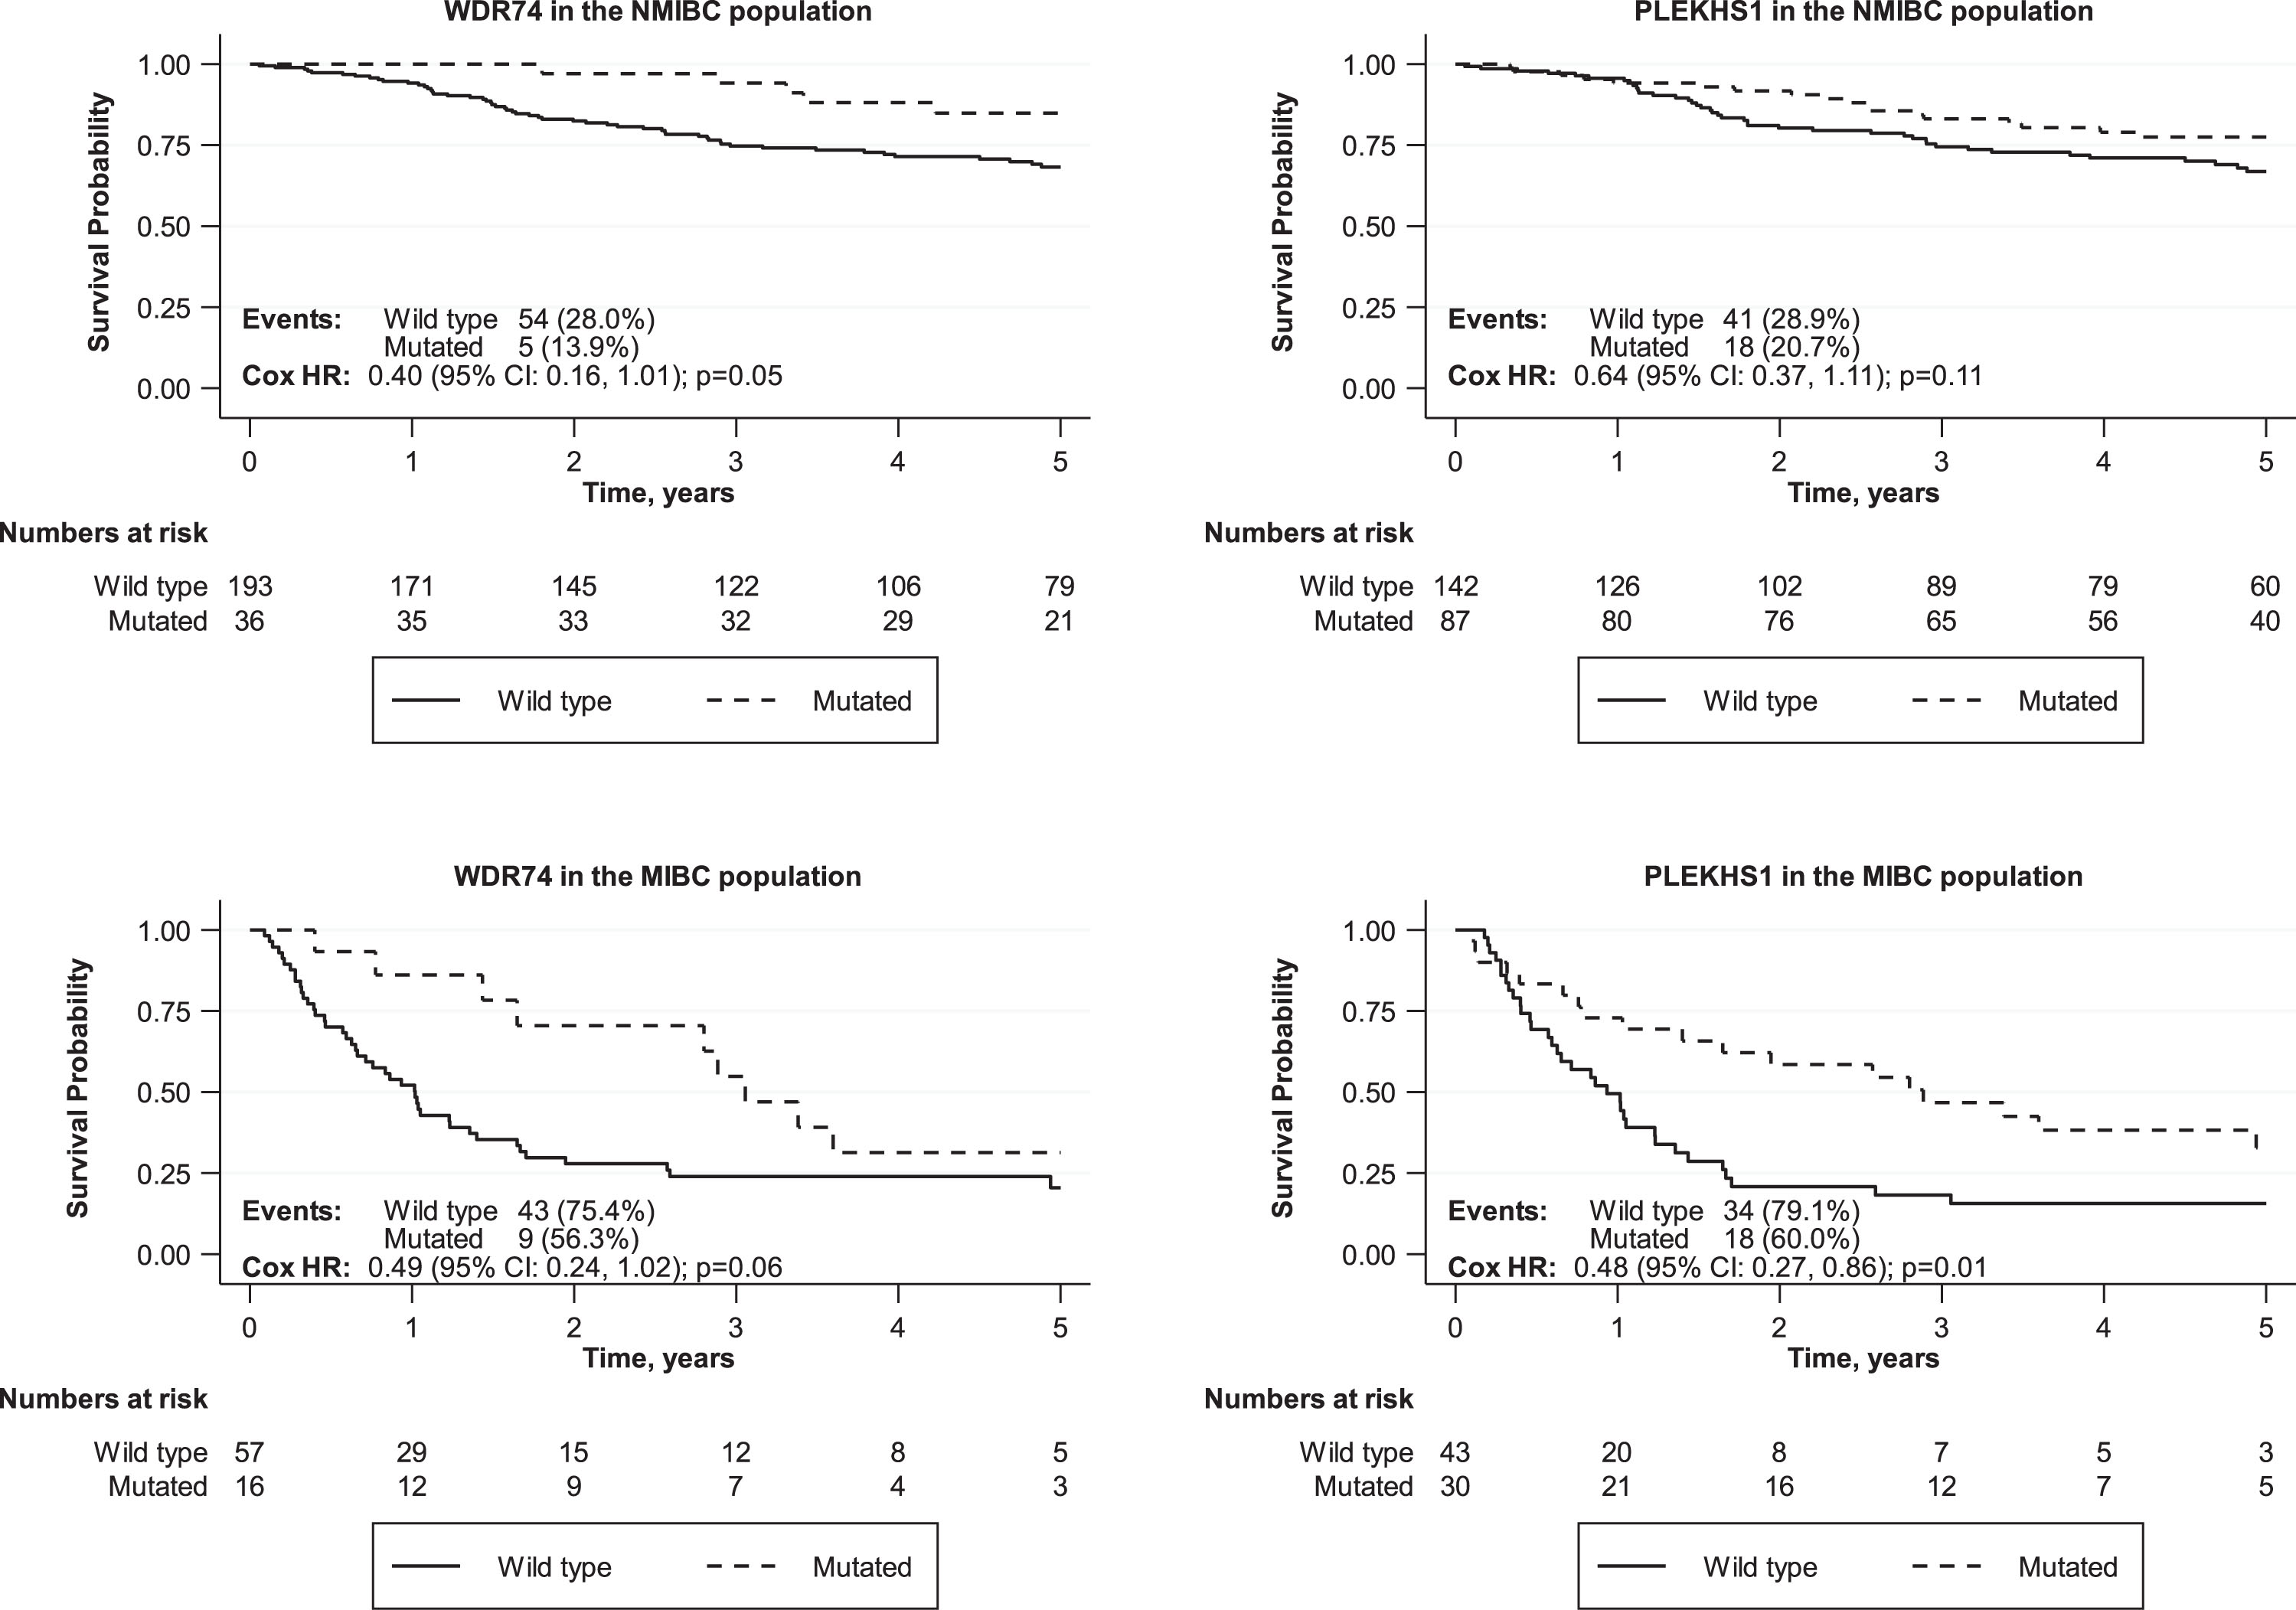
Overall survival times were compared for UBC patients with or without mutations in each non-coding region. Comparisons were made across the entire cohort and for NMIBC and MIBC separately. Survival curves for all comparisons are shown in Supplemental data. None of the mutations were significantly associated with worse overall survival across the entire patient cohort. The most significant association was for PLEKHS1 mutations to predict better overall survival across the entire patient cohort (p = 0.04) with the same trend in both MIBC (p = 0.01) and NMIBC patients (p = 0.11) (Fig. 5). WDR74 mutations are also associated with better overall survival across the entire patient cohort (p = 0.05) with the same trend in both MIBC (p = 0.06) and NMIBC patients (p = 0.05).
Fig.5
Effects of non-coding mutations in PLEKHS1 and WDR74 on overall survival in NMIBC and MIBC patients.
DISCUSSION
We have studied non-coding mutations at 5 sites across 302 UBCs of all stages and grades. The sites are all close to or within protein coding genes: The GPR126 and PLEKHS1 hotspots are intronic, the TBC1D12 and LEPROTL1 hotspots are in 5’-UTRs whereas the WDR74 hotspots are more than 1 kb upstream of the transcription start site. Over 90% of the mutations are C/T transitions and are flanked by palindromic sequences that may form hairpin structures exposing these bases to APOBEC enzymes [20] (as reported for S249C in FGFR3 [28]). Consistent with this, non-coding mutations in 4 of these 5 genes are significantly more frequent in UBCs with a higher APOBEC mutation signature. An association between APOBEC signatures and the PLEKHS1 and TBC1D12 hotspots was previously noted in breast cancer [19].
The most frequently mutated gene, GPR126, is a G-protein coupled receptor that can bind to basement membrane protein type IV collagen [29]. The effects of the non-coding mutations in GPR126 have recently been investigated in 2 studies with apparently discordant results [21, 22]. In a series of 196 patients, Wu et al. reported that GPR126 mutations are more common in older patients and in NMIBC relative to MIBC, and immunohistochemistry showed that UBCs with mutations expressed more GPR126 protein [21]. They also demonstrated significantly worse overall survival for both NMIBC and MIBC patients with mutations. In a series of 103 patients, Garinet et al, reported GPR126 mutations at a similar frequency in NMIBC and MIBC [22]; GPR126 mRNA levels were lower in mutant NMIBCs than wt NMIBCs (with no difference between wt and mutant in MIBC) and mutations were not significantly associated with outcome. Our RNAseq data are in agreement with Garinet et al’s finding that GPR126 mutations decrease GPR126 mRNA levels, and also that GPR126 mutations do not strongly influence UBC outcomes.
PLEKHS1 encodes pleckstrin homology domain-containing family S member 1, a paralog of GRB2 Associated Binding Protein 2; high expression levels are associated with better outcome in the TCGA UBC cohort (accessed via the human protein atlas (proteinatlas.org)). Weinhold et al showed decreased PLEKHS1 gene expression in mutant tumours [18], however we find no statistically significant link between PLEKHS1 mutations and expression in UBC (Fig. S2). Recently, Pignot et al reported no link between PLEKHS1 mutations and expression and that increased PLEKHS1 mRNA expression is a poor prognostic indicator in UBC [30]. A role for PLEKHS1 mutations as diagnostic biomarkers is now supported by multiple studies but biological and prognostic roles require further investigation.
LEPROTL1 encodes Leptin Receptor Overlapping Transcript Like 1. TBC1D12 encodes TBC1 Domain Family Member 12 which is widely expressed in human cancers and may act as a GTPase-activating protein for Rab family proteins. Rheinbay et al demonstrated that both mutations in LEPROTL1, but only chr10:96162368 and not chr10:96162370 mutations in TBC1D12, result in decreased gene expression [20]; however, we did not observe these effects in our data.
WDR74 encodes WD repeat-containing protein 74, a relatively unstudied protein. Mutations in this non-coding region are not restricted to just a double mutation hotspot, but are more diverse and do not appear to influence gene expression in either Weinhold’s pan-cancer analysis [18] or our RNAseq data. Moreover, mutations at the two hotspots do not occur at the same frequency, the palindromic sequences are not as close to the mutations as for the other hotspots, and no statistical link with APOBEC signatures was found. Therefore, the WDR74 hotspot may not be targeted by APOBEC, or be targeted with lower efficiency. Nonetheless, our data suggest that the non-coding WDR74 mutations confer an improved prognosis in UBC.
None of the proteins encoded by these 5 genes are known oncogenes or tumour suppressors. However,they are all involved in pathways potentially associated with tumourigenesis and further investigation is required to elicit their roles in UBC and to determine whether these are driver mutations or passenger mutations that simply reflect APOBEC activity. Despite uncertainty regarding their biological role in UBC, these frequent mutations are likely to be useful biomarkers for the non-invasive detection of UBC via urinary DNA sequencing although their occurrence in non-neoplastic urothelium and benign neoplasms remains to be defined. UBC associated mutations are readily detectable in urinary DNA [7–10] and detection of PLEKHS1 mutations in the urine of UBC patients has been demonstrated [7]; there is no reason why the other mutations studied herein should not also be readily detectable in urine and be incorporated, with other carefully selected mutation hotspots, into a targeted sequencing panel for non-invasive UBC detection. Such a test will require large-scale validation of sensitivity, specificity and clinicalutility.
CONCLUSIONS
Mutations in the non-coding regions of GPR126, PLEKHS1, TBC1D12, LEPROTL1, WDR74 are frequent early events in UBC associated with an APOBEC mutational signature. They are common to both papillary-LG and CIS-HG pathways of tumour development, and may prove to be valuable biomarkers for bladder cancer detection.
AUTHOR CONTRIBUTIONS
RRJ & NSG – performed all laboratory work, LB, AG, BN, SO, NH-Z & RA – bioinformatics analyses, RHB – statistical analysis, NDJ, MPZ, KKC – study design and manuscript editing, RTB & DGW – study design and manuscript writing.
ETHICAL CONSIDERATIONS
Ethical approval and consent to participate: All biospecimens were collected as part of the West Midlands Bladder Cancer Prognosis Programme (BCPP). All patients provided written informed consent for specimen collection for biomarker research. The experiment reported here are covered by the BCPP ethics approval: 06/MRE04/65.
Data available upon reasonable request to the corresponding author.
FUNDING
This work was funded by the University of Birmingham and Cancer Research UK. Boris Noyvert is funded through the Cancer Research UK Birmingham Centre. This work utilised the CaStLeS infrastructure at the University of Birmingham [31].
CONFLICT OF INTEREST
RT Bryan has contributed to advisory boards for Olympus Medical Systems and Janssen. ND James has contributed to advisory boards for Merck USA and Pierre Fabre.
ACKNOWLEDGMENTS
We would like to thank Ben Abbots and all staff and patients involved in the West Midlands Bladder Cancer Prognosis Programme.
SUPPLEMENTARY MATERIAL
[1] Supplementary Material includes additional graphical and tabulated representation of the data and a detailed survival analysis report.
The supplementary material is available in the electronic version of this article: https://dx.doi.org/10.3233/BLC-190251.
REFERENCES
[1] | Antoni S , Ferlay J , Soerjomataram I , Znaor A , Jemal A , Bray F . Bladder Cancer Incidence and Mortality: A Global Overview and Recent Trends. Eur Urol. (2017) ;71: :96–108. |
[2] | Robertson A , Kim J , Al-Ahmadie H , Bellmunt J , Guo G , Cherniack A , et al. Comprehensive Molecular Characterization of Muscle-Invasive Bladder Cancer. Cell. (2017) ;171: (3):540–56. |
[3] | Czerniak B , Dinney C , McConkey D . Origins of Bladder Cancer. Annu Rev Pathol. (2016) ;11: :149–74. |
[4] | Tan T , Rouanne M , Tan K , Huang R , Thiery J . Molecular Subtypes of Urothelial Bladder Cancer: Results from a Meta-cohort Analysis of 2411 Tumors. Eur Urol. (2019) ;75: (3):423–32. |
[5] | Bryan R , Zeegers M , van Roekel E , Bird D , Grant M , Dunn J , et al. A comparison of patient and tumour characteristics in two UK bladder cancer cohorts separated by 20 years. BJU Int. (2013) ;112: (2169–175). |
[6] | Sylvester R , van der Meijden A , Oosterlinck W , Witjes J , Bouffioux C , Denis L , et al. Predicting recurrence and progression in individual patients with stage Ta T1 bladder cancer using EORTC risk tables: A combined analysis of 2596 patients from seven EORTC trials. Eur Urol. (2006) ;49: (3):466–77. |
[7] | Dudley J , Schroers-Martin J , Lazzareschi D , Shi W , Chen S , Esfahani M , et al. Detection and surveillance of bladder cancer using urine tumor DNA. Cancer Discov. (2018) . doi: 10.1158/2159-8290.CD-18-0825 |
[8] | Springer S , Chen C , Rodriguez Pena M , Li L , Douville C , Wang Y , et al. Non-invasive detection of urothelial cancer through the analysis of driver gene mutations and aneuploidy. Elife. (2018) ;7: :e32143. |
[9] | Ward D , Baxter L , Gordon N , Ott S , Savage R , Beggs A , et al. Multiplex PCR and next generation sequencing for the non-invasive detection of bladder cancer PLOS ONE. (2016) ;11: (2):e0149756. |
[10] | Ward D , Gordon N , Boucher R , Pirrie S , Baxter L , Ott S , et al. Targeted deep sequencing of urothelial bladder cancers and associated urinary DNA: A 23-gene panel with utility for non-invasive diagnosis and risk stratification. BJU Int. (2019) ;124: (3):532–44. |
[11] | Allory Y , Beukers W , Sagrera A , Flández M , Marqués M , Márquez M , et al. Telomerase Reverse Transcriptase Promoter Mutations in Bladder Cancer: High Frequency Across Stages, Detection in Urine, and Lack of Association with Outcome. Eur Urol. (2013) ; epub ahead of print. |
[12] | Hurst C , Knowles M . Mutational landscape of non-muscle-invasive bladder cancer. Urologic Oncology: Seminars and Original Investigations. (2018) : S1078–439(18)30398–3. |
[13] | Liu X , Wu G , Shan Y , Hartmann C , von Deimling A , Xing M . Highly prevalent TERT promoter mutations in bladder cancer and glioblastoma. Cell Cycle. (2013) ;12: (10):1637–8. |
[14] | Russo I , Ju Y , Gordon N , Zeegers M , Cheng K , James N , et al. Toward Personalised Liquid Biopsies for Urothelial Carcinoma: Characterisation of ddPCR and Urinary cfDNA for the Detection of the TERT 228 G>A/T Mutation. Bladder Cancer. (2018) ;4: (1):41–8. |
[15] | Colebatch A , Dobrovic A , Cooper W . TERT gene: Its function and dysregulation in cancer. J Clin Pathol. (2019) ;72: (4):281–4. |
[16] | Borah S , Xi L , Zaug A , Powell N , Dancik G , Cohen S , et al. Cancer. TERT promoter mutations and telomerase reactivation in urothelial cancer. Science. (2015) ;347: (6225):1006–10. |
[17] | Huang F , Hodis E , Xu M , Kryukov G , Chin L , Garraway L . Highly Recurrent TERT Promoter Mutations in Human Melanoma. Science. (2013) ;339: (6122):957–9. |
[18] | Weinhold N , Jacobsen A , Schultz N , Sander C , Lee W . Genome-wide analysis of noncoding regulatory mutations in cancer. Nat Genet. (2014) ;46: (11):1160–11165. |
[19] | Nik-Zainal S , Davies H , Staaf J , Ramakrishna M , Glodzik D , Zou X , et al. Landscape of somatic mutations in 560 breast cancer whole-genome sequences. Nature. (2016) ;534: (7605):47–54. |
[20] | Rheinbay E , Parasuraman P , Grimsby J , Tiao G , Engreitz J , Kim J , et al. Recurrent and functional regulatory mutations in breast cancer. Nature. (2017) ;547: (7661):55–60. |
[21] | Wu S , Ou T , Xing N , Lu J , Wan S , Wang C , et al. Whole-genome sequencing identifies ADGRG6 enhancer mutations and FRS2 duplications as angiogenesis-related drivers in bladder cancer. Nat Commun. (2019) ;10: (1):720. |
[22] | Garinet S , Pignot G , Vacher S , Le Goux C , Schnitzler A , Chemlali W , et al. High Prevalence of a Hotspot of Noncoding Somatic Mutations in Intron 6 of GPR126 in Bladder Cancer. Mol Cancer Res. (2019) ;17: (2):469–75. |
[23] | Zeegers M , Bryan R , Langford C , Billingham L , Murray P , Deshmukh N , et al. The West Midlands Bladder Cancer Prognosis Programme: Rationale and design. BJU Int. (2010) ;105: (6):784–8. |
[24] | Soukup V , Čapoun O , Cohen D , Hernández V , Babjuk M , Burger M , et al. Prognostic Performance and Reproducibility of the 1973 and 2004/2016 World Health Organization Grading Classification Systems in Non-muscle-invasive Bladder Cancer: A European Association of Urology Non-muscle Invasive Bladder Cancer Guidelines Panel Systematic Review. Eur Urol. (2017) ;72: (5):801–13. |
[25] | Rosenthal R , McGranahan N , Herrero J , Taylor B , Swanton C . DeconstructSigs: Delineating mutational processes in single tumors distinguishes DNA repair deficiencies and patterns of carcinoma evolution. Genome Biol. (2016) ;17: (31). doi: 10.1186/s13059-016-0893-4 |
[26] | Patro R , Duggal G , Love M , Irizarry R , Kingsford C . Salmon provides fast and bias-aware quantification of transcript expression. Nat Methods. (2017) ;14: (4):417–9. |
[27] | Hedegaard J , Lamy P , Nordentoft I , Algaba F , Høyer S , Ulhøi B , et al. Comprehensive Transcriptional Analysis of Early-Stage Urothelial Carcinoma. Cancer Cell. (2016) ;30: (1):27–42. |
[28] | Shi M , Meng X , Lamy P , Banday A , Yang J , Moreno-Vega A , et al. APOBEC-mediated mutagenesis as a likely cause of FGFR3 S249C mutation over-representation in bladder cancer. Eur Urol. (2019) . [Epub ahead of print]. |
[29] | Paavola K , Sidik H , Zuchero J , Eckart M , Talbot W . Type IV collagen is an activating ligand for the adhesion G protein-coupled receptor GPR126. Sci Signal. (2014) ;7: (338). doi: 10.1126/scisignal.2005347 |
[30] | Pignot G , Le Goux C , Vacher S , Schnitzler A , Radvanyi F , Allory Y , et al. PLEKHS1: A new molecular marker predicting risk of progression of non-muscle-invasive bladder cancer. Oncol Lett. (2019) ;18: (4):3471–80. |
[31] | Thompson S , Stephanie E , Cazier J-B . CaStLeS (Compute and Storage for the Life Sciences): a collection of compute and storage resources for supporting research at the University of Birmingham. Zenodo. (2019) . doi: 10.5281/zenodo.3250616. |


