
PD-L1/PD-1 Biomarker for Metastatic Urothelial Cancer that Progress Post-platinum Therapy: A Systematic Review and Meta-analysis
Abstract
Background:
Immune checkpoint inhibitors (ICI) are extremely expensive and most patients with metastatic urothelial carcinoma (mUC) do not benefit significantly from their use.
Objective:
We performed a systematic review and meta-analysis to determine response rates and survival outcomes on patients with mUC progressing despite prior platinum-based chemotherapy receiving ICI stratified by biomarker status.
Methods:
We performed a comprehensive literature search for all articles in PubMed and Embase up to 06/15/2019 to identify all studies pertaining to programmed death-ligand 1 (PD-L1) and programmed death 1 (PD-1) receptor targeted therapies for mUC that reported biomarkers. Given that biomarkers are reported on different scales and with different metrics, we defined each biomarker as either positive or negative using the definitions implemented in each individual trial. We meta-analyzed the data, reconstructed overall (OS) and progression-free survival (PFS) curves, and analyzed response rates by biomarker status. OS and PFS were analyzed in a pooled Kaplan-Meier analysis and pseudo-individualized patient data (IPD) extracted.
Results:
We identified 1429 manuscripts of which 8 met inclusion criteria, with a total of 1837 treated patients with outcomes data. On proportional hazards survival analysis, patients in the biomarker negative group were associated with a lower PFS (HR 1.48, 95% CI: 1.18 - 1.85, p < 0.001) and lower OS (HR 1.54, 95% CI: 1.32 - 1.80, p < 0.001) when compared to the biomarker positive group. Response data was available for 1641 patients and random effects proportion show complete response in 8% and 3% in biomarker positive and negative patients, respectively.
Conclusions:
ICI therapy for metastatic UC post platinum therapy has a higher overall response rate, OS and PFS in patients who are biomarker positive compared to those who are negative. However, some patients who are biomarker negative do achieve complete responses. A better biomarker for patient selection is essential before biomarkers can be used to stratify candidates for ICI therapy.
INTRODUCTION
In recent years, based on the favorable results of multiple clinical trials, programmed cell death 1 receptor (PD-1) inhibitor (pembrolizumab, nivolumab) and programmed death-ligand 1 (PD-L1) inhibitors (atezolizumab, avelumab, durvalumab) introduced a whole new paradigm for treating platinum ineligible and platinum resistant metastatic urothelial carcinoma (mUC) [1–8]. However, these drugs are extremely expensive and most patients who receive an immune checkpoint inhibitor (ICI) do not benefit from it. The patients who do derive a benefit from these drugs can have a durable response, which is driving the benefit in the overall population [1, 9]. Therefore, a predictive biomarker that can identify patients that benefit from these therapies is imperative to maximize survival outcomes. Currently, each of the anti PD-L1/PD-1 drugs have utilized a slightly different biomarker in their respective clinical trial and there have only been small subgroup analyses from these clinical trials that compare the response rate of ICI therapy by biomarker status. Here, we present a systematic review and meta-analyses of the literature in an effort to determine the difference in response, overall survival (OS) and progression free survival (PFS) of patients who have undergone biomarker testing and received ICI therapy.
The gold standard approach for pooling trial data is to obtain individual patient data (IPD) from each study for a meta-analysis. Meta-analysis of IPD has significant advantages over the typical meta-analysis of summary group-level data [10, 11]. However, it is not always possible or practical to obtain IPD. The traditional approach to group-level survival meta-analysis is to pool hazards ratios (HR) provided in the individual studies [12]. When hazard ratios are not available, an alternative approach has been proposed where survival probabilities of the included studies are collected at a single point in time and the intervention effect is then summarized as the pooled ratio of the logarithm of survival probabilities, which is a theoretical estimate of the hazards ratio if hazard functions are proportional [13, 14]. However, clinical practice decisions are not usually made on the basis of a single outcome variable at a single time point. We utilized a methodology that combine several outcome variables measured at multiple time points to achieve an overall viewpoint on the relative efficacy of PD-L1/PD-1 therapies [15] This result allowed us to determine the response rates, OS and PFS in patients with mUC that failed prior platinum based chemotherapy stratified by biomarker status.
METHODS
Protocol registration and search strategy
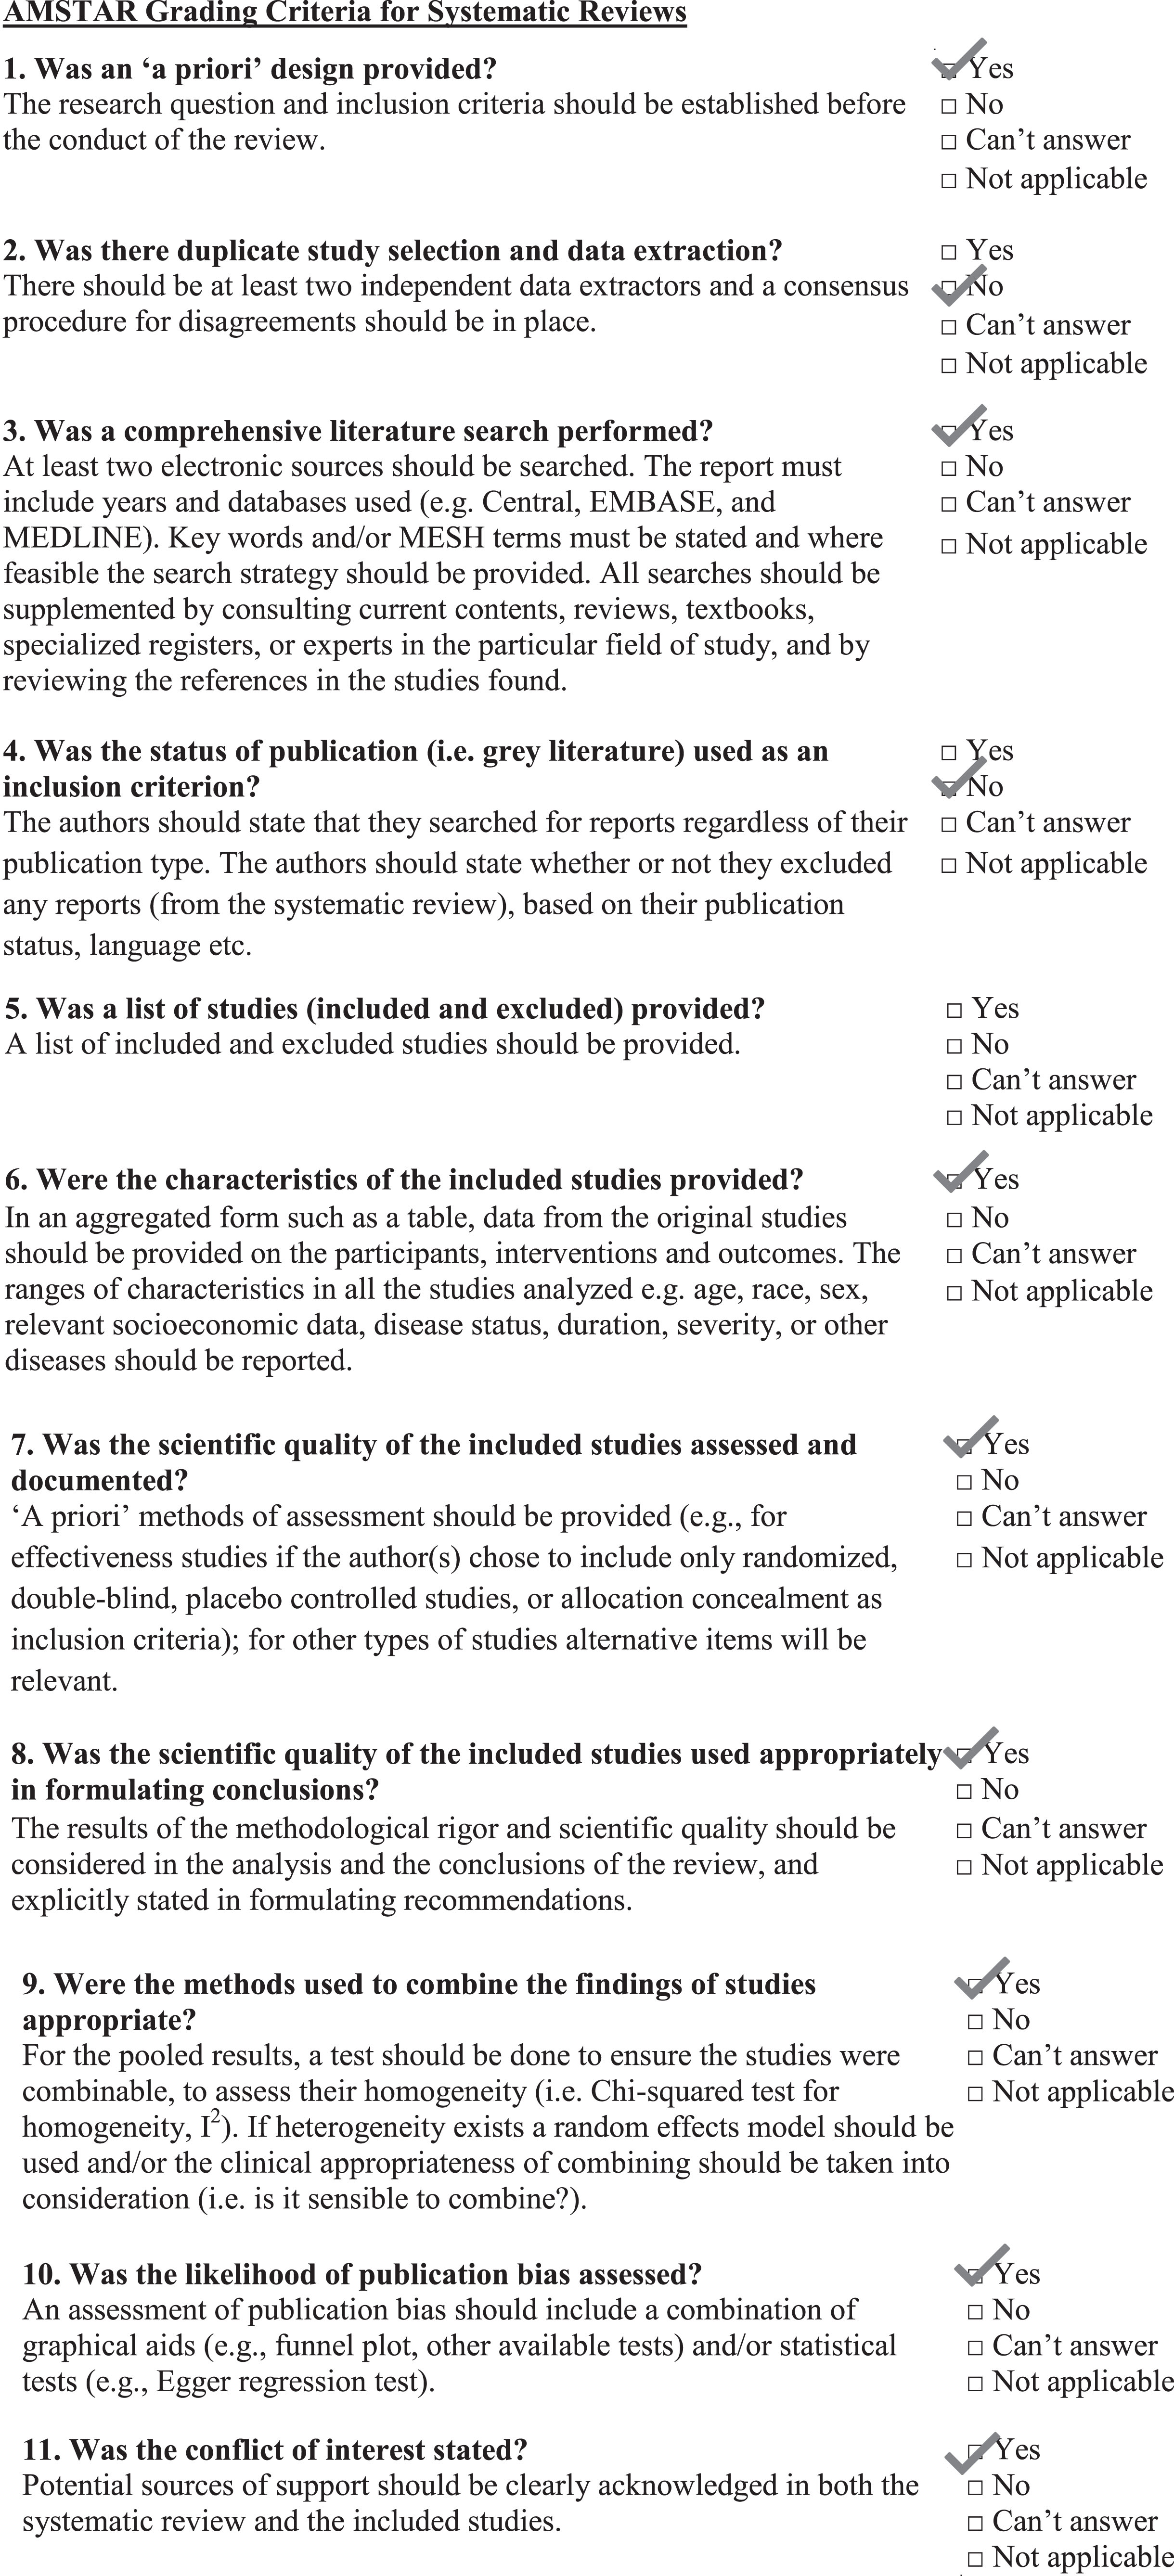
Our protocol is registered in the International Prospective Register of Systematic Reviews (PROSPERO) registry (CRD42019139108). Using standard methodological procedures outlined by Cochrane [16, 17] and the AMSTAR criteria (Appendix 1), we performed a comprehensive literature search for phase 1 – 3 clinical trials articles in PubMed and Embase (last date 6/15/2019) to identify all studies pertaining to PD-L1/PD-1 ICI and mUC. The complete search strategy is shown in Appendix 2. Briefly, different variations of key words and MESH terms for urothelial carcinoma were combined with various combinations of PD-L1 and PD-1 targeted therapy.
Objective
The primary objectives were to estimate difference in overall survival (OS) and progression-free survival (PFS) in patients who received PD-L1 and PD-1 targeted therapy based on PD-L1 biomarker status, by performing a pseudo-individualized patient data meta-analysis of trials using reconstructed survival data. The secondary objectives were to determine the response rates, again stratified by biomarker status.
Eligibility criteria, manuscript screening, data abstraction, and study quality
Only articles in the English language pertaining to clinical trials involving human subjects who were post-platinum therapy were included in this review. Conference abstracts, editorials, letters, case report/case series, review articles were excluded (Supplementary Figure 1), though their reference lists were verified for original data. To be eligible for inclusion, clinical trials must have evaluated PD-1 or PD-L1 blockade in patients with mUC progressing despite prior platinum-based chemotherapy. Two reviewers (WPT and WST) independently screened the manuscript abstracts generated from the search strategy for eligibility for full-text screening following recommended methods [18]. Then, these same reviewers independently assessed full-text articles for inclusion, with adjudication of a third reviewer (BAI) in cases of discordance. Given that PD-L1 biomarkers are reported on different scales and with different metrics, we defined each biomarker as either positive or negative using the definitions implemented in each individual trial. Data were extracted independently from the article texts, table and figures. Data was subsequently tabulated by two reviewers (WPT and WST). Discrepancies between the two reviewers were resolved by discussion and consensus with a third investigator (BAI). When similar cohorts were published, the more contemporary study was used for the analysis. Extracted information included trial name, author, phase, study objective, sample size, interventions, outcome measures, statistical analysis, results and conclusion. Methodological quality was independently assessed by two authors using the modified Downs and Black checklist for the assessment of methodological quality of both nonrandomized and randomized studies [19]. The following categories for study quality scores have been suggested: excellent [26–28], good [20–25], fair [15–19], and poor (≤14). [20, 21]
Statistical methods
Descriptive statistics using median and interquartile range were used to summarize demographic and baseline data of eligible patients. Sample size of individual studies, demographic values were calculated based on percentages and summed up to obtain the values used for this cohort. Pooled averages were estimated using both the fixed and random-effects model proposed by DerSimonian and Laird [22]. Proportions of complete response (CR, complete disappearance of tumor), partial response (PR,>30% reduction in tumor volume) and objective response rate (ORR) were pooled after arcsine transformation for variance stabilization [23]. Restricted maximum likelihood estimation was used to calculate the between-study variance (I2) in the models, and pooled arcsine-transformed proportions and their 95% confidence intervals (CI)s were then back-transformed to the normal scale for presentation [24]. CIs for individual study proportions were calculated using the Clopper–Pearson method.
In order to compare survival outcomes across studies, published Kaplan–Meier plots from each trial were digitized using WebPlotDigitizer and survival probabilities and follow-up times extracted [25]. The number of subjects at risk at follow-up times were calculated using number at risk tables when available and other methods when not [26]. Pseudo-individual patient survival data was then reconstructed for each study using the method of Guyot et al. and pooling of survival curves done using the method of Combescure et al. to arrive at summary survival curves for each trial with accurate censoring information [27, 28]. To determine if the reconstructed survival curves accurately represented the primary data in each individual trial, intraclass correlation coefficients were calculated to assess the difference among the pairs of available reconstructed and published data. The I2 statistic was used to quantify heterogeneity in the published survival curves. The meta-analyzed pseudo-IPD was then used to generate two overall pooled survival curves, one for OS and one for PFS, each stratified by PD-L1 biomarker status. Additionally, Cox proportional hazards models were used to compare overall survival OS and PFS in biomarker negative and positive patients and the hazards ratio (HR) and its respective 95% CI reported. The proportional hazards assumption was tested and Schoenfeld residuals plotted. Publication bias was assessed as described by Egger et al. and Begg et al. using funnel plots to compare standard error against log-median survival [29, 30]. Forest plots were constructed for response rates. Statistical analyses were done using R 3.4.2 on RStudio 1.1.383 with packages psych, survHE, surminer, ggplot2, meta and MetaSurv installed.
RESULTS
Quantity and quality of evidence
A total of 1429 records were identified through electronic search of the two databases (Supplemental Figure 1). After excluding irrelevant articles by abstract review, 26 full-text articles were assessed in detail. A total of 8 manuscripts involving 8 unique clinical trials were included in the final analysis and there was no disagreement between reviewers. The Preferred Reporting Items for Systematic Reviews and Meta-Analyses (PRISMA) statement for reporting systematic review and meta-analysis was completed (Appendix 3). The intraclass correlation between published number-at-risk tables and those calculated from our pseudo-IPD was 1.0 (95% CI 1 -1), indicated the survival curve reconstruction for censoring was excellent (Supplemental Table 1).
Among the eight studies, there were two phase 1 trials, two phase 1/2 trials, two phase 2 trials and two phase 3 trials (Table 1). The quality of the studies averaged as fair in quality (Supplemental Table 2). Common limitations included short follow-up and lack of reporting on biomarker negative patients. Eligibility criteria for the eight included trials were similar as shown in Supplementary Table 3. Two studies included platinum ineligible patients and one study included patients with locally advanced carcinoma.
Table 1
Studies included in the analysis
| Trial | Author | Year | Phase | Indication | N | Drug | Survival outcome | Stratified by PD-L1/PD-1 status | Biomarker (Criteria for positive test) |
| Javelin-dose expansion cohort [4] | Patel | 2018 | 1 | 2nd line | 161 | Avelumab 10 mg/kg IV every 2 weeks | OS, PFS | Yes | Dako IHC73-10 (TC > 5%) |
| MPDL3280A [2] | Petrylak | 2018 | 1 | ≥3rd line | 86 | Atezolizumab 15 mg/kg or 1200 mg every 3 weeks | OS, PFS | Yes | Ventana SP142 (IC2/3) |
| Cisplatin ineligible | 9 | ||||||||
| Study 1108 [5] | Powles | 2017 | 1/2 | 2nd line | 182 | Durvalumab 10 mg/kg IV every 2 weeks | OS, PFS | Yes | Ventana SP-263 (TC > 5%) |
| Cisplatin ineligible | 9 | ||||||||
| CheckMate032 [6] | Sharma | 2016 | 1/2 | 2nd line | 78 | Nivolumab 3 mg/kg IV every 2 weeks | OS, PFS | Yes | Dako 288 (TC-L1≥1%) |
| IMvigor210-Cohort 2 [3] | Rosenberg | 2016 | 2 | 2nd line | 251 | Atezolizumab 1200 mg every 3 weeks | OS | Yes | Ventana SP142 (IC2/3) |
| Inoperable locally advanced | 59 | ||||||||
| CheckMate275 [7] | Sharma | 2017 | 2 | 2nd line | 265 | Nivolumab 3 mg/kg IV every 2 weeks | OS, PFS | Yes | Dako 288 (TC-L1≥1%) |
| KeyNote045 [8] | Bellmunt | 2017 | 3 | 2nd line | 270 | Pembrolizumab 200 mg IV every 3 weeks | OS, PFS | Yes | Dako 22C3 (PD-L1 expression≥10% CS) |
| IMvigor211 [1] | Powles | 2018 | 3 | 2nd line | 467 | Atezolizumab 1200 mg IV every 3 weeks | OS, PFS | Yes | Ventana SP142 (IC2/3) |
TC: Tumor cells; CS: Cancer cell; OS: Overall survival; PFS: Progression free survival.
Publication bias and heterogeneity
The funnel plot of standard error versus log(median survival) is shown in Supplementary Figure 2 and we identified no apparent publication bias. Pooling survival curves data showed an I2 of 0% for OS in biomarker positive, negative and all patients arms. Heterogeneity for PFS was 24.5% and 23.6% in the biomarker positive and all patients arm (Table 2).
Table 2
Median progression free survival, overall survival and heterogeneity in pooled survival curves
| Survival Variable | Biomarker | Pseudo IPD Data Median, (IQR) | Fixed effect Median, (IQR) | Random effect Median, (IQR) | I2 (%) |
| PFS (months) | + | 2.4 (2.1 – 2.7) | 3.1 (2.5 – 3.9) | 3.3 (2.3 – 4.9) | 24.5 |
| - | 1.4 (1.4 – 2.4) | 1.5 (1.4 – 2.5) | 1.4 (1.3 – 3.0) | 0 | |
| Both | 2.0 (1.9 – 2.1) | 3.0 (2.5 – 3.7) | 2.7 (1.5 – 3.9) | 23.6 | |
| OS (months) | + | 11.3 (9.7 – 13.0) | 10.6 (9.2 – 11.4) | 10.5 (8.4 – 11.8) | 0 |
| - | 6.7 (5.7 – 7.9) | 6.7 (5.7 – 7.5) | 6.9 (4.8 – 8.3) | 0 | |
| Both | 8.7 (8.1- 9.5) | 8.6 (7.9 – 9.5) | 8.6 (6.9 – 10.4) | 0 |
PFS: Progression Free Survival; OS: Overall Survival; CI: Confidence Interval; IQR: Interquartile range.
Demographics
A total of 1837 patients received PD-L1 therapy and were included in the analysis. 1760 (96%) patients were post-platinum therapy whereas 77 (4%) patients have not received platinum therapy. The demographic details of the study population are summarized in Table 3. Median age ranged from 65.5 to 68 years old, males were 1338 (77%) of patients, and 1117 (84%) of patients were Caucasian. A total of 726 (41%) and 1075 (59%) patients were Eastern Cooperative Oncology Group (ECOG) 0 and ECOG≥1, respectively.
Table 3
Demographics of patients included in their respective trials
| First author (Trial) | Age (IQR) | Gender | Race | Tobacco | Primary tumor site | ECOG performance status | Hgb <10 g/dL | Number of risk factors |
| Patel (Javelin) | 68 (63-76) | M: 72% | White: 78% | Never: 35% | Bladder/Urethra: 77% | 0 : 35% | 16% | – |
| Black: 4% | Previous/Current: 65% | Renal pelvis & ureter: 23% | 1 : 65% | |||||
| Asian: 7% | ||||||||
| Pacific: 1% | ||||||||
| Other: 10% | ||||||||
| Petrylak (MPDL3280A) | 66 (-) | M: 76% | – | – | Bladder: 80% | 0 : 39% | 19% | – |
| 1 : 61% | ||||||||
| Powles (Study 1108) | 67 (-) | M: 72% | White: 76% | – | – | 0 : 34% | 22% | – |
| Black: 5% | 1 : 67% | |||||||
| Asian: 17% | ||||||||
| Other: 2% | ||||||||
| Rosenberg (Cohort 2) | 66 (-) | M: 78% | White: 91% | Never: 35% | Bladder: 74% | 0 : 38% | 22% | – |
| Previous: 54% | Renal pelvis: 14% | 1 : 62% | ||||||
| Current: 11% | Ureter: 7% | |||||||
| Urethra: 2% | ||||||||
| Other: 3% | ||||||||
| Sharma (CheckMate 275) | 65.5 (-) | M: 78% | White: 86% | – | – | 0 : 54% | 18% | – |
| Black: 1% | ≥1 : 46% | |||||||
| Asian: 11% | ||||||||
| Other: 3% | ||||||||
| Bellmunt (KeyNote 045) | 67 (-) | M: 74% | – | Never: 39% | Bladder/Urethra: 86% | 0 : 39% | 16% | 0 : 20% |
| 1 : 58% | 1 : 36% | |||||||
| 2 : 1% | 2 : 24% | |||||||
| Missing: 2% | 3/4 : 17% | |||||||
| Missing: 3% | ||||||||
| Powles (IMvigor 211) | 67 (33-88) | M: 76% | White: 72% | Current: 13% | Bladder: 69% | 0 : 47% | 14% | 0 : 31% |
| Black:<1% | Former: 57% | Urethra: 2% | 1 : 53% | 1 : 46% | ||||
| Asian: 13% | Never: 30% | Renal: 14% | 2 : 18% | |||||
| Unknown: 15% | Ureter: 13% | 3 : 5% | ||||||
| Other: 2% | ||||||||
| Sharma (CheckMate032) | 66 (-) | M: 69% | White: 92% | Present/former: 62% | – | 0 : 54% | 14% | 0 : 35% |
| Black: 5% | Never: 37% | 1 : 46% | 1 : 50% | |||||
| Asian: 1% | Unknown: 1% | 2 : 10% | ||||||
| Other: 1% | 3 : 5% |
IQR: Interquartile range; M: male; ECOG: Eastern Cooperative Oncology Group; Hgb: Hemoglobin.
Response rates
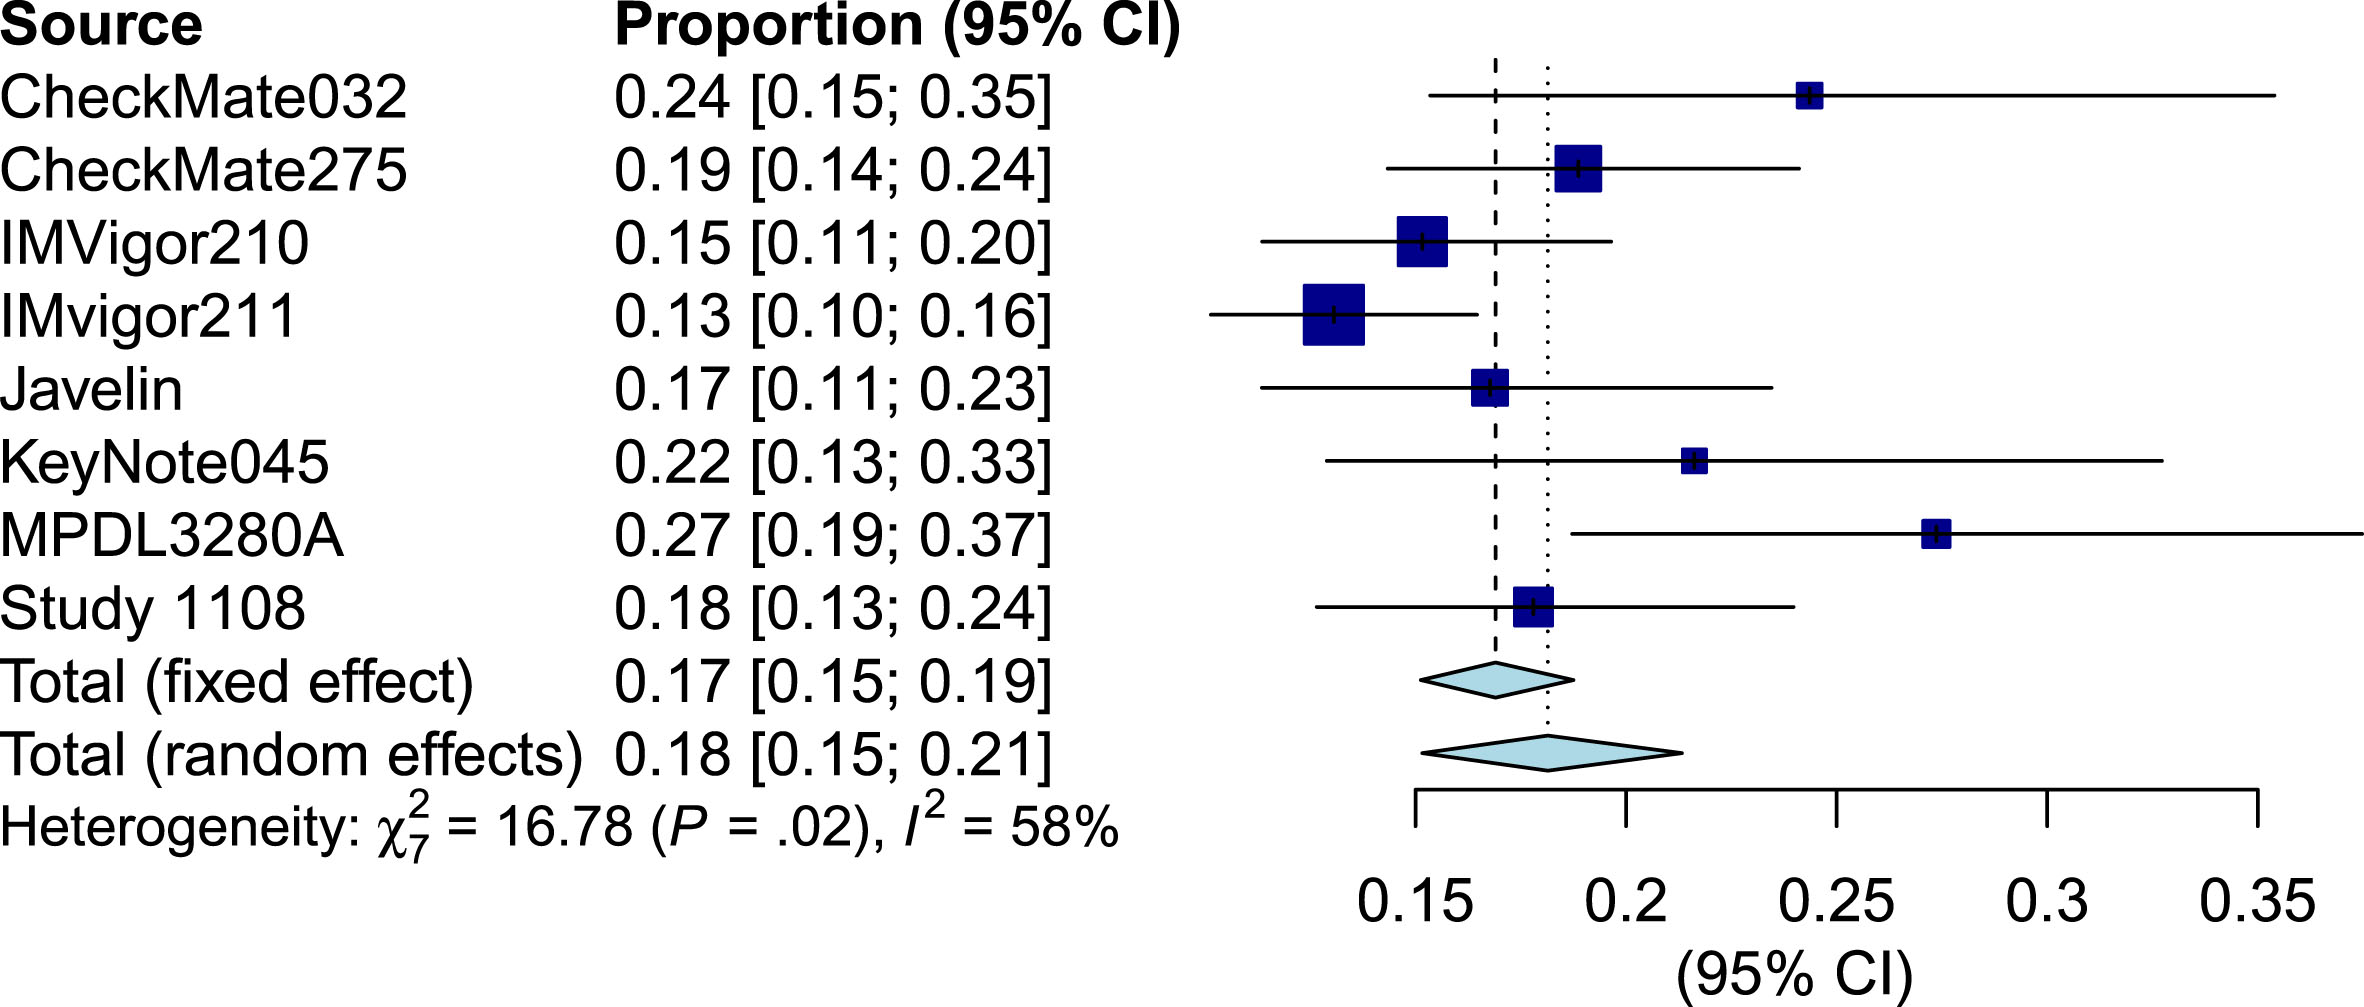
Tumor response (shrinkage) information was available from 8 studies, representing 1641 patients. Forest plots for CR based (Supplementary Figures 3–5), PR (Supplementary Figures 6 - 8) and ORR (Figures 1–3) are stratified by biomarker status. There were few documented completed responders and the pooled CR rate was 5% (95% CI 3% - 7%, I2 = 58%) overall, 8% (95% CI 5% - 10%, I2 = 43%) in PD-L1 positive and 3% (95% CI 1% - 4%, I2 = 48%) in PD-L1 negative patients. The pooled PR rate was 14% (95% CI 10% - 19%, I2 = 72%) overall, 17% (95% CI 14% - 20%, I2 = 15%) in PD-L1 positive and 11% (95% CI 8% - 16%, I2 = 72%) PD-L1 negative patients. The pooled ORR rate was 18% (95% CI 15% - 21%, I2 = 58%) overall, 25% (95% CI 22% - 28%, I2 =5%) in PD-L1 positive and 14% (95% CI 8% - 21%, I2 = 68%) in PD-L1 negative patients.
Fig.1
Forest plot of objective response rate of biomarker positive patients.
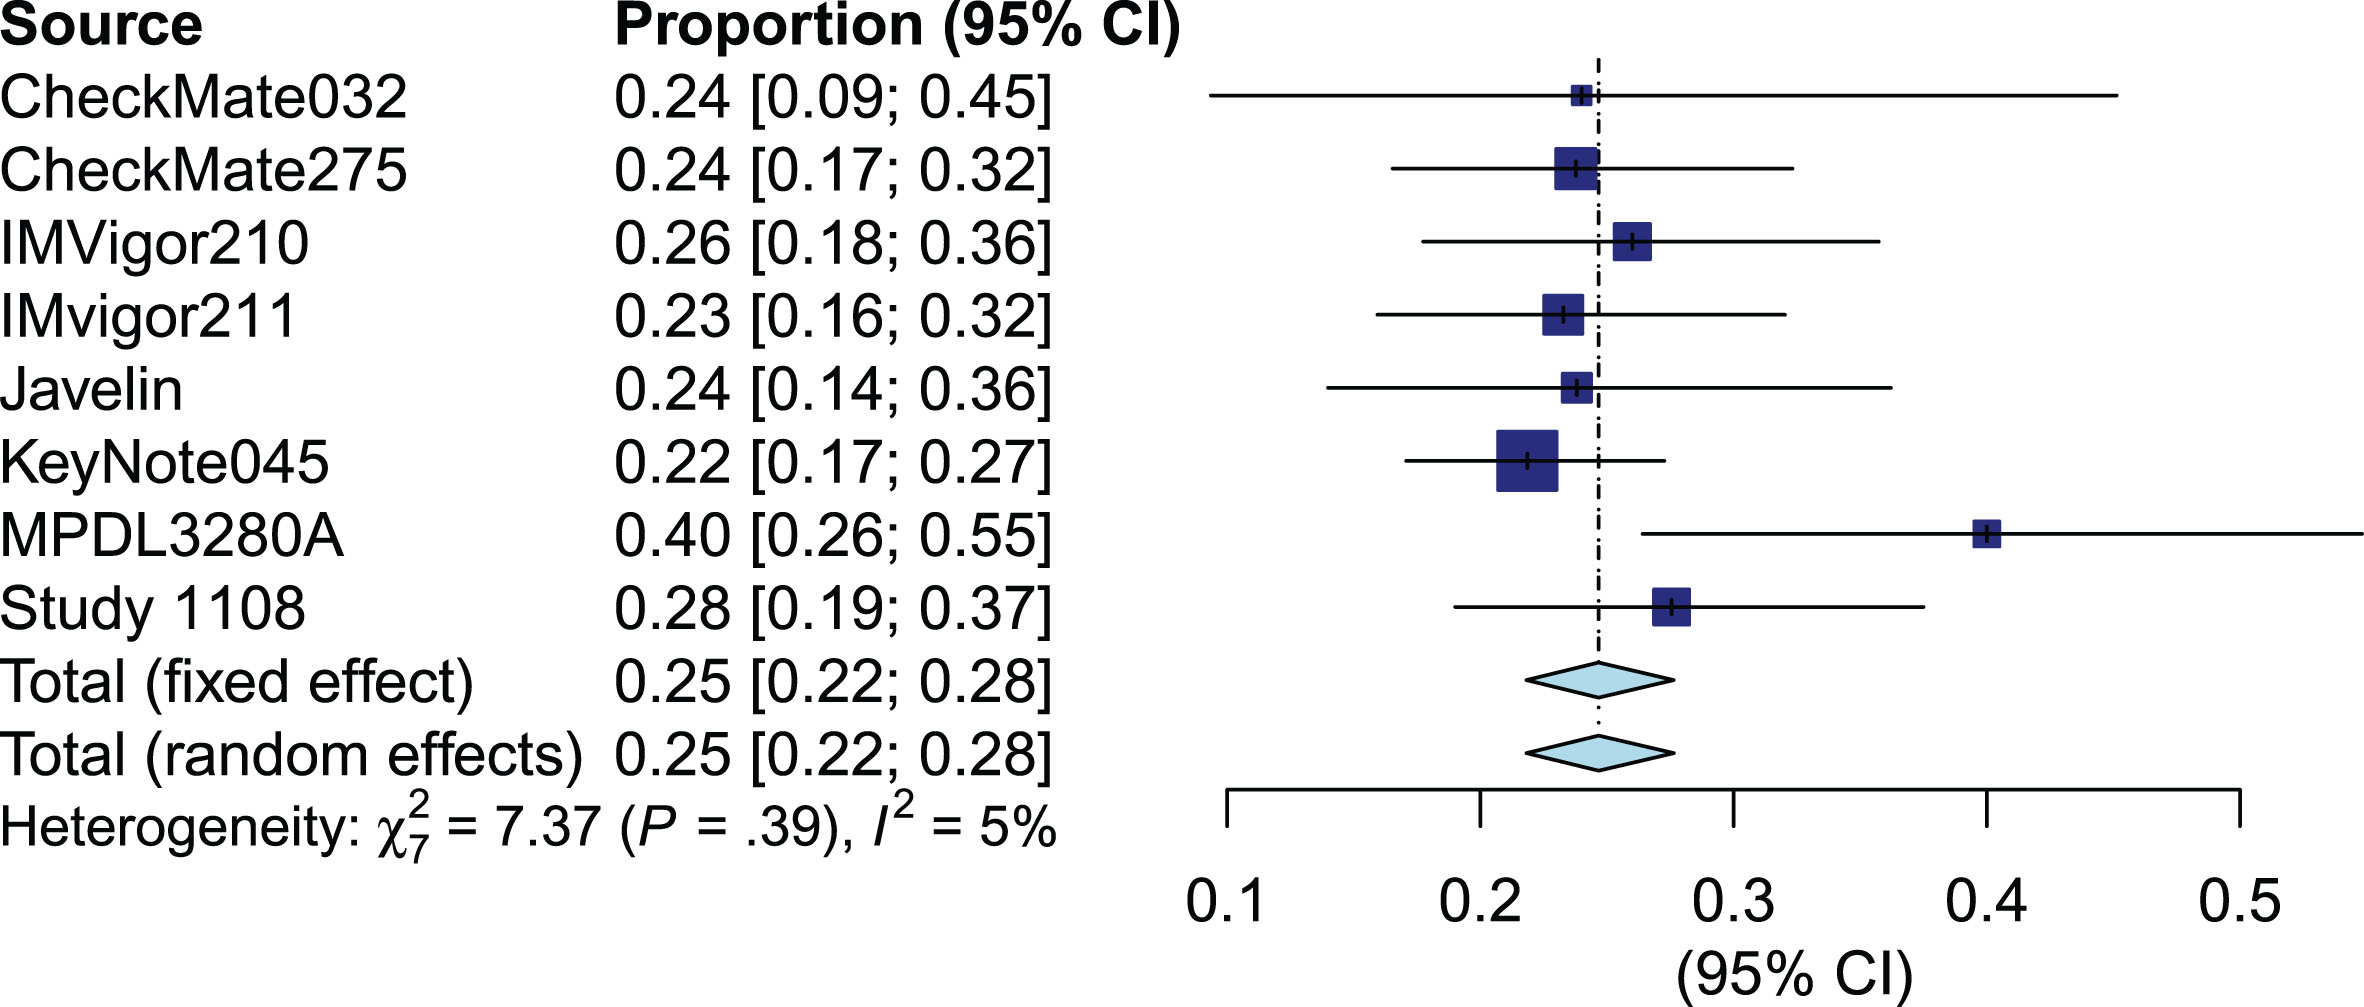
Fig.2
Forest plot of objective response rate of biomarker negative patients.
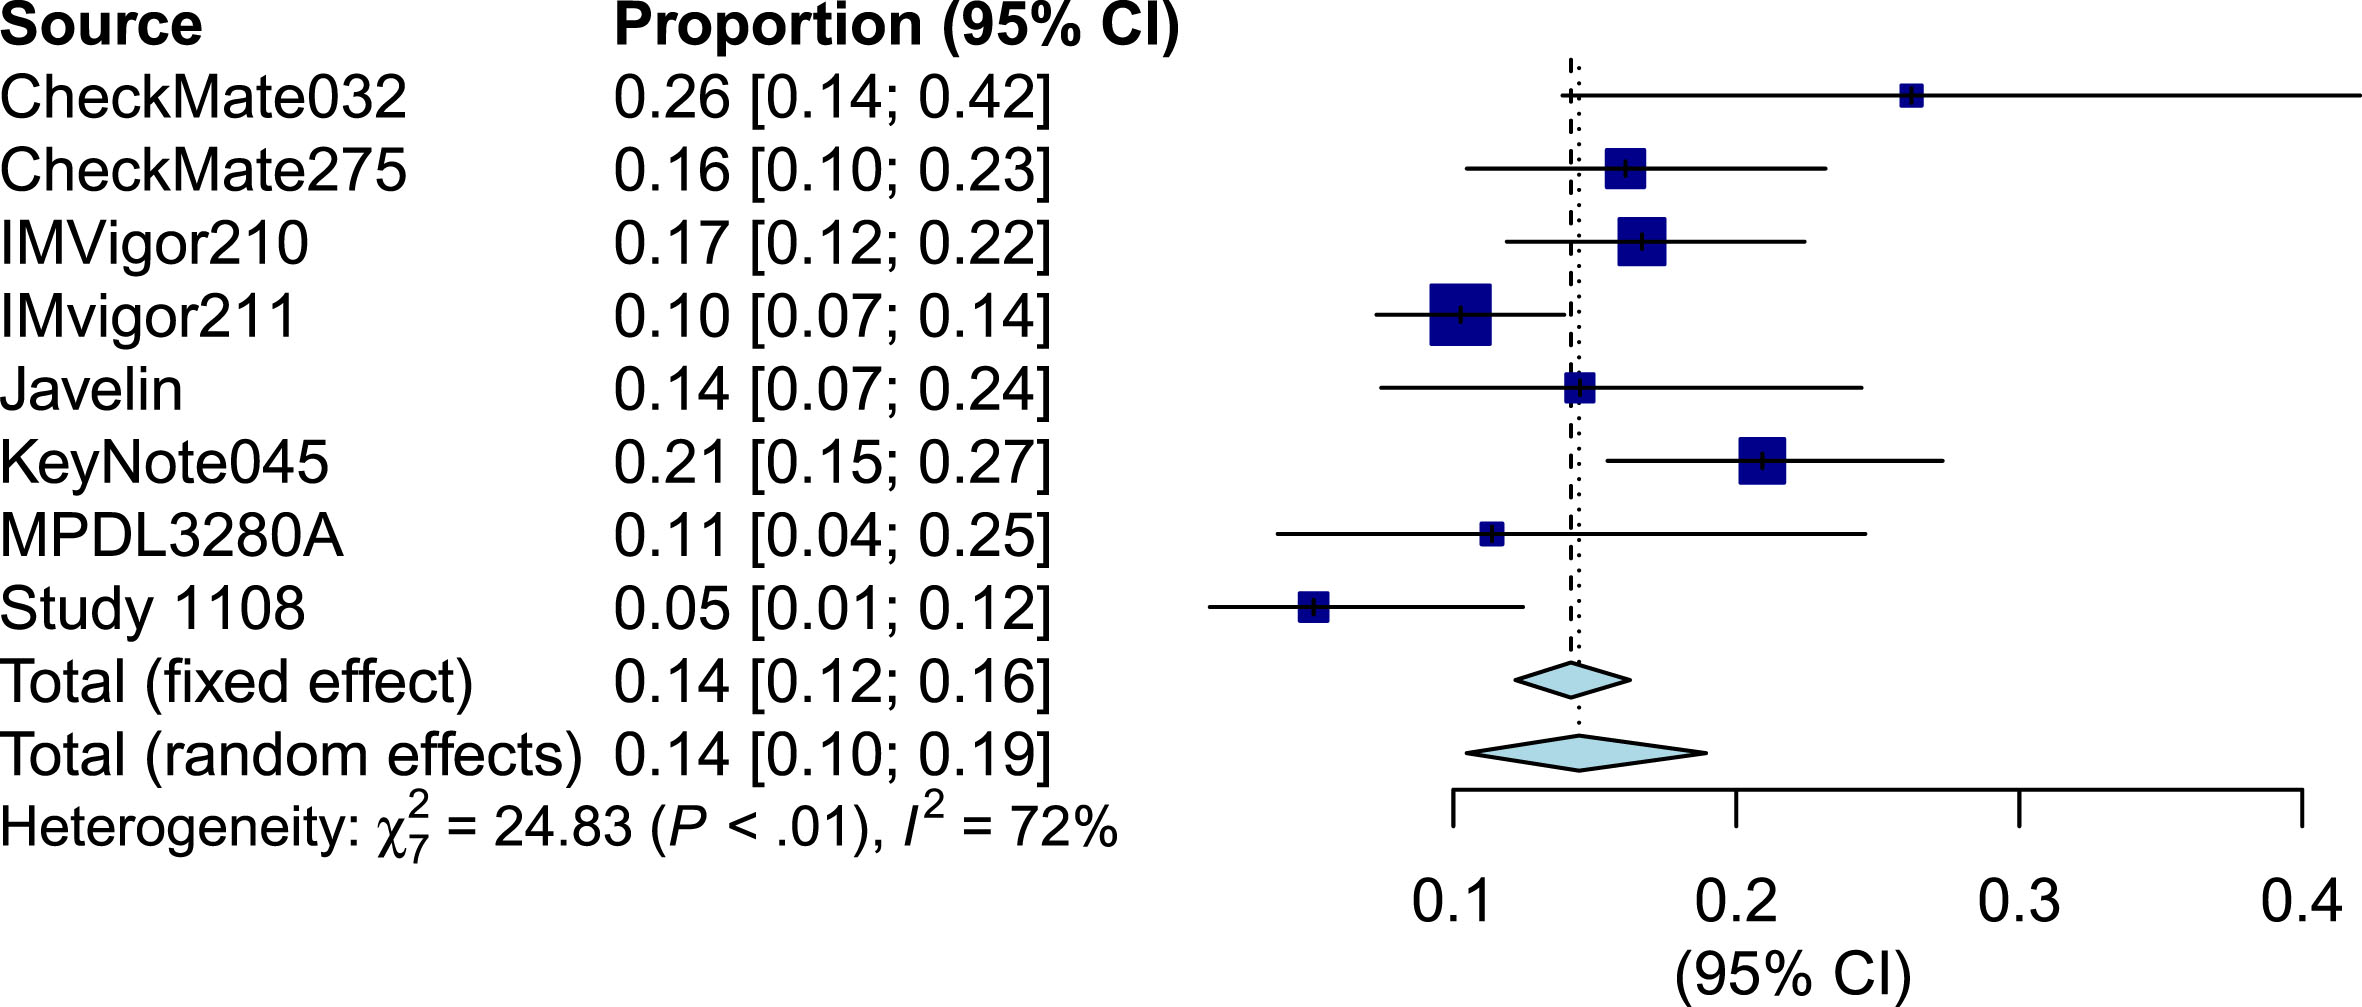
Fig.3
Forest plot of objective response rate of biomarker all patients.
Survival analysis
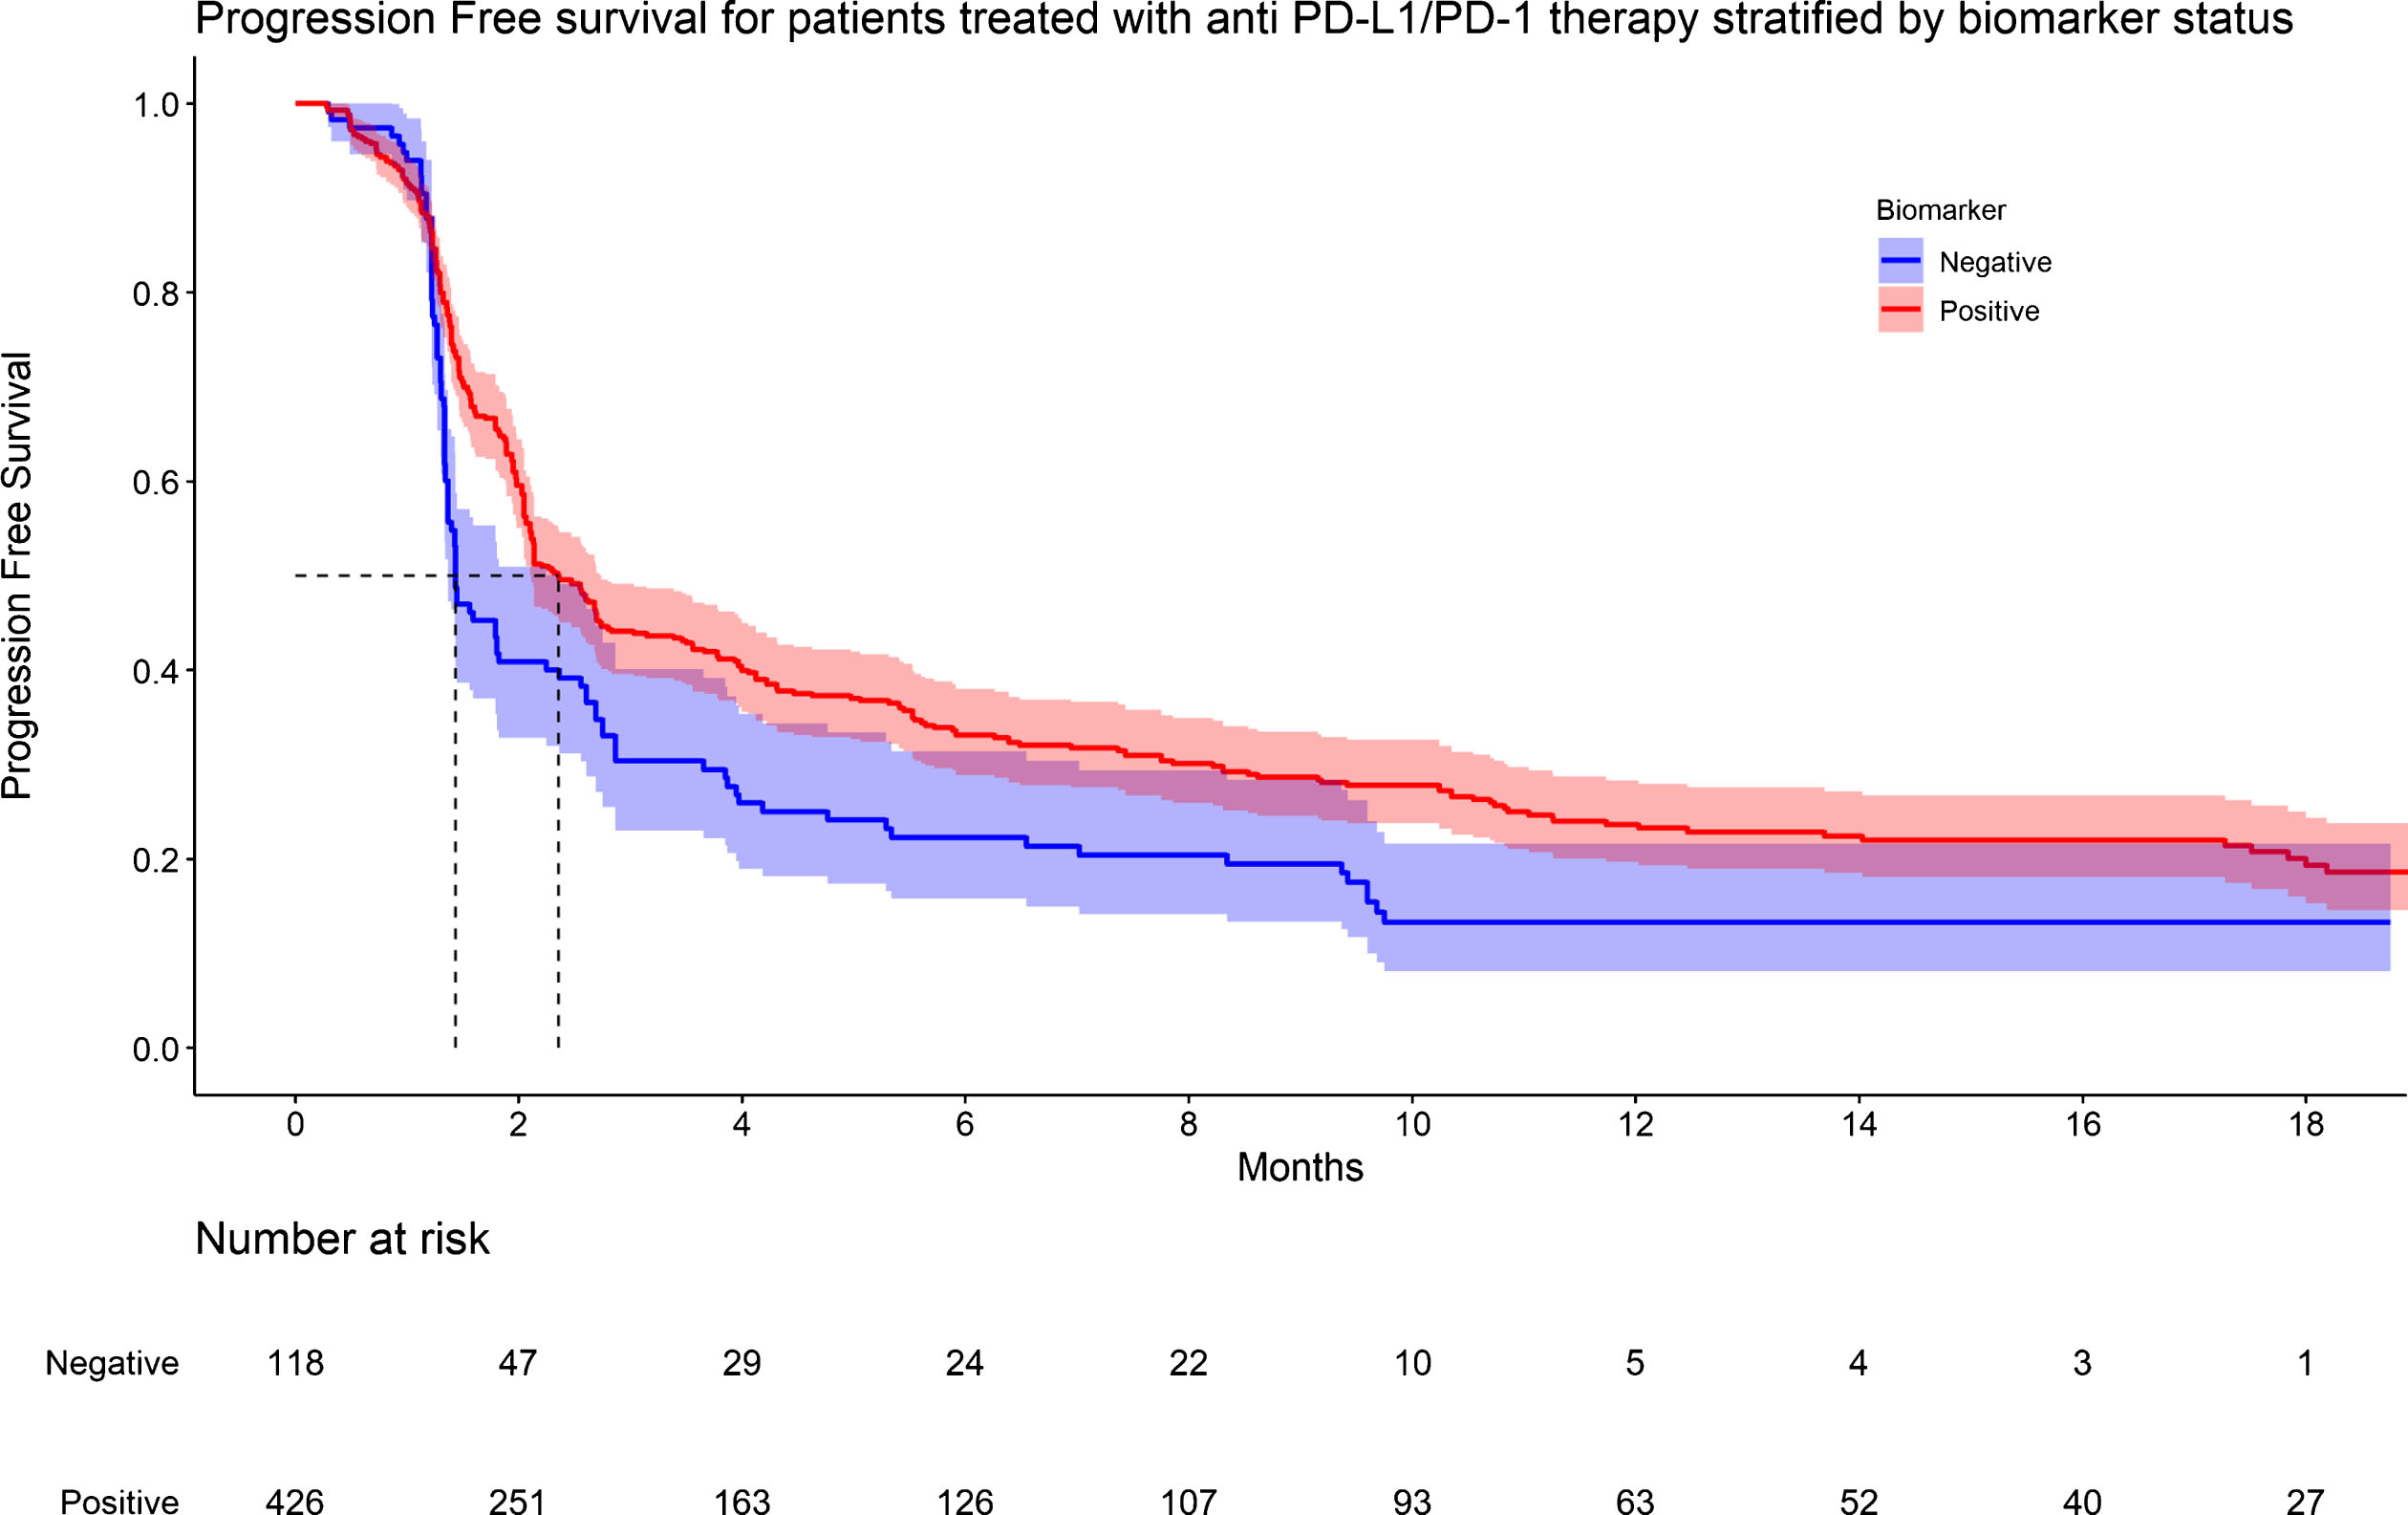
Individual patient survival data were reconstructed from the Kaplan-Meier (KM) survival curves of all eight studies. Meta-analyses of survival curves for OS and PFS, stratified by PD-L1 status are shown in Table 2 and Supplementary Figures 9-14. Of the eight studies, six reported PFS of biomarker positive patients, two reported PFS of biomarker negative patients, all eight reported OS of biomarker positive patients. OS data was available for 1837 patients regardless of biomarker status. However, OS was only available for 648 and 550 patients in the biomarker positive and negative group, respectively, due to poor reporting in individual studies (Figure 4). PFS data was available for 1060 patients treated with ICI. However, PFS was only available for 426 and 118 patients in the biomarker positive and negative group, respectively (Figure 5). Median OS and median PFS are listed in Table 2. On proportional hazards analysis, patients in the biomarker negative group were associated with a lower PFS (HR 1.48, 95% CI: 1.18 - 1.85, p < 0.001) and lower OS (HR 1.54, 95% CI: 1.32 - 1.80, p < 0.001) when compared to the biomarker positive group (Supplementary Figures 15 & 16).
Fig.4
KM graph of overall survival for patients treated with anti PD-L1/PD-1 therapy stratified by biomarker status.
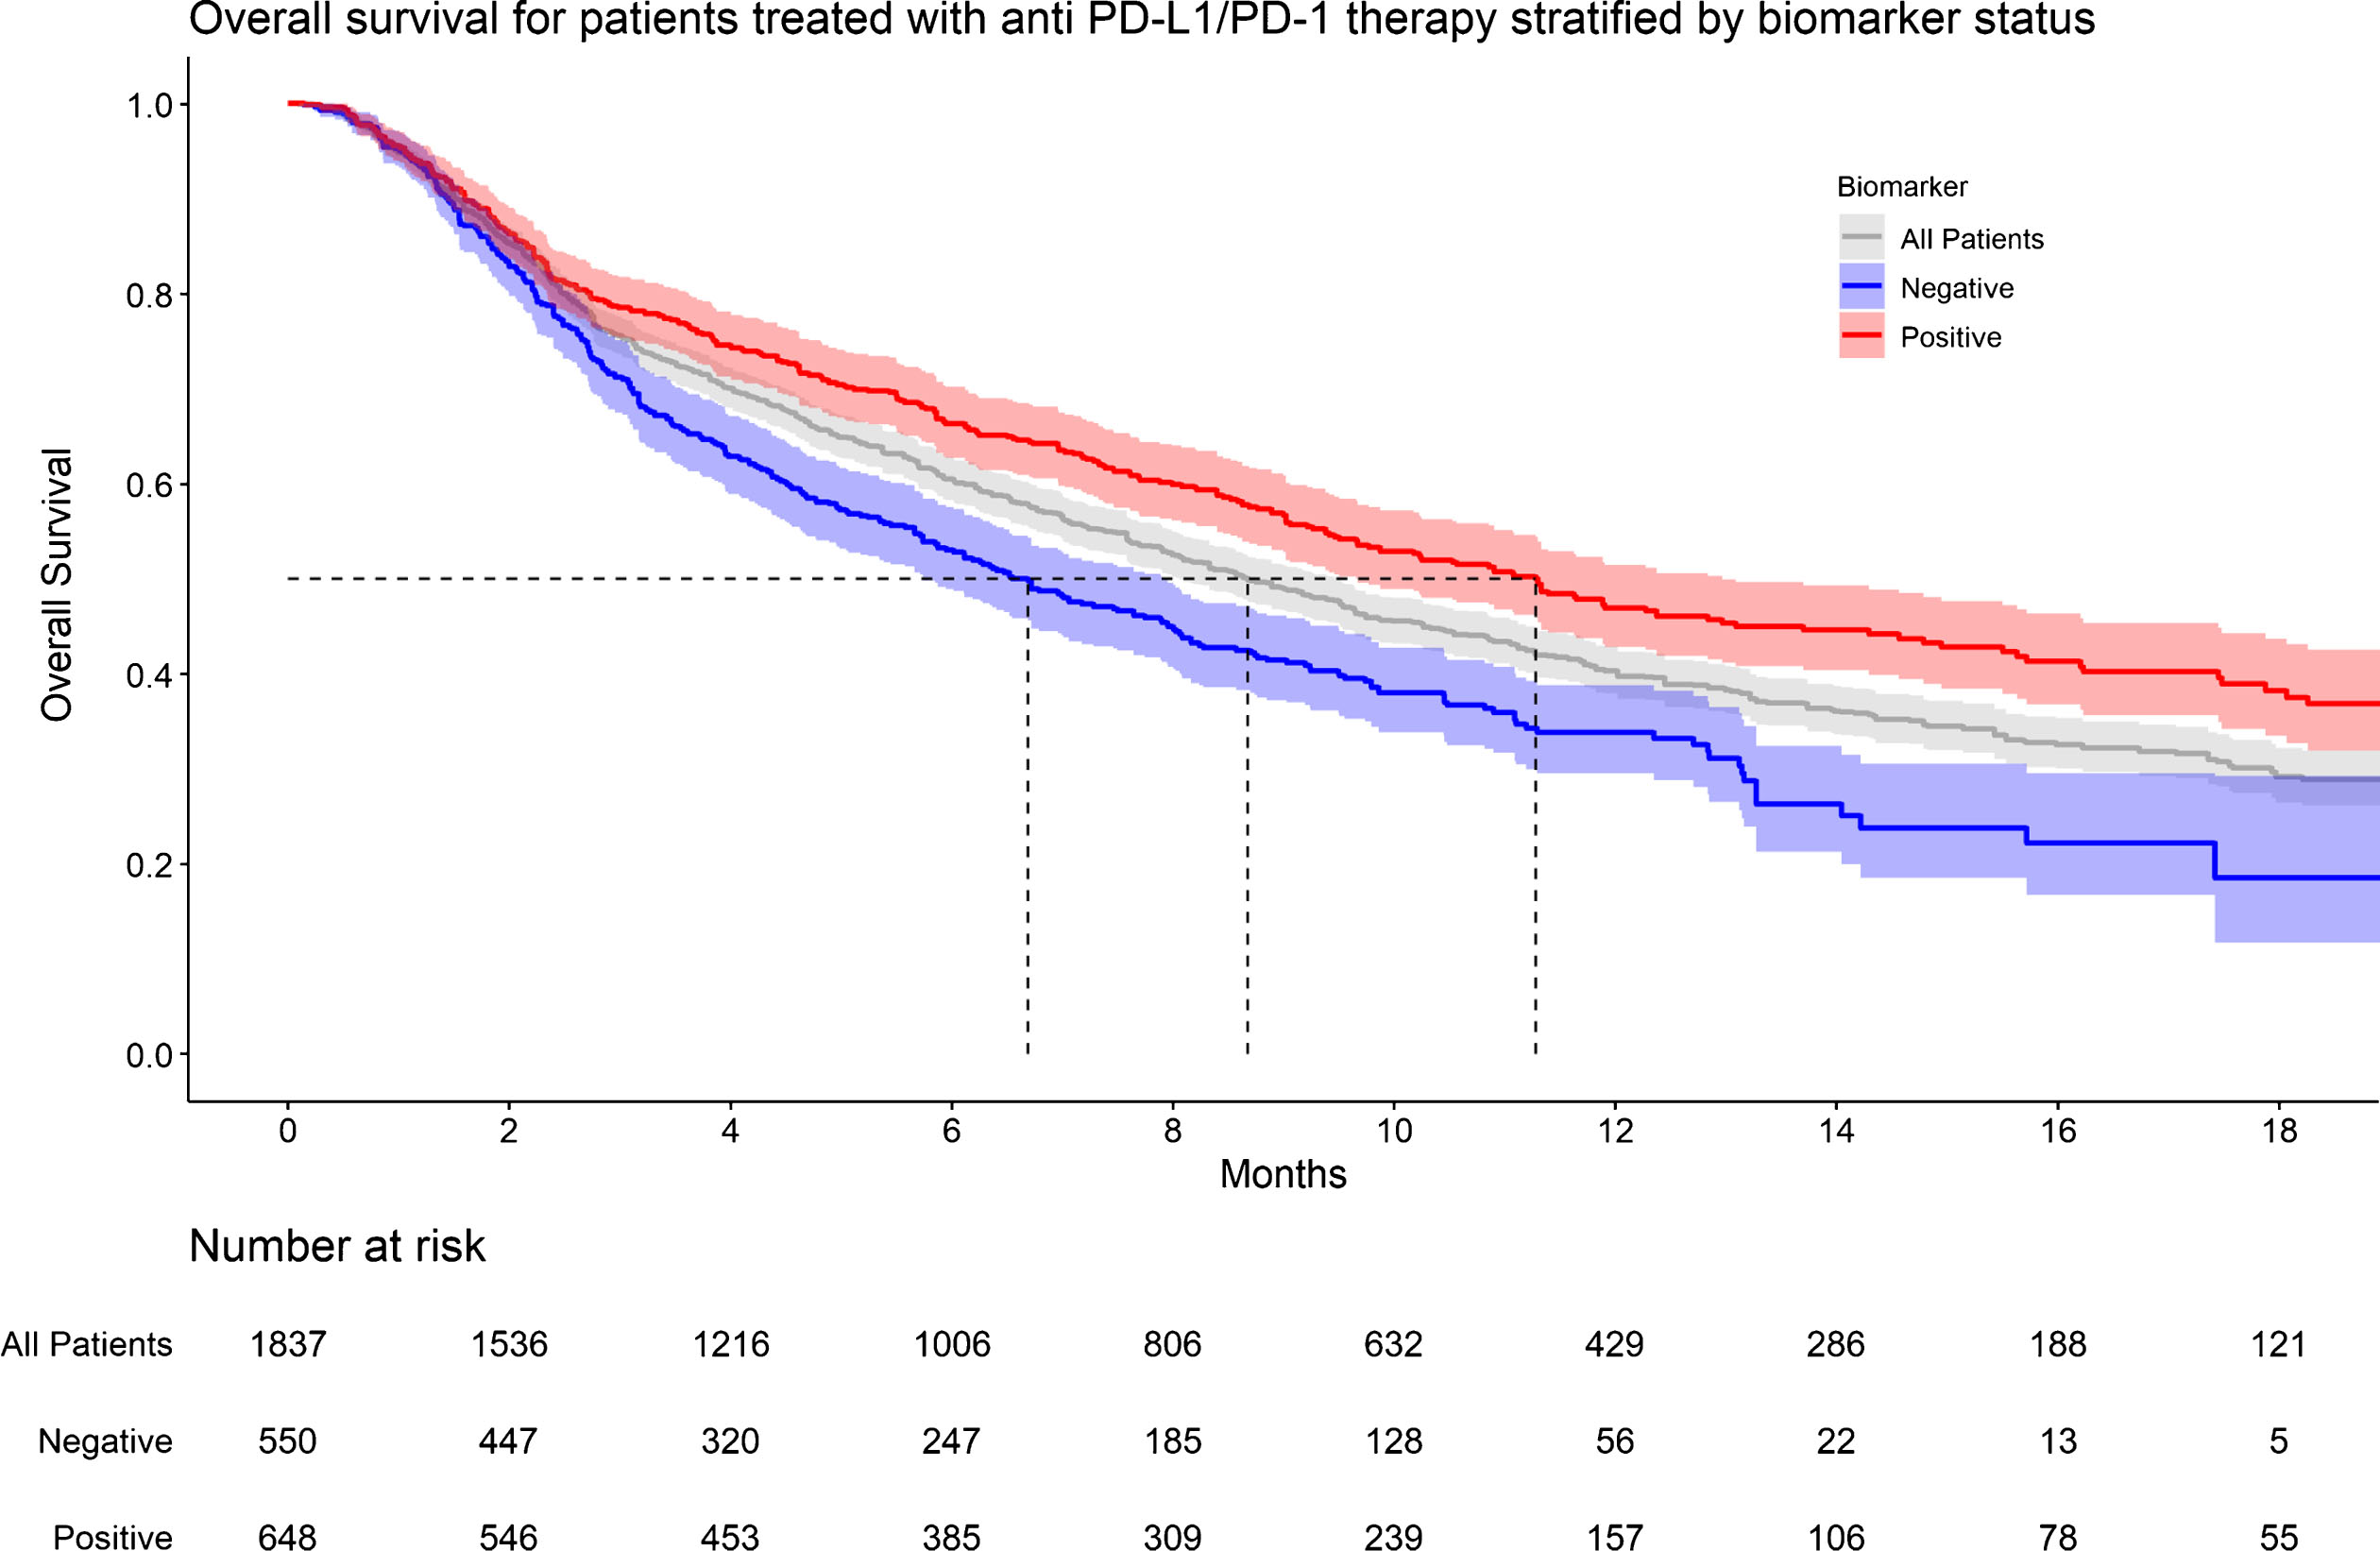
Fig.5
KM graph of progression survival for patients treated with anti PD-L1/PD-1 therapy stratified by biomarker status.
DISCUSSION
PD-L1 measurement by immunohistochemistry, is a controversial biomarker for PD-L1/PD-1 targeted immune checkpoint inhibition. Its prognostic value which has been seen mostly in phase 1 and 2 single-arm trials has not generalized to large phase 3 trials. In the present analysis, we performed a meta-analysis of Kaplan-Meier graphs and pooled pseudo IPD as well as response data from every clinical trial that has utilized PD-L1 immunohistochemistry to determine if PD-L1 status affects outcomes in patients with mUC. We show that the response rates (CR, PR, and ORR) and survival outcomes (PFS and OS) are better in PD-L1 positive patients than in negative patients.
To date, only one trial, IMvigor211, has powered a study based of PD-L1 status. IMvigor211’s primary endpoint was OS of Atezolizumab vs second line chemotherapy in biomarker positive patients. Biomarker positive patients did better with Atezolizumab (median OS 11.1 months) than second line chemotherapy (median OS 10.6 months), but the hazard ratio for this survival difference was only 0.87 (95% CI 0.63 – 1.21), indicating that the trial was likely underpowered for its primary end point. Hence, this meta-analysis was designed to determine if biomarker status affected survival outcome and response rate in a larger cohort of patients. We utilized a method to obtain pseudo IPD from multiple single arm clinical trials and subgroup analysis of randomized controlled trials, allowing for a direct comparison between patients who test positive and negative for PD-L1 biomarker.
The rationale for stratifying patients with a biomarker is to determine which patients are more likely to benefit from ICI therapy. However, it is obvious from the present analysis that some patients who are biomarker negative do appear to benefit from PD-L1/PD-1 targeted therapy and some (albeit rare) are even able to achieve a complete response.
In this study, we only sought to evaluate patients who were post-platinum therapy for a number of reasons. To date, there has only two phase 2 clinical trials (IMvigor210- cohort 1 and KEYNOTE-052) that enrolled patients who were ineligible for cisplatin. We chose not to include these two trials into the analysis as we wanted a cleaner analysis and felt the addition of 123 patients from IMVigor210 and 374 patients from KEYNOTE-052 would have resulted in a cohort that consist of 75% of patients that were post-platinum therapy, muddying the analysis. More importantly, overall survival data from KEYNOTE-052 was not presented in a KM graph format and progression free survival data was not stratified based on biomarker positivity. Hence, there was no way to generate pseudo IPD for this cohort of patients that would make up the bulk of patients who were platinum-ineligible.
For the purpose of the study, we utilized the same definitions of “positive” biomarker testing utilized in the clinical trials. This is because there is no standardized format to assess PD-L1 immunohistochemically. Although different, all the essays that were utilized in their respective clinical trial for their respective drug are immunohistochemistry tissue-based assays to detect membrane expression of PD-L1. Extrapolating data from the non-small cell lung cancer (NSCLC) data, Ratcliffe et al found > 90% concordance at several levels of PD-L1 expression when comparing Dako 28-8 (nivolumab), Ventana SP263 (Durvalumab) and Dako 22C3 (pembrolizumab) [31]. Unfortunately, similar studies comparing PD-L1 essays for urothelial cancer has not been performed.
Our study has several limitations. Firstly, as with all meta-analyses, the methodology of the current study results is limited by the same biases found in the individual trials that were pooled in the meta-analysis. Our analysis predominantly consisted of non-randomized trials (phase 1 and 2 which are lower quality), and clinical trials are also associated with “trial effect”, where patients treated with standard of care tend to do better than expected. Also, OS and PFS based on biomarker status were underpowered subgroup analyses in most of these studies. To overcome these limitations, we used available data to generate pseudo IPD for survival outcomes, which allowed us to pool survival data across multiple studies, a significant strength. Another weakness is that the PD-L1 biomarker was measured in different ways in each study as pointed out above (Table 1). We were unable to omit patients who were platinum ineligible from the pooled study, hence only 96% of patients were post-platinum therapy. We also carried out the present study based on available data that has been published, hence no individual-level clinicopathological variables were examined, meaning that the survival curves were unadjusted for confounding. However, our method included censored data in this time-to-event analysis and recapitulates outcomes that occur over time.
Despite these limitations, we present a meta-analysis of pseudo IPD and pooled response data, incorporating every clinical trial on anti PD-L1/PD-1 therapy for metastatic urothelial carcinoma. This is the largest study to date comparing survival outcomes and response rates in post platinum mUC patients stratified by PD-L1 biomarker status.
CONCLUSIONS
In summary, PD-L1/PD-1 targeted therapy for mUC post platinum therapy has a higher ORR, OS and PFS in patients who are biomarker positive compared to those who are biomarker negative. However, some rare biomarker negative patients can achieve complete responses and other biomarker negative patients may derive some therapeutic benefit. Hence, a better biomarker for patient selection is essential before biomarkers can be used to stratify candidates for ICI therapy.
FUNDING
Wei Phin Tan is supported by the National Cancer Institute Ruth L. Kirschstein NRSA Institutional Research Training Grant (T32 CA093245).
AUTHOR CONTRIBUTIONS
Conception: Wei Phin Tan, Brant A. Inman
Performance: Wei Phin Tan, Wei Shen Tan
Interpretation of data: Wei Phin Tan, Wei Shen Tan
Drafting of manuscript: Wei Phin Tan
Editing of manuscript: Wei Shen Tan, Brant A. Inman
CONFLICT OF INTEREST
The authors have no conflict of interest to report.
ACKNOWLEDGMENTS
The authors have no acknowledgements.
SUPPLEMENTARY MATERIAL
[1] The supplementary material is available in the electronic version of this article: 10.3233/BLC-190238.
Appendices
Appendix 1
AMSTAR grading criteria for systematic review
 |
Appendix 2
Search criteria in Pubmed and EMBASE
| Database: Pubmed |
| Search Strategy: |
| (“urothelial”[MeSH Terms] OR “carcinoma, transitional cell”[MeSH Terms]) OR “urinary bladder neoplasms”[MeSH Terms] OR “urinary bladder neoplasms”[MeSH Terms] OR “urinary bladder neoplasms”[MeSH Terms]) AND (“b7-h1 antigen”[MeSH Terms] OR “programmed cell death 1 receptor”[MeSH Terms]) OR “programmed cell death 1 receptor”[MeSH Terms] OR “b7-h1 antigen”[MeSH Terms] OR avelumab OR atezolizumab OR durvalumab OR nivolumab OR pembrolizumab) AND (Clinical Trial, Phase III[ptyp] OR Clinical Trial, Phase I[ptyp] OR Clinical Trial, Phase II[ptyp]) |
| Database: EMBASE |
| Search Strategy: |
| ((’atezolizumab’/exp OR atezolizumab OR ‘pembrolizumab’/exp OR pembrolizumab OR ‘avelumab’/exp OR avelumab OR ‘durvalumab’/exp OR durvalumab OR ‘nivolumab’/exp OR nivolumab AND ‘bladder cancer’/exp OR ‘bladder cancer’ OR ‘urothelial cancer’/exp OR ‘urothelial cancer’ OR ‘transitional cell carcinoma’/exp OR ‘transitional cell carcinoma’) |
| OR |
| (’bladder cancer’/exp OR ‘bladder cancer’ OR ‘urothelial cancer’/exp OR ‘urothelial cancer’ OR ‘transitional cell carcinoma’/exp OR ‘transitional cell carcinoma’ AND ‘pd l1 antibody’/exp OR ‘pd l1 antibody’ OR ‘programmed death 1 receptor’/exp OR ‘programmed death 1 receptor’ OR ‘pd l1 protein’/exp OR ‘pd l1 protein’ OR ‘programmed death 1 ligand 1’/exp OR ‘programmed death 1 ligand 1’)) |
| AND (’phase 2 clinical trial (topic)’/de OR ‘phase 3 clinical trial (topic)’/de) AND ‘phase 1 clinical trial (topic)’/de |
Appendix 3
PRISMA checklist
| Section/topic | # | Checklist item | Reported on page # |
| TITLE | |||
| Title | 1 | Identify the report as a literature review. | 1 |
| ABSTRACT | |||
| Structured summary | 2 | Provide a structured summary including, as applicable: background; objectives; data sources; study eligibility criteria, participants, and interventions; study appraisal and synthesis methods; results; limitations; conclusions and implications of key findings; | 1 |
| INTRODUCTION | |||
| Rationale | 3 | Describe the rationale for the review in the context of what is already known about your topic. | 1 – 2 |
| Objectives | 4 | Provide an explicit statement of questions being addressed with reference to participants, interventions, comparisons, outcomes, and study design (PICOS). | 2 |
| METHODS | |||
| Eligibility criteria | 5 | Specify study characteristics (e.g., PICOS, length of follow-up) and report characteristics (e.g., years considered, language, publication status) used as criteria for eligibility, giving rationale. | 2 - 3 |
| Information sources | 6 | Describe all information sources (e.g., databases with dates of coverage) in the search and date last searched. | 2 |
| Search | 7 | Present full electronic search strategy for at least one database, including any limits used, such that it could be repeated. | Appendix 2 |
| Study selection | 8 | State the process for selecting studies (i.e., screening, eligibility). | 2 – 3 |
| Risk of bias in individual studies | 9 | Describe methods used for assessing risk of bias of individual studies (including specification of whether this was done at the study or outcome level). | 3 |
| Risk of bias across studies | 10 | Specify any assessment of risk of bias that may affect the cumulative evidence (e.g., publication bias, selective reporting within studies). | 3 |
| RESULTS | |||
| Study selection | 11 | Give numbers of studies screened, assessed for eligibility, and included in the review, with reasons for exclusions at each stage, ideally with a flow diagram. | Page 3, 5 & S Figure 1 |
| Study characteristics | 12 | For each study, present characteristics for which data were extracted (e.g., study size, PICOS, follow-up period) and provide the citations. | Page 5 & Tables 2–3 |
| Synthesis of results of individual studies | 13 | For all outcomes considered (benefits or harms), present, for each study: (a) summary of results and (b) relationship to other studies under review (e.g. agreements or disagreements in methods, sampling, data collection or findings). | 5 |
| Figure 1–5 | |||
| S Figures 3–16 | |||
| DISCUSSION | |||
| Summary of evidence | 14 | Summarize the main findings including the strength of evidence for each main outcome; consider their relevance to key groups (e.g., healthcare providers, users, and policy makers). | 5 – 9 |
| Limitations | 15 | Discuss limitations at study and outcome level (e.g., risk of bias), and at review-level (e.g., incomplete retrieval of identified research, reporting bias). | 9 |
| CONCLUSION | |||
| Conclusions | 16 | Provide a general interpretation of the results in the context of other evidence, and implications for future research. | 9 |
Adapted from: Moher D, Liberati A, Tetzlaff J, Altman DG, The PRISMA Group (2009). Preferred Reporting Items for Systematic Reviews and Meta-Analyses: The PRISMA statement. PLoS Medicine, 6(6), e1000097. doi:10.1371/journal.pmed1000097.
REFERENCES
[1] | Powles T , Duran I , van der Heijden MS , Loriot Y , Vogelzang NJ , De Giorgi U , et al. Atezolizumab versus chemotherapy in patients with platinum-treated locally advanced or metastatic urothelial carcinoma (IMvigor211): a multicentre, open-label, phase 3 randomised controlled trial. Lancet (London, England). (2018) ;391: (10122):748–57. |
[2] | Petrylak DP , Powles T , Bellmunt J , Braiteh F , Loriot Y , Morales-Barrera R , et al. Atezolizumab (MPDL3280A) Monotherapy for Patients With Metastatic Urothelial Cancer: Long-term Outcomes From a Phase 1 StudyAtezolizumab Monotherapy for Patients With Metastatic Urothelial CancerAtezolizumab Monotherapy for Patients With Metastatic Urothelial Cancer. JAMA Oncology. (2018) ;4: (4):537–44. |
[3] | Rosenberg JE , Hoffman-Censits J , Powles T , van der Heijden MS , Balar AV , Necchi A , et al. Atezolizumab in patients with locally advanced and metastatic urothelial carcinoma who have progressed following treatment with platinum-based chemotherapy: a single-arm, multicentre, phase 2 trial. Lancet (London, England). (2016) ;387: (10031):1909–20. |
[4] | Patel MR , Ellerton J , Infante JR , Agrawal M , Gordon M , Aljumaily R , et al. Avelumab in metastatic urothelial carcinoma after platinum failure (JAVELIN Solid Tumor): pooled results from two expansion cohorts of an open-label, phase 1 trial. The Lancet Oncology. (2018) ;19: (1):51–64. |
[5] | Powles T , O’Donnell PH , Massard C , Arkenau H-T , Friedlander TW , Hoimes CJ , et al. Efficacy and Safety of Durvalumab in Locally Advanced or Metastatic Urothelial Carcinoma: Updated Results From a Phase 1/2 Open-label StudyDurvalumab in Locally Advanced or Metastatic Urothelial CarcinomaDurvalumab in Locally Advanced or Metastatic Urothelial Carcinoma. JAMA Oncology. (2017) ;3: (9):e172411-e. |
[6] | Sharma P , Callahan MK , Bono P , Kim J , Spiliopoulou P , Calvo E , et al. Nivolumab monotherapy in recurrent metastatic urothelial carcinoma (CheckMate 032): a multicentre, open-label, two-stage, multi-arm, phase 1/2 trial. The Lancet Oncology. (2016) ;17: (11):1590–8. |
[7] | Sharma P , Retz M , Siefker-Radtke A , Baron A , Necchi A , Bedke J , et al. Nivolumab in metastatic urothelial carcinoma after platinum therapy (CheckMate 275): A multicentre, single-arm, phase 2 trial. The Lancet Oncology. (2017) ;18: (3):312–22. |
[8] | Bellmunt J , De Wit R , Vaughn DJ , Fradet Y , Lee J-L , Fong L , et al. Pembrolizumab as second-line therapy for advanced urothelial carcinoma. New England Journal of Medicine. (2017) ;376: (11):1015–26. |
[9] | Bellmunt J , de Wit R , Vaughn DJ , Fradet Y , Lee J-L , Fong L , et al. Pembrolizumab as Second-Line Therapy for Advanced Urothelial Carcinoma. New England Journal of Medicine. (2017) ;376: (11):1015–26. |
[10] | Williamson PR , Smith CT , Hutton JL , Marson AG . Aggregate data meta-analysis with time-to-event outcomes. Statistics in Medicine. (2002) ;21: (22):3337–51. |
[11] | Sargent DJ . A general framework for random effects survival analysis in the Cox proportional hazards setting. Biometrics. (1998) ;54: (4):1486–97. |
[12] | Whitehead A . Meta-analysis of Controlled Clinical Trials: John Wiley & Sons; (2002) . |
[13] | Moodie PF , Nelson NA , Koch GG . A non-parametric procedure for evaluating treatment effect in the meta-analysis of survival data. Statistics in Medicine. (2004) ;23: (7):1075–93. |
[14] | Perneger TV . Estimating the relative hazard by the ratio of logarithms of event-free proportions. Contemp Clin Trials. (2008) ;29: (5):762–6. |
[15] | Combescure C , Foucher Y , Jackson D . Meta-analysis of single-arm survival studies: A distribution-free approach for estimating summary survival curves with random effects. Statistics in Medicine. (2014) ;33: (15):2521–37. |
[16] | Higgins J , Green S . Cochrane handbook for systematic reviews of interventions Version 5.1. 0 [updated March 2011]. 2011. The Cochrane Collaboration. (2014) . |
[17] | Moher D , Liberati A , Tetzlaff J , Altman DG . Preferred reporting items for systematic reviews and meta-analyses: The PRISMA statement. Annals of Internal Medicine. (2009) ;151: (4):264–9. |
[18] | Higgins JPGS . Cochrane Handbook for Systematic Reviews of Interventions. Wiley Online Library. (2011) . |
[19] | Downs SH , Black N . The feasibility of creating a checklist for the assessment of the methodological quality both of randomised and non-randomised studies of health care interventions. Journal of Epidemiology & Community Health. (1998) ;52: (6):377–84. |
[20] | Silverman S , Schertz L , Yuen H , Lowman J , Bickel C . Systematic review of the methodological quality and outcome measures utilized in exercise interventions for adults with spinal cord injury. Spinal Cord. (2012) ;50: (10):718. |
[21] | Hooper P , Jutai JW , Strong G , Russell-Minda E . Age-related macular degeneration and low-vision rehabilitation: A systematic review. Canadian Journal of Ophthalmology. (2008) ;43: (2):180–7. |
[22] | DerSimonian R , Laird N . Meta-analysis in clinical trials. Controlled Clinical Trials. (1986) ;7: (3):177–88. |
[23] | Trikalinos TADI , Lee J , Moorthy D . AHRQ methods for effective health care Defining an Optimal Format for Presenting Research Needs. Rockville: Agency for Healthcare Research and Quality (US). (2011) . |
[24] | Viechtbauer W . Bias and efficiency of meta-analytic variance estimators in the random-effects model. Journal of Educational and Behavioral Statistics. (2005) ;30: (3):261–93. |
[25] | Rohatgi A . WebPlotDigitizer Version 4.1. |
[26] | Tierney JF , Stewart LA , Ghersi D , Burdett S , Sydes MR . Practical methods for incorporating summary time-to-event data into meta-analysis. Trials. (2007) ;8: :16. |
[27] | Guyot P , Ades AE , Ouwens MJ , Welton NJ . Enhanced secondary analysis of survival data: reconstructing the data from published Kaplan-Meier survival curves. BMC Medical Research Methodology. (2012) ;12: :9. |
[28] | Combescure C , Foucher Y , Jackson D . Meta-analysis of single-arm survival studies: A distribution-free approach for estimating summary survival curves with random effects. Statistics in Medicine. (2014) ;33: (15):2521–37. |
[29] | Egger M , Smith GD , Schneider M , Minder C . Bias in meta-analysis detected by a simple, graphical test. Bmj. (1997) ;315(7109):629–34. |
[30] | Begg CB , Mazumdar M . Operating characteristics of a rank correlation test for publication bias. Biometrics. (1994) :1088–101. |
[31] | Ratcliffe MJ , Sharpe A , Midha A , Barker C , Scott M , Scorer P , et al. Agreement between Programmed Cell Death Ligand-1 Diagnostic Assays across Multiple Protein Expression Cutoffs in Non-Small Cell Lung Cancer. Clinical cancer research: An official journal of the American Association for Cancer Research. (2017) ;23: (14):3585–91. |


