
Low Frequency of Intratumor Heterogeneity in Bladder Cancer Tissue Microarrays
Abstract
Background:
Intratumoral heterogeneity (ITH) is associated with clinical challenges such as possible differences in response to treatment and difficulties in classifying the tumor. Previously, ITH has been described in bladder cancer using detailed genetic analyses. However, in this disease, it is not known to what extent ITH actually occurs, or if it involves molecular subtyping, when assessment is achieved by immunohistochemistry (IHC) on the protein level using tissue microarrays (TMAs), the method most widely applied when analyzing large sample numbers.
Objective:
We aimed to investigate ITH by IHC in bladder cancer TMAs.
Methods:
Staining for eleven immunohistochemical markers (CK5, Cyclin D1, E-Cadherin, EGFR, FGFR, GATA3, HER2, p16, p63, P-Cadherin and RB1) was performed, and differences in staining patterns were assessed both within 1981 individual tissue-cores and by comparing two cores from the same tumor in 948 cases according to our pre-specified criteria. Presence of ITH was associated with clinicopathological data such as stage, grade, molecular subtype and survival.
Results:
Intracore ITH in one or several markers was associated with grade 3, stage T1 and the genomically unstable molecular subtype. ITH in three or more markers was found in 5% between cores (intercore heterogeneity) and in 2% within cores (intracore heterogeneity). No association with survival was found for any of the ITH groups.
Conclusions:
We observed ITH in a small proportion of the tumors, suggesting that ITH has only a limited impact on TMA bladder cancer studies.
INTRODUCTION
Intratumoral heterogeneity (ITH) has been highlighted in many different tumor types [1], also within the field of urology [2]. ITH is commonly referred to as spatial diversity in molecular or morphological features within a single tumor or in a primary tumor compared with metastasis. It is hypothesized that the mechanisms behind ITH include genomic instability and driver events in clonal expansion of subpopulations of cells [1]. Accumulating evidence suggests that ITH has consequences such as difference in response to treatment and inaccurate results when assessing expression of biomarkers [3, 4]. Despite studies on clonal evolution in various malignancies, it is not known how ITH should be measured or interpreted. Furthermore, differences in application of methods or definitions of ITH make it difficult to compare studies. It is well recognized that bladder cancer often entails frequent genomic alterations and mutations [5, 6], which might lead to a higher frequency of ITH, and this conclusion is also supported by the results of in-depth investigations of spatial heterogeneity in bladder cancer [7, 8]. However, these recent ITH-studies used next-generation-sequencing (NGS) without morphological correlation or knowledge of presence of non-tumor cells. Analysis of tumor cell phenotype using immunohistochemical (IHC) staining represents another approach for investigating ITH. Tissue microarray (TMA) [9] is a common method in translational research, but to our knowledge no studies have systematically asessed ITH in large TMA-cohorts of bladder cancer. If ITH affects the accuracy of the TMA analysis, such heterogeneity may partly explain why many investigated biomarkers have not yet reached clinical use [10].
Identification of molecular subtypes in bladder cancer [6, 11–13] has increased our molecular knowledge about bladder cancer and could be a future aid for risk stratification of patients [14] or prediction of treatment response [15]. It has not yet been systematically investigated whether multiple bladder cancer subtypes can be present in a single tumor, or if ITH interferes with subtype classification. Thus, our aim was to examine whether ITH is associated with clinicopathological variables such as grade, stage or molecular subtype and to establish the relative frequency of ITH in TMA-sections from a cohort of 1024 bladder tumors.
MATERIALS AND METHODS
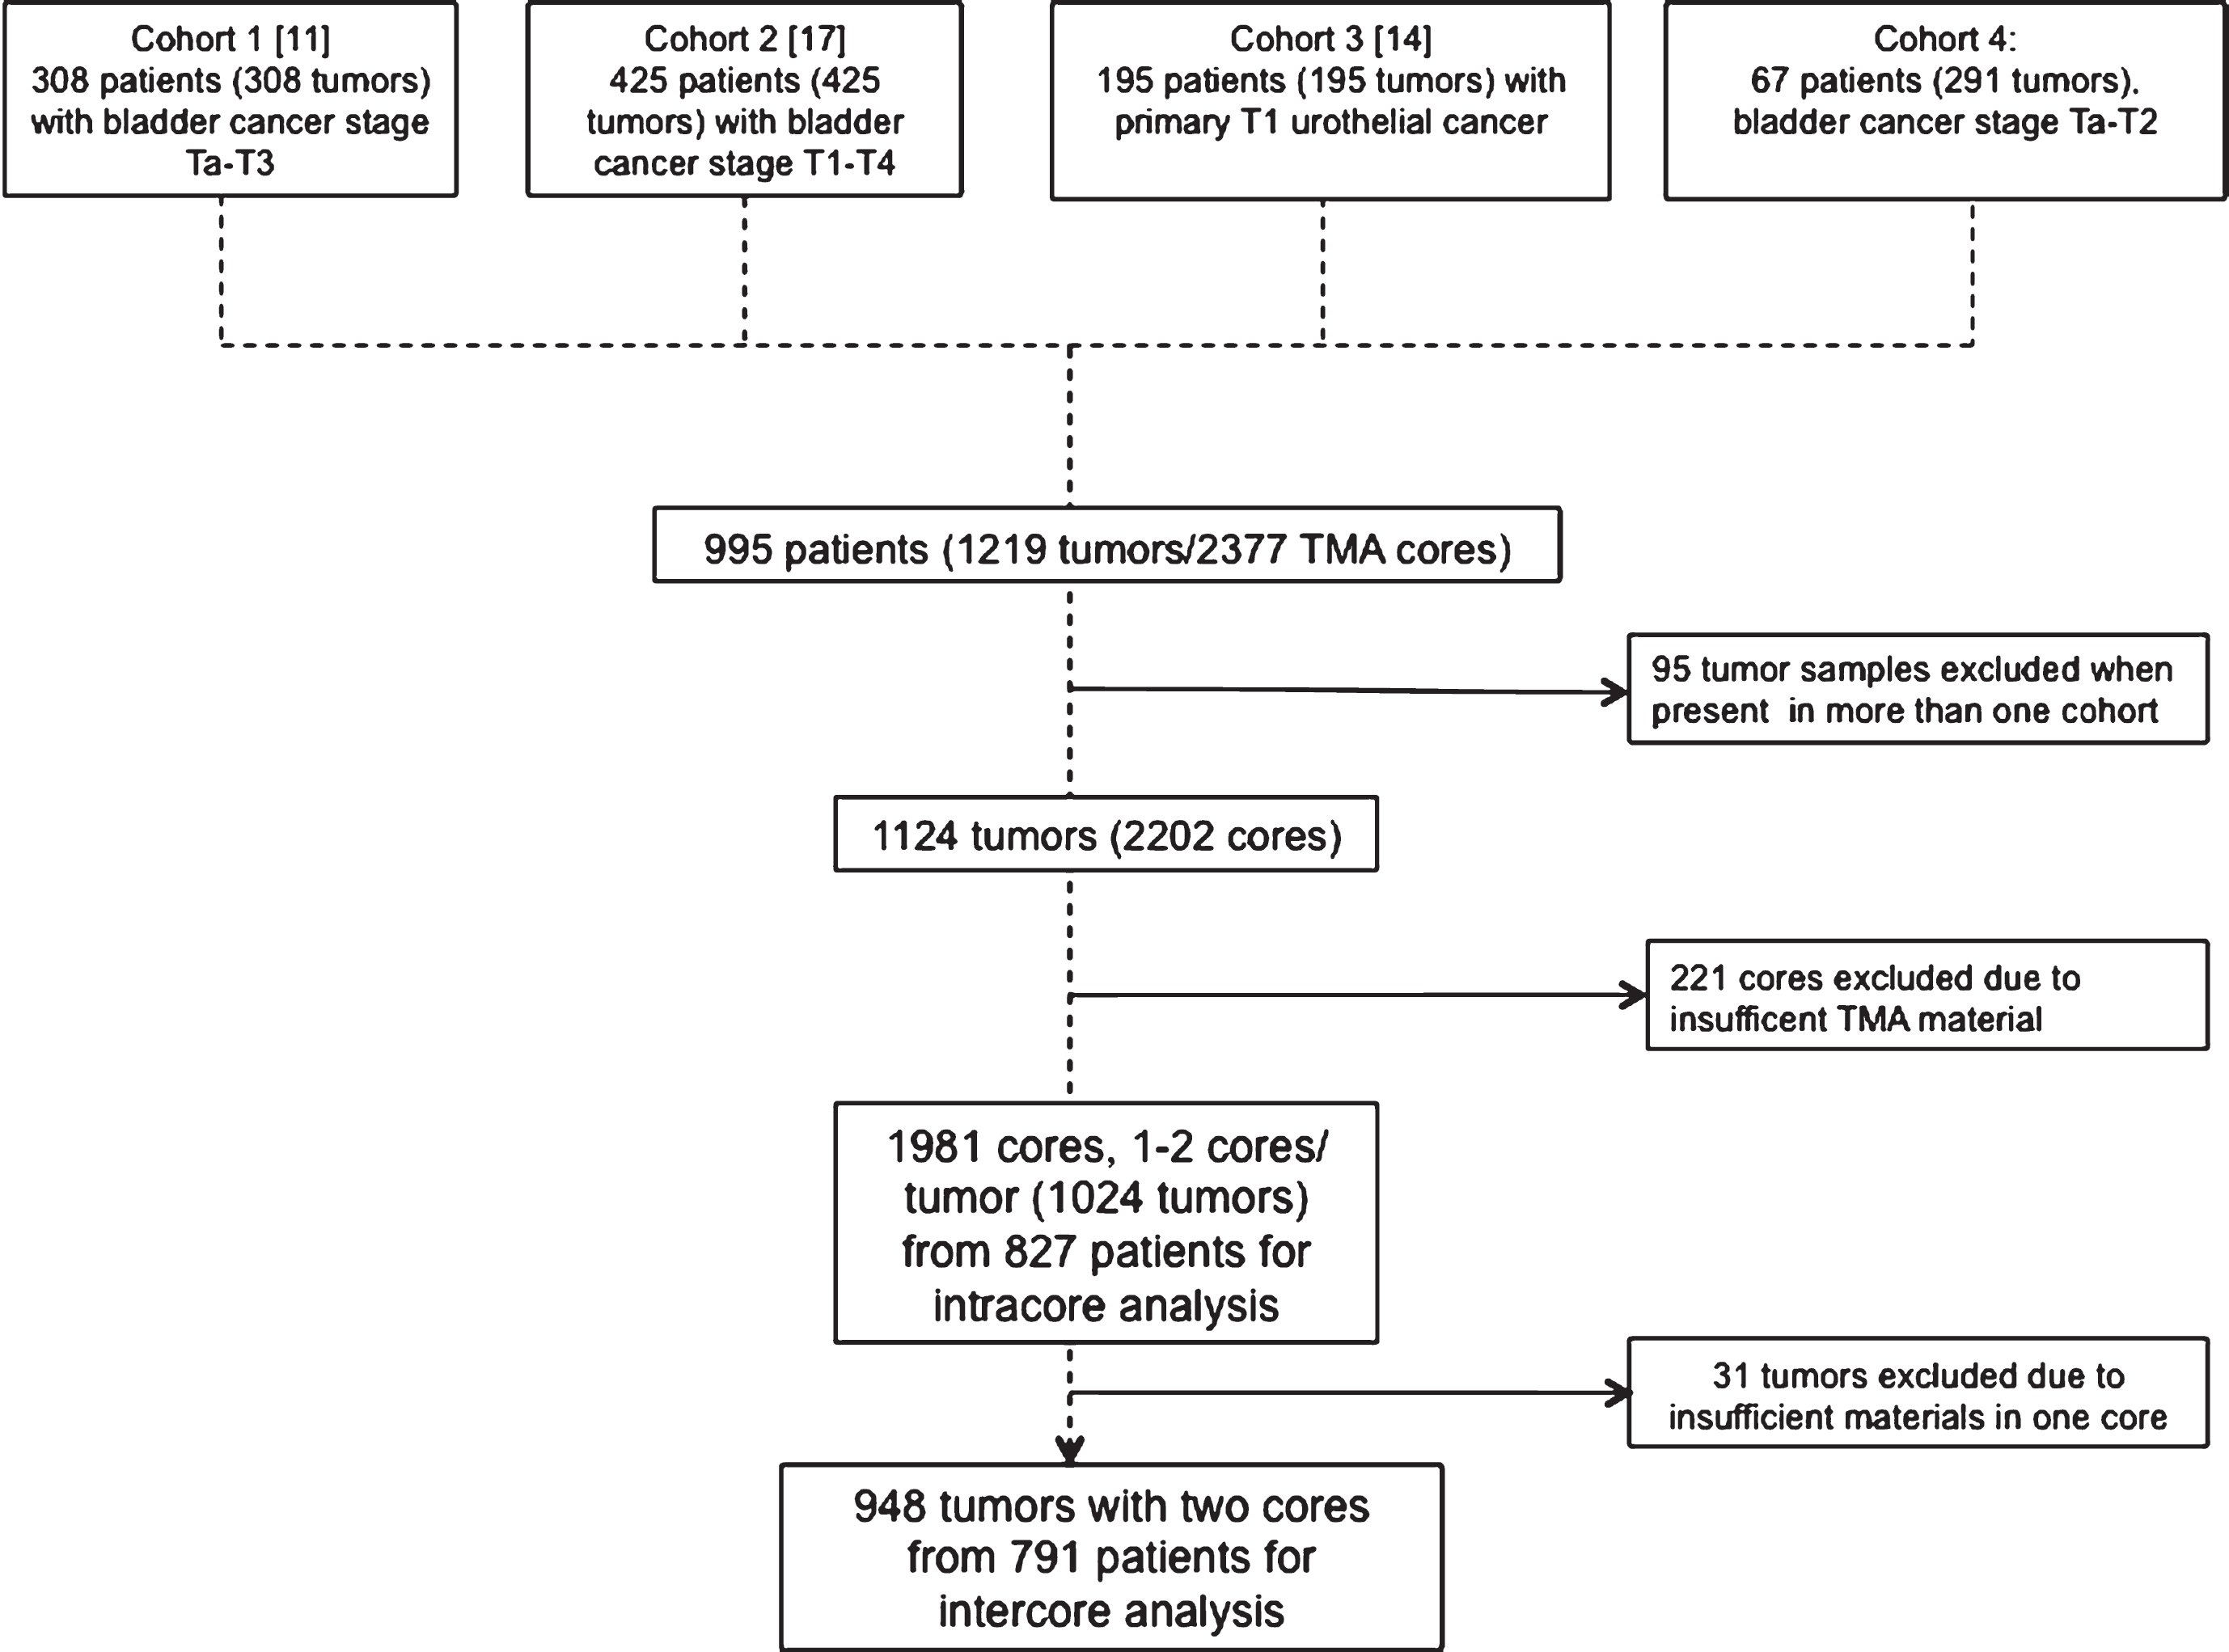
This study was based on samples from four different cohorts. Numbers of patients, inclusion criteria, and exclusions are presented in Fig. 1. A total number of 1024 tumors were re-evaluated for all 11 IHC markers (i.e by assessing staining intensity and/or percentage of positive tumor cells). All included samples were from chemo-naïve TURBT specimens. The sections from TURBT specimens were re-evaluated and graded according to WHO 1999 by a uropathologist (GC), and used as reported in the original studies. Due to different inclusion criteria for the four studies, the age of the tissue blocks was different. The mean specimen age in years and the interquartile range for cohorts one to four was: 7, 5–9; 8, 7–10; 12, 11–16; 15, 14–17. One-millimeter TMA cores were marked and punched out of representative tumor areas without necrosis using a manual device (Pathology Devices, Inc., Westminster, MD). 120 cores were embedded in paraffin in one cassette, and 4-μm sections were cut and mounted on glass slides (SuperFrost Plus, Gerhard Menzel GmbH, Braunschweig, Germany).
Fig.1
Patient and cohort characteristics. This study was based on four existing cohorts. The flowchart shows references to original cohorts and inclusion criteria as well as number of exclusions due to overlap between studies and insufficient material.
2.1Immunohistochemistry
After sectioning, slides were dried in 60°C for one hour and were then deparaffinized and were subsequently pre-treated with PT Link Kit (Dako, Glostrup, Denmark) in target-retrieval buffer (TRS), pH 9. Slides were stained with Autostainer Plus (Dako) visualized using a Dako EnVision FLEX K8010 system. The slides were counterstained with hematoxylin for four minutes.
Dilutions of primary antibodies along with catalog numbers and vendors are presented in Table 1. TMA sections within each study were stained together, and duplicate cores were always present on the same TMA. The same staining method and equipment was used by the same technician for all IHC on all four cohorts, but no internal control tissues were included since the studies were not originally intended to be cross-compared. All of the antibodies chosen have previously been studied in the context of finding biomarkers for progression, treatment targets [16] or to identify a potential impact on prognosis (Table 1). In addition, all the markers are associated with molecular subtypes of bladder cancer [11, 17].
Table 1
Antibodies with dilutions, vendors, evaluation, relevance, and literature references
| Marker | Catalog No. | Vendor | Dilution | Evaluation | Association | Reference |
| CK5 | RM-2106 | Lab Vision | 1:200 | Distribution/Intensity | Expressed in tumor-initiating cells | [33] |
| Cyclin D1 | M3635 | Dako | 1:100 | Distribution/Intensity | Survival | [34] |
| E-cadherin | M3612 | Dako | 1:200 | Intensity | Progression, survival | [35] |
| EGFR | M7239 | Dako | 1:25 | Distribution/Intensity | Progression, survival | [36] |
| FGFR3 | #4574 | Cell Signaling | 1:40 | Intensity | Prognosis, potential drug target | [37] |
| GATA3 | #5852 | Cell Signaling | 1:800 | Distribution/Intensity | Prognosis | [38] |
| HER2 | 790-2991 | Ventana | RTU | Intensity | Survival | [39] |
| P16 | #550834 | BD Biosciences | 1:50 | Intensity | Progression | [40] |
| P63 | IMG-80212 | Imgenex | 1:100 | Distribution | Progression | [41] |
| P-Cadherin | #610228 | BD Biosciences | 1:200 | Distribution/Intensity | Progression | [42] |
| RB1 | #9309 | Cell Signaling | 1:100 | Distribution | Survival | [43] |
2.2Gene expression data (GEX)
Data on molecular subtypes based on gene expression analysis was available for 669 of the tumors and was used as reported in the original studies [11, 17]. Cohort 1 was classified into the subtypes “urothelial-like” (Uro), “genomically unstable” (GU), “basal/squamous” (Ba/Sq), and “Infiltrated”. Cohort 2 included the additional subtypes “mesenchymal-like” (Mes-like) and “small-cell/neuroendocrine-like” (Sc/NE-like).
2.3Assessment
The slides were scanned with an Axio Scan.Z1 (Zeiss, Germany) instrument and visualized as scanned digital images using Zen Lite software (version 1.1.2.0). Markers evaluated for intensity (Table 1) were assessed on a four-grade scale from 0–3 (0, no staining detected; 1, weak but detectable staining; 2, moderate staining; 3, strong staining). Markers evaluated for proportions stained were scored from 0 to 9 in 10% fractions, where 0 and 9 represented 0–9% and 91–100% positive staining of tumor cells, respectively. For markers evaluated regarding both measures, a tumor cell score (TCS) was calculated by multiplying intensity by distribution, resulting in values between 0 and 2.7 as previously described [17, 18].
2.4Intratumoral heterogeneity definitions
To assess intercore heterogeneity, we compared TCS values for cases with two cores from the same tumor. The cases with the greatest differences in TCS were manually reviewed, and in the absence of established definitions in the literature, cut-off values for heterogeneity were selected before analysis based on the available images. For markers evaluated regarding intensity a two-step difference was required for cases to be considered heterogeneous. The requirement of a two-step difference ensures that similar cores were not falsely classified as heterogeneous due to categorization of a continuous variable. For markers assessed regarding distribution, a difference of 0.4 (40% ) was required. The cut-off value for markers evaluated for both parameters was a difference of 1.2 in TCS.
2.5Intracore heterogeneity
All cores were specifically analyzed for intracore heterogeneity. For a useful definition of intracore heterogeneity it would be inappropriate to consider a single or few cells as heterogeneity, as non-tumor cells or localized staining artifacts would be interpreted as heterogeneity. Thus, cores with a cluster of at least 50 cells that distinctly exhibited a one-step difference in intensity were regarded as heterogeneous. All cores with an indication of heterogeneity were re-evaluated, and in equivocal cases a consensus decision was made by two evaluators (LJ and GS).
2.6Statistics
All statistical tests were performed with R software [19]. Fisher’s test was used to determine associations with clinical and pathological variables such as stage and grade, and the Chi-square test was applied to examine associations with molecular subtypes. Kaplan-Meier and Cox regression were performed as visualization and survival analyses, respectively. Random sample distribution data were generated using 10,000 observations based on the frequency of ITH for each marker in our data. Only cases with complete data for all eleven markers were compared in this analysis. Real observed values were compared with random sample distribution by calculating the false discovery rate (FDR).
RESULTS
3.1Intercore heterogeneity
Of the 948 tumors with two cores from each case, 341 (36% ) tumors displayed intercore heterogeneity in one or more markers (Table 2). Substantial ITH, defined as heterogeneity in three or more of the 11 analyzed markers, was detected in 50 cases (5% ) (Fig. 2). Two tumors exhibited intercore heterogeneity in six markers, which was the maximum number of markers displaying between-core differences. A cut-off of two or four markers would have resulted in 122 (13% ) or 14 (1% ) heterogeneous tumors, respectively. Intercore heterogeneity was observed most frequently for p63 (81/948, 9% ), and least frequently for HER2 (22/948, 2% ). Each of the other markers showed a range of heterogeneous expression in 34–72 (4% – 8% ) cases for each marker. Intercore heterogeneity was not significantly associated with grade, stage or molecular subtype. The 50 cases showing substantial intercore heterogeneity were not over- or under-represented in any of the four cohorts (Chi-2 test p = 0.56). The 50 tumors with substantial intracore heterogeneity had on average 1.3 years lower age of the paraffin block, compared to tumors with 1-2 heterogeneous markers or to tumors without heterogeneity (mean specimen age 8.9 versus 10.3, and 10.2 years, respectively; Kruskal-Wallis test p = 0.014).
Fig.2
Representative images of routine hematoxylin and eosin (H&E) staining and intercore heterogeneity in five markers (CK5, E-Cadherin, GATA3, HER2 and p63) in two different cores from the same tumor.
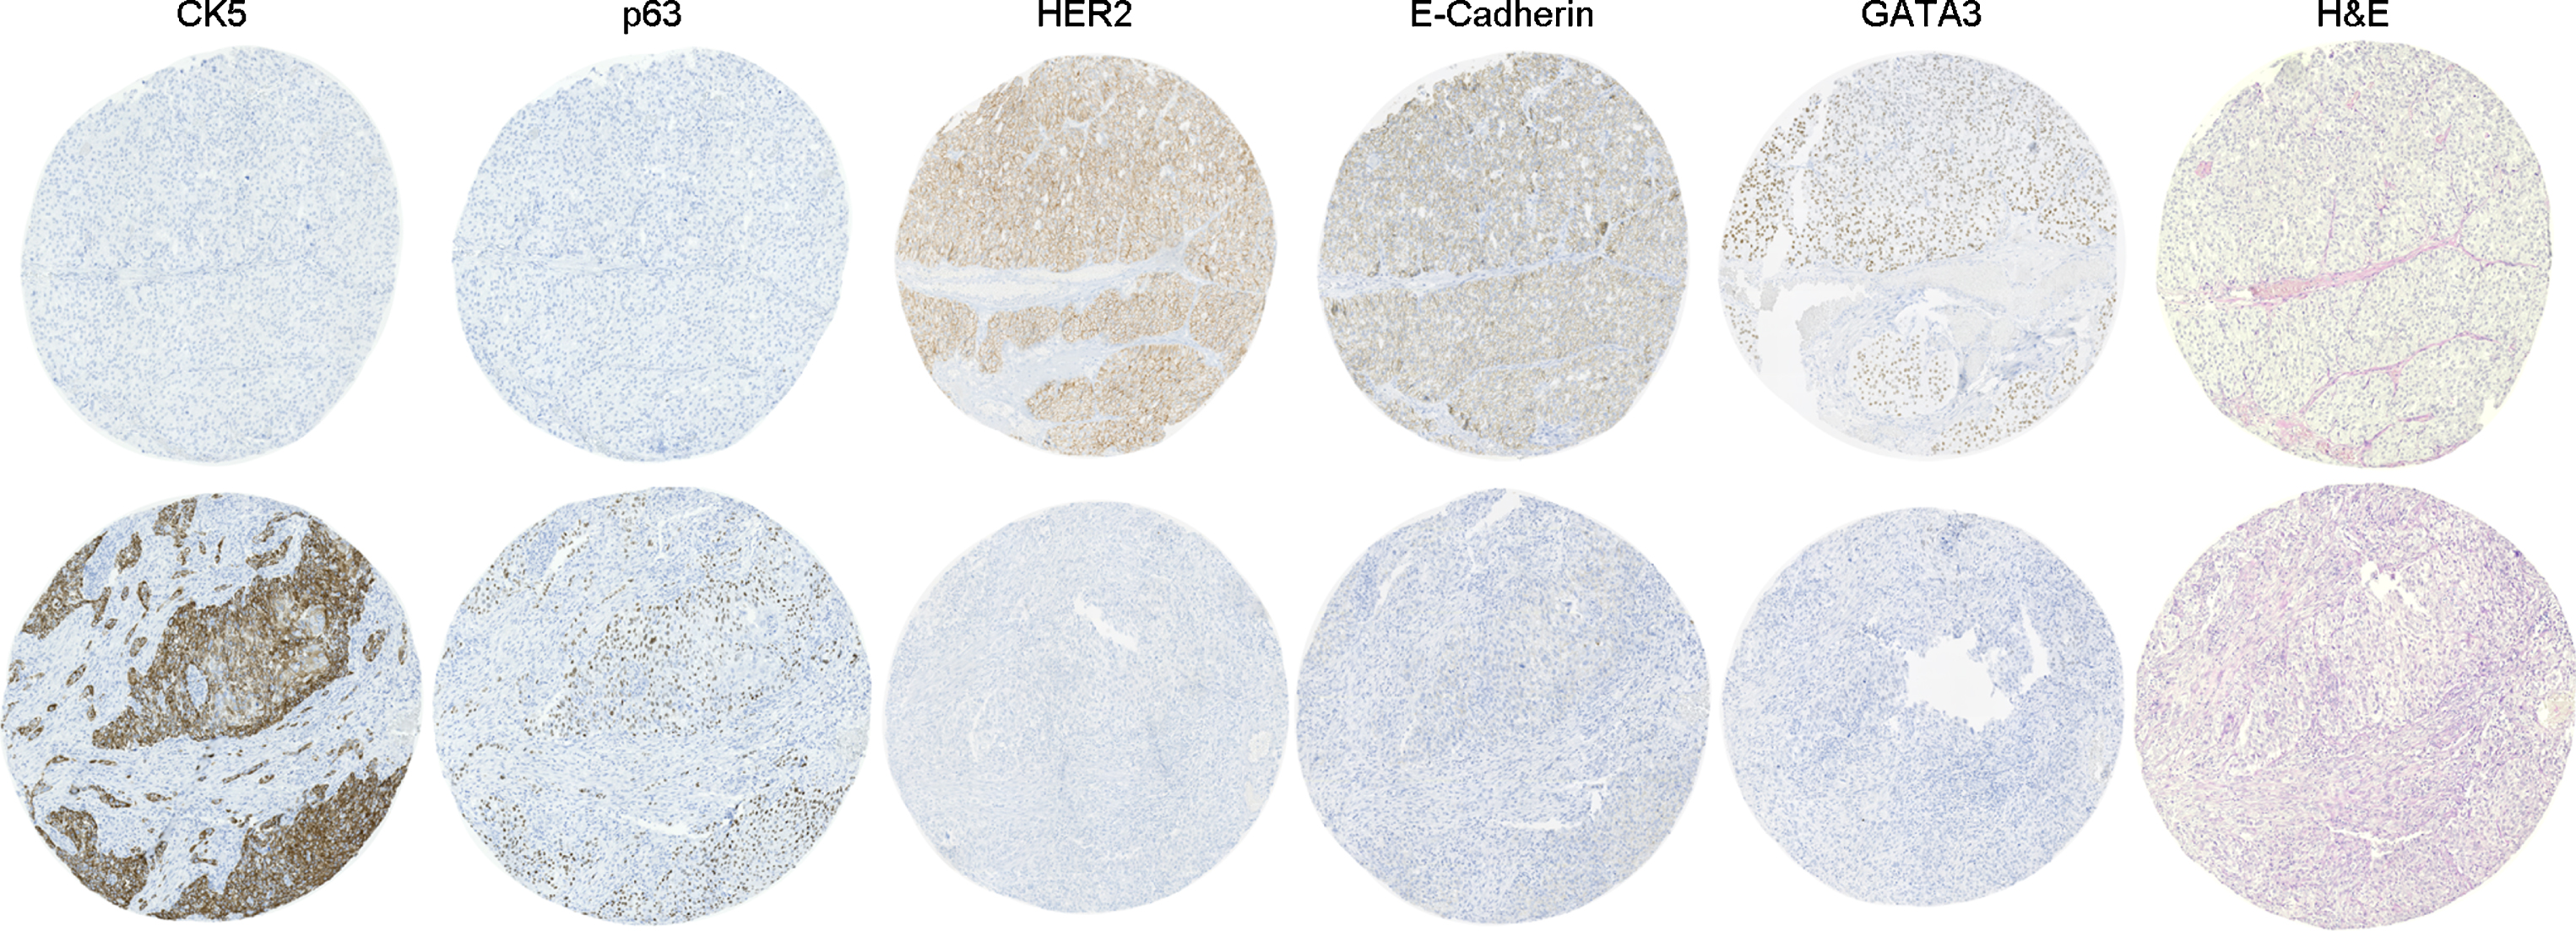
Table 2
Intercore analysis showing the distribution of grade, stage and molecular subtype in gene expression data (GEX) in tumors without ITH, in tumors with ITH for one or more markers, or for the smaller subset with ITH for 3 or more markers
| Total (N = 948) | No ITH (N = 607) | ITH≥1 (N = 341) | ITH≥3 (N = 50) |
| Sex | |||
| Female 203 (21% ) | 127 (21% ) | 76 (22% ) | 11 (22% ) |
| Male 745 (79% ) | 480 (79% ) | 265 (78% ) | 39 (78% ) |
| Age | |||
| Median 72.8 years (IQR:65.1–78.1 years) | 72.7 (65.0–78.2) | 72.8 (65.2–78.0) | 72.0 (65.3–76.7) |
| Grade | |||
| G1 39 (4% ) | 21 (3% ) | 18 (5% ) | 2 (4% ) |
| G2 223 (24% ) | 149 (25% ) | 74 (22% ) | 8 (16% ) |
| G3 646 (68% ) | 409 (67% ) | 237 (70% ) | 39 (78% ) |
| Gx 10 (1% ) | 9 (1% ) | 1 (0% ) | 0 (0% ) |
| N/A 30 (3% ) | 19 (3% ) | 11 (3% ) | 1 (2% ) |
| Tumor stage | |||
| Ta 173 (18% ) | 113 (19% ) | 60 (18% ) | 7 (14% ) |
| T1 337 (36% ) | 204 (34% ) | 133 (39% ) | 16 (32% ) |
| T2 213 (22% ) | 135 (22% ) | 78 (23% ) | 15 (30% ) |
| T3 138 (15% ) | 92 (15% ) | 46 (13% ) | 9 (18% ) |
| T4 37 (4% ) | 27 (4% ) | 10 (3% ) | 1 (2% ) |
| Tx 4 (0% ) | 3 (0% ) | 1 (0% ) | 1 (2% ) |
| N/A 46 (5% ) | 33 (5% ) | 13 (4% ) | 1 (2% ) |
| Molecular subtype GEX | |||
| Uro 339 (36% ) | 210 (35% ) | 129 (38% ) | 15 (30% ) |
| GU 148 (16% ) | 94 (15% ) | 54 (16% ) | 9 (18% ) |
| Ba/Sq 93 (10% ) | 66 (11% ) | 27 (8% ) | 7 (14% ) |
| Infiltrated 34 (4% ) | 20 (3% ) | 14 (4% ) | 2 (4% ) |
| Mes-like 25 (3% ) | 19 (3% ) | 6 (2% ) | 0 (0% ) |
| ScNE-like 29 (3% ) | 23 (4% ) | 6 (2% ) | 1 (2% ) |
| N/A 280 (30% ) | 175 (29% ) | 105 (31% ) | 16 (32% ) |
3.2Intracore heterogeneity
In all, 1981 cores were analyzed for intracore heterogeneity (Table 3), and 326 (16% ) of those specimens showed such heterogeneity for one or more markers. The maximum number of heterogeneously expressed markers in a TMA core was six. In the same manner as for intercore heterogeneity, substantial intratumoral heterogeneity was defined as heterogeneity in three or more markers, and this was observed in 48 cores (2% ) (Fig. 3). A cut-off of two markers would have resulted in 119 (6% ) heterogeneous cores and a cut-off of four markers would have only resulted in 20 (1% ) heterogeneous cores. The heterogeneously expressed marker found most frequently in a TMA core was FGFR3 in 92/1981 cores (5% ), followed by HER2 in 76/1981 cores (4% ). RB1 was the heterogeneously expressed marker found least often, detected in only 9/1981 cores (0.5% ). Heterogeneous expression of the other eight markers occurred in 32–54 (2–3% ) of the cores. Intracore heterogeneity was associated with grade (p = 5.3e– 06) and stage (p = 1.1e– 08), and was most common in grade 3 and T1 tumors. Furthermore, intracore heterogeneity in at least one marker was noted more frequently in the genomically unstable (GU) molecular subtype (p = 0.0001). However, when we compared cases displaying substantial ITH (i.e., heterogeneity in at least three markers) with cases showing no ITH, only stage was significantly associated with heterogeneity enrichment (p = 0.015) in T1 tumors. The proportion of T1 tumors was larger in the subset of tumors with substantial heterogeneity than in the subset without any ITH (52% and 46%, respectively). The 48 cases showing substantial intracore heterogeneity were not over- or under-represented in any of the four cohorts (Chi-2 test p = 0.47). There was no difference in age of the paraffin blocks of cores with substantial intracore heterogeneity, cores with heterogeneity of 1-2 markers, or cores without heterogeneity (mean specimen age 10.4, 10.1, and 10.3 years, respectively).
Fig.3
Representative case showing intracore heterogeneity. Routine hematoxylin-eosin staining (H&E) and four markers (E-Cadherin, p16, P-Cadherin and RB1) are shown.
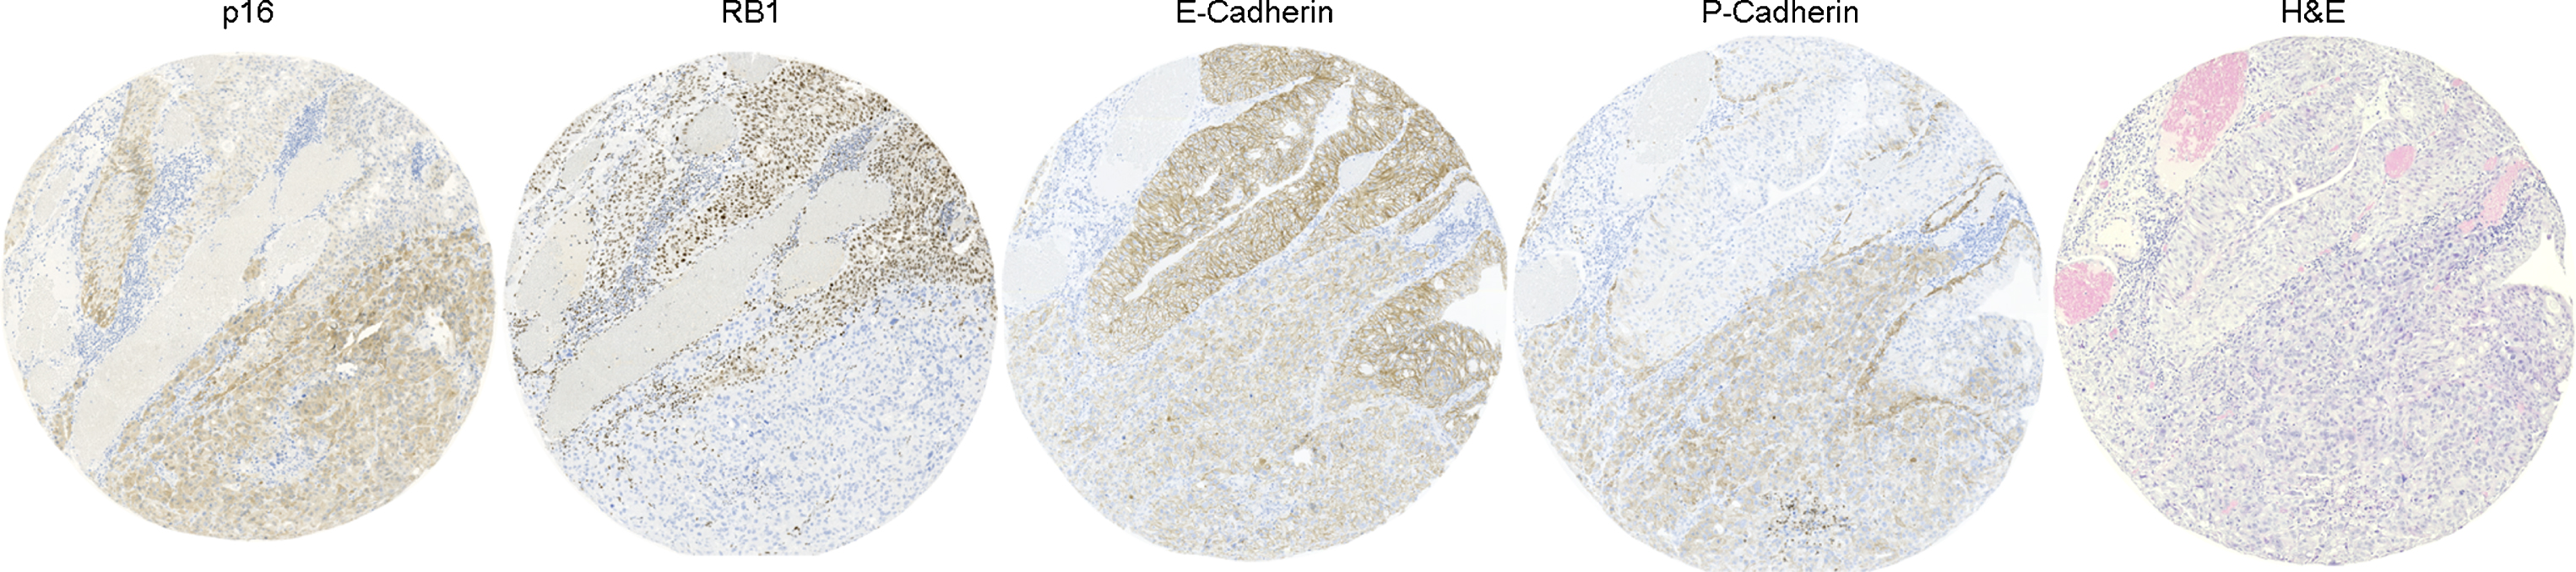
Table 3
Intracore analysis showing the distribution of grade, stage and molecular subtype from gene expression data (GEX) in tumors without ITH, in tumors with ITH for one or more markers, or for the smaller subset with ITH for 3 or more markers
| Total (N = 1981) | No ITH (N = 1657) | ITH≥1 (N = 324) | ITH≥3 (N = 48) |
| Sex | |||
| Female 418 (21% ) | 355 (21% ) | 63 (19% ) | 11 (23% ) |
| Male 1563 (79% ) | 1302 (79% ) | 261 (81% ) | 37 (77% ) |
| Age | |||
| Median (IQR) 72.4 years (64.9–77.8 years) | 72.7 (64.9–78.0) | 73.5 (66.1–78.5) | 70.8 (64.9–76.4) |
| Grade | |||
| G1 87 (4% ) | 84 (5% ) | 3 (1% ) | 0 (0% ) |
| G2 485 (24% ) | 424 (26% ) | 61 (19% ) | 12 (25% ) |
| G3 1327 (67% ) | 1078 (65% ) | 249 (77% ) | 35 (73% ) |
| Gx 22 (1% ) | 22 (1% ) | 0 (0% ) | 0 (0% ) |
| N/A 60 (3% ) | 49 (3% ) | 11 (3% ) | 1 (2% ) |
| Stage | |||
| Ta 391 (20% ) | 359 (22% ) | 32 (10% ) | 3 (6% ) |
| T1 716 (36% ) | 566 (34% ) | 150 (46% ) | 25 (52% ) |
| T2 498 (25% ) | 405 (24% ) | 93 (29% ) | 12 (25% ) |
| T3 275 (14% ) | 243 (15% ) | 32 (10% ) | 7 (15% ) |
| T4 71 (4% ) | 62 (4% ) | 9 (3% ) | 1 (2% ) |
| Tx 13 (1% ) | 10 (1% ) | 3 (1% ) | 0 (0% ) |
| N/A 17 (1% ) | 12 (1% ) | 5 (2% ) | 0 (0% ) |
| Molecular subtype GEX | |||
| Uro 694 (35% ) | 603 (36% ) | 91 (28% ) | 17 (35% ) |
| GU 307 (15% ) | 230 (14% ) | 77 (24% ) | 11 (23% ) |
| Ba/Sq 189 (10% ) | 163 (10% ) | 26 (8% ) | 4 (8% ) |
| Infiltrated 75 (4% ) | 60 (4% ) | 15 (5% ) | 4 (8% ) |
| Mes-like 55 (3% ) | 49 (3% ) | 6 (2% ) | 1 (2% ) |
| ScNE-like 59 (3% ) | 49 (3% ) | 10 (3% ) | 4 (8% ) |
| N/A 602 (30% ) | 503 (30% ) | 99 (31% ) | 7 (15% ) |
3.3Subtype heterogeneity
To investigate whether multiple subtypes can occur within a single core or tumor, all cases with ITH in three or more markers were selected and heterogeneous areas were compared to known subtype marker profiles [18]. Intercore analysis was consistent with two different subtypes in 14/50 cases whereas assessment of intracore heterogeneity was consistent with different subtypes within the same core in 5/48 cases (Table 4).
Table 4
Number of tumors showing subtype heterogeneity with the subtypes present and the number of cases (intercore, intracore)
| Subtype 1 | Subtype 2 | Intercore | Intracore |
| Uro | Ba/Sq | 6 | 1 |
| Uro | GU | 2 | 3 |
| Uro | Mes | 2 | 0 |
| GU | Ba/Sq | 4 | 1 |
Uro, urothelial-like; Ba/Sq, basal/squamous; GU, genomically unstable; Mes, mesenchymal-like.
3.4Random sample distribution
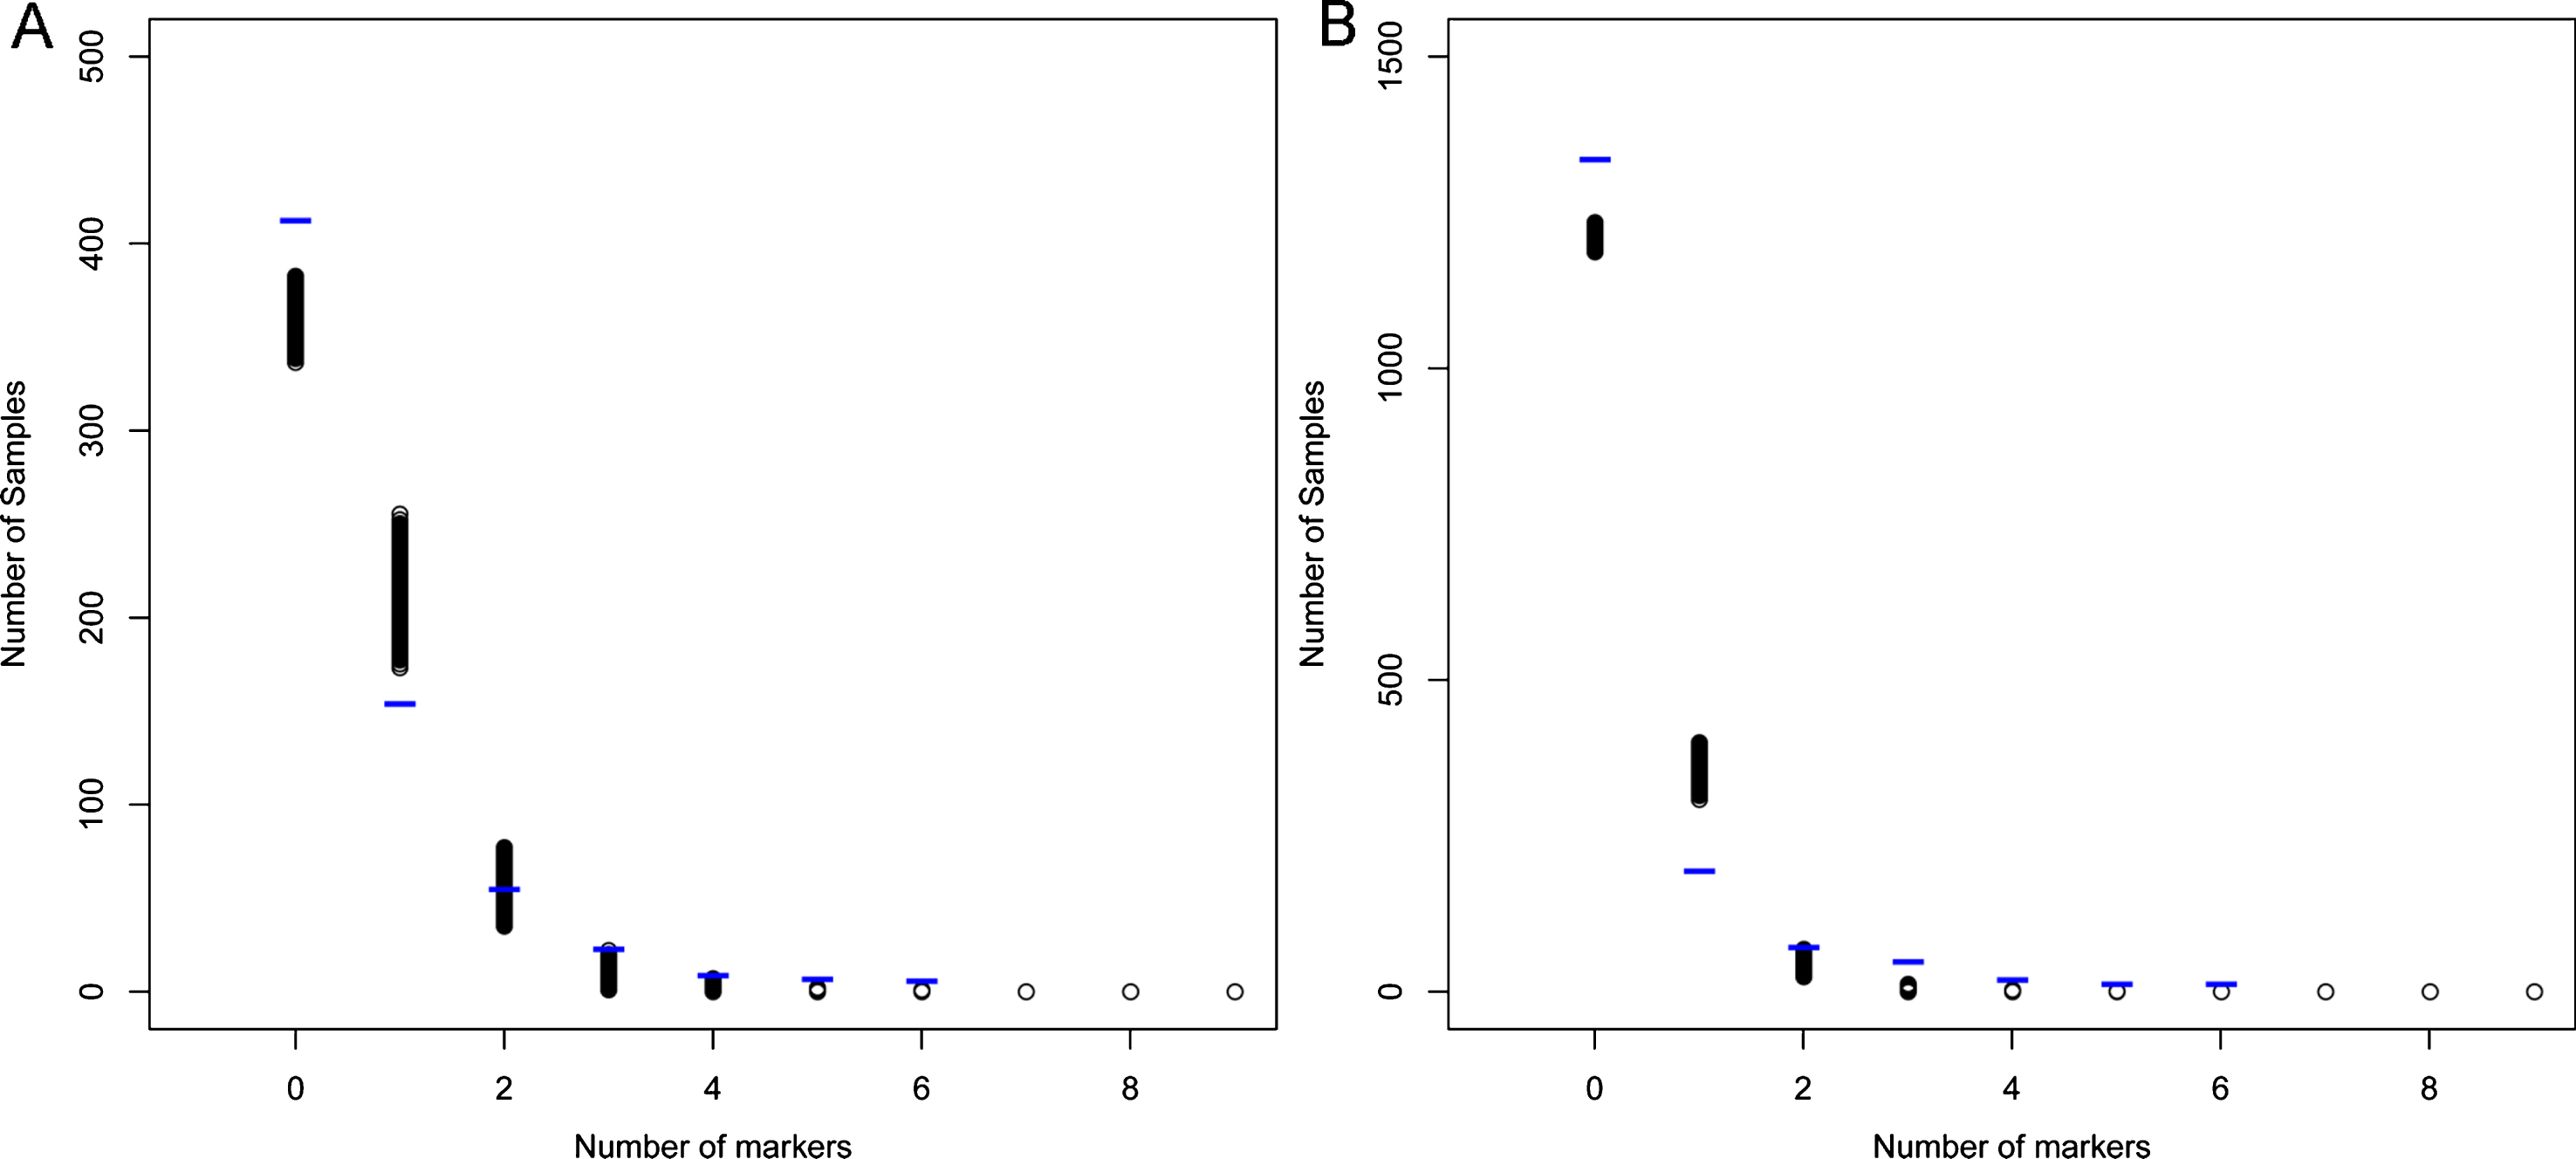
It is possible that the amount of ITH observed can be explained by a relatively small number of highly heterogeneous tumors or by a more random distribution of heterogeneous markers. To investigate whether the observed distribution of heterogeneity might differ from a random distribution, we compared the observed data with random sampling data based on the inter-, and intracore frequencies (Fig. 4A and B, respectively). This analysis showed that the number of cases without any heterogeneity was greater than expected from random distribution. The results also revealed more cases than expected with heterogeneity in three or more markers. On the other hand, compared to the random sampling data, our data contained fewer cases showing heterogeneity for one marker. These differences observed regarding 0, 1, and ≥3 markers were statistically significant (FDR<0.005) for both intercore and intracore heterogeneity.
Fig.4
Random sampling data generated using 10000 observations based on the frequency of (A) intercore heterogeneity, and (B), intracore heterogeneity for each marker in our data. Blue lines indicate the observed distribution of ITH in the eleven markers in our data.
3.5Survival analysis
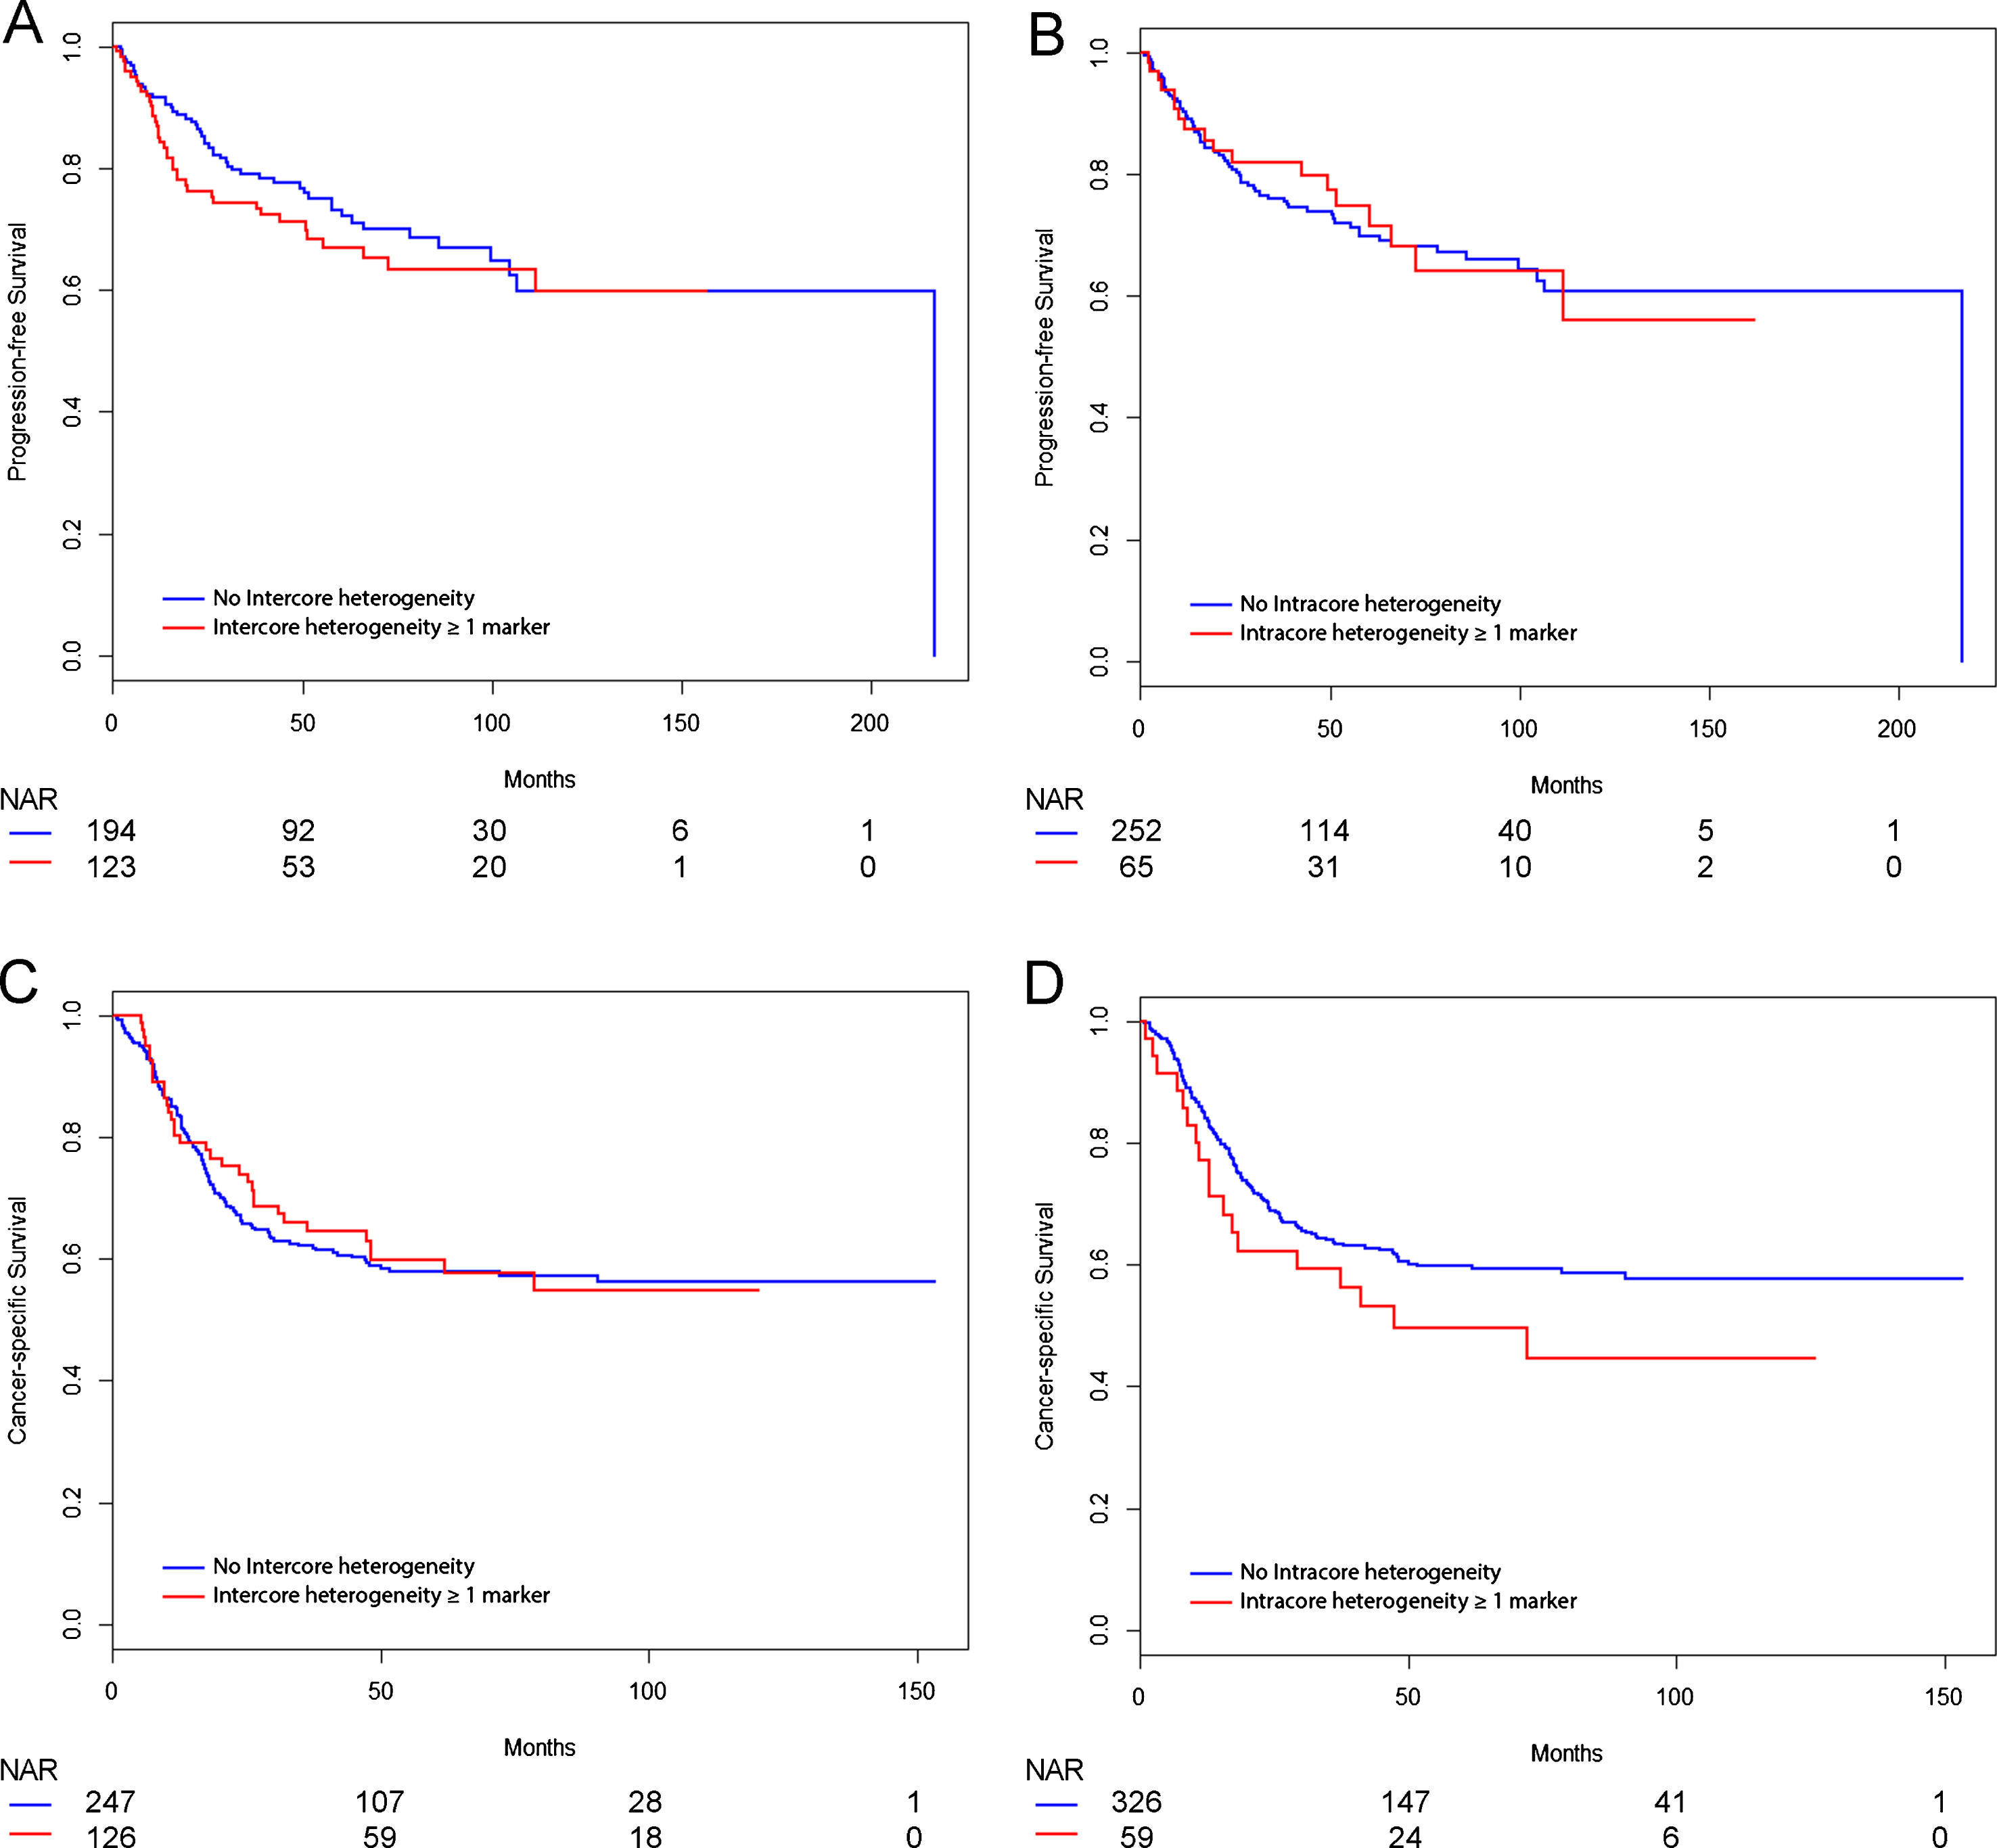
Follow-up data were available for 702 patients. Progression-free survival (PFS) was calculated for 317 patients with non-muscle invasive tumors, and was defined as the time to a muscle-invasive recurrence, metastasis or radical cystectomy. Furthermore, cancer-specific survival (CSS) was calculated for 385 patients with muscle-invasive tumors treated with radical cystectomy by Cox-regression analysis. No significant differences in PFS (Fig. 5A-B) or CSS (Fig. 5C-D) were observed between patients with or without ITH. The analysis was performed only for ITH in one or more markers due to the small sample size for ITH in at least three markers.
Fig.5
Kaplan-Meier curves showing survival analysis. Progression-free survival (PFS) analysis included 317 patients, and cancer-specific survival (CSS) analysis comprised 373 patients stratified for intercore heterogeneity and 385 patients stratified for intracore heterogeneity. Univariate Cox regression analysis showed no significant differences in PFS or CSS. (A) PFS for intercore heterogeneity in one or more markers. (B) PFS for intracore heterogeneity in one or more markers. (C) CSS for intercore heterogeneity in one or more markers. (D) CSS for intracore heterogeneity in one or more markers. NAR, Numbers at risk.
DISCUSSION
Intercore heterogeneity in three or more markers was detected in 5% and intracore heterogeneity for three or more markers was observed in 2% of the cores. Heterogeneity was consistent with different molecular subtypes in 14/50 (28% ) cases with substantial intercore ITH, representing 1.5% of the total number of tumors investigated. The corresponding figure for intracore subtype heterogeneity was 5/48 (11% ), representing 5/1981 (0.25% ) of the total number of cores investigated. The low frequency of substantial ITH and the small number of cases consistent with multiple subtypes in a tumor sample suggest that heterogeneity does not interfere with immunohistochemical TMA studies to a considerable extent. However, bladder cancer is reported to be the fourth most common cancer type with genetic ITH [20], and hence it’s possible that there is a discrepancy between genetic ITH and heterogeneity detected at a protein level.
The comparisons to random sampling data suggest some significant systematic differences, especially in cases with ITH in three or more markers. Nonetheless, considering that substantial ITH is rare in the present material, it is possible that a certain proportion of the total heterogeneity observed in such specimens occurs randomly.
We found a statistically significant association between tumor grade and intracore ITH, although this correlation was not significant in the smaller group with substantial heterogeneity (n = 48). Of cases with substantial heterogeneity, 73% were high grade, which represents a larger proportion than the 65% noted for cases without heterogeneity but a smaller proportion compared to the 78% observed for cases with ITH in one or more markers. There was also a significant association with stage T1 in the group with ITH in at least one marker, and this association remained significant in the group with substantial ITH. Moreover, ITH was linked to molecular subtype, because intracore ITH in at least one marker was found more often in tumors of the GU subtype. Taken together, these results suggest that intracore ITH is more common in the T1G3 category, in which most tumors are indeed of the GU molecular subtype [11]. Higher HER2-expression, variable expression of IHC markers, high proliferation rates, and loss of RB are some of the characteristics of GU tumors [11, 17, 18], which also agrees with more pronounced ITH in the GU subtype. Furthermore, this subtype is associated with aggressive features, such as high grade and increased frequency of mutations and genomic imbalances [11]. Thus, the mentioned properties may be reflected by the greater rate of ITH observed in the GU subtype in the present study.
Intercore analysis revealed no significant associations to grade, stage, or molecular subtype. The discrepancies between intercore and intracore analyses might be explained by differences in the criteria applied or by differences in sampling. Intermingling of subclones without distinct spatial areas might not be captured according to our ITH definitions. Other aspects and potential confounders in the detection of ITH include the lack of established criteria and the knowledge that assessment of IHC-expression is partly subjective and associated with intra- and interobserver variations. On the other hand, in contrast to gene expression analyses, IHC ensures that only tumor cells are analyzed. The major limitation of this study is the exclusive use of TMA data, and the findings reported here need to be complemented by the more detailed resolution that can only be obtained by full section analyses of appropriate tissue specimens. Furthermore, we cannot exclude that differences between cohorts may have influenced the amount of heterogeneity detected.
Notwithstanding, it is debatable whether variations in IHC staining represent true ITH or simply reflect differences related to technical factors during fixation, sectioning and staining. For example, the nucleus of a cell can be sectioned at any level, which can potentially lead to disparities in the expression of nuclear markers such as GATA3 [21]. Our data did show a significantly lower specimen age for tumors with substantial differences between cores, but the difference was small and not observed for heterogeneity within cores.
In practice, intratumor heterogeneity is already acknowledged when reporting routine pathology with divergent differentiation [22]. However, even if expression of markers vary between the different histological types and variants of UC, no such IHC marker shows consistent expression, as indicated by variability in the reported frequencies [23].
Notably, in breast cancer TMAs, heterogeneity of 2–8% has been found in the biomarkers defining breast cancer subtypes; ER, PR and HER2 [24], which is similar to our findings in bladder cancer. In a pan-cancer study of ITH, morphological heterogeneity was defined as differences in nuclear size and staining intensity on hematoxylin-eosin staining intensity in tissue sections and was found in all 12 of the cancer types analyzed, including bladder cancer [20]. The authors of that report also found a correlation between genetic ITH and more atypical cytological features evaluated by whole-section histology.
Analysis of DNA samples, sequencing of multifocal urothelial carcinomas has revealed unique mutations in different tumor compartments while routine stainings revealed no evident morphological heterogeneity [25]. Heterogeneity in four muscle-invasive bladder cancers was also recently demonstrated by whole-exome sequencing, which suggested the existence of subclonal populations of malignant cells indicated by differences in RNA expression [8]. Heterogeneity also appears to impose a challenge on analysis of circulating tumor cells (CTC) [26, 27]. In 75% of patients with HER2-positive tumors, the CTCs did not express HER2, an aspect that has implications for the response to anti-HER2 drugs [27]. Thus, ITH may also have an impact on response to treatment in bladder cancer [28]. Furthermore, it has been shown that while the number of mutations does not differ before and after treatment with cisplatin-based chemotherapy, many mutations are only detected either in the pre-, or in the post-chemotherapy sample [29]. As hypothesized in that study, the post-chemotherapy samples were also enriched in a mutational signature that could be linked to cisplatin. Inactivating mutations in DNA-damage response genes have also been shown to identify patients that respond well to chemotherapy [30], as has low ERCC1 levels detected by IHC [31], and Basal-like gene expression subtype [15]. Spatial heterogeneity among the tumor cells may potentially affect our ability to predict responsiveness at each of these levels. In addition to intrinsic properties of the tumor cells, complex interplay between microenvironment, such as stromal reactions and immune infiltration, may play a role in both the development of ITH [32] and modification of the response to systemic treatments. These cited studies suggest two different ways in which ITH may be relevant for predicting treatment response in bladder cancer. First, the presence of ITH at the start of therapy may indicate a higher probability that a tumor develops rapid resistance to therapy due to emergence of resistant subclones under selection pressure. Secondly, widespread ITH may negatively affect our ability to discover treatment predictive biomarkers if we fail to measure the relevant tumor area.
Inasmuch as variation is a prerequisite for evolution by natural selection, it is interesting to hypothesize that heterogeneity per se could be associated with worse survival of cancer patients. The previously mentioned study by Liu et al. did show an association between mutational heterogeneity and overall survival in chemotherapy treated patients. [29]. The use of bioinformatics models on a genetic level has also demonstrated a correlation between ITH and overall survival in a pan-cancer analysis of the TCGA dataset [20], but, considering individual cancer types, only gliomas showed an association between ITH and survival. Although our study was large, we found no support for such an association between presence of heterogeneity and patient outcome.
CONCLUSIONS
In this immunohistochemical study of 11 markers in bladder cancer TMAs, we found that 5% of the tumors with intercore heterogeneity and 2% with intracore heterogeneity in three or more markers, respectively. Further systematic studies on ITH should assess tumor areas larger than TMA-cores to explore ITH with regard to its spatial distribution and its potential impact on prognosis and response to systemic treatments.
CONFLICT OF INTEREST
The authors declare no conflict of interest.
ACKNOWLEDGMENTS
This research was supported by grants from the Swedish Cancer Society (2017/278), Lund Medical Faculty (ALF) (2014/354), Skane University Hospital Research Funds, Sten K. Johnson Foundation, the Krapperup Foundation, Skane County Council’s Research and Development Foundation REGSKANE-622351, Gösta Jönsson Research Foundation, and Biocare.
REFERENCES
[1] | Almendro V , Marusyk A , Polyak K . Cellular heterogeneity and molecular evolution in cancer. Annual Review of Pathology. (2013) ;8: :277–302. |
[2] | Gerlinger M , Catto JW , Orntoft TF , Real FX , Zwarthoff EC , Swanton C . Intratumour heterogeneity in urologic cancers: From molecular evidence to clinical implications. European Urology. (2015) ;67: (4):729–37. |
[3] | Cyll K , Ersvaer E , Vlatkovic L , Pradhan M , Kildal W , Avranden Kjaer M et al., Tumour heterogeneity poses a significant challenge to cancer biomarker research. British Journal of Cancer. (2017) ;117: (3):367–75. |
[4] | Jamal-Hanjani M , Quezada SA , Larkin J , Swanton C . Translational implications of tumor heterogeneity. Clinical cancer Research: An Official Journal of the American Association for Cancer Research. (2015) ;21: (6):1258–66. |
[5] | Comprehensive molecular characterization of urothelial bladder carcinoma, Nature, (2014) ;507: (7492):315–22. |
[6] | Robertson AG , Kim J , Al-Ahmadie H , Bellmunt J , Guo G , Cherniack AD et al., Comprehensive Molecular Characterization of Muscle-Invasive Bladder Cancer. Cell. (2017) ;171: (3):540–56.e25. |
[7] | Thomsen MB , Nordentoft I , Lamy P , Hoyer S , Vang S , Hedegaard J et al., Spatial and temporal clonal evolution during development of metastatic urothelial carcinoma. Molecular Oncology. (2016) ;10: (9):1450–60. |
[8] | Thomsen MBH , Nordentoft I , Lamy P , Vang S , Reinert L , Mapendano CK et al., Comprehensive multiregional analysis of molecular heterogeneity in bladder cancer. Scientific Reports. (2017) ;7: (1):11702. |
[9] | Kononen J , Bubendorf L , Kallioniemi A , Barlund M , Schraml P , Leighton S et al., Tissue microarrays for high-throughput molecular profiling of tumor specimens. Nature Medicine. (1998) ;4: (7):844–7. |
[10] | Liedberg F , Anderson H , Chebil G , Gudjonsson S , Höglund M , Lindgren D , Lundberg LM , Lövgren K , Fernö M , Månsson W . Tissue microarray based analysis of prognostic markers in invasive bladder cancer: Much effort to no avail? Urol Oncol (2008) ;26: :17–24. |
[11] | Sjödahl G , Lovgren K , Lauss M , Patschan O , Gudjonsson S , Chebil G et al., Toward a molecular pathologic classification of urothelial carcinoma. The American Journal of Pathology. (2013) ;183: (3):681–91. |
[12] | Choi W , Porten S , Kim S , Willis D , Plimack ER , Hoffman-Censits J et al., Identification of distinct basal and luminal subtypes of muscle-invasive bladder cancer with different sensitivities to frontline chemotherapy. Cancer Cell. (2014) ;25: (2):152–65. |
[13] | Damrauer JS , Hoadley KA , Chism DD , Fan C , Tiganelli CJ , Wobker SE et al., Intrinsic subtypes of high-grade bladder cancer reflect the hallmarks of breast cancer biology, Proceedings of the National Academy of Sciences of the United States of America (2014) ;111: (8):3110–5. |
[14] | Patschan O , Sjödahl G , Chebil G , Lövgren K , Lauss M , Gudjonsson S et al., A Molecular Pathologic Framework for Risk Stratification of Stage T1 Urothelial Carcinoma. European Urology. (2015) ;68: (5):824–32; discussion 35–6. |
[15] | Seiler R , Ashab HAD , Erho N , van Rhijn BWG , Winters B , Douglas J et al., Impact of molecular subtypes in muscle-invasive bladder cancer on predicting response and survival after neoadjuvant chemotherapy. European Urology. (2017) ;72: (4):544–54. |
[16] | Kamat AM , Hahn NM , Efstathiou JA , Lerner SP , Malmstrom PU , Choi W et al., Bladder cancer, Lancet (London, England). (2016) ;388: (1006):2796–810. |
[17] | Sjödahl G , Eriksson P , Liedberg F , Höglund M . Molecular classification of urothelial carcinoma: Global mRNA classification versus tumour-cell phenotype classification. The Journal of pathology. (2017) ;242: (1):113–25. |
[18] | Sjödahl G . Molecular Subtype Profiling of Urothelial Carcinoma Using a Subtype-Specific Immunohistochemistry Panel. Methods in molecular biology (Clifton, NJ). (2018) ;1655: :53–64. |
[19] | R Core Team. R: A Language and Environment for Statistical Computing, Vienna, Austria (2017) . Retrieved from https://www.R-project.org/. |
[20] | Andor N , Graham TA , Jansen M , Xia LC , Aktipis CA , Petritsch C et al., Pan-cancer analysis of the extent and consequences of intratumor heterogeneity. Nature medicine. (2016) ;22: (1):105–13. |
[21] | Taylor CR , Levenson RM . Quantification of immunohistochemistry–issues concerning methods, utility and semiquantitative assessment II. Histopathology. (2006) ;49: (4):411–24. |
[22] | Amin MB , Smith SC , Reuter VE , Epstein JI , Grignon DJ , Hansel DE et al., Update for the practicing pathologist: The International Consultation On Urologic Disease-European association of urology consultation on bladder cancer. Modern Pathology: An official Journal of the United States and Canadian Academy of Pathology, Inc. (2015) ;28: (5):612–30. |
[23] | Comperat E , Varinot J . Immunochemical and molecular assessment of urothelial neoplasms and aspects of the World Health Organization classification. Histopathology. (2016) ;69: (5):717–26. |
[24] | Allott EH , Geradts J , Sun X , Cohen SM , Zirpoli GR , Khoury T et al., Intratumoral heterogeneity as a source of discordance in breast cancer biomarker classification. Breast Cancer Research: BCR. (2016) ;18: (1):68. |
[25] | Warrick JI , Hovelson DH , Amin A , Liu CJ , Cani AK , McDaniel AS et al., Tumor evolution and progression in multifocal and paired non-invasive/invasive urothelial carcinoma. Virchows Archiv: An International Journal of Pathology. (2015) ;466: (3):297–311. |
[26] | Abrahamsson J , Aaltonen K , Engilbertsson H , Liedberg F , Patschan O , Ryden L et al., Circulating tumor cells in patients with advanced urothelial carcinoma of the bladder: Association with tumor stage, lymph node metastases, FDG-PET findings, and survival. Urologic Oncology. (2017) ;35: (10):606.e9-.e16. |
[27] | Rink M , Chun FK , Dahlem R , Soave A , Minner S , Hansen J et al., Prognostic role and HER2 expression of circulating tumor cells in peripheral blood of patients prior to radical cystectomy: A prospective study. European Urology. (2012) ;61: (4):810–7. |
[28] | Felsenstein KM , Theodorescu D . Precision medicine for urothelial bladder cancer: Update on tumour genomics and immunotherapy. Nature reviews Urology. (2017) . |
[29] | Liu D , Abbosh P , Keliher D , Reardon B , Miao D , Mouw K et al., Mutational patterns in chemotherapy resistant muscle-invasive bladder cancer. Nat Commun. (2017) ;8: (1):2193. |
[30] | Teo MY , Bambury RM , Zabor EC , Jordan E , Al-Ahmadie H , Boyd ME et al., DNA Damage Response and Repair Gene Alterations Are Associated with Improved Survival in Patients with Platinum-Treated Advanced Urothelial Carcinoma. Clin Cancer Res. (2017) ;23: (14):3610–8. |
[31] | Urun Y , Leow JJ , Fay AP , Albiges L , Choueiri TK , Bellmunt J . ERCC1 as a prognostic factor for survival in patients with advanced urothelial cancer treated with platinum based chemotherapy: A systematic review and meta-analysis. Crit Rev Oncol Hematol. (2017) ;120: :120–6. |
[32] | Hu Z , Sun R , Curtis C . A population genetics perspective on the determinants of intra-tumor heterogeneity. Biochimica et Biophysica Acta. (2017) ;1867: (2):109–26. |
[33] | Van Batavia J , Yamany T , Molotkov A , Dan H , Mansukhani M , Batourina E , et al. Bladder cancers arise from distinct urothelial sub-populations. Nature Cell Biology. (2014) ;16: (10):982–91, 1-5. |
[34] | Tut VM , Braithwaite KL , Angus B , Neal DE , Lunec J , Mellon JK . Cyclin D1 expression in transitional cell carcinoma of the bladder: correlation with p53, waf1, pRb and Ki67. British Journal of Cancer. (2001) ;84: (2):270–5. |
[35] | Xie Y , Li P , Gao Y , Gu L , Chen L , Fan Y , et al. Reduced E-cadherin expression is correlated with poor prognosis in patients with bladder cancer: a systematic review and meta-analysis. Oncotarget. (2017) ;8: (37):62489–99. |
[36] | Mellon K , Wright C , Kelly P , Horne CH , Neal DE . Long-term outcome related to epidermal growth factor receptor status in bladder cancer. The Journal of Urology. (1995) ;153: (3 Pt 2):919–25. |
[37] | Mhawech-Fauceglia P , Cheney RT , Fischer G , Beck A , Herrmann FR . FGFR3 and p53 protein expressions in patients with pTa and pT1 urothelial bladder cancer. European Journal of Surgical Oncology: The Journal of the European Society of Surgical Oncology and the British Association of Surgical Oncology. (2006) ;32: (2):231–7. |
[38] | Miyamoto H , Izumi K , Yao JL , Li Y , Yang Q , McMahon LA , et al. GATA binding protein 3 is down-regulated in bladder cancer yet strong expression is an independent predictor of poor prognosis in invasive tumor. Human Pathology. (2012) ;43: (11):2033–40. |
[39] | Kruger S , Weitsch G , Buttner H , Matthiensen A , Bohmer T , Marquardt T , et al. HER2 overexpression in muscle-invasive urothelial carcinoma of the bladder: prognostic implications. International Journal of Cancer. (2002) ;102: (5):514–8. |
[40] | Kruger S , Mahnken A , Kausch I , Feller AC . P16 immunoreactivity is an independent predictor of tumor progression in minimally invasive urothelial bladder carcinoma. European Urology. (2005) ;47: (4):463–7. |
[41] | Urist MJ , Di Como CJ , Lu ML , Charytonowicz E , Verbel D , Crum CP , et al. Loss of p63 expression is associated with tumor progression in bladder cancer. The American Journal of Pathology. (2002) ;161: (4):1199–206. |
[42] | Wang P , Lin SL , Zhang LH , Li Z , Liu Q , Gao JX , et al. The prognostic value of P-cadherin in non-muscle-invasive bladder cancer. European Journal of Surgical Oncology: The Journal of the European Society of Surgical Onco-logy and the British Association of Surgical Oncology. (2014) ;40: (3):255–9. |
[43] | Grossman HB , Liebert M , Antelo M , Dinney CP , Hu SX , Palmer JL , et al. p53 and RB expression predict progression in T1 bladder cancer. Clinical Cancer Research: An Official Journal of the American Association for Cancer Research. (1998) ;4: (4):829–34. |


