
The Prognostic Role of the Change in Neutrophil-to-Lymphocyte Ratio During Neoadjuvant Chemotherapy in Patients with Muscle-Invasive Bladder Cancer: A Retrospective, Multi-Institutional Study
Abstract
Background:
The impact of the change in the neutrophil-to-lymphocyte ratio (NLR) during neoadjuvant chemotherapy (NAC) on outcomes in patients with muscle-invasive bladder cancer (MIBC) is poorly understood.
Objective:
To evaluate the prognostic impact of the change in NLR during NAC for patients with MIBC.
Methods:
Patients referred to academic, community, and quaternary referral centres in Alberta, Canada from 2005 to 2015, Ontario, Canada from 2005 to 2013, and Southampton, UK from 2004 to 2010 were evaluated. 376 eligible patients were treated with NAC for clinical T2-4aN0M0 disease, and 296 were evaluable for the change in NLR. A high NLR was defined as being an NLR > 3. Relationships between the change in NLR from baseline to mid-NAC (pre-cycle 3) and outcomes were analyzed using multivariable Cox regression. Kaplan-Meier analysis was used with the log-rank test for group comparisons.
Results:
Median follow-up was 22.0 months (95% confidence interval [CI]: 14.9–30.0). Patients with a sustained high NLR had a median disease-free survival (DFS) of 12.6 months, compared to 34.8 months for those with a sustained low NLR (log-rank test p = 0.0025; hazard ratio [HR] 0.61 [95% CI: 0.44–0.84]). Median overall survival (OS) was 19.4 months for patients with a sustained high NLR, compared to 44.0 months for patients with a sustained low NLR (log-rank test p = 0.0011; HR 0.54 [95% CI: 0.38–0.77]).
Conclusions:
A sustained high NLR from baseline to mid-NAC is an independent prognostic factor for patients with MIBC.
INTRODUCTION
Bladder cancer is the ninth most prevalent cancer worldwide. Outcomes for patients with muscle-invasive bladder cancer (MIBC) are poor. In North America, the standard treatment for patients with MIBC is neoadjuvant cisplatin-based combination chemotherapy (NAC) followed by radical cystectomy, based on level I evidence [1, 2]. In the UK, definitive chemoradiotherapy is frequently used. Approximately 50% of patients will develop metastatic disease within two years, with a median survival time of 12–15 months, and only 15% of patients survive five years [1]. Used since 2005, NAC is estimated to improve overall survival in MIBC by 5–8% [1–3]. While many patients will respond to NAC, some will not, and others will develop significant toxicity, highlighting the need to identify prognostic and predictive factors for these patients. Prognostic biomarkers provide information about a patient’s likely cancer outcome, independent of the treatment received, whereas predictive biomarkers are identified when the treatment effect differs between patients who are positive for the biomarker and patients who are negative for the biomarker. Genomic studies are improving our ability to prognosticate outcomes in bladder cancer patients. For instance, messenger RNA expression levels of various DNA repair genes, such as ERCC1 and ERCC2 in bladder cancer patients treated with platinum-based chemotherapy were found to predict for outcomes [4, 5]. Genetic mutations in DNA repair genes, ATM, RB1, and FANCC, were also found to predict pathologic response and clinical benefit in patients treated with cisplatin-based chemotherapy for MIBC [6]. Moreover, four molecular subtypes of MIBC (claudin-low, basal, luminal-infiltrated, and luminal), classified based on gene expression profiling, were recently found to predict response to cisplatin-based NAC [7].
Markers of the immune response to cancer also have potential as prognostic and predictive factors for bladder cancer patients. Inflammation is a protective response against foreign substances; however, it can also promote tumorigenesis and cancer progression. Cancer-associated inflammation is considered a hallmark of cancer [8]. Increased levels of serum inflammatory markers portend a poor prognosis in several malignancies, including urothelial carcinoma [9–12]. An elevated neutrophil-to-lymphocyte ratio (NLR), a measure of systemic inflammation, is associated with a poor prognosis in several solid malignancies [13–19].
NLR is a novel prognostic marker in bladder cancer. It has been found to improve the preoperative prediction of lymph node metastasis and survival outcomes in patients treated with radical cystectomy [11, 20, 21]. An elevated pre-cystectomy NLR predicts for poor recurrence-free survival in patients with MIBC, and correlates with disease progression and recurrence in patients with non-MIBC [22, 23]. Moreover, baseline NLR has been found to be an independent predictor in differentiating non-MIBC and MIBC [24, 25]. In MIBC, however, there is a gap in the literature surrounding the role of NLR in prognostication for patients undergoing NAC. A recent study found that a pre-treatment NLR < 2.5 could predict for better progression-free survival, cancer-specific survival, overall survival, and pathologic response in MIBC patients undergoing NAC [26]. Although perioperative changes in NLR are associated with survival, the change in NLR during NAC and its impact on outcomes is not fully understood [27]. The objectives of this study were to evaluate the prognostic role of baseline NLR on outcomes and the impact of the change in NLR over the course of NAC on outcomes in patients with MIBC. We hypothesize that an elevated baseline NLR and changes in NLR following initiation of NAC predict for patient survival.
PATIENTS AND METHODS
Patients
After obtaining local research ethics board approval, MIBC patients treated with NAC in Alberta, Canada from 2005–2015, the Princess Margaret Hospital in Ontario, Canada from 2005–2013, and University Hospital Southampton NHS Foundation Trust, Southampton, UK from 2004–2010 were evaluated. In Alberta, all patients referred to any cancer centre, including academic centres and community centres, were included. The Princess Margaret Hospital and University Hospital Southampton are quaternary referral centres. The time intervals varied depending on the available data that were independently collected at each site. All MIBC patients treated with NAC were identified using pharmacy records and confirmed by manual chart review. Patient records were retrospectively reviewed, and clinical, pathological, treatment, and outcome data were extracted. Patients with clinical T2-4aN0M0 disease were included in this analysis. Diagnosis was based on trans-urethral resection of the bladder tumour. Subsequent staging investigations with chest, abdominal and pelvic computed tomography (CT) scans were completed to rule out metastases. The TNM staging system was used, and the relevant edition for the year of diagnosis was utilised. After completing NAC, patients typically underwent repeat staging investigations, including CT imaging, and then proceeded on to a radical cystectomy, or in select patients, a bladder-preservation protocol. Repeat staging after NAC completion prior to definitive therapy was not required for inclusion. After definitive treatment, patients were followed at each centre as per local surveillance protocols.
The NLR was calculated as the serum absolute neutrophil count divided by the serum absolute lymphocyte count. The median population values of NLR at baseline and mid-NAC were decided a priori to be used as the NLR cut-off values for the respective timepoints. NLR values prior to initiation of preoperative chemotherapy (“baseline”), and before administration of the third cycle of NAC (“mid-NAC”) were obtained. Eligible patients had T2-4aN0M0 disease and were treated with at least one cycle of NAC. Evaluable patients were those who had adequate laboratory data available, including neutrophil and lymphocyte counts at baseline, or at baseline and mid-NAC. A total of 376 eligible patients were treated with NAC; 351 were evaluable for NLR and outcomes at baseline, and 296 were evaluable for NLR and outcomes at mid-NAC. The analysis population for overall survival (OS) and disease-free survival (DFS) with baseline NLR included all eligible patients with a baseline NLR value who commenced NAC. The analysis population for OS and DFS with the change in NLR included eligible patients with baseline and mid-NAC NLR values, who underwent definitive curative-intent treatment (either radical cystectomy or a bladder preserving regimen). Patients were excluded if their blood work data or initial staging information were unavailable in the electronic health records. 25 of the 376 eligible patients were not evaluable for NLR and outcomes at baseline, and 80 eligible patients were not evaluable for NLR and outcomes at mid-NAC, due to the unavailability of baseline or mid-NAC NLR data, respectively. The standard NAC regimen delivered was platinum-based and for a planned four cycles. Patients were evaluated clinically and biochemically prior to each cycle of NAC.
Statistical analysis
Discrete and continuous variables at baseline were analyzed by Fisher’s Exact Test and Wilcoxon rank-sum test, respectively. The co-primary endpoints were to evaluate the impact of the change in NLR from baseline to mid-NAC on DFS and OS. The secondary endpoints were to evaluate the impact of baseline NLR on DFS and OS. DFS was defined as the time from the date of the first cycle of NAC to the time of disease recurrence, death, or last follow-up. OS was defined as the time from the date of the first cycle of NAC to the time of death or last follow-up. DFS and OS were estimated using Kaplan-Meier analysis with the log-rank test for group comparisons. Cox proportional hazard regression was used to adjust for the impact of gender, initial cancer stage, and age. All statistical analyses used 2-sided p-values of <0.05 to be considered significant.
RESULTS
A total of 351 evaluable patients who commenced NAC between 2004 and 2015 were evaluated. The median NLR at baseline was 3.0 in this study population, and the median mid-NAC NLR was 1.8. These values were used to determine the change in NLR; for instance, a high-to-low NLR was defined as a baseline NLR > 3.0 and a mid-NAC treatment NLR≤1.8. Baseline and treatment characteristics are outlined in Table 1. The median age of diagnosis was 69 years (range: 37–84) for patients with a high baseline NLR, and 65 (range: 36–87) for patients with a low baseline NLR (Table 1). Most patients were male in both categories (77% and 72%, respectively). The median follow-up for the entire cohort was 22.0 months (95% confidence interval [CI]: 14.9–30.0). Most patients (90.3%) were treated with cisplatin and gemcitabine in three-week cycles, for a median of four cycles. Four patients died during NAC; one died of a stroke, one of likely opioid toxicity, one of rapid progression with the development of lung disease concerning for a second primary, and one patient died of an unknown cause. The majority of the evaluable patients (73.5%) underwent radical cystectomy, and 46 (13.1%) underwent curative-intent bladder preservation therapy in the form of radiotherapy to the bladder with or without concurrent platinum-based chemotherapy. Moreover, 14 (4.0%) patients did not undergo curative-intent definitive treatment due to progression during NAC, ten (2.8%) patients were unfit for curative-intent definitive treatment after completion of NAC, and 23 (6.6%) patients had insufficient data available to determine whether they received any definitive treatment.
Table 1
Baseline patient, disease, treatment characteristics, disease-free survival (DFS), and overall survival (OS)for patients with pre-neoadjuvant chemotherapy (NAC) neutrophil-to-lymphocyte ratio (NLR) >3(high) or NLR ≤ 3 (low)
| Baseline NLR > 3 (high) n = 167 (%) | Baseline NLR≤3 (low) n = 184 (%) | P | |
| Age at diagnosis, median (range) | 69 (37–84) | 65 (36–87) | 0.049 |
| Gender | |||
| Male | 129 (77.2) | 133 (72.3) | 0.326 |
| Female | 38 (22.8) | 51 (27.7) | |
| Baseline T stage | |||
| pT2 | 119 (71.3) | 143 (77.7) | 0.016 |
| pT3 | 28 (16.8) | 34 (18.5) | |
| pT4a | 20 (12.0) | 7 (3.8) | |
| ECOG performance status | |||
| 0 | 72 (43.1) | 99 (53.8) | 0.030 |
| 1 | 33 (19.8) | 30 (16.3) | |
| 2 | 8 (4.8) | 2 (1.1) | |
| 3 | 1 (0.6) | 0 (0.0) | |
| Missing | 53 (31.7) | 53 (28.8) | |
| Treatment regimen | |||
| Cisplatin/Gemcitabine regular-21 | 146 (87.4) | 171 (92.9) | 0.262 |
| Cisplatin/Gemcitabine regular-28 | 1 (0.1) | 2 (1.1) | |
| Cisplatin/Gemcitabine split dose | 6 (3.6) | 5 (2.7) | |
| Carboplatin/Gemcitabine | 11 (6.6) | 4 (2.2) | |
| Other | 3 (1.8) | 2 (1.1) | |
| Number of cycles of NAC, median (range) | 3 (1–6) | 4 (1–6) | 0.139 |
| Time from diagnosis to treatment, median months (range) | 1.8 (0.1–16.2) | 1.7 (0.1–36.9) | |
| Time of follow-up, median months, (95% CI) | 22.0 (14.7–38.5) | 23.1 (13.5–35.2) | |
| Reason for stopping NAC | |||
| NAC complete | 112 (67.1) | 144 (78.3) | 0.046 |
| Disease progression | 8 (4.8) | 6 (3.3) | |
| Toxicity | 35 (21.0) | 27 (14.7) | |
| Other | 11 (6.6) | 4 (2.2) | |
| Unknown | 1 (0.6) | 3 (1.6) | |
| DFS, median months (95% CI) | 12.6 (10.1–23.0) | 34.8 (23.6–45.5) | 0.0025 |
| OS, median months (95% CI) | 19.4 (14.4–34.4) | 44.0 (32.3–69.0) | 0.0011 |
Of the 351 patients who were evaluable for NLR and outcomes at baseline, 167 had a high NLR (NLR > 3), and 184 patients had a low NLR (NLR≤3). Patients with NLR > 3.0 had a worse DFS compared to patients with NLR≤3 (log-rank test p = 0.0025, median DFS 12.6 vs. 34.8 months, Fig. 1a), with an adjusted hazard ratio (HR) of 0.61 (95% CI: 0.44–0.84; p < 0.001, Table 1). Patients with a baseline NLR > 3.0 had poor OS compared to patients with NLR≤3 (log-rank test p = 0.0011, median OS 19.4 vs. 44.0 months; Fig. 1b), with an adjusted HR of 0.54 (95% CI: 0.38–0.77; p < 0.001, Table 1). Patients were separated into the following four groups based on the change in NLR: baseline NLR > 3.0 and mid-NAC NLR > 1.8 (high-to-high), baseline NLR > 3.0 and mid-NAC NLR≤1.8 (high-to-low), baseline NLR≤3 and mid-NAC NLR > 1.8 (low-to-high), and baseline NLR≤3 and mid-NAC NLR≤1.8 (low-to-low). Of the 296 patients who were evaluable for NLR and outcomes after two cycles of treatment, 95 patients had high-to-high NLR, 43 patients had high-to-low NLR, 52 patients had low-to-high NLR, and 106 patients had low-to-low NLR. Patients with a sustained high NLR had a worse DFS compared to patients with a sustained low NLR (log-rank test p < 0.001, median DFS 10.0 vs. 41.0 months; Fig. 2a), with an adjusted HR of 0.43 (95% CI: 0.28–0.67; p < 0.001, Table 2). The 3-year DFS rate for patients with a sustained high NLR was 24% (standard error [SE] = 0.07; 95% CI: 0.14–0.42), compared to 58% (SE = 0.06; 95% CI: 0.46–0.72) for patients with a sustained low NLR (Table 2). Similarly, patients with a sustained high NLR had a worse OS compared to patients with a sustained low NLR (log-rank test p < 0.001, median OS 16.9 vs. 52.0 months, Fig. 2b), and an adjusted HR of 0.36 (95% CI: 0.22–0.58; p < 0.001, Table 2). The 3-year OS rate for patients with a sustained high NLR was 29% (SE = 0.07; 95% CI: 0.18–0.47), compared to 64% (SE = 0.06; 95% CI: 0.52–0.77) for patients with a sustained low NLR(Table 2).
Fig.1.
a. Disease-free survival (DFS) for a baseline neutrophil-to-lymphocyte ratio (NLR) > 3 (high) or NLR ≤ 3 (low). b. Overall survival (OS) for a baseline neutrophil-to-lymphocyte ratio (NLR) > 3 (high) or NLR ≤ 3 (low).
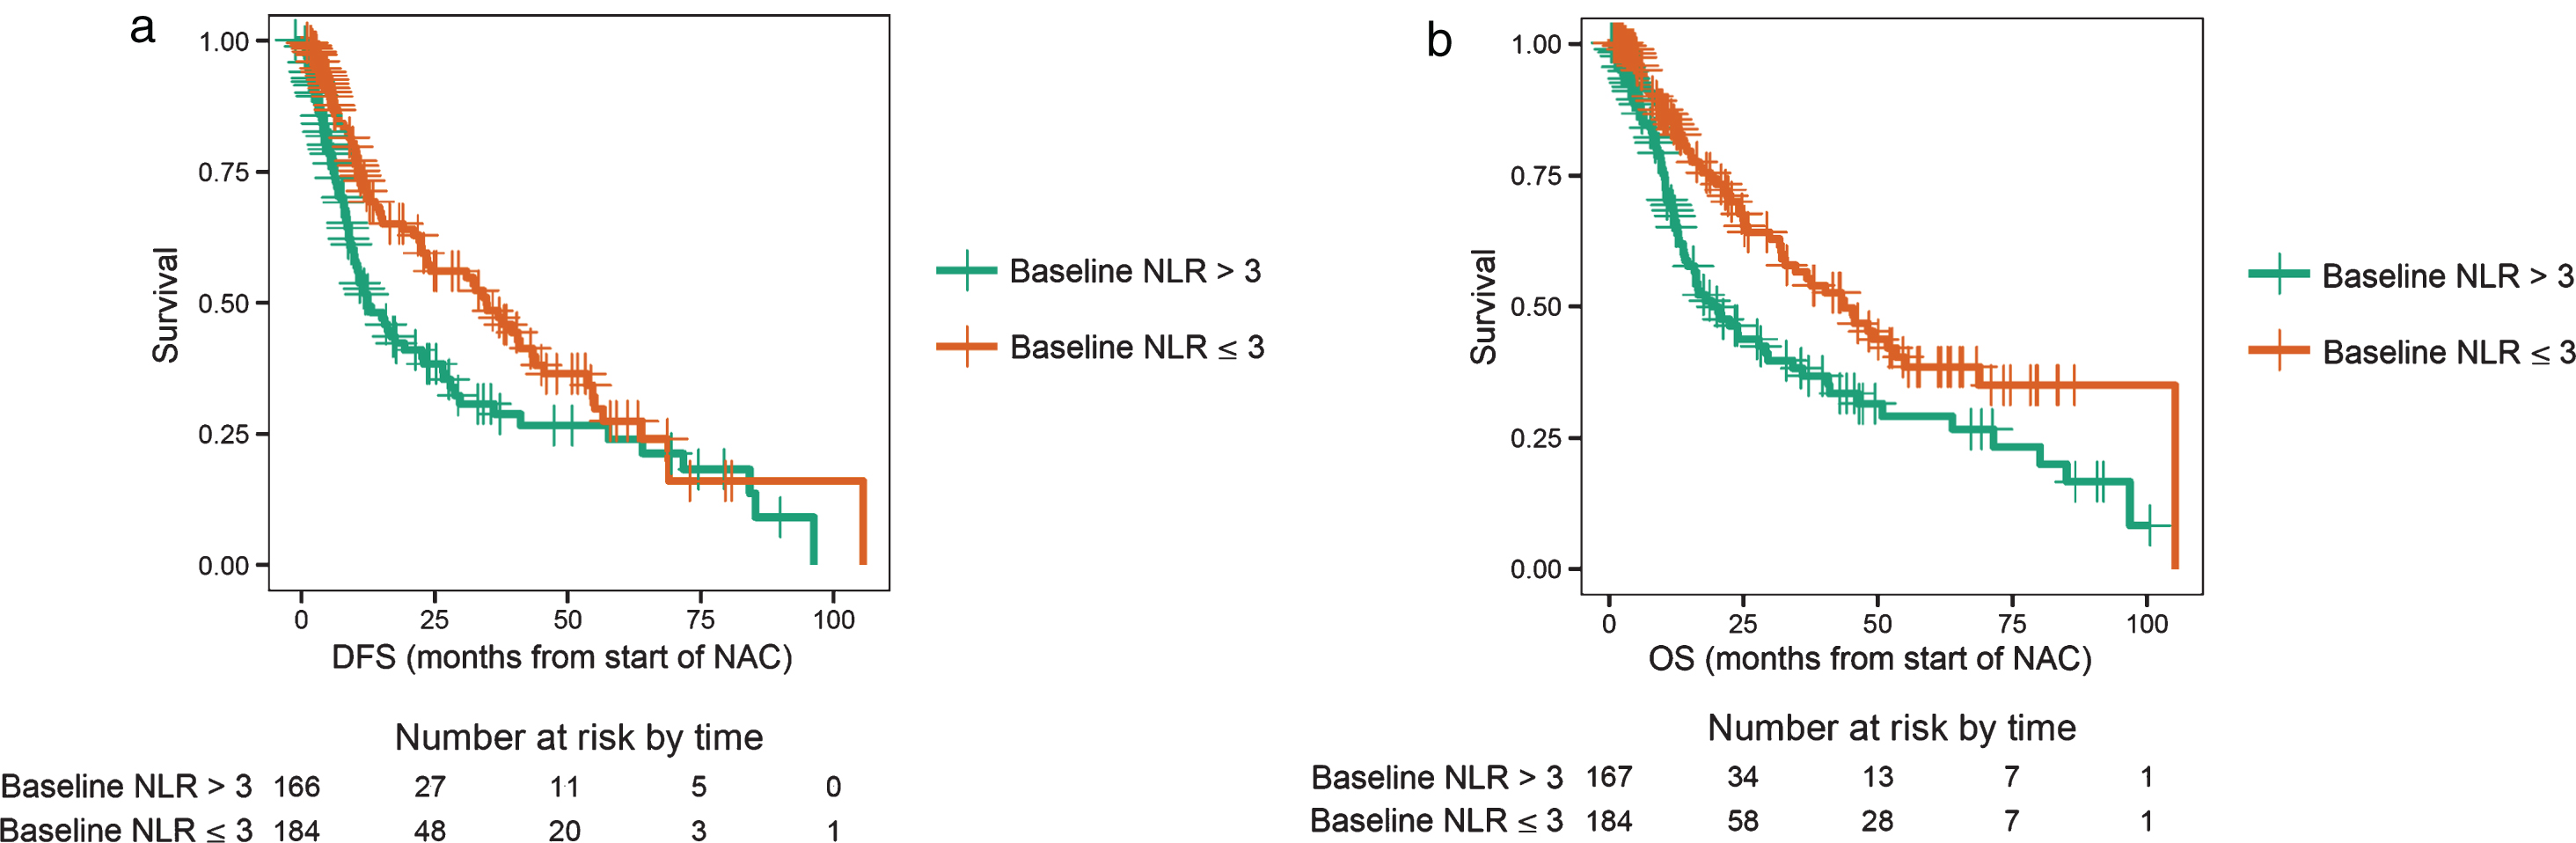
Fig.2.
a. Disease-free survival (DFS) for changes in the neutrophil-to-lymphocyte ratio (NLR). b. Overall survival (OS) for changes in the neutrophil-to-lymphocyte ratio (NLR).
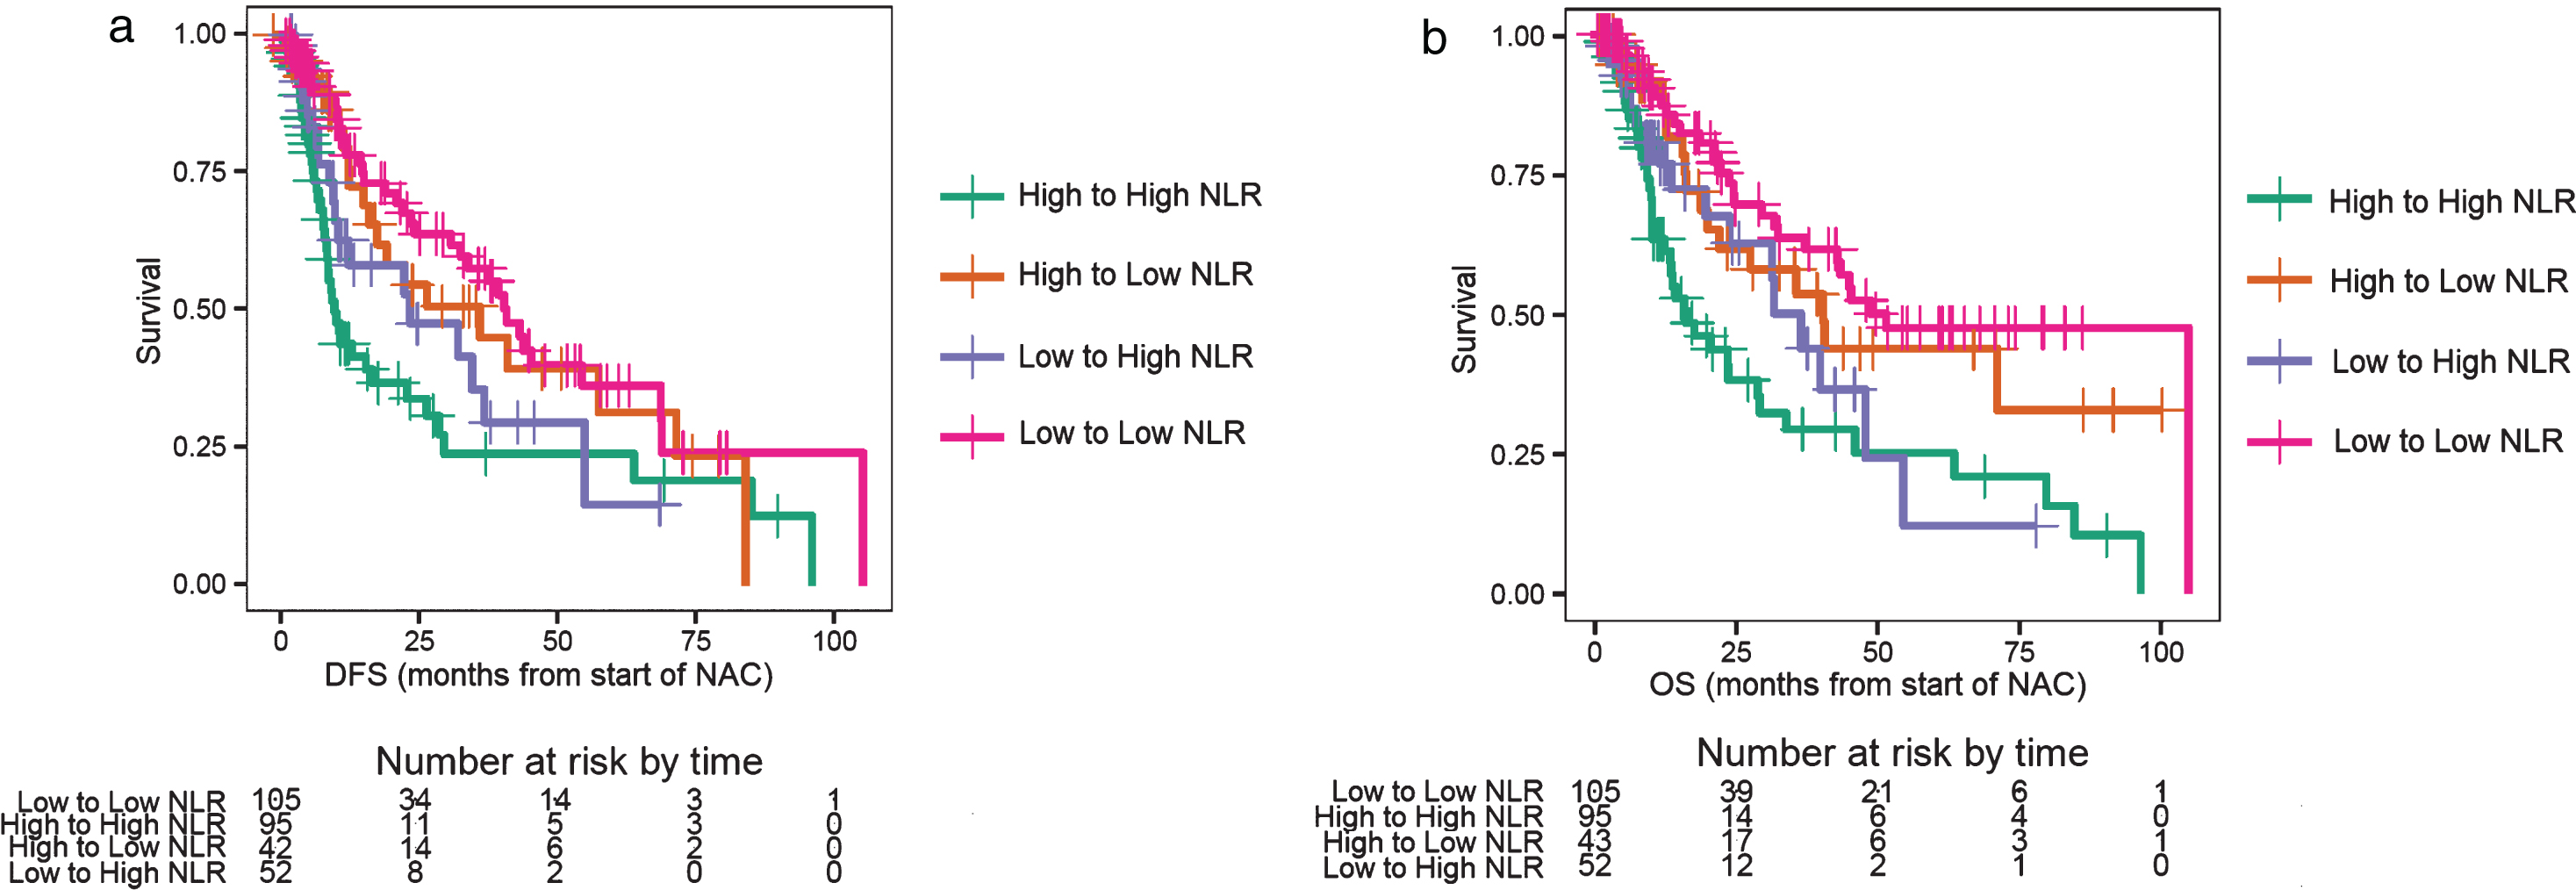
Table 2
Prognostic role of the change in the neutrophil-to-lymphocyte ratio (NLR; four groups) on outcomes (disease-free survival [DFS] and overall survival [OS]), as well as 3-year DFS and OS rates. Hazard ratios are adjusted for gender, initial stage, and age at diagnosis, as compared with group HIGH to HIGH NLR
| DFS, median months (95% CI) | HR (95% CI) p-value | OS, median months (95% CI) | HR (95% CI) p-value | DFS, 3-year rate (SE; 95% CI) | OS, 3-year rate (SE; 95% CI) | |
| HIGH to HIGH n = 95 | 10.0 (8.6–26.6) | 16.9 (13.1–29.8) | 0.24 (0.07; 0.14–0.42) | 0.29 (0.07; 0.18–0.47) | ||
| HIGH to LOW n = 43 | 36.2 (17.7-NR) | 0.53 (0.31–0.90) p = 0.02 | 40.9 (22.6-NR) | 0.49 (0.27–0.87) p = 0.01 | 0.51 (0.09; 0.35–0.73) | 0.58 (0.09; 0.43–0.79) |
| LOW to HIGH n = 52 | 23.6 (10.7-NR) | 0.72 (0.42–1.24) p = 0.23 | 37.0 (24.4-NR) | 0.68 (0.39–1.21) p = 0.19 | 0.36 (0.10; 0.20–0.63) | 0.50 (0.11; 0.33–0.77) |
| LOW to LOW n = 106 | 41.0 (32.7–69.0) | 0.43 (0.28–0.67) p < 0.001 | 52.0 (43.4-NR*) | 0.36 (0.22–0.58) p < 0.001 | 0.58 (0.06; 0.46–0.72) | 0.64 (0.06; 0.52–0.77) |
*not yet reached.
Patients with a high baseline NLR, which was sustained after receiving two cycles of NAC, were of particular interest, as these patients were hypothesized to have the worst outcomes. These patients were considered “poor-risk” and were compared to all other patients (any low NLR groups) who were considered “favourable-risk”. Of the 296 evaluable patients, 95 patients were poor-risk and 201 patients were favourable-risk. Patients in the poor-risk category had a median DFS of 10.0 months, compared to 36.2 months for those with favourable-risk (log-rank test p < 0.001; Fig. 3a), with an adjusted HR of 0.51 (95% CI: 0.35–0.74; p < 0.001, Table 3). Likewise, patients in the poor-risk category had a median OS of 16.9 months, compared to 44.0 months for those with favourable-risk (log-rank test p < 0.001, Fig. 3b), with an adjusted HR of 0.45 (95% CI: 0.30–0.67; p < 0.001, Table 3).
Fig.3.
a. Disease-free survival (DFS) for patients with ‘poor-risk’ disease compared with ‘favourable-risk’ disease. Poor-risk patients had a sustained high neutrophil-to-lymphocyte ratio (NLR) after two cycles of neoadjuvant chemotherapy (NAC). b. Overall survival (OS) for patients with ‘poor-risk’ disease compared with ‘favourable-risk’ disease. Poor-risk patients had a sustained high neutrophil-to-lymphocyte ratio (NLR) after two cycles of neoadjuvant chemotherapy (NAC).
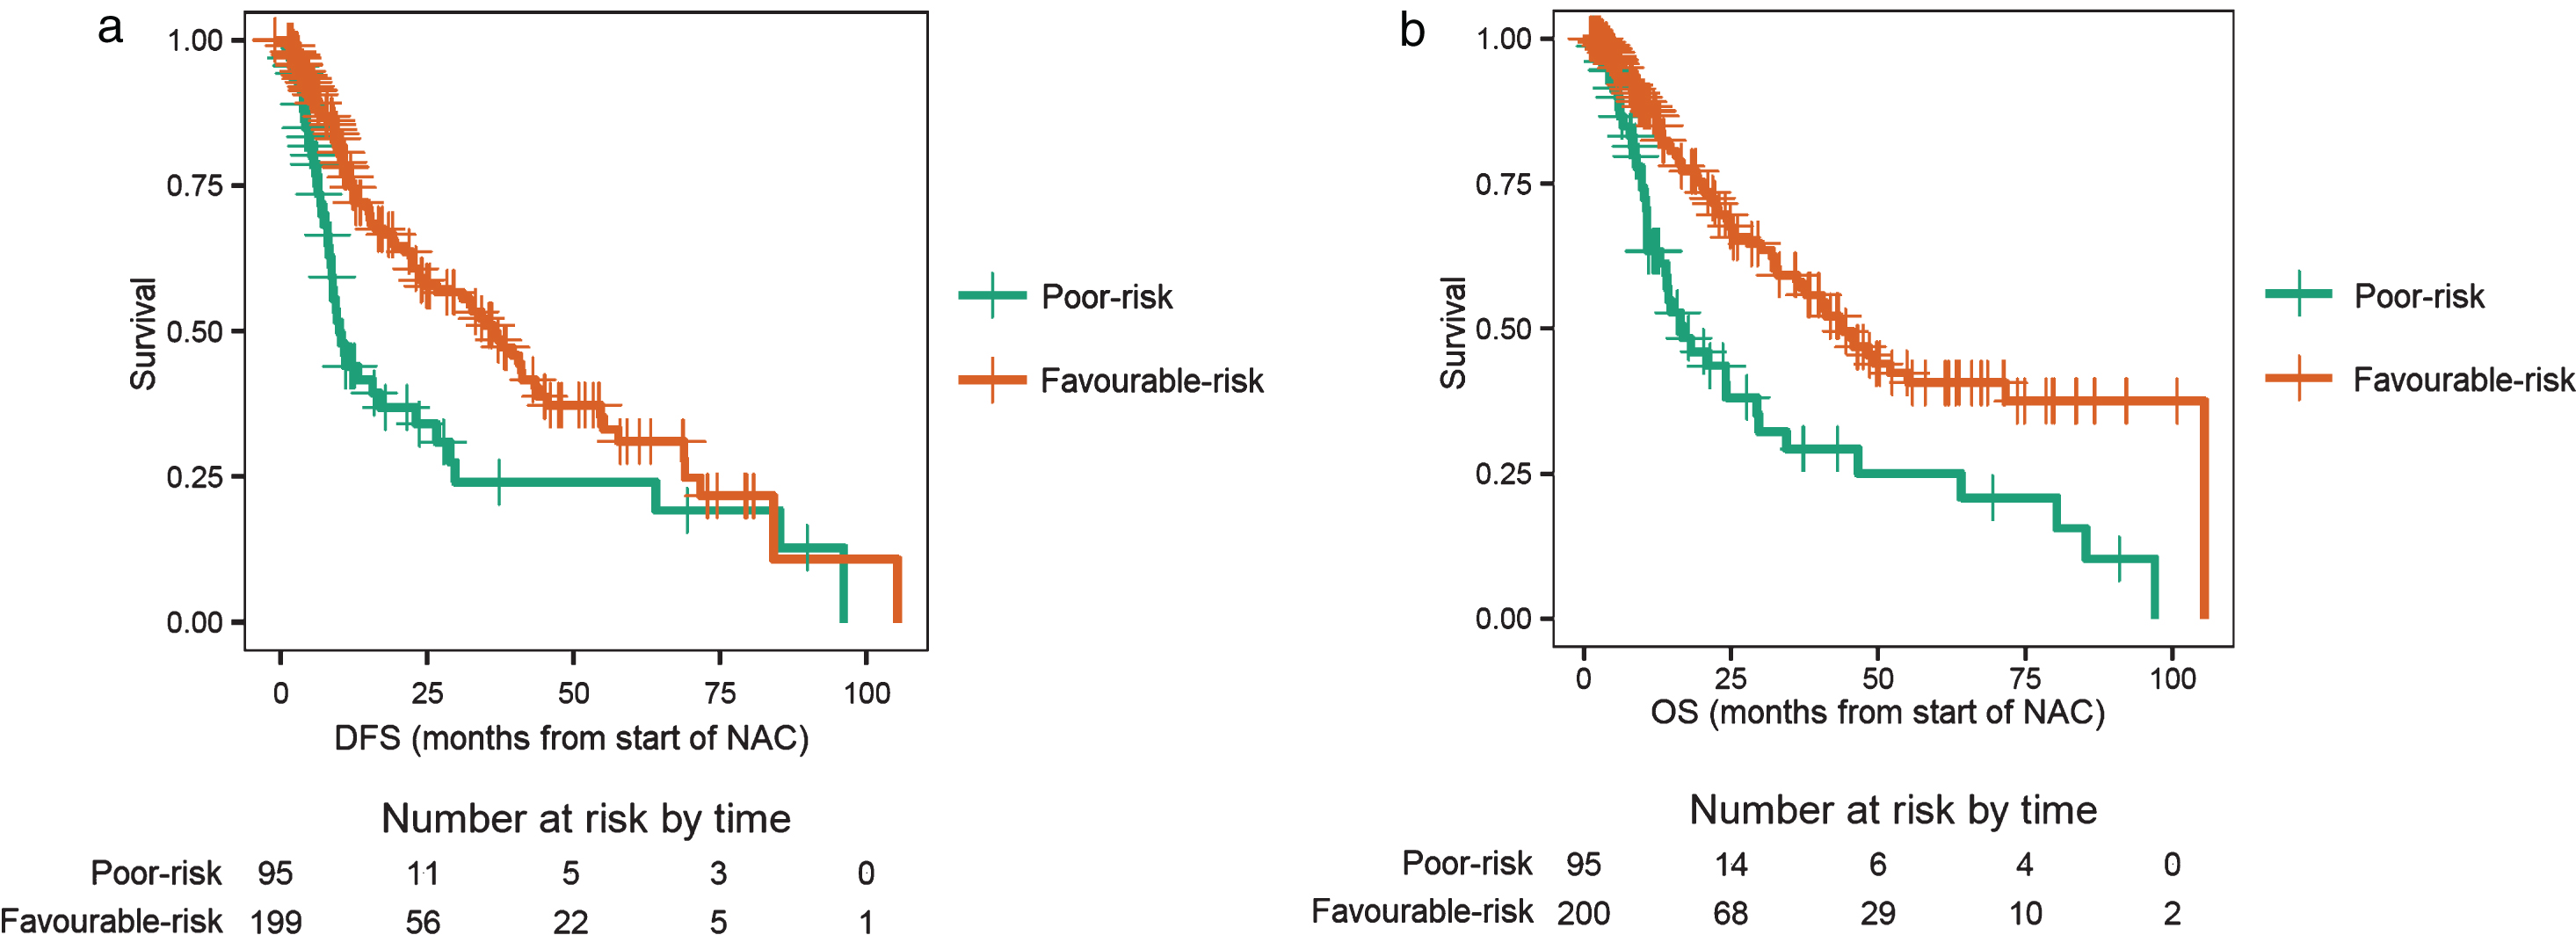
Table 3
Prognostic role of the change in the neutrophil-to-lymphocyte ratio (NLR; two groups) on outcomes (disease-free survival [DFS] and overall survival [OS]). Hazard ratios are adjusted for gender, initial stage, and age at diagnosis
| DFS, median months (95% CI) | OS, median months (95% CI) | |
| Poor-risk n = 95 | 10.0 (8.6–26.6) | 16.9 (13.1–29.8) |
| Favourable-risk n = 201 | 36.2 (24.3–45.5) | 44.0 (36.2-NR*) |
| HR 0.51 (95% CI: 0.35–0.74) p < 0.001 | HR 0.45 (95% CI: 0.30–0.67) p < 0.001 |
*not yet reached.
We further separated the patients by stage (stage II vs. stage III disease). There was a consistent association between NLR and survival outcomes in the stage II and stage III groups. Stage II patients with a high baseline NLR had a DFS of 16.9 months and an OS of 22.6 months, compared to stage II patients with a low baseline NLR, who had a DFS of 34.2 months and an OS of 40.4 months. Stage III patients with a high baseline NLR had a DFS of 10.9 months and an OS of 14.4 months, compared to stage III patients with a low baseline NLR, who had a DFS of 54.6 months and an OS of 105.3 months. We also analyzed stratified Cox regression models. After stratifying by stage of disease, we found similar hazard ratios to the original Cox regression analyses (see supplementary data).
In addition, after stratifying by baseline NLR, mid-NAC NLR was significantly associated with DFS (HR = 0.56 [95% CI: 0.38–0.83]; p < 0.001) and OS (HR = 0.51 [95% CI: 0.33–0.77]; p < 0.001); however, the converse was not true (see supplementary data).
DISCUSSION
There is a need to better prognosticate for patients with MIBC. To our knowledge, this study is the first of its kind to investigate the independent prognostic role of the change in NLR from baseline to mid-NAC in MIBC patients. As a secondary outcome, this study also confirms that baseline NLR correlates with survival. We have demonstrated that baseline NLR, and the change in NLR from baseline to mid-NAC are independent prognostic factors for DFS and OS. A sustained low NLR from baseline to mid-NAC is significantly associated with better DFS and OS in MIBC patients, compared to a sustained high NLR. Patients can be stratified into poor-risk (sustained high NLR) and favourable-risk (any low NLR) groups, between which DFS and OS significantly differ. These results are interesting and warrant validation in a larger cohort using these values to categorize patients based on the change in NLR.
The median NLR at baseline was 3.0 in this study population, similar to previous reports in MIBC [28]. These results are also consistent with data examining the role of NLR in patients with solid malignancies receiving systemic therapy. For instance, NLR≥3.1 at baseline and post-chemotherapy change were independent prognostic factors for OS in patients with advanced pancreatic cancer undergoing chemotherapy [29]. In unresectable gastric cancer, patients with a high baseline NLR had decreased DFS and OS while patients with a low NLR after first-line chemotherapy had improved OS compared with those with a high NLR post-treatment [30]. In MIBC, studies have explored the impact of baseline and peri-operative NLR changes on outcomes. One study demonstrated that a high pre-operative NLR, or an NLR that increased during post-operative follow-up, were markers for early detection of recurrence [31]. This study did not evaluate the change in NLR with NAC, but rather the change in NLR from baseline to three months after cystectomy. Moreover, a high pre-operative NLR, or a sustained high perioperative NLR was associated with worse oncologic outcomes than other NLR groups in patients treated with radical cystectomy [32]. This also did not evaluate patients who received NAC. In another study, perioperative changes in NLR were significantly associated with OS in patients undergoing radical cystectomy, and patients with a high post-operative NLR who had a decrease in NLR after adjuvant chemotherapy had improved outcomes [27]. However, the clinical applicability of this data is limited by the fact that current guidelines recommend NAC rather than adjuvant chemotherapy. Nonetheless, the change in NLR during NAC has been associated with pathological response rates, with a decrease in NLR with NAC correlating to pathologic responses [33]. NLR values were collected within one week of starting NAC, at mid-NAC (pre-cycle three), and before radical cystectomy. The study was a preliminary study, evaluating pathological complete response only among patients treated with NAC. Our current study further clarifies the prognostic role of NLR for MIBC patients receiving NAC, and is unique in that it demonstrates the impact on DFS and OS in this group of patients who receive the current standard of care, NAC. By assessing patients midway through NAC, this introduces an earlier opportunity for patient risk stratification to guide clinical decision-making. Moreover, NLR is a convenient prognostic marker which is easily accessible from standard of care blood work, making it a tool that can be used in real-time and at no additional cost.
Changes in NLR with NAC may result from NAC-associated decreased tumour burden through interactions between the tumourigenic microenvironment and the host immune response. A decreased tumour burden resulting from a response to NAC may improve tumour-associated systemic inflammation, thereby reducing NLR. A low NLR reflects fewer serum neutrophils, which have been shown to produce pro-tumourigenic cytokines and pro-angiogenic vascular endothelial growth factor [34]. A low NLR also reflects higher relative serum lymphocytes, which exhibit an antitumour immune response to combat malignancy. It follows that an increased tumour burden from a lack of response to NAC could perpetuate the recruitment of cells that can display pro-oncogenic functions, such as neutrophils, thereby resulting in a high NLR. This reasoning is consistent with the results of this study, which found that a low NLR, as a marker of systemic inflammation, and a decrease in this marker during NAC, is significantly associated with better oncologic outcomes.
The retrospective design of this study introduces limitations, such as the absence of data on potential confounding factors, differential losses to follow-up, and information bias. Further prospective studies with larger patient cohorts and evaluations of possible confounding effects of unobserved patient characteristics are warranted. Alternatively, patients with a low baseline NLR (NLR≤3) had a median of four treatment cycles, whereas patients with a high baseline NLR (NLR > 3) had a median of three cycles, although this difference was not statistically significant. A lower median number of treatment cycles may have resulted from earlier disease progression in patients with a high baseline NLR. Nonetheless, it is possible that differences in median cycle numbers could lead to differences in outcomes, as patients who complete the full course of chemotherapy are generally more likely to have favourable outcomes. In addition, our stratified Cox regression analyses showed that although mid-NAC NLR was significantly associated with DFS and OS after stratifying by baseline NLR, baseline NLR was not significantly associated with DFS or OS after stratifying by mid-NAC NLR. Moreover, using the mid-NAC NLR to prognosticate the DFS or OS from the start of NAC carries a bias. We did not have the date of the blood draw leading to the mid-NAC NLR to use this for the calculations. To obtain an estimate of this bias, we reran some of the analyses using the “landmark method” in which DFS and OS were calculated from 2.5 months past the start of NAC (by which time the mid-NAC NLR would have been determined) [35]. Table S5 in the Supplemental Material summarizes the results, which are consistent with the results obtained from using the start of NAC for the calculations. At the time of diagnosis, mid-NAC NLR is not available, thus baseline NLR remains important for predicting outcome for MIBC patients who are starting NAC. Nonetheless, our analysis suggests that there may be value in revising the prognosis after the commencement of NAC by using the mid-NAC NLR to evaluate prognosis. This aspect warrants further study. Moreover, there was some variability in definitive management strategies and surveillance protocols between the various institutions, which could introduce biases. For instance, more patients in the UK receive concurrent chemoradiotherapy for definitive treatment. However, this variability in definitive management strategies and surveillance protocols may increase the generalizability of our results. In addition, the impact of the change in NLR on pathological complete response rates could not be evaluated due to the insufficient availability of pathologic data. We suggest prospective validation of these results in clinical trials to assess the clinical utility of NLR in patients with MIBC before routine use of this putative biomarker in clinical practice. Nonetheless, our results are consistent with those of previous studies demonstrating an association between NLR and oncologic outcomes, and suggest a role for NLR in prognostication for MIBC patients. The NLR, and its change during NAC, is a readily available tool which could easily be incorporated into clinical practice, and may aid in risk stratification.
CONCLUSIONS
NLR is an independent prognostic factor for patients with MIBC undergoing NAC. A high baseline NLR and a sustained high NLR from baseline to mid-NAC are significantly associated with inferior outcomes. As an inexpensive, reproducible, and widely accessible test that is based on commonly measured parameters, NLR has a role in prognostication for MIBC patients being treated with NAC.
CONFLICT OF INTEREST
The authors have no conflicts of interest to report.
ACKNOWLEDGMENTS
This research did not receive any specific grant from funding agencies in the public, commercial, or not-for-profit sectors. No financial or material support was received for this study.
SUPPLEMENTARY MATERIAL
[1] The supplementary material is available in the electronic version of this article: http://dx.doi.org/10.3233/BLC-170133.
REFERENCES
[1] | von der Maase H , Sengelov L , Roberts JT , Ricci S , Dogliotti L , Oliver T , et al. Long-term survival results of a randomized trial comparing gemcitabine plus cisplatin, with methotrexate, vinblastine, doxorubicin, plus cisplatin in patients with bladder cancer. J Clin Oncol. (2005) ;23: (21):4602–8. |
[2] | Grossman HB , Natale RB , Tangen CM , Speights VO , Vogelzang NJ , Trump DL , et al. Neoadjuvant chemotherapy plus cystectomy compared with cystectomy alone for locally advanced bladder cancer. N Engl J Med. (2003) ;349: (9):859–66. |
[3] | Advanced Bladder Cancer Meta-analysis Collaboration A. Neoadjuvant chemotherapy in invasive bladder cancer: Update of a systematic review and meta-analysis of individual patient data advanced bladder cancer (ABC) meta-analysis collaboration. Eur Urol. (2005) ;48: (2):202–5. |
[4] | Bellmunt J , Paz-Ares L , Cuello M , Cecere FL , Albiol S , Guillem V , et al. Gene expression of ERCC1 as a novel prognostic marker inadvanced bladder cancer patients receiving cisplatin-basedchemotherapy. Ann Oncol. (2007) ;18: (3):522–8. |
[5] | Font A , Taron M , Gago JL , Costa C , Sanchez JJ , Carrato C , et al. BRCA1 mRNA expression and outcome to neoadjuvant cisplatin-based chemotherapy in bladder cancer. Ann Oncol. (2011) ;22: (1):139–44. |
[6] | Plimack ER , Dunbrack RL , Brennan TA , Andrake MD , Zhou Y , Serebriiskii IG , et al. Defects in DNA Repair Genes Predict Response to Neoadjuvant Cisplatin-based Chemotherapy in Muscle-invasive Bladder Cancer. Eur Urol. (2015) ;68: (6):959–67. |
[7] | Seiler R , Ashab HA , Erho N , van Rhijn BW , Winters B , Douglas J , et al. Impact of Molecular Subtypes in Muscle-invasive Bladder Cancer on Predicting Response and Survival after Neoadjuvant Chemotherapy. Eur Urol. (2017) . |
[8] | Hanahan D , Weinberg RA . Hallmarks of cancer: The next generation. Cell. (2011) ;144: (5):646–74. |
[9] | Morizane S , Iwamoto H , Yao A , Isoyama T , Sejima T , Takenaka A . Serum C-reactive protein level is a significant prognostic indicator in patients with advanced urothelial cancer treated with gemcitabine-cisplatin or carboplatin - preliminary results. Cent European J Urol. (2012) ;65: (2):62–6. |
[10] | Hilmy M , Bartlett JM , Underwood MA , McMillan DC . The relationship between the systemic inflammatory response and survival in patients with transitional cell carcinoma of the urinary bladder. Br J Cancer. (2005) ;92: (4):625–7. |
[11] | Marchioni M , Primiceri G , Ingrosso M , Filograna R , Castellan P , De Francesco P , et al. The clinical use of the neutrophil to lymphocyte ratio (NLR) in urothelial cancer: A systematic review. Clin Genitourin Cancer. (2016) ;14: (6):473–84. |
[12] | Ku JH , Kang M , Kim HS , Jeong CW , Kwak C , Kim HH . The prognostic value of pretreatment of systemic inflammatory responses in patients with urothelial carcinoma undergoing radical cystectomy. Br J Cancer. (2015) ;112: (3):461–7. |
[13] | Tang L , Li X , Wang B , Luo G , Gu L , Chen L , et al. Prognostic value of neutrophil-to-lymphocyte ratio in localized and advanced prostate cancer: A systematic review and meta-analysis. PLoS ONE. (2016) ;11: (4):e0153981. |
[14] | Li Y , Liu X , Zhang J , Yao W . Prognostic role of elevated preoperative systemic inflammatory markers in localized soft tissue sarcoma. Cancer Biomark. (2016) ;16: (3):333–42. |
[15] | Lu SD , Wang YY , Peng NF , Peng YC , Zhong JH , Qin HG , et al. Preoperative ratio of neutrophils to lymphocytes predicts postresection survival in selected patients with early or intermediate stage hepatocellular carcinoma. Medicine (Baltimore). (2016) ;95: (5):e2722. |
[16] | Musri FY , Mutlu H , Eryilmaz MK , Salim DK , Gunduz S , Coskun HS . The neutrophil to lymphocyte ratio is an independent prognostic factor in patients with metastatic gastric cancer. Asian Pac J Cancer Prev. (2016) ;17: (3):1309–12. |
[17] | Cho H , Hur HW , Kim SW , Kim SH , Kim JH , Kim YT , et al. Pre-treatment neutrophil to lymphocyte ratio is elevated in epithelial ovarian cancer and predicts survival after treatment. Cancer Immunol Immunother. (2009) ;58: (1):15–23. |
[18] | Li MX , Liu XM , Zhang XF , Zhang JF , Wang WL , Zhu Y , et al. Prognostic role of neutrophil-to-lymphocyte ratio in colorectal cancer: A systematic review and meta-analysis. Int J Cancer. (2014) ;134: (10):2403–13. |
[19] | Wei Y , Jiang YZ , Qian WH . Prognostic role of NLR in urinarycancers: A meta-analysis. PLoS One. (2014) ;9: (3):e92079. |
[20] | Potretzke A , Hillman L , Wong K , Shi F , Brower R , Mai S , et al. NLR is predictive of upstaging at the time of radical cystectomy for patients with urothelial carcinoma of the bladder. Urol Oncol. (2014) ;32: (5):631–6. |
[21] | D’Andrea D , Moschini M , Gust KM , Abufaraj M , Ozsoy M , Mathieu R , et al. Lymphocyte-to-monocyte ratio and neutrophil-to-lymphocyteratio as biomarkers for predicting lymph node metastasis andsurvival in patients treated with radical cystectomy. J Surg Oncol. (2017) . |
[22] | Mano R , Baniel J , Shoshany O , Margel D , Bar-On T , Nativ O , et al. Neutrophil-to-lymphocyte ratio predicts progression and recurrence of non-muscle-invasive bladder cancer. Urol Oncol. (2015) ;33: (2):67.e01–7. |
[23] | Bhindi B , Hermanns T , Wei Y , Yu J , Richard PO , Wettstein MS , et al. Identification of the best complete blood count-based predictors for bladder cancer outcomes in patients undergoing radical cystectomy. Br J Cancer. (2016) ;114: (2):207–12. |
[24] | Lee SM , Russell A , Hellawell G . Predictive value of pretreatmentinflammation-based prognostic scores (neutrophil-to-lymphocyteratio, platelet-to-lymphocyte ratio, and lymphocyte-to-monocyteratio) for invasive bladder carcinoma. Korean J Urol. (2015) ;56: (11):749–55. |
[25] | Celik O , Akand M , Keskin MZ , Yoldas M , Ilbey YO . Preoperative neutrophil-to-lymphocyte ratio (NLR) may be predictive of pathologic stage in patients with bladder cancer larger than 3 cm. Eur Rev Med Pharmacol Sci. (2016) ;20: (4):652–6. |
[26] | Buisan O , Orsola A , Areal J , Font A , Oliveira M , Martinez R , et al. Low Pretreatment Neutrophil-to-Lymphocyte Ratio Predicts for Good Outcomes in Patients Receiving Neoadjuvant Chemotherapy Before Radical Cystectomy for Muscle Invasive Bladder Cancer. Clin Genitourin Cancer. (2017) ;15: (1):145–51.e2. |
[27] | Yoshida T , Kinoshita H , Yoshida K , Mishima T , Yanishi M , Komai Y , et al. Perioperative change in neutrophil-lymphocyte ratio predicts the overall survival of patients with bladder cancer undergoing radical cystectomy. Jpn J Clin Oncol. (2016) ;46: (12):1162–7. |
[28] | Hermanns T , Bhindi B , Wei Y , Yu J , Noon AP , Richard PO , et al. Pre-treatment neutrophil-to-lymphocyte ratio as predictor of adverse outcomes in patients undergoing radical cystectomy for urothelial carcinoma of the bladder. Br J Cancer. (2014) ;111: (3):444–51. |
[29] | Luo G , Guo M , Liu Z , Xiao Z , Jin K , Long J , et al. Blood neutrophil-lymphocyte ratio predicts survival in patients with advanced pancreatic cancer treated with chemotherapy. Ann Surg Oncol. (2015) ;22: (2):670–6. |
[30] | Wang F , Liu Z , Xia Y , Zhou C , Shen X , Li X , et al. Changes inneutrophil/lymphocyte and platelet/lymphocyte ratios afterchemotherapy correlate with chemotherapy response and predictionof prognosis in patients with unresectable gastric cancer. Oncol Lett. (2015) ;10: (6):3411–8. |
[31] | Morizawa Y , Miyake M , Shimada K , Hori S , Tatsumi Y , Nakai Y , et al. Neutrophil-to-lymphocyte ratio as a detection marker of tumor recurrence in patients with muscle-invasive bladder cancer after radical cystectomy. Urol Oncol. (2016) ;34: (6):257.e011–7. |
[32] | Kang M , Jeong CW , Kwak C , Kim HH , Ku JH . The prognostic significance of the early postoperative neutrophil-to-lymphocyte ratio in patients with urothelial carcinoma of the bladder undergoing radical cystectomy. Ann Surg Oncol. (2016) ;23: (1):335–42. |
[33] | Seah JA , Leibowitz-Amit R , Atenafu EG , Alimohamed N , Knox JJ , Joshua AM , et al. Neutrophil-lymphocyte ratio and pathological response to neoadjuvant chemotherapy in patients with muscle-invasive bladder cancer. Clin Genitourin Cancer. (2015) ;13: (4):e229–33. |
[34] | Hanahan D , Coussens LM . Accessories to the crime: Functions of cells recruited to the tumor microenvironment. Cancer Cell. (2012) ;21: (3):309–22. |
[35] | Dafni U . Landmark analysis at the 25-year landmark point. Circ Cardiovasc Qual Outcomes. (2011) ;4: (3):363–71. |


