
Fatty Acid Patterns Detected By Ambient Ionization Mass Spectrometry in Canine Invasive Urothelial Carcinoma From Dogs of Different Breeds
Abstract
Background:
In early work ambient ionization mass spectrometry (MS) revealed lipid patterns distinguishing muscle invasive bladder cancer (invasive urothelial carcinoma, InvUC) from normal urothelium. A new ambient ionization MS approach, touch spray MS (TS-MS) can rapidly generate mass spectra in real time, potentially in a point-of-care setting. A tissue sample removed from a patient is touched by a probe, and mass spectra generated within seconds.
Objective:
To validate TS-MS methods using specimens from naturally-occurring InvUC in dogs where the cancer closely mimics the human condition, and to demonstrate proof-of-concept that TS-MS can elucidate lipid patterns distinguishing InvUC from normal urothelium.
Methods:
Samples of normal urothelium and InvUC from dogs of several breeds were analyzed by TS-MS with correlative histopathology across each sample. Results were compared to those obtained with desorption electrospray ionization mass spectrometry (DESI-MS), a more traditional method. Data were analyzed by Principal Component Analysis and Linear Discriminant Analysis.
Results:
Lipid patterns identified by TS-MS, as well as by DESI-MS, differed between InvUC and normal urothelium with m/z 281.5 (oleic acid) and m/z 563.5 (oleic acid dimer) substantially contributing to the differences. Using histologic diagnosis as the gold standard, TS-MS had a global prediction rate of 93%.
Conclusions:
TS-MS can be used to identify lipid patterns that differentiate canine InvUC from normal urothelium. Optimization of TS-MS could lead to a point-of-care approach to distinguish cancer from normal in ex vivo tissues in real time, and to define biochemical processes leading to cancer development and progression.
INTRODUCTION
Muscle invasive bladder cancer, or more specifically invasive urothelial carcinoma (InvUC) remains a major cause of morbidity and mortality worldwide [1, 2]. Technological advances are providing new opportunities to better understand the cancer at the molecular level, to unravel cellular and physiological processes that drive the development and progression of the disease, to detect the cancer in real time during cystoscopy and surgery, and to produce a variety of novel interventional agents and devices which can improve the outlook for patient with the disease [3–8]. Advances in mass spectrometry (MS) are of particular interest [4–7, 9–11]. Mass spectrometry can be used to chemically characterize a variety of sample types. Briefly, multiple ions are generated from the sample under investigation, and the mass spectrometer separates these according to their specific mass-to-charge ratio (m/z), and then records the relative abundance of each ion type. The presence and amount of each biomolecule associated with a particular m/z can be determined. In medicine, MS can be applied in at least three general ways [4–7, 9–11]. First, the analysis of biomolecules including proteins, peptides, and lipids can provide insight into biological and pathophysiological mechanisms involved in cancer development and behavior. Second, drugs and microbes can be detected in minute amounts. Third, MS can be used to image tissue samples as chemical information is recorded together with spatial distributions on the sample surface. An exciting goal is to advance this technology into point-of-care instruments that could provide sample analyses in real time in the cystoscopy or surgery suite.
A key reason for the rapidly expanding interest in applying MS in the medical field is that MS instrumentation and techniques have evolved dramatically in the last 15 years [5–7, 9–14]. Older MS approaches required extensive sample preparation, ionization within large instruments remote to site of sample collection, and substantial expense. A key advance in the field, however, has been the development of ambient ionization MS which allows direct chemical analysis of unmodified and complex biological samples. Biological samples can be analyzed in their native environment with no or minimal sample preparation by creating ions to be analyzed outside of the instrument, with analysis being performed in relatively portable instruments that are being developed for use in a point-of-care setting [12–14]. A continuing goal in instrument development is to integrate sampling and ionization into a single device. There are multiple ambient ionization techniques which are available with one of the best examples being desorption electrospray ionization MS (DESI-MS). With DESI-MS, electrically charged droplets are directed at the ambient object or sample of interest, and ions are released from the surface, which are then vacuumed through the air into the mass spectrometer [7, 9, 11–13]. DESI-MS has been used to distinguish tumor from adjacent normal tissue in oral, urologic, and brain cancer specimens [5, 6, 9–14]. These results are possible because of the novel instrumentation along with advances in data analysis [9–14].
The mass spectral profile of normal bladder includes fatty acids and complex phospholipids [5]. Early work has demonstrated that DESI-MS can be used to define lipid patterns corresponding to normal urothelial tissues and to InvUC [5, 6]. In addition, fatty acid dimer ions, i.e. proton-bound fatty acid dimers, have been observed in cancer, but not in normal tissues [5]. In human InvUC specimens, the most important ions for the characterization of tumor tissue have been reported to be m/z 563.5 and m/z 281.5, while the glycerophospholipid species phosphatidyl serine and phosphatidylinositol were found to be most relevant for characterizing normal tissue [5, 6, 11]. These findings agreed with earlier observations that fatty acids and dimers are the main species responsible for distinguishing cancer and normal bladder tissue by DESI-MS imaging [11]. Using this chemical information, MS was also used to create synthetic images of tissue sections showing pixel-by-pixel disease classification, with results agreeing well with histopathological interpretation [5].
In the continuing evolution of MS approaches and the progress towards point-of-care instruments, a new technique referred to as touch spray MS (TS-MS) has been developed [12, 13, 15]. TS-MS is another form of substrate-spray ambient ionization in which a small probe such as a teasing needle or a swab tip is gently touched to the tissue or biological fluid of interest resulting in the transfer of a small amount of sample to the probe. Ions are subsequently generated upon application of solvent and high voltage to the probe. Chemical derivatization is performed simultaneously with ionization [12, 13, 15]. TS-MS can be performed more rapidly than DESI-MS, only requires a minute amount of sample, and is expected to be applicable in a point-of-care setting for in situ analysis [12, 13, 15]. One of the ultimate goals for TS-MS is to provide tissue analysis in real time during bladder surgery and cystoscopy. TS-MS is expected to make it possible to remove a tissue sample from a patient during surgery or cystoscopy, to touch a probe to that piece of tissue in order to pick up a minute sample, to generate a TS-MS spectrum within seconds on site, and to know if the tissue is normal or cancerous, or to provide other biological/chemical information about the tissue. Although TS-MS has been used to characterize other tissues, to identify microorganisms, and to quantitate drugs and chemicals, TS-MS has not yet been applied to characterize InvUC[12–17].
In this proof-of-concept study, TS-MS was used to investigate biological processes that could be used to distinguish InvUC from normal urothelium, and to define methods which could be applied in the future in real time during cystoscopy or surgery. For the initial step in this field of work, MS was performed on specimens from dogs with naturally-occurring InvUC. Canine InvUC mimics muscle invasive bladder cancer in humans in pathology, molecular features, biological behavior including local invasion and distant metastasis, response to therapy, and host immunocompetence [18–20]. The use of canine tissues allowed ready access to samples in proximity to the lab developing the TS-MS techniques (where fresh and frozen samples could be validated), and preserved the use of human specimens for a later time when the technique had been suitably validated. In the majority of the work, the spectra in the tumor tissues were compared to those in adjacent histologically normal sections from the same bladder, such as would be the case during human bladder surgery. It is recognized, however, that tissues in the bladder adjacent to the cancer have often undergone the field effect, have acquired genetic changes, and are not completely normal [21]. Therefore, the work also included the analysis of normal canine bladder tissues from dogs with no bladder disease who were undergoing necropsy for non-bladder disease related causes; access to these normal tissues represents another advantage of working with dogs. For comparison, the tissues analyzed by TS-MS, were also analyzed by the more traditional DESI-MS approach. In exploratory analysis, potential differences in mass spectral data were investigated between tissues from dogs in breeds with genetically high risk for InvUC (such as Scottish Terriers who have a 21 fold higher risk for InvUC than mixed breed dogs) and those in low-risk breeds [18–20].
MATERIALS & METHODS
Sample collection and processing
Tissue samples were collected from dogs with naturally-occurring InvUC who had been presented to the Purdue University Veterinary Teaching Hospital for evaluation and treatment. All tissue collection was performed following the guidelines and approval of the Purdue Animal Care and Use Committee and with informed dog owner consent. Tumor tissues were obtained in two settings. For dogs undergoing surgical resection of their bladder tumor as part of their treatment, a section of the tissue specimen containing InvUC and a small section of adjacent histologically normal tissue in the surgical margin were obtained for MS analysis. For dogs with InvUC that were euthanized at the request of their owner (due to poor quality of life related to the cancer or other conditions), permission to perform a necropsy was obtained, and bladder tissues were collected post mortem (within 15 minutes of death). Normal bladder tissues were also collected from dogs undergoing euthanasia due to non-bladder related illnesses. InvUC and normal bladder tissue samples were collected from multiple different breeds of dogs. High-risk breeds were defined as Scottish Terriers, West Highland White Terriers, Shetland Sheepdogs, and Beagles [18, 20]. Low-risk breeds were defined as breeds not related to terriers, Shetland Sheepdogs, or Collies.
Fresh tissue samples were flash frozen in liquid nitrogen and subsequently stored in cryovials at –80°C. Specimens were transported on dry ice from the Veterinary Teaching Hospital to the Aston Laboratory in the Department of Chemistry at Purdue University. Samples were cryosectioned to 15μm thickness using a Shandon SME cryotome cryostat (GMI, Inc., Ramsey, MN, USA) and thaw mounted on glass microscope slides. Analyzed tissue sections were H&E stained, scanned using Aperio (Leica Biosystems, Inc.), and interpreted by two veterinary pathologists (J R-V and TP). The H&E stained images were rotated and aligned to match the orientation of MS images. This allowed correlative histopathology to match the DESI-MS and TS-MS characterization at each point in the tissue section (Fig. 1.)
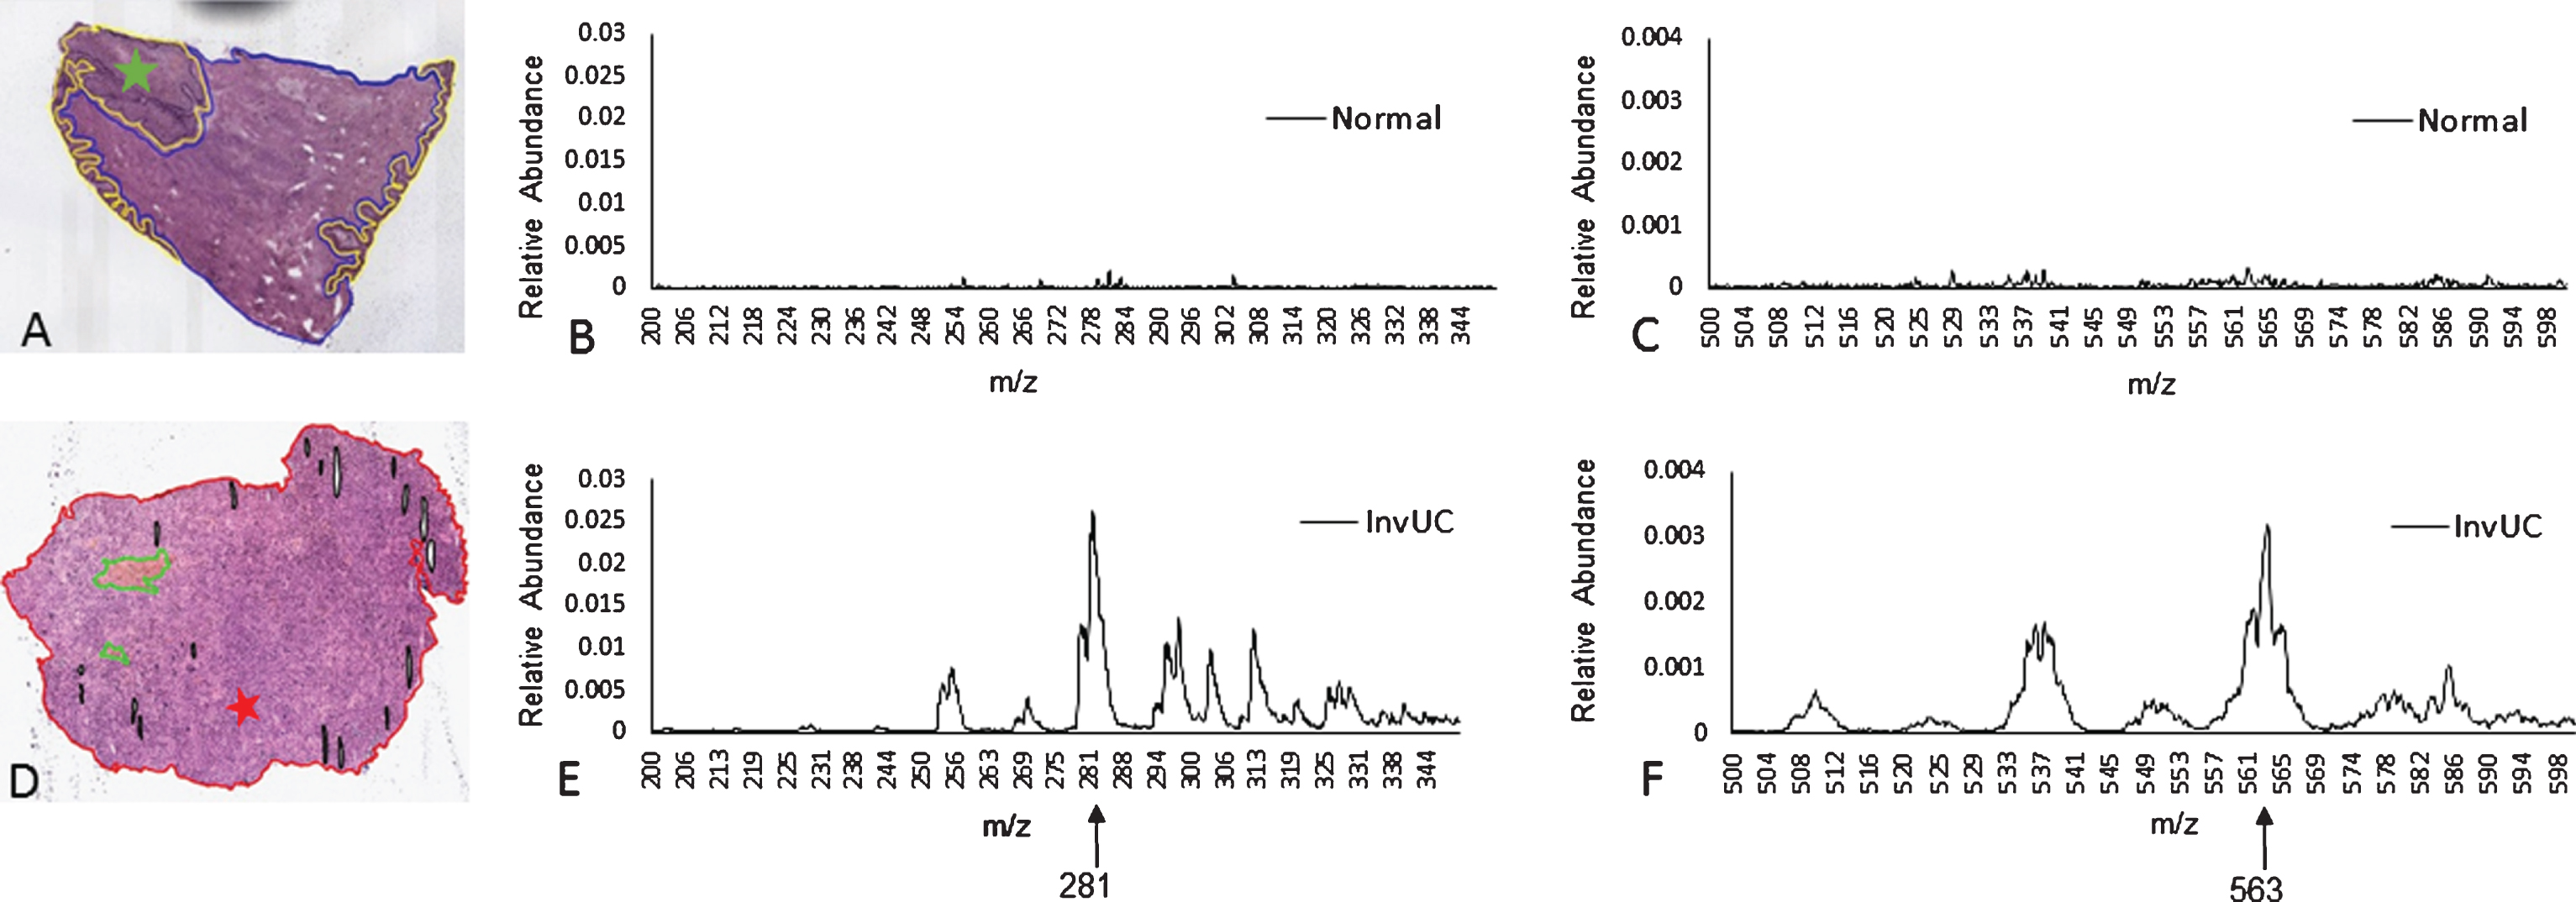
Fig. 1
Mass spectra, TS-MS m/z ranges 200–350 and 500–600. The spectra from normal bladder (A) are represented in panels B (m/z range 200–350) and C (m/z range 500–600). The location within the section where the MS sample was collected is marked with the green star (A). The spectra from InvUC (D) are represented in panels E (m/z range 200–350) and F (m/z range 500–600). The location within the section where the sample was collected is marked with the red star (D). The abundance of m/z 281.5 and m/z 563.5 is much greater in InvUC compared to normal urothelium. Note that the scale for peak abundance (Y axis) in panels B and E (m/z range 200–350) differs from the scale in panels C and F (m/z range 500–600). The narrower scale in panels C and F allows the difference in m/z 563.5 between normal urothelium (C) and InvUC (F) to be visualized. The difference in abundance is relative to the TIC normalized values.
DESI-MS
A laboratory-built DESI-MS ion source was coupled to a linear ion trap mass spectrometer (LTQ) controlled by Xcalibur 2.0 software (ThermoFisher Scientific, Waltham, MA). The LTQ MS and Xcalibur software were used in both DESI-MS and TS-MS experiments. Negative ionization mode was used for all experiments. The automatic gain control (AGC) was inactivated. Solvents (Mallinckrodt Baker Inc., Phillipsburg, NJ) were delivered at 1.0μL min–1 flow rate using the instrument syringe pump. The DESI-MS source parameters were set as follows: capillary temperature 275 °C, voltage applied to the stainless steel needle syringe 5 kV, capillary voltage –25 V, tube lens voltage –115 V, capillary incident angle 52°, spray to surface distance ∼3 mm, sample to inlet distance ∼5 mm, and nitrogen gas at 180 psi. The LTQ acquisition time was set to acquire two 250μs mass spectrum and average these two spectra. Tissue sections were analyzed using a moving stage with a lateral scan rate of 307.7μm s–1 in horizontal rows separated by a 200μm vertical step. Instrument scan time was coordinated with scan speed providing ∼200×200μm pixels. Full scan mass spectra were acquired in negative ion mode in the mass range m/z 200–1000. Tissue samples for DESI-MS were analyzed over consecutive days.
TS-MS
TS-MS was performed in tissue sections immediately adjacent to the sections analyzed by DESI-MS, by touching and depositing material onto a teasing needle (Fisher Scientific, Pittsburgh, PA, USA)]15]. The histopathologically defined tissue section from the DESI-MS analysis was referenced during TS-MS analysis and used to select where to touch the tissue section to record data for a particular tissue type, specifically normal urothelium or InvUC. Note that, unlike DESI-MS, TS-MS can be a destructive sampling method, thus correlative histopathology was performed on the adjacent sections. Methanol (Mallinckrodt Baker Inc.) was used as spray solvent, and 1μL was applied manually via an adjustable pipette (2.5μL, Eppendorf Research, San Diego, CA). The LTQ linear ion trap mass spectrometer was also used for the TS-MS experiments with the same operating parameters as those used in the DESI-MS experiments with the following exceptions: voltage applied to the TS-MS probe was 4 kV, the LTQ scan time was set to 30μs, and the AGC was active. Tissue sections were TS-MS analyzed by sampling areas of 1–4 mm2.
After sampling the tissue section, the tip of the TS-MS probe was directed at the inlet of the LTQ mass spectrometer, and the high voltage and 1μL of methanol were applied. Data acquisition of extracted analytes occurred in a spray time of ∼6 seconds. As noted in previous TS-MS work [15], manual pipette application of solvent resulted in mass spectral signals within seconds. Xcalibur software (Thermo Fisher) was used to process the data from each touch. The methods used to select and analyze data from each total ion current (TIC) are included in the Supplementary Information and Data section. The average mass spectral data were subjected to standard normal variate (SNV) transformation in MATLAB (The MathWorks, Inc., Natick, MA USA) also described in Supplementary Information and Data section.
Sample size and statistical analyses
The methods are summarized here and described in more detail in the Supplementary Information and Data section. The goal was to study at least 45 samples. Eighty-six fresh tissue samples were collected, and 37 samples were excluded from further analysis because the analyzed sections did not include both histologically normal urothelial tissue and InvUC. Fifty regions of normal urothelial tissue and InvUC from 49 sections were analyzed by DESI-MS and TS-MS. In addition, normal bladder tissues from 14 dogs undergoing necropsy due to non-bladder related diseases were analyzed by DESI-MS and TS-MS.
From the samples, 50 DESI-MS averaged mass spectra and 151 TS-MS mass spectra were used to create normal and InvUC mass spectral databases. For DESI averaged mass spectra, regions annotated by pathology as normal urothelium or InvUC with no other characterization were selected as groups of pixels of interest composed of the mass spectra at each pixel.
Principal Component Analysis (PCA) was performed on TIC normalized, mean-centered data for DESI-MS datasets. Linear Discriminant Analysis (LDA) was applied to the DESI-MS target datasets of TIC normalized, mean centered mass spectra after compression by PCA, thereby using the principal components as variables instead of the original mass spectral data. LDA was applied on the TS-MS target dataset of SNV transformed and column centered mass spectra. With DESI-MS, two or three classes were modeled (viz. normal urothelium, InvUC, and samples from different breeds of dogs). With TS-MS, two classes (normal urothelium, InvUC) were modeled.
In exploratory analyses, data sets were used to estimate the sensitivity, specificity, positive and negative predictive value, and global prediction rate for all classes (accuracy) using complete validation strategy previously described [12], with further details in the Supplementary Information and Data section. Findings with DESI-MS and TS-MS were compared to the histopathological diagnosis of the corresponding location on the tissue section.
RESULTS
PCA was initially performed on data covering the entire mass spectral range (m/z 200–1000), and principal components were identified that appeared different between InvUC and normal urothelium. To focus on the areas where the distinguishing m/z values were, the range for subsequent PCA analysis was narrowed to m/z ranges 200–350 and 500–600 (Fig. 1), and then further narrowed to m/z ranges of 277–286 and 557–586 for DESI-MS and TS-MS. The progression in narrowing the mass spectral range and the m/z values of interest is described in the Supplementary Information and Data section, including Supplemental Figure S1-S5. The identities of m/z values of interest are listed in Table 1. The PCA loading plots demonstrated that m/z 563.5 (oleic acid dimer, higher in InvUC), m/z 281.5 (oleic acid, higher in InvUC), and m/z 283.5 (stearic acid, higher in normal urothelium) contributed substantially to the separation between normal urothelium and tumor (Fig. 2). Arachidonic acid (m/z 303) was also of high abundance in some InvUC sections, but varied considerably from section to section. The two m/z values that stood out as consistently different between the disease states (higher in InvUC than in normal urothelium) in the DESI-MS and TS-MS analyses were m/z 281.5 and m/z 563.5 (Figs. 1 and 2, S1-S5). These findings held true when comparing InvUC to adjacent normal and when comparing InvUC to normal bladder obtained from dogs with no bladder disease who were being euthanized due to other causes. The PCA plots were similar between DESI-MS and TS-MS data, but with slightly more pronounced separation between the disease states with DESI-MS. The PCA score and loading plots did not change to any extent when the data were pretreated by SNV transformation. The spectra from InvUC from dogs in high-risk breeds and low-risk breeds were similar, but with a trend towards m/z 281.5 and m/z 563.5 predominating more in high-risk breeds (Fig. 3, Figure S6), i.e. in addition to the abundance of m/z 281.5 and m/z 563.5 being higher in cancer than normal urothelium across breeds, the abundance of m/z 281.5 and m/z 563.5 was higher in InvUC from high-risk breeds than in low-risk breeds. The sensitivity, specificity, and predictive value of the DESI-MS and TS-MS data in predicting disease state (compared to histopathologic diagnoses) are summarized in Table 2.
Fig. 2
PCA score plot and loading plot for TS-MS negative mode data m/z range 277–286 and 557–568, from canine InvUC and normal bladder. A. PCA score plot (PC1 vs. PC4) displays separation of InvUC (black triangles) from normal urothelium (gray circles) mass spectra. The InvUC/normal dividing line runs from Cartesian coordinates (–15, –10) to (12,8). B. PCA loading plot (PC1 vs. PC4) distinguishes disease state based on m/z 563.5 (oleic acid dimer) (shown in negative PC1 and near zero PC4 coefficients), m/z 281.5 (oleic acid) (shown near zero PC1 coefficients and positive PC4 coefficients), and m/z 283.5 (stearic acid) (shown in positive PC1 coefficients and positive and negative PC4 coefficients). This indicates that m/z 281.5, 283.5, and 563.5 contributed the most to the pattern differences between InvUC and normal with 281.5 and 563.5 being more abundant in InvUC and 283.5 being more abundant in normal tissues. It should be noted that m/z 283.5 was particularly high in two samples from normal urothelium, and not as high in other normal samples.
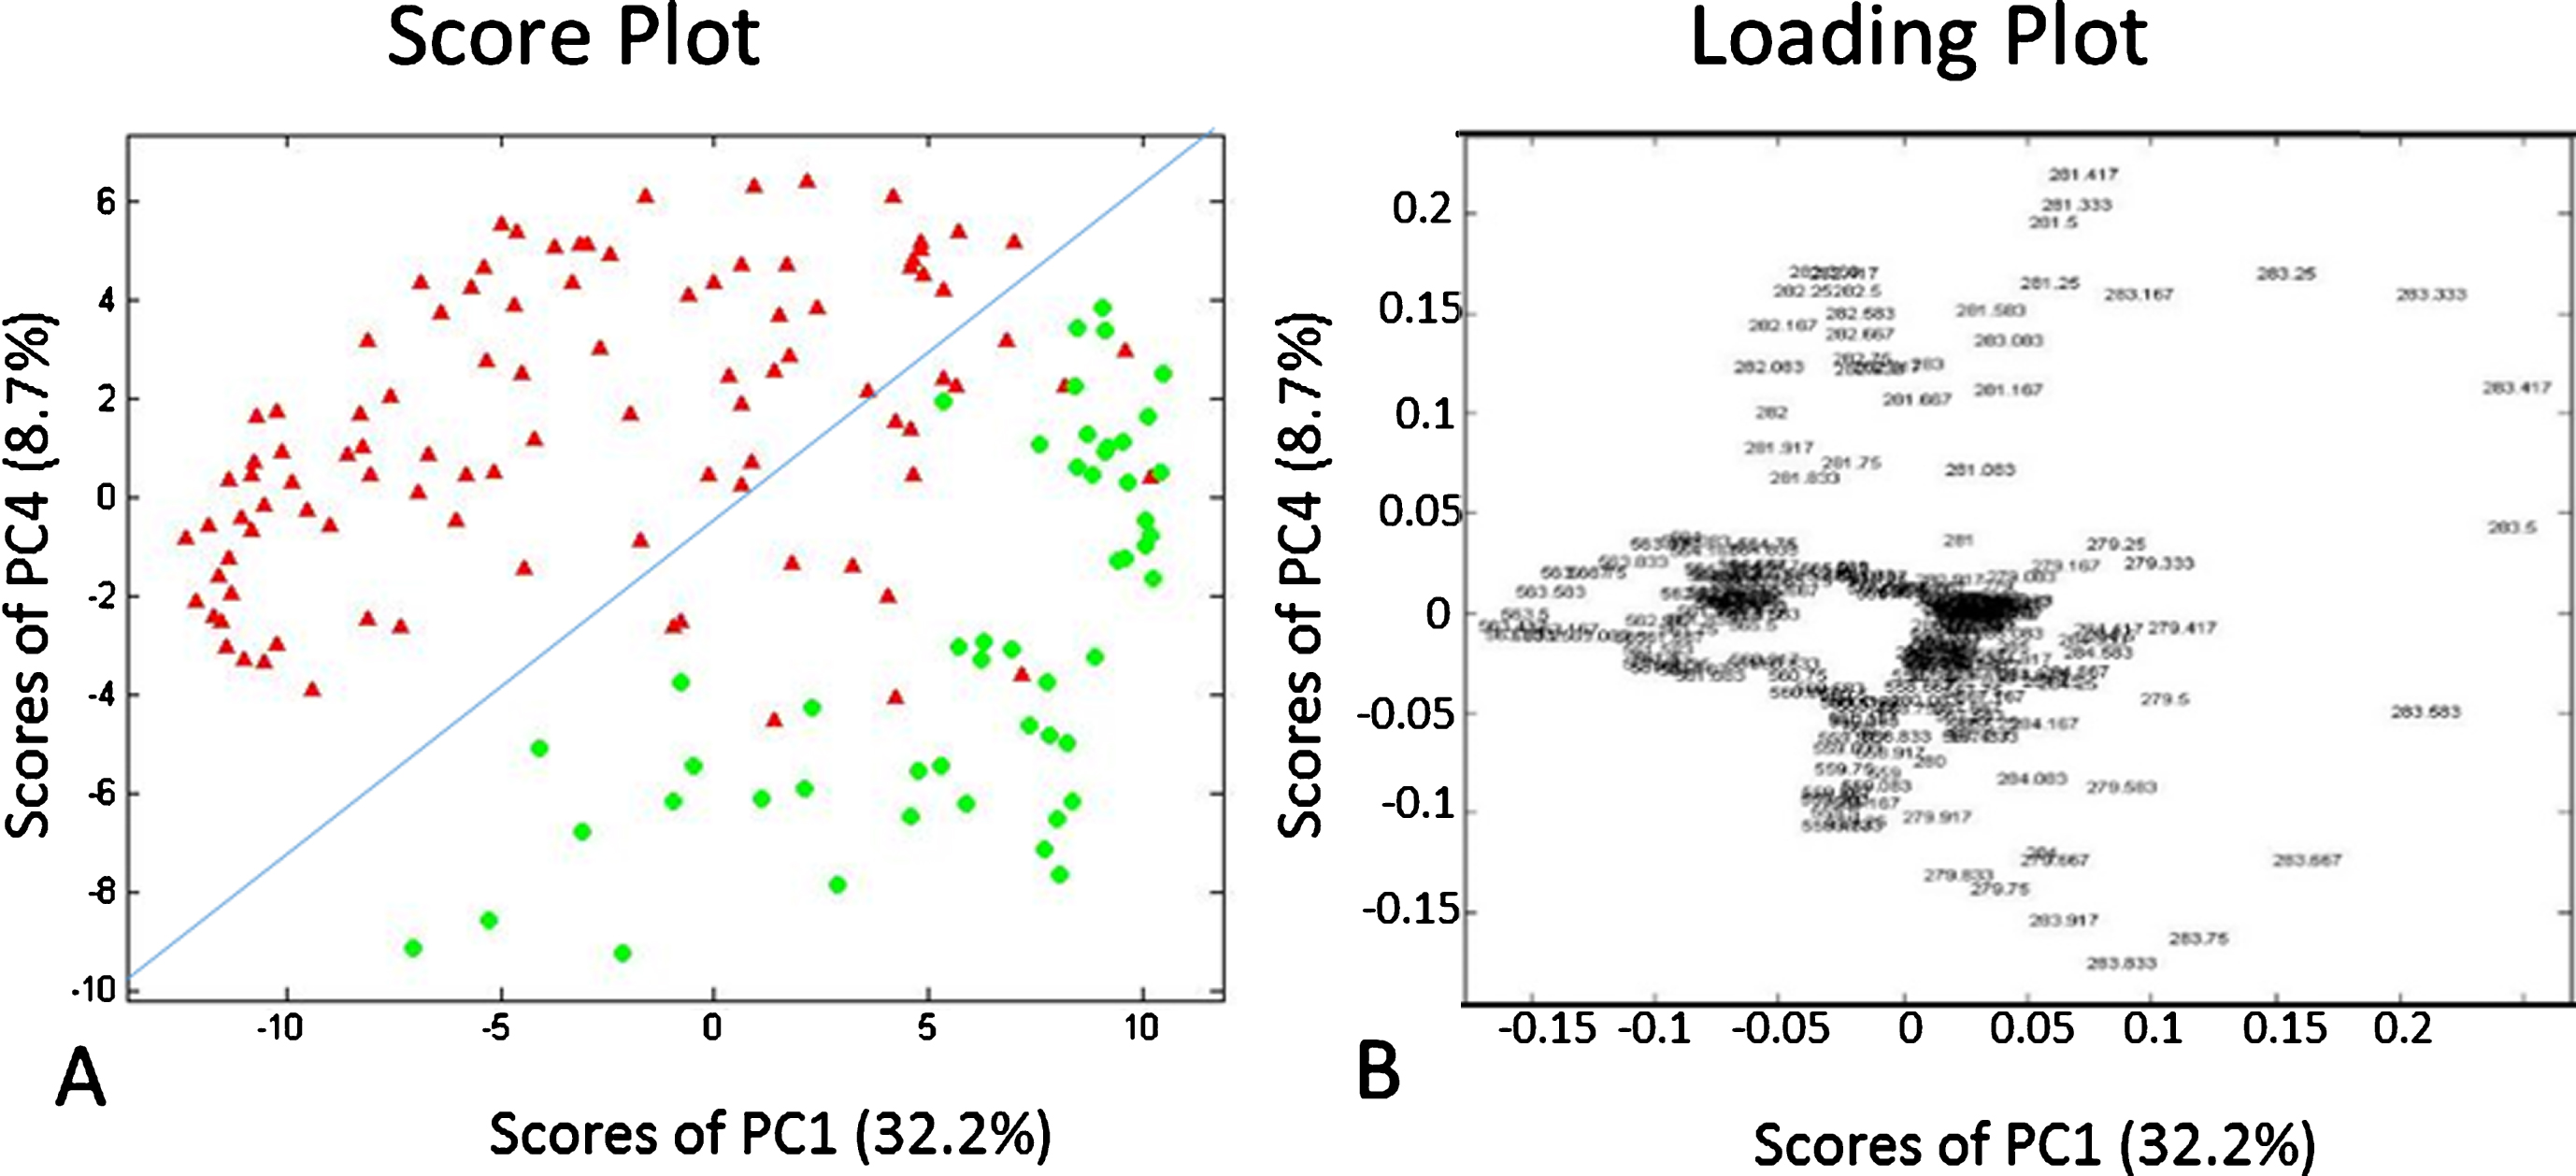
Fig. 3
PCA score plot and loading plot for DESI-MS negative mode data m/z range 277–286 and 557–586, from canine InvUC from high-risk breeds (solid black triangles), low-risk breeds (open squares), and from normal urothelium (gray circles). A. The PCA score plot (PC1 vs. PC3) demonstrates the separation between the average mass spectra from InvUC vs normal urothelium. There is a trend towards separation of the InvUC spectra based on high-risk vs low-risk breed dogs. An InvUC/normal dividing region consisting of a pair of dividing lines runs from Cartesian coordinates –2, –4 to 10,4 and –4, –4 to 10,5. An InvUC subgroup (high-risk breed/low-risk breed) dividing line runs substantially orthogonal to the InvUC/normal dividing line, 4, –4 to –8,4. In B, the PCA loading plot (PC1 vs. PC3) distinguishes disease state substantially based on m/z 283.5 (shown in positive PC1 and near zero PC3 coefficients) and based on m/z 563.5 (shown in negative PC1 and near zero PC3 coefficients). A trend was observed for m/z 281.5 and m/z 563.5 predominating more in high-risk breeds, and this was further delineated in Supplemental Figure S6.
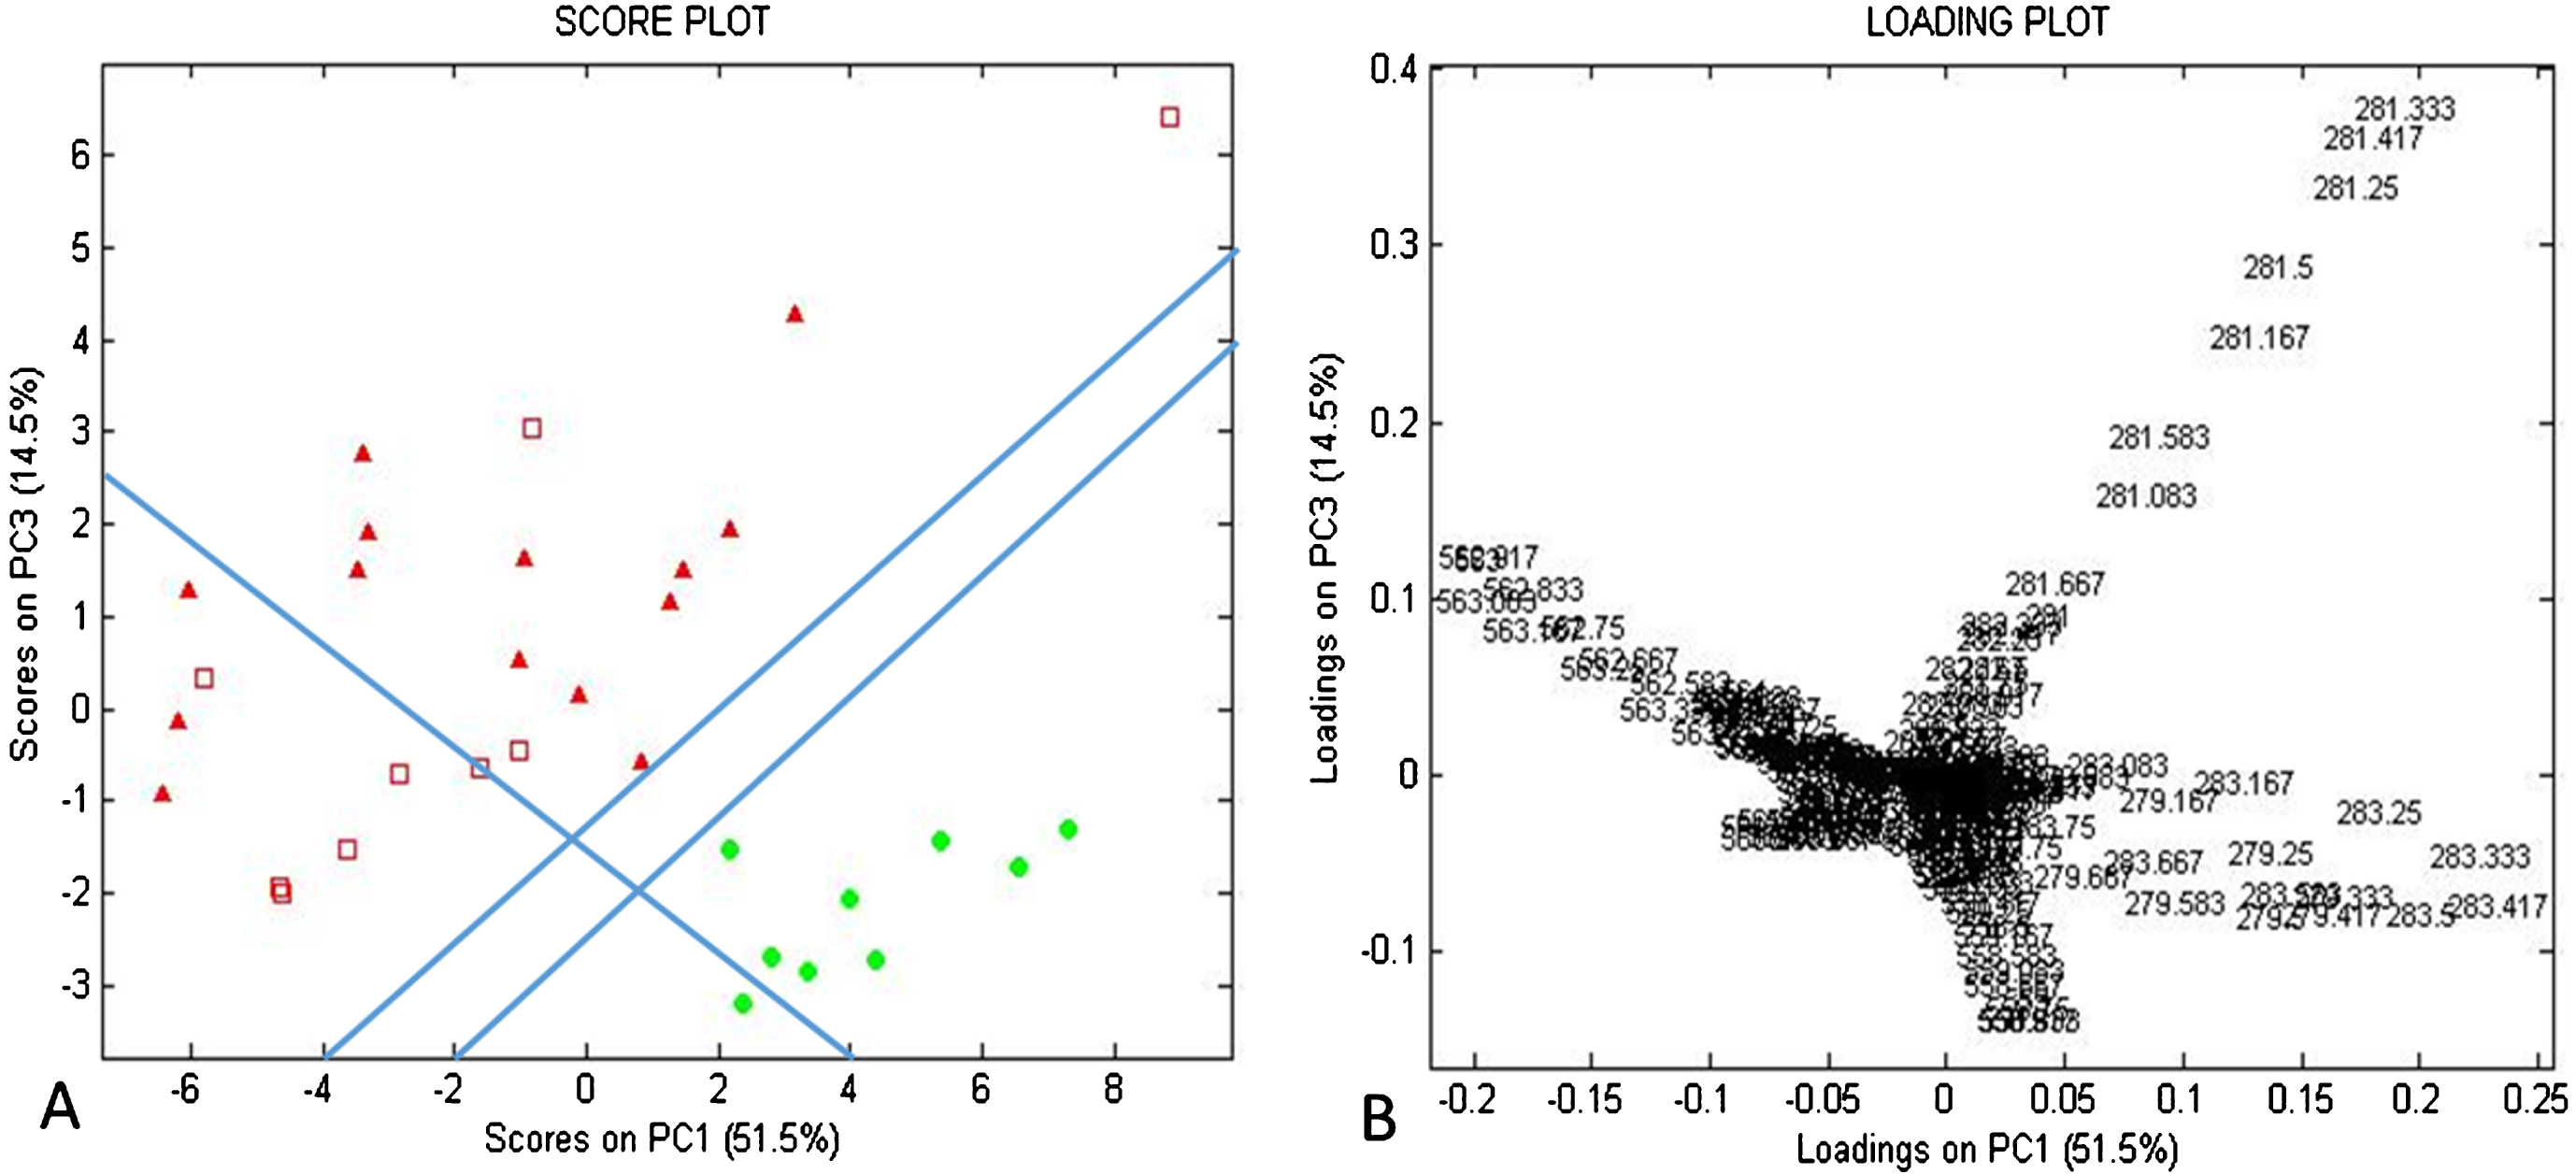
Table 1
Negative ion mode peak identity of m/z s of interest from the mass spectra
| m/z | Peak Identity |
| 281.5 | FA (18:1), oleic acid |
| 283.5 | FA (18:0), stearic acid |
| 303.5 | FA (20:4), arachidonic acid |
| 563.5 | FA (18:1), oleic acid dimer |
| 724.5 | PS (32:5), phosphatidylserine 32:5 |
| 757.5 | PG (35:4)/SM (38:1), phosphatidylglycerol 35.4 or sphingomyelin 38:1 |
| 773.5 | PG (18:1), phosphatidylglycerol 18:1 |
| 786.4 | PS (18:1), phosphatidylserine 18:1 |
| 788.6 | PS (18:0/18:1), phosphatidylserine 18:0 or phosphatidylserine 18:1 |
| 810.5 | PS (38:4), phosphatidylserine 38:4 |
| 835.7 | PI (16:0/18:1), phosphatidylinositol 16:0 or phosphatidylinositol 18:1 |
| 861.7 | PI (36:2), phosphatidylinositol 36:2 |
| 863.7 | PI (36:1), phosphatidylinositol 36:1 |
| 885.6 | PI (38:4), phosphatidylinositol 38:4 |
Table 2
Sensitivity, specificity, and predictive value of the analyzed MS data in predicting InvUC vs normal urothelium in the tissue samples analyzed in the study
| Parameter | DESI-MS | TS-MS |
| Sensitivity | 95% | 90% |
| Specificity | 100% | 100% |
| Positive predictive value | 100% | 100% |
| Negative predictive value | 82% | 84% |
| Accuracy (global prediction rate) | 96% | 93% |
DISCUSSION
This proof-of-concept study demonstrated that TS-MS can be used to define lipid patterns that differ between InvUC and normal bladder. There is strong confidence in the findings as: (1) DESI-MS and TS-MS yielded similar results, (2) the two different pretreatment steps (TIC normalization and SNV transformation) provided similar results, and (3) the PCA-LDA confirmed that each of DESI-MS and TS-MS methods classify InvUC and normal tissue with greater than 90% accuracy. The work confirmed the importance of oleic acid (m/z 281.5) and oleic acid dimer (m/z 563.5) in distinguishing InvUC from normal urothelium, as has been reported in earlier studies of canine and human muscle invasive bladder cancer [5, 6, 22, 23]. Consistent with oleic acid and its dimer being more abundant in InvUC relative to normal, previous microarray analysis also demonstrated upregulation of fatty acid synthase (FASN) in canine InvUC compared to normal urothelium (3.57 fold increase, p corr value is 1.6×10⁵) [19].
The biological significance of the findings related to oleic and stearic acid is not yet defined. In our study, stearic acid was more abundant in normal tissues compared to InvUC. In experimental models, there is evidence that stearic acid can retard cancer growth and progression. In rats with mammary carcinoma induced by nitroso-methyl urea, stearic acid given by subcutaneous injections at weekly intervals reduced the development of mammary tumors [24]. Stearate also inhibited cancer cell proliferation in vitro, and limited the growth and metastasis of human breast cancer cells in athymic mice [25].
Our study demonstrated that oleic acid (m/z 281.5) was more abundant in InvUC than in normal urothelium, as reported by others [5, 6, 22, 23]. In human esophageal cancer, higher levels of oleic acid were associated with greater risk of lymphatic metastasis [26]. Although oleic acid was linked to the presence of bladder and esophageal cancer, different results were found in other types of studies. Higher plasma levels of oleic acid were associated with lower colorectal cancer risk in people [27]. Furthermore, supplementing the diet with oleic acid delayed the progression of lung tumors in mice [28]. Thus the biological implications of the MS findings and the timing of fatty acid effects during carcinogenesis process and cancer progression require further study.
It is expected that the predictive value of TS-MS can be improved upon with further work. This could include extending the spectra for analysis, analyzing elements beyond fatty acids and phospholipids, and optimizing methodology such as the number of touches per sample in lieu of the recognized heterogeneity within the tumors. It is expected that future work will confirm similar MS patterns between canine and human InvUC, as there is already evidence for this from the current study and from the literature [5, 6, 22, 23]. Analysis of larger data sets along with detailed pathological evaluation will improve the classification and sub-classification of InvUC and normal samples, and allow for the development of models which will reveal the presence of InvUC in samples whose histopathology is not known at the time of data analysis. Future work should also include the analysis of lymph node samples collected during surgery. The potential application of TS-MS during surgery and cystoscopy could include the evaluation of margins in resected tissues, the analysis of lymph nodes for the presence of cancer, and the assessment of biopsies obtained during cystoscopy for the presence of cancer to help determine if representative samples were obtained. While the discussion has focused on the ex vivo analysis of tissues, further advances in instrumentation could allow MS applications in vivo through cystoscopicchannels [29].
Another area where MS analysis could potentially be important in the future is to answer biological questions that could have bearing on the clinical management of InvUC. Future work should determine the predictive value of specific MS data patterns that are associated with the biological behavior of the cancer, such as helping discern which patients are destined to have distant metastases and which patients are likely to have organ-confined cancer. Work should also determine if specific MS spectral patterns are associated with the response to specific therapies. In answering these biological questions, however, it is likely that DESI-MS may be a preferred choice over TS-MS because DESI-MS incorporates the analysis of much more data. DESI-MS analysis includes data from each pixel on a tissue section, while TS-MS includes data only from the areas touched with the probe. In addition, it would be less critical to generate the data to predict cancer behavior and drug response in real time in the surgical or cystoscopy suite, thus DESI-MS would be applicable.
The study included exploratory analysis of the MS patterns in different breeds of dogs. The breed-associated risk for InvUC in dogs includes a 21 fold higher risk in Scottish Terriers, and a 3–6 fold increased risk in West Highland White Terriers, Shetland Sheepdogs, and Beagles [18, 20]. It is expected that certain gene-environment interactions have a greater role in cancer development in the high-risk breeds compared to the low-risk breeds, but it is not yet known if this leads to cancers with a different biochemical and genetic background in particular breeds. Studies to date would indicate that while the genetic influences leading to cancer risk are greater in some breeds, that the resulting cancer is similar across breed. This is based on the lack of differences between breeds in InvUC histopathology, cellular features, mutational data, and genomic data generated to date [18–20]. The trend observed in the abundance of oleic acid and oleic acid dimer correlating with InvUC in certain breeds is interesting, but requires further study. It is recognized that lipid metabolism can vary between breeds and between dogs within a breed [30, 31], but it is not yet known if differences in metabolic activation lead to higher InvUC risk in certain breeds. This requires further study.
In conclusion, the work provides compelling evidence that TS-MS, a form of ambient ionization MS, could be further developed for application in a point-of-care setting, and that TS-MS could be used to distinguish tissues that consist of or contain InvUC vs those that do not harbor cancer. DESI-MS and TS-MS could also reveal biochemical processes involved in the cancer development, progression, and response to therapy. These technological advances would ultimately improve the outlook for patients with muscle invasive bladder cancer.
CONFLICT OF INTEREST
The authors have no conflicts of interest to report.
ACKNOWLEDGMENTS
Funding: Small Grants Program, Purdue University Center for Cancer Research.
The authors would like to thank Valentina Pirro for her advice regarding multivariate statistical analysis, and the staff and clinicians in the Purdue Comparative Oncology Program for assistance with the sample collection.
SUPPLEMENTARY MATERIAL
[1] The supplementary material is available in the electronic version of this article: http://dx.doi.org/10.3233/BLC-170125.
REFERENCES
[1] | Czerniak B , Dinney C , McConkey D. Origins of bladder cancer. Annu Rev Pathol. (2016) ;11: :149–74. |
[2] | Antoni S , Ferlay J , Soerjomataram I , Znaor A , Jemal A , Bray F. Bladder cancer incidence and mortality: A global overview and recent trends. Eur Urol. (2017) ;71: (1):96–108. |
[3] | Besiroglu H. Lipid metabolism profiling and bladder cancer. Metabolomics. (2015) ;5: :154. |
[4] | Nemes P , Barton AA , Li Y , Vertes A. Ambient molecular imaging and depth profiling of live tissue by infrared laser ablation electrospray ionization mass spectrometry. Anal Chem. (2008) ;80: (12):4575–82. |
[5] | Dill AL , Eberlin LS , Costa AB , Zheng C , Ifa DR , Cheng L , et al. Multivariate statistical identification of human bladder carcinomas using ambient ionization imaging mass spectrometry. Chemistry. (2011) ;17: (10):2897–902. |
[6] | Dill AL , Ifa DR , Manicke NE , Costa AB , Ramos-Vara JA , Knapp DW , et al. Lipid profiles of canine invasive transitional cell carcinoma of the urinary bladder and adjacent normal tissue by desorption electrospray ionization imaging mass spectrometry. Anal Chem. (2009) ;81: (21):8758–64. |
[7] | Ifa DR , Wiseman JM , Song Q , Cooks RG. Development of capabilities for imaging mass spectrometry under ambient conditions with desorption electrospray ionization (DESI). Intl J Mass Spectrometry. (2007) ;259: (1–3):8–15. |
[8] | Tomlinson B , Lin TY , Dall’Era M , Pan CX. Nanotechnology in bladder cancer: Current state of development and clinical practice. Nanomedicine (Lond). (2015) ;10: (7):1189–201. |
[9] | Jarmusch AK , Alfaro CM , Pirro V , Hattab EM , Cohen-Gadol AA , Cooks RG. Differential lipid profiles of normal human brain matter and gliomas by positive and negative mode desorption electrospray ionization –mass spectrometry imaging. PLoS One. (2016) ;11: (9):e0163180. |
[10] | Eberlin LS , Norton I , Dill AL , Golby AJ , Ligon KL , Santagata S , et al. Classifying human brain tumors by lipid imaging with mass spectrometry. Cancer Res. (2012) ;72: (3):645–54. |
[11] | Pirro V , Eberlin LS , Oliveri P , Cooks RG. Interactive hyper-spectral approach for exploring and interpreting DESI-MS images of cancerous and normal tissue sections. Analyst. (2012) ;137: (10):2374–80. |
[12] | Kerian KS , Jarmusch AK , Pirro V , Koch MO , Masterson TA , Cheng L , et al. Differentiation of prostate cancer from normal tissue in radical prostatectomy specimens by desorption electrospray ionization and touch spray ionization mass spectrometry. Analyst. (2015) ;140: (4):1090–8. |
[13] | Ferreira CR , Yannell KE , Jarmusch AK , Pirro V , Ouyang Z , Cooks RG. Ambient ionization mass spectrometry for point-of-care diagnostics and other clinical measurements. Clin Chem. (2016) ;62: (1):99–110. |
[14] | D’Hue C , Moore M , Summerlin DJ , Jarmusch A , Alfaro C , Mantravadi A , et al. Feasibility of desorption electrospray ionization mass spectrometry for diagnosis of oral tongue squamous cell carcinoma. Rapid Commun Mass Spectrom. (2018) ;32: (2):133–41. |
[15] | Kerian KS , Jarmusch AK , Cooks RG. Touch spray mass spectrometry for in situ analysis of complex samples. Analyst. (2014) ;139: (11):2714–20. |
[16] | Jarmusch AK , Pirro V , Kerian KS , Cooks RG. Detection of Strep throat causing bacterium directly from medical swabs by touch spray-mass spectrometry. Analyst. (2014) ;139: :4785–9. |
[17] | Pirro V , Jarmusch AK , Vincenti M , Cooks RG. Direct drug analysis from oral fluid using medical swab touch spray mass spectrometry. Anal Chim Acta. (2015) ;861: :47–54. |
[18] | Knapp DW , Ramos-Vara JA , Moore GE , Dhawan D , Bonney PL , Young KE. Urinary bladder cancer in dogs, a naturally occurring model for cancer biology and drug development. ILAR J. (2014) ;55: (1):100–18. |
[19] | Dhawan D , Paoloni M , Shukradas S , Choudhury DR , Craig BA , Ramos-Vara JA , et al. Comparative gene expression analyses identify luminal and basal subtypes of canine invasive urothelial carcinoma that mimic patterns in human invasive bladder cancer. PloS One. (2015) ;10: (9):e0136688. |
[20] | Sommer BC , Dhawan D , Raliff TL , Knapp DW. Naturally occurring canine invasive urothelial carcinoma:Amodel for emerging therapies. Bladder Cancer. in press (2018) . |
[21] | Davidson DD , Cheng L. “Field cancerization” in the urothelium of the bladder. Anal Quant Cytol Histol. (2006) ;28: (6):337–8. |
[22] | Stone N , Hart Prieto MC , Crow P , Uff J , Ritchie AW. The use of Raman spectroscopy to provide an estimation of the gross biochemistry associated with urological pathologies. Anal Bioanal Chem. (2007) ;387: (5):1657–68. |
[23] | Miryaghoubzadeh J , Darabi M , Madaen K , Shaaker M , Mehdizadeh A , Hajihosseini R. Tissue fatty acid composition in human urothelial carcinoma. Br J Biomed Sci. (2013) ;70: (1):1–5. |
[24] | Habib NA , Wood CB , Apostolov K , Barker W , Hershman MJ , Aslam M , et al. Stearic acid and carcinogenesis. Br J Cancer. (1987) ;56: (4):455–8. |
[25] | Evans LM , Toline EC , Desmond R , Siegal GP , Hashim AI , Hardy RW. Dietary stearate reduces human breast cancer metastasis burden in athymic nude mice. Clin Exp Metastasis. (2009) ;26: (5):415–24. |
[26] | Zhang H , Wang L , Hou Z , Ma H , Mamtimin B , Hasim A , et al. Metabolomic profiling reveals potential biomarkers in esophageal cancer progression using liquid chromatography-mass spectrometry platform. Biochem Biophys Res Commun. (2017) ;491: (1):119–25. |
[27] | May-Wilson S , Sud A , Law PJ , Palin K , Tuupanen S , Gylfe A , et al. Pro-inflammatory fatty acid profile and colorectal cancer risk: A Mendelian randomisation analysis. Eur J Cancer. (2017) ;84: :228–38. |
[28] | Piegari M , Soria EA , Eynard AR , Valentich MA. Delay of lung adenocarcinoma (LAC-1) development in mice by dietary oleic acid. Nutr Cancer. (2017) ;69: (7):1069–74. |
[29] | Rink M , Babjuk M , Catto JW , Jichlinski P , Shariat SF , Stenzl A , et al. Hexyl aminolevulinate-guided fluorescence cystoscopy in the diagnosis and follow-up of patients wit non-muscle-invasive bladder cancer: A critical review of the current literature. Eur Urol. (2013) ;64: (4):624–38. |
[30] | Xenoulis PG , Steiner JM. Lipid metabolism and hyperlipi-demia in dogs. Vet J. (2010) ;183: (1):12–21. |
[31] | Mori N , Lee P , Muranaka S , Sagara F , Takemitsu H , Nishiyama Y , et al. Predisposition for primary hyperlipi-demia in Miniature Schnauzers and Shetland sheepdogs as compared to other canine breeds. Res Vet Sci. (2010) ;88: (3):394–9. |


