
Change in Psoas Muscle Volume as a Predictor of Outcomes in Patients Treated with Chemotherapy and Radical Cystectomy for Muscle-Invasive Bladder Cancer
Abstract
Objective: Sarcopenia, or the age-related loss of skeletal muscle mass and function, has been investigated as a potential marker of adverse outcomes among surgical patients. Our aim was to assess for changes in psoas muscle volume (PMV) following administration of neoadjuvant chemotherapy (NAC) in patients with bladder cancer and to examine whether changes in PMV following NAC are predictive of perioperative complications, pathologic response or survival.
Methods: During the period of 2009–2013, patients undergoing NAC and radical cystectomy (RC) at our institution with pre and post NAC cross sectional images available were included. Bilateral total psoas muscle volume (PMV) was obtained from pre- and post- NAC images and the proportion of PMV change was calculated by dividing the change PMV by pre-NAC PMV. Analyses for the assessment of factors predicting PMV loss, partial/complete pathologic response (pPR/pCR), complications, readmission, cancer specific (CSS), recurrence-free (RFS) and overall survival (OS) were performed.
Results: Total of 60 patients had complete radiological data available. Post-NAC PMV and BMI declines were statistically significant, 4.9% and 0.05%, respectively. NAC dose reduction/delay was a significant predictor of PMV loss (coefficient B 4.6; 95% CI 0.05–9.2; p = 0.047). The proportion of PMV decline during NAC was not a predictor of pPR, pCR, complications, readmission, CSS, RFS, or OS.
Conclusions: We observed an interval decline in PMV during the period of NAC administration and this decline was more than it could be appreciated with changes in BMI during the same period. PMV decline was associated with the need for dose reduction/dose delay during NAC. In our series, PMV changes occurring during NAC administration were not predictive of pathologic response to chemotherapy, postoperative complications or survival.
INTRODUCTION
Radical cystectomy (RC) is a high-risk procedure with a perioperative complication rate as high as 64% and a peri-operative mortality rate ranging from 2.7 to 5.1% [1–3]. Patients with bladder cancer (BCa) undergoing RC commonly have additional comorbidities, which when quantified using tools such as the Charlson Comorbidity Index or American Society of Anesthesiologists score, are associated with adverse perioperative outcomes [4]. Potentially modifiable conditions, such as preoperative nutritional deficiency, have been shown to be associated with an increased risk of perioperative mortality and diminished overall survival [5]. Identifying other markers of increased perioperative risk would allow better patient risk stratification and possibly guide perioperative management to optimize patient outcomes.
Sarcopenia, or the age-related loss of skeletal muscle mass and function, has been investigated as a potential marker of adverse outcomes among surgical patients [6]. Using total psoas area (TPA) as a surrogate measure, prior groups have demonstrated an association between sarcopenia and increased perioperative complications [7], increased length of stay [8], and increased mortality among patients undergoing major abdominal surgery [9]. Among patients undergoing RC, sarcopenia has been shown to be associated with increased risk of major perioperative complication, increased postoperative length of stay [10], and diminished long-term survival [11].
Studies in patients with gastroesophageal cancer have shown a greater prevalence of sarcopenia in patients after receiving neoadjuvant chemotherapy (NAC), though this was not associated with differences in perioperative or oncologic outcomes [12]. In contrast to baseline sarcopenia, the changes in muscle volume over the course of treatment can serve as a potential biomarker of frailty/surgical fitness and have not been well studied. Similarly the impact of NAC on psoas muscle volume in patients with BCa has not been defined. The objective of this study was to assess for changes in psoas muscle volume (PMV) following administration of NAC and to examine whether changes in PMV following NAC are predictive of perioperative complications, pathologic response or survival.
MATERIALS AND METHODS
After obtaining Institutional Review Board approval, the clinical records of patients with BCa within an institutionally maintained database were retrospectively reviewed. Patients receiving NAC followed by RC from January 2009 to December 2013 were identified. All patients with abdomen and pelvis computed tomography (CT) scan prior to NAC initiation and again after completion of NAC with available films allowing evaluation were included for the final analysis.
A single trained CT technologist (WK) who was blinded to patients’ clinical data obtained bilateral psoas muscle volume values. Pre- and post- NAC psoas muscle volumes were measured from the origin of psoas at the level of the lumbar vertebrae to its insertion in the lesser trochanter on CT datasets using a semi-automatic segmentation method (Aquarius iNtuition version 4.4.6, TeraRecon Inc., San Francisco CA) as shown in Fig. 1. The proportional change in psoas muscle volume (PMV) was calculated by dividing the change in PMV by the pre-NAC PMV (ΔPMV/pre-NAC PMV) and is reported as percentage of PMV. Similarly pre- and post- NAC BMI was used to calculate percentage of BMI change (ΔBMI/pre-NAC BMI).
Complete pathologic response (pCR) was defined as pT0N0 and partial pathologic response (pPR) was defined as ≤pT1N0 (including pT1/Tis/Ta/T0). Our primary objective was to assess if there was an interval change in PMV and BMI following NAC administration. Furthermore, we aimed to identify factors contributing to PMV change and to see if patients with PMV change exhibited differences in pathologic response to NAC (pCR and pPR), perioperative complications (any, major), readmission, or survival (overall (OS), recurrence free (RFS), cancer specific (CSS)).
Demographics, clinical staging, NAC regimen, histopathology, and survival data were analyzed for the cohort. Demographics included age, gender, weight, BMI, smoking history and Eastern Cooperative Oncology Group (ECOG) status. Clinical staging was determined based on exam under anesthesia and transurethral resection of bladder tumor (TURBT) with nodal staging based on preoperative cross-sectional imaging. Presence of hydronephrosis at the time of presentation was also documented. Data on the chemotherapeutic agents used, the number of cycles, and duration of NAC was collected. Histopathology assessment included tumor classification, presence of positive surgical margin (PSM), presence of carcinoma in situ (CIS) and TNM staging according to the 2010 American Joint Committee on Cancer classification.
Complications were defined as any intraoperative or 30-day postoperative complications. Postoperative complications were graded using the Clavien-Dindo classification system [13], with major complications defined as Clavien grade II or greater.
Categorical variables are presented as count (proportion) and continuous variables as median and interquartile range (IQR). Mean and median values were compared using Student’s t-test and Wilcoxon rank-sum test, respectively.
Univariable linear and binary regression analyses were performed to assess the relationship between proportion of PMV loss as linear and dichotomized (5% cut off) variables, respectively, with outcomes of interest. The multivariable Cox proportional hazards regression model for survival was used to assess hazard ratios (HRs) for variables of interest: ECOG performance status (PS), age, gender, duration of NAC, pathological stage, and proportion of PMV loss dichotomized to <5% and ≥5%. The cut off level of 5% was chosen based on the median PMV loss in our cohort. Statistical significance was set at a p value <0.05. Analyses were performed using SPSS v.21 software (IBM SPSS Statistics; IBM Corp, Armonk, NY, USA).
RESULTS
We identified 130 patients who received NAC followed by RC during the study period. Among them, 60 patients had pre- and post-NAC cross-sectional imaging sufficient for PMV analysis. Characteristics of those 60 patients are summarized in Table 1. The mean pre-NAC BMI for the cohort was 29.8 kg/m2 (±5.5) and the median PMV was 423.5 cm3 (322.25–467). Pure urothelial cancer was the most common histology (81.7%) and gemcitabine-cisplatin was the most commonly used NAC regimen (63.3%). Overall, 95% of the cohort received three or more cycles of NAC. The median follow up time for the cohort was 15.5 (8–23) months. The mean estimated OS for the cohort was 38.3 (95% CI 29.7–46.8) months with median being 37 months, the median was not reached for RFS and CSS.
Complication data and pathologic outcomes are outlined in Table 2. The median interval from pre-NAC to post-NAC CT imaging was 18 weeks (IQR 14–21 weeks). The median pre-NAC to post-NAC BMI loss and PMV loss were 0.05% (–2.6–4.8) and 4.9% (1.8–10.1), respectively. On paired t-test comparing mean pre- and post-NAC BMI, there was a statistically significant decline in BMI following NAC (p = 0.03). Similarly, the decline in median PMV after NAC was statistically significant on Wilcoxon signed-rank test (p < 0.0001).
Factors predicting PMV loss
Patient characteristics (age, weight, ECOG PS category), clinical stage of tumor (cT stage, cN stage), presence of hydronephrosis, time interval between pre and post NAC CT acquisition, and type and duration of NAC were not statistically significant predictors of PMV loss or BMI decline on the univariable analysis (results not shown). The need for dose reduction/dose delay of NAC was associated with the proportion of PMV loss (Coefficient B 4.6, 95% CI 0.05–9.2; p = 0.047) but it was not a predictor of BMI loss (Coefficient B – 0.31, 95% CI – 2.9–2.3; p = 0.8) on univariable analysis.
Influence of muscle volume loss on key outcomes
As a continuous variable the proportion of psoas muscle volume loss was not a predictor of pCR (OR 0.95, 95% CI (0.87–1.04); p = 0.23), pPR (OR 0.98, 95% CI (0.92–1.06); p = 0.81), occurrence of any 30-day postoperative complication (OR 1.00, 95% CI (0.93–1.09); p = 0.89), major 30-day complication (OR 1.00, 95% CI (0.92–1.08); p = 0.99), or 90-day readmission (OR 1.03, 95% CI (0.95–1.11); p = 0.47) on univariable analysis. Similar trends were observed for baseline BMI and total psoas muscle volume. The proportion of PMV loss was not associated with RFS (HR 0.98, 95% CI (0.91–1.05); p = 0.55), CSS (HR 1.003, 95% CI (0.92–1.09); p = 0.95) or OS (HR 1.01, 95% CI (0.95–1.08); p = 0.74) on univariable Cox regression analysis.
Table 4 outlines the key outcomes for patients stratified based on the cutoff of 5% PMV loss after NAC. Although patients with >5% PMV loss appeared to have lower pathologic response rate, higher complication and readmission rates, and lower OS/RFS/CSS, these differences were not statistically significant.
On multivariable cox regression model predicting OS (Table 3), presence of pathologic response (partial and complete) to NAC was the single predictor of overall survival in our study (HR 0.19, 95% CI (0.04–0.92); p = 0.04).
DISCUSSION
Catabolic response to stress triggers a series of changes in the body’s metabolism signified by an increase in the metabolic rate, lipolysis and protein catabolism in order to meet the demands for tissue reparation. The net consequence of such metabolic events is the catabolism of stored body fuels. Given that the extent of such catabolic response is proportional to the magnitude of stress [14], we aimed to assess the catabolic effects of NAC administration in patients undergoing subsequent RC. We speculated that changes in PMV could serve as a surrogate for the extent of catabolic response in patients receiving NAC.
To further understand the context of our findings, we can consider a 60 year old man with a calculated BMI of 30 kg/m2 (mean BMI in our study) measuring 1.75 m in height and weighing 91.8 kg; the 1.40% BMI loss (mean BMI loss in the series) for this man translates into 1.3 kg (91.8 kg×1.40% = 1.3 kg) of weight decline. His skeletal muscle mass (33–39% of total weight) would be calculated at 30.3–35.8 kg. Assuming three different example proportions of muscle mass loss (30, 50, and 100%) for this total weight loss of 1.3 kg translates to 0.39, 0.65, and 1.3 kg of muscle mass loss, respectively. The expected changes in the skeletal muscle volume for a skeletal muscle mass of 30.3 kg for these calculated values equate to 1.28%, 2.14%, and 4.3% of volume loss respectively. These percentage changes are lower than the mean PMV loss of 5.35% (median 4.9%) observed in our study, suggesting that changes in BMI may significantly underestimate the extent of catabolic metabolism and muscle volume loss in patients in our study. Loss of protein will produce less energy compared to fat, however protein loss may have potential more deleterious effects on healing, immunity and outcomes.
Sarcopenia, defined as severe wasting of skeletal muscle, has been shown to be associated with worse CSS and OS in BCa patients undergoing RC [11], as well as an increased risk of perioperative complications among these patients [10]. The definition of sarcopenia, however, is different across studies. Psutka et al defined sarcopenia based on skeletal muscle index (SMI) measurement, where SMI was calculated by dividing the cross-sectional area of all skeletal muscles measured at third lumbar vertebra level divided by the patient’s height squared [11]. In contrast, Smith, et al. defined sarcopenia based on the measurements of cross-sectional area of both psoas muscles (TPA) on CT at third lumbar vertebra level normalized to patient height [10]. Taguchi, et al. reported that in the setting of metastatic urothelial carcinoma in patients receiving chemotherapy, sarcopenia defined as SMI of <55 cm2/m2 (men) and <39 cm2/m2 (women) was an independent predictor of poor prognosis [15]. In our study, we aimed to assess the impact of NAC administration on skeletal muscle volume regardless of the patient’s pre-NAC skeletal muscle volume status. Given the selection bias toward patients with good performance status (median ECOG 0 in current study), one can speculate that our cohort represents a selected group of patients than those seen in general RC population. Moreover, we included patients with available imaging scans before and after NAC that were sufficient for PMV measurements, which might also introduce selection bias. Interestingly, the observed pCR was 28.3%.
Tumor and patient characteristics were not associated with PMV loss, however, NAC dose delay or dose reduction, possibly a surrogate for NAC-related complications, were associated with 4.6% decrease in PMV. This data highlights the need for implementing nutritional assessment and support in NAC patients experiencing NAC-related complications. Similarly, the type of NAC regimen did not appear to have an impact on the extent of PMV changes in our series suggesting that the generally more toxic conventional MVAC (methotrexate, vinblastine, doxorubicin, cisplatin) regimen may not have a higher impact on PMV change in patients tolerating treatment.
We did not detect any statistically significant association between the proportion of PMV change and perioperative complications, pathologic response or survival in this study. As a dichotomized variable, PMV loss ≥5% (vs.<5%) was associated with a non-statistically significant trend towards worse outcomes in all parameters assessed. Larger sample size with adequate power is required to evaluate whether these differences in outcome between patients with greater PMV loss can achieve statistical significance. Should such a relationship be identified, PMV loss following NAC can be further tested in a prospective clinical trial setting to identify patients at higher risk of adverse perioperative and oncologic outcomes (e.g. assess biological relevance/clinical validity). Based on that, targeted interventions, such as preoperative nutritional support and short-term exercise-based pre-habilitation program, could be tested, e.g. whether they improve peri-operative outcomes (e.g. assess clinical utility). Randomized controlled data suggest that such intervention is feasible and cost effective as part of survivorship strategies in patients undergoing RC [16].
Our study carries several limitations. The sample size is relatively small, from a single center and patients were retrospectively selected based on the availability of imaging studies. The timing of the CT scan acquisition was not standardized. However, the interval time between pre and post NAC images did not correlate with PMV changes on univariable analysis. Furthermore, our method of PMV measurement and PMV change as a surrogate for assessment of total body skeletal muscle mass is novel and has not been previously validated in a clinical setting; however, the software has been validated as method. Presence of sarcopenia based on SMI assessment has been shown to be associated with OS and CSS in patients with BCa [11], however, we did not measure SMI and we did not assess how well the total PMV correlates with SMI values. Patient selection, used methodology and sample size may all contribute to different results among studies.
CONCLUSIONS
In patients with BCa receiving NAC, we observed an interval decline in PMV during the period of NAC administration and this percentage of decline was greater than the percentage of changes in the BMI during the same period. The nature of the NAC regimen or its duration did not have an impact on PMV changes. However, PMV decline was associated with dose reduction and delays during NAC. In our study, PMV changes occurring during NAC administration were not predictors of pathologic response to chemotherapy, postoperative complications or survival.
Conflict of Interest
Grivas has done consulting with Genentech, Bayer, Dendreon, Bristol-Myers Squibb, Merck, Exelixis, Astra Zeneca (all irrelevant to this study); other authors reported no relevant COI.
REFERENCES
[1] | Shabsigh A , et al. Defining early morbidity of radical cystectomy for patients with bladder cancer using a standardized reporting methodology. Eur Urol (2009) ;55: :164–74. doi: 10.1016/j.eururo.2008.07.031 |
[2] | Isbarn H , et al. A population based assessment of perioperative mortality after cystectomy for bladder cancer. The Journal of urology (2009) ;182: :70–7. doi: 10.1016/j.juro.2009.02.120 |
[3] | Hautmann RE , Gschwend JE , de Petriconi RC , Kron M , Volkmer BG . Cystectomy for transitional cell carcinoma of the bladder: Results of a surgery only series in the neobladder era. The Journal of Urology (2006) ;176: :486–92; discussion 491-482. doi: 10.1016/j.juro.2006.03.038 |
[4] | Roghmann F , et al. Standardized assessment of complications in a contemporary series of European patients undergoing radical cystectomy. Int J Urol (2014) ;21: :143–9. doi: 10.1111/iju.12232 |
[5] | Gregg JR , et al. Effect of preoperative nutritional deficiency on mortality after radical cystectomy for bladder cancer. The Journal of Urology (2011) ;185: :90–6. doi: 10.1016/j.juro.2010.09.021 |
[6] | Cruz-Jentoft AJ , et al. Sarcopenia: European consensus on definition and diagnosis: Report of the European Working Group on Sarcopenia in Older People. Age Ageing (2010) ;39: :412–23. doi: 10.1093/ageing/afq034 |
[7] | Englesbe MJ , et al. Analytic morphomics, core muscle size, and surgical outcomes. Ann Surg (2012) ;256: :255–61. doi: 10.1097/SLA.0b013e31826028b1 |
[8] | Lieffers JR , Bathe OF , Fassbender K , Winget M , Baracos VE . Sarcopenia is associated with postoperative infection and delayed recovery from colorectal cancer resection surgery. Br J Cancer (2012) ;107: ;931–6. doi: 10.1038/bjc.2012.350 |
[9] | Lee JS , et al. Frailty, core muscle size, and mortality in patients undergoing open abdominal aortic aneurysm repair. J Vasc Surg (2011) ;53: :912–7. doi: 10.1016/j.jvs.2010.10.111 |
[10] | Smith AB , et al. Sarcopenia as a predictor of complications and survival following radical cystectomy. The Journal of Urology (2014) ;191: :1714–20. doi: 10.1016/j.juro.2013.12.047 |
[11] | Psutka SP , et al. Sarcopenia in patients with bladder cancer undergoing radical cystectomy: Impact on cancer-specific and all-cause mortality. Cancer (2014) ;120: :2910–8. doi: 10.1002/cncr.28798 |
[12] | Yip C , et al. Assessment of sarcopenia and changes in body composition after neoadjuvant chemotherapy and associations with clinical outcomes in oesophageal cancer. Eur Radiol (2014) ;24: :998–1005. doi: 10.1007/s00330-014-3110-4 |
[13] | Dindo D , Demartines N , Clavien PA . Classification of surgical complications: A new proposal with evaluation in a cohort of patients and results of a survey. Ann Surg (2004) ;240: :205–13. |
[14] | Desborough JP . The stress response to trauma and surgery. British Journal of Anaesthesia (2000) ;85: :109–17. |
[15] | Taguchi S , et al. Sarcopenia evaluated using the skeletal muscle index is a significant prognostic factor for metastatic urothelial carcinoma. Clin Genitourin Cancer (2016) ;14: :237–43. doi: 10.1016/j.clgc.2015.07.015 |
[16] | Jensen BT , Laustsen S , Jensen JB , Borre M , Petersen AK . Exercise-based pre-habilitation is feasible and effective in radical cystectomy pathways-secondary results from a randomized controlled trial. Support Care Cancer (2016) ;24: (8):3325–31. doi: 10.1007/s00520-016-3140-3 |
Figures and Tables
Fig.1
Cross sectional imaging demonstrating our method of psoas muscle volume assessment. Pre- and post- NAC psoas muscle volumes were measured from the origin of psoas at the level of the lumbar vertebrae to its insertion in the lesser trochanter on CT datasets using a semi-automatic segmentation method. The proportional change in psoas muscle volume (PMV) was calculated by dividing the change in PMV by the pre-NAC PMV (ΔPMV/pre-NAC PMV) and is reported as percentage of PMV.
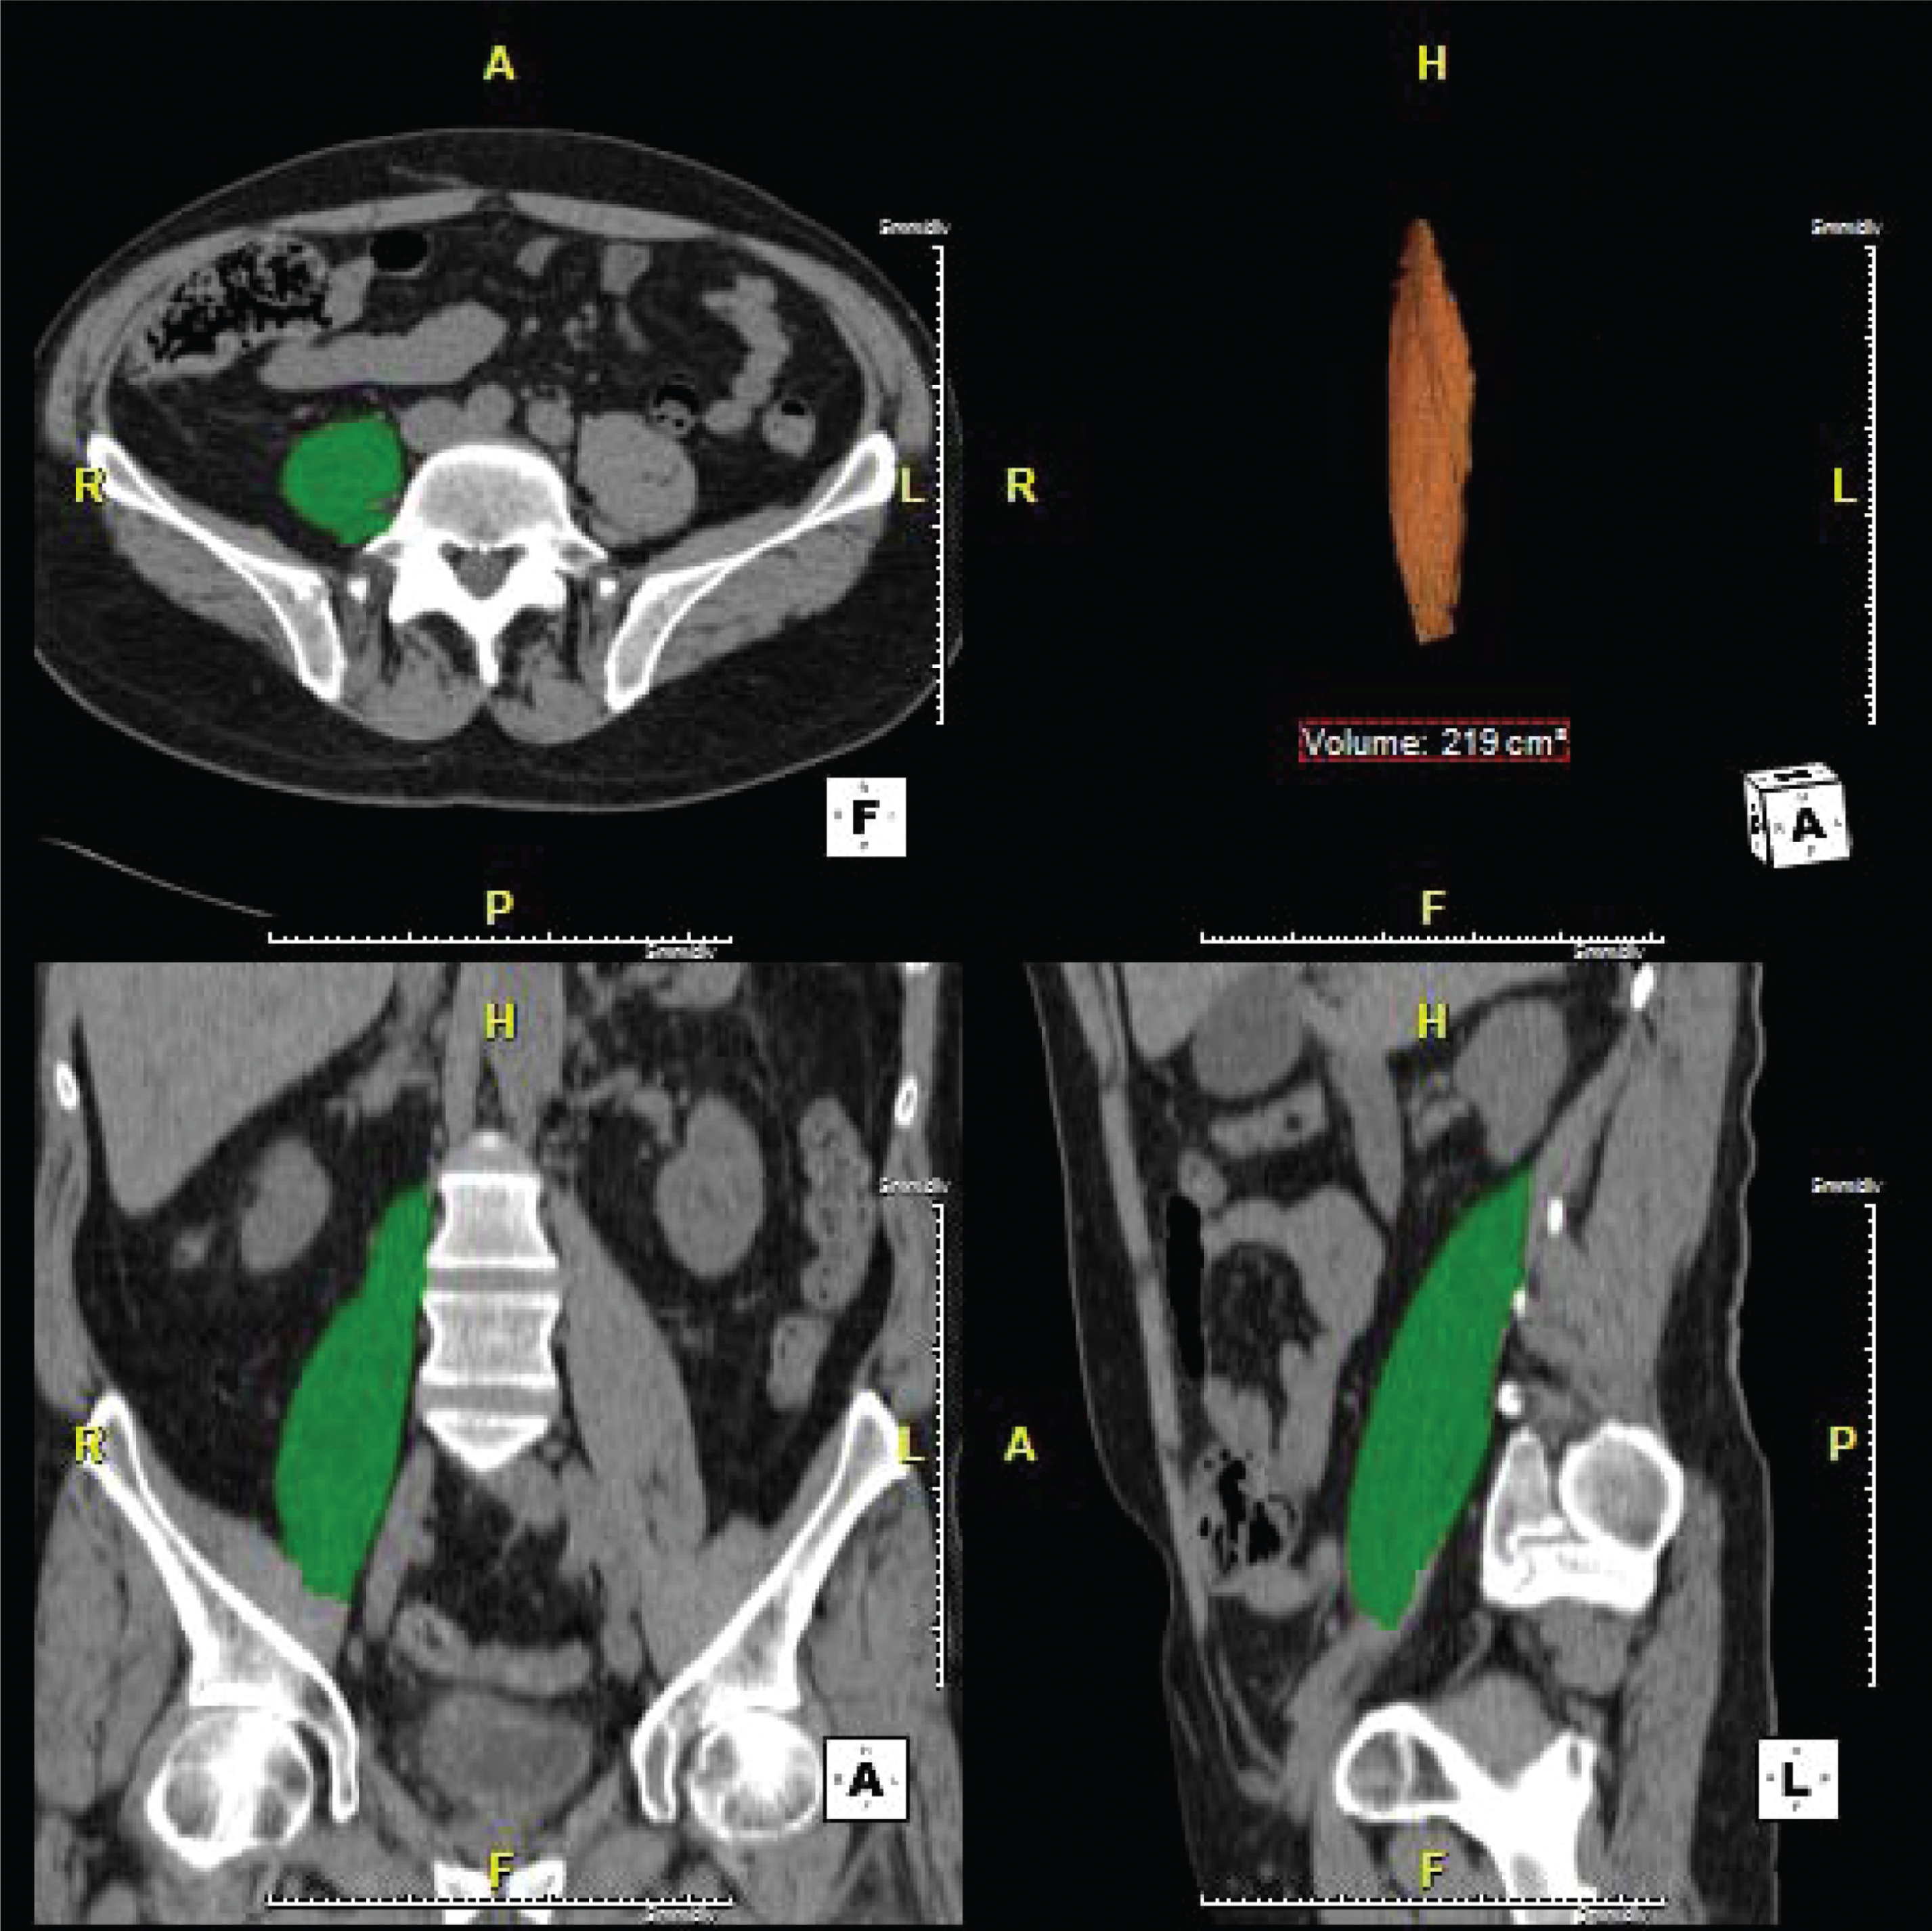
Table 1
Cohort characteristics
| N = 60 | |
| Age, median (IQR) yrs. | 62(54,70) |
| Male, N (%) kg/m2 | 52(86.7) |
| BMI, mean (SD) | 29.8(5.5) |
| Smoking history, N (%) | 43(71.7) |
| ECOG performance status, median (IQR) | 0(0–1) |
| 0, N (%) | 36(60) |
| 1, N (%) | 22(36.7) |
| 2, N (%) | 1(1.7) |
| Missing, N (%) | 1(1.7) |
| Clinical T stage, N (%) | |
| T2 | 49(81.7) |
| T3 | 10(16.7) |
| T4a | 1(1.7) |
| Clinical N stage, N (%) | |
| N0 | 46(76.7) |
| N1 | 11(18.3) |
| N2 | 2(3.3) |
| N3 | 1(1.7) |
| Hydronephrosis, N (%) | 14(23.4) |
| Primary pathology at TURBT, N (%) | |
| Urothelial cancer | 49(81.7) |
| Urothelial cancer with squamous | 6(10) |
| differentiation | |
| Other | 5(8.3) |
| Associated CIS, at TURBT N (%) | |
| Yes | 11(18.3) |
| No | 48(80) |
| Unavailable data | 1(1.7) |
| Chemotherapy regimen | |
| MVAC, N (%) | 15(25) |
| GC, N (%) | 38(63.3) |
| Other, N (%) | 7(11.7) |
| Number of Cycles | |
| <3 cycles, N (%) | 3(5) |
| 3 cycles, N (%) | 45(75) |
| 4 cycles, N (%) | 9(15) |
| >4 cycles, N (%) | 3(5) |
| Dose reduction/delay | 11(18.3) |
BMI: body mass index; CIS: carcinoma in situ; ECOG: Eastern Cooperative Oncology Group; GC: gemcitabine/cisplatin; IQR: interquartile range; MVAC: methotrexate/vinblastine/doxorubicin/cisplatin; TURBT: transurethral resection of bladder tumor.
Table 2
Pathologic response, complications and follow up data
| N = 60 | |
| Time between pre and post NAC images, | 18(14,21) |
| median (IQR) weeks | |
| Duration of NAC, median (IQR) weeks | 10(7,13) |
| Time between TURBT and RC, | 21(18,26) |
| median (IQR) weeks | |
| Pathologic T stage, N (%) | |
| T0 | 19(31.7) |
| Tis | 9(15) |
| Ta | 1(1.7) |
| T1 | 2(3.3) |
| T2 | 13(21.7) |
| T3 | 9(15) |
| T4a | 6(10) |
| Tx | 1(1.7) |
| Pathologic N stage, N (%) | |
| N0 | 49(81.7) |
| N1 | 2(3.3) |
| N2 | 6(10) |
| N3 | 3(5) |
| Proportion of BMI loss, median (IQR) % | 0.05(–2.6,4.8) |
| Proportion of BMI loss, mean (SD) % | 1.4(5.6) |
| PMV loss, median (IQR) % | 4.9(1.8–10.1) |
| PMV loss, mean (SD) % | 5.3(6.9) |
| Any complications, N (%) | 42(70) |
| Intraoperative complications, N (%) | 2(3.3) |
| 30-day postoperative complications, N (%) | 41(68.3) |
| Clavien I, N (%) | 8(13.3) |
| Clavien II, N (%) | 17(28.3) |
| Clavien III, N (%) | 14(23.3) |
| Clavien IV, N (%) | 2(3.3) |
| 90-day readmission, N (%) | 21(35) |
| Positive surgical margin, N (%) | 4(6.7) |
| pPR, N (%) | 30(50) |
| pCR, N (%) | 17(28.3) |
| Follow up time, median (IQR) months | 15.5(8,23) |
| Estimated OS, mean (95% CI) months | 38.3(29.7,46.8) |
| -Median | 37 |
| Estimated CSS, mean (95% CI) months | 45.8(38.7,52,9) |
| -Median | not reached |
| Estimated RFS, mean (95% CI) months | 42.9(36.4,49.5) |
| -Median | not reached |
BMI: body mass index; CSS: cancer-specific survival; OS: overall survival; pCR: pathologic complete response; pPR: pathological partial response; PMV: psoas muscle volume; RC: radical cystectomy; RFS: recurrence-free survival; TURBT: transurethral resection of bladder tumor.
Table 3
Multivariable cox regression analysis of factors predicting overall survival
| Variables | Cox regression analysis | |
| HR (95% CI) | p | |
| ECOG performance status | 1.03 (0.36–2.96) | 0.96 |
| Gender | ||
| Male | 1 | |
| Female | 0.78 (0.36–1.69) | 0.53 |
| PMV loss* | ||
| <5% | 1 | |
| ≥5% | 1.67 (0.55–5.11) | 0.36 |
| PMV loss* (continuous variable) | 0.99 (0.91–1.08) | 0.85 |
| Surgical margin | ||
| Negative | 1 | |
| Positive | 3.93 (0.91–16.93) | 0.06 |
| Duration of NAC | 0.99 (0.98–1.01) | 0.51 |
| pPR (≤pT1N0) | ||
| No | 1 | |
| Yes | 0.19 (0.04–0.92) | 0.04 |
*These variables were entered in the model independently and the performance of other variables remained the same on each occasion; ECOG: Eastern Cooperative Oncology Group, NAC: neoadjuvant chemotherapy; pPR: pathologic partial response; PMV: psoas muscle volume.
Table 4
Comparison of key outcomes between cohorts stratified based on proportion of psoas volume loss
| <5% psoas volume loss | ≥5% psoas volume loss | p | |
| N = 32 | N = 28 | ||
| pPR, N (%) | 18 (56.2) | 12 (42.9) | 0.31 |
| pCR, N(%) | 11 (34.4) | 6 (21.4) | 0.26 |
| Any complications, N (%) | 20 (62.5) | 22 (78.6) | 0.18 |
| Major complications, N (%) | 6 (18.8) | 10 (35.5) | 0.14 |
| Readmission, N (%) | 10 (31.2) | 11 (39.3) | 0.51 |
| RFS, HR (95% CI) | Ref. | 1.41 (0.5–3.9) | 0.50 |
| OS, HR (95% CI) | Ref. | 1.92 (0.7–5.5) | 0.22 |
| CSS, HR (95% CI) | Ref. | 2.81 (0.7–10.9) | 0.13 |
| Follow up, median (IQR) months | 14 (8–24) | 16 (7–23) | 0.88 |
CSS: cancer-specific survival; OS: overall survival; pCR: pathologic complete response; pPR: pathologic partial response; PMV: psoas muscle volume; RFS: recurrence-free survival.


