
Micropapillary Bladder Cancer: Insights from the National Cancer Database
Abstract
Introduction: Micropapillary bladder cancer (MPBC) is a variant histology of urothelial carcinoma (UC) that is associated with poor outcomes however given its rarity, little is known outside of institutional reports. We sought to use a population-level cancer database to assess survival outcomes in patients treated with surgery, radiation therapy and/or chemotherapy.
Materials and Methods: The National Cancer Database (NCDB) was queried for all cases of MPBC and UC using International Classification of Disease-O-3 morphologic codes between 2004–2014. Primary outcome was survival outcomes stratified by treatment modality. Treatments included radical cystectomy (RC) with or without neoadjuvant chemotherapy (NAC) or adjuvant chemotherapy (AC).
Results: Overall 869 patients with MPBC and 389,603 patients with UC met the inclusion criteria. Median age of the MPBC cohort was 69.9 years (58.9–80.9) with the majority of the cohort presenting with high-grade (89.3%) and muscle invasive or locally advanced disease (47.6%). For cT1 MPBC, outcomes of RC and BPS were not statistically different. For≥cT2 disease, NAC showed a survival benefit compared with RC alone for UC but not for MPBC. On multivariable analysis, MPBC histology independently predicted worse increased risk of death. On subanalysis of the MPBC RC patients, NAC did not improve survival outcomes compared with RC alone.
Conclusions: Neoadjuvant chemotherapy utilization and early cystectomy did not show a survival benefit in patients with MPBC. This histology independently predicts decreased survival and prognosis is poor regardless of treatment modality. Further research should focus on developing better treatment options for this rare disease.
ABBREVIATIONS
AC | adjuvant chemotherapy |
BPS | bladder preservation surgery |
MMT | multimodal therapy |
MPBC | micropapillary bladder cancer |
NAC | neoadjuvant chemotherapy |
NCDB | National Cancer Database |
RC | radical cystectomy |
UC | urothelial carcinoma |
INTRODUCTION
Micropapillary bladder cancer (MPBC) was first described as a distinct histological subtype of urothelial carcinoma (UC) in 1994 by pathologists at the University of Texas M.D. Anderson Cancer Center [1]. While there are 74,000 new bladder cancer cases expected in 2015 [2], the micropapillary variant is rare and has been estimated to represent 0.01–2.2% of urothelial tumors [1, 3–5]. This subtype of urothelial carcinoma has been associated with a higher stage at diagnosis and increased risk of metastatic disease, even if it comprises only a small fraction of the overall tumor volume [4, 6–8].
The literature on MPBC is dominated by single institution, retrospective studies from tertiary centers, the largest of which included 100 subjects[4, 6, 8–11]. At the population level, two studies in 2011 and 2015 have queried the Surveillance, Epidemiology, and End Results (SEER) 17-database registry but were only able to compile 120 and 98 patients, respectively, giving them similar sized cohorts to prior single institution experiences [3, 12].
Evidence from large randomized trials published in the past decade and a half has supported the use of neoadjuvant chemotherapy (NAC) for≥T2 disease, however, the utility of such an approach with variant histology, and specifically MPBC, remains unclear [13]. The poor prognosis of MPBC and disparities in treatment response may be explained by underlying differences in tumor biology between UC and MPBC [14]. The available literature is limited to retrospective subgroup analyses of those same randomized trials and, as such, the results have been mixed [11, 15].
The current body of evidence on MPBC is constrained due to the rarity of the disease. There remains significant work in studying the prognostic significance and possible treatment strategies of this variant. We sought to retrospectively assess the survival outcomes of MPBC stratified by treatment modality. For cT1N0M0 patients, we hypothesized that immediate RC may provide a therapeutic benefit whereas the addition of NAC for locally advanced disease (≥cT2) may confer a survival advantage.
MATERIALS AND METHODS
Dataset
The National Cancer Database (NCDB) captures over 70% of all new invasive cancer diagnoses annually from any of the over 1,500 programs participating in the American College of Surgeons Commission on Cancer approvals program. The database ranges from 2004–2013. Available data include patient-level demographics, facility characteristics, cancer-specific information and treatment modality [16].
Cohort
We identified 439,188 patients with bladder cancer diagnosed between 2004–2013. Using International Classification of Disease-O-3 (ICD-O-3) morphologic code 8131 we identified 869 patients with identified as having micropapillary bladder cancer. Urothelial carcinoma cases were identified using ICD-O-3 codes 8050, 8120 and 8130. For the survival analyses we wished to focus on a cohort of localized bladder cancer (cTis-cT4, cN0, cM0) and as such excluded patients with clinically positive lymph nodes or metastatic disease at the time of diagnosis. In addition patients with a concomitant diagnosis of a non-bladder malignancy were also excluded.
Outcomes
Our primary outcome was overall survival after diagnosis of bladder cancer. Overall survival was defined as the time from diagnosis to last follow-up (last known alive date or date of last contact). Secondary outcomes included treatment patterns. Definitive surgical intervention was defined as radical cystectomy, partial cystectomy or transurethral resection of bladder tumor. These latter two were collapsed into bladder preservation surgery (BPS) for survival analyses. We were able to determine the timing of when, if ever, chemotherapy was administered and classified those patients into NAC (prior to surgery) or adjuvant chemotherapy (AC;≤3 months after surgery). Utilization of either chemotherapy or radiotherapy was collapsed into use of multimodal therapy (MMT).
Independent variables
Patient level demographic information included age, race, county characteristics, year of diagnosis, location, insurance status, Deyo-Charlson Comorbidity Index (CCI). County characteristics included income and high school graduation rates which were derived from U.S. Census data from the year 2000 or 2012. Cancer facility characteristics included type, geographic location, and distance from home to facility. Facility types are defined based on the volume of patients per year as comprehensive (>500), community (100–500) and academic (>500). Patient location was defined by hometown population metropolitan (>250,000), urban (>2,500) or rural (<2,500). Facility location was collapsed into northeast, south/southeast, Midwest and west. Academic programs additionally were defined as providing graduate medical programs in at least four areas. Cancer-specific information included American Joint Committee on Cancer (AJCC) clinical and pathological stage.
Analysis
We first described the demographic characteristics of patients diagnosed with MPBC and then used Chi-square (categorical) and student’s t-test (continuous) for univariate comparison. For all multivariable and survival analyses, we excluded patients based on the criteria above. To compare overall survival stratified by clinical T stage and treatment, Kaplan-Meier survival analysis and stratified log-rank tests were used. Predictors of overall survival were identified using a multivariable Cox proportional hazards model. Independent predictors in the model included age, race, clinical T stage, CCI score and treatment modality. For all statistical measures, p-value < 0.05 was considered statistically significant. All analyses were performed using SPSS v23.0. Given the retrospective nature of this project, it was deemed exempt by our institutional review board.
RESULTS
Of the 439,188 bladder cancer cases included, 389,603 (88.7%) and 869 (0.2%) patients were diagnosed with UC and MPBC respectively (Table 1). The mean age at diagnosis for all UC was 71.1 (±11.8) years and for MPBC only was 69.9 (±11.0) years. The sample was predominantly male, white and from metropolitan regions. For MPBC, clinical T-stage was≤T1 in 41.2%, T2 in 35.4% and≥T3 in 11.0% at the time of diagnosis. The overwhelming majority of the patients had high-grade disease (89.3%), with 9.1% node positive and 4.7% metastatic at diagnosis. Compared with the bladder preservation group, patients undergoing RC were significantly younger (mean age 67.4±10.0 yrs v. 71.9±11.2 yrs, p < 0.001) and more likely to be managed at an academic/research center (61.1% v. 46.4%, p = 0.005). For cancer-specific characteristics, the RC group was more likely to have high grade disease (98.8% v. 89.3%, p < 0.001) and had higher T-stage at diagnosis. Compared to UC, MPBC patients were more likely to present at≥cT2 (47.6% of MPBC patients compared to 15.1% of UC; p < 0.001), with cN+ disease (9.1% v.s. 2.0%; p < 0.001) or with distant metastatic disease (4.7% v.s. 2.4%; p < 0.001).
For the 348 MPBC and 205,144 UC patients included in the survival analysis, median overall survival was 44.7 months (95% CI 33.4–56.0) and 91.9 months (95% CI 91.1–92.7) respectively (Table 2). On sub-analysis by clinical T-stage the median overall survival diminished with increasing T stage across both cohorts, though notably survival between UC and MPBC was not significantly different by log-rank test.
The Cox proportional hazards analysis of overall risk of death for all bladder cancer diagnoses and MPBC alone are displayed in Table 3. For both models, increasing age and T-stage were predictors of increased risk of death. Additional factors reaching statistical significance as predictors of death in the combined model were non-white race, increased CCI and other insurance status, tumor grade and micropapillary histology (HR 1.256, 95% CI 1.032–1.530, p = 0.023).
In comparing outcomes of BPS vs RC in cT1 disease (Fig. 1), BPS did not reach median survival while median survival for RC patients was 44.7 months (95% CI 32.4–57.0, log rank p = 0.058). The pathologic upstaging rate was 61.8% with the following final pT stage distribution: 5.9% pT0, 5.9% pTis, 32.4% pT1, 17.6% pT2, 20.6% pT3 and 14.7% pT4. Positive lymph nodes were found in 32.4%.
On survival analysis of the RC patients with≥cT2 disease (Fig. 2), there was a statistically significance increase in median overall survival for the UC group that received NAC compared with RC alone (log rank p < 0.001). There was no such survival difference between NAC and RC alone observed in patients with≥cT2 MPBC (log rank p = 0.581). A slightly higher proportion of advanced MPBC received NAC however this was not statistically significant (34.5% v.s. 29.6%; p = 0.256). The pT0 rate was 12.5% (4/32) for the NAC group compared to 0% (0/64) for the NAC group.
While high-grade disease (HR 1.230, 95% CI 1.049–1.442), increasing age (HR 1.019, 95% CI 1.015–1.023) and increasing CCI were associated with increased hazards of death for all patients with UC or MPBC bladder cancer (Table 4), use of NAC was not significantly associated with improved survival and AC predicted a decreased hazards of death (HR 0.845, 95% CI 0.776–0.921. Micropapillary histology was not an independent predictor of survival. For MPBC patients alone, neither NAC nor AC were significant predictors of overall survival.
DISCUSSION
Micropapillary bladder cancer is a rare histologic subtype of bladder cancer with a poorer prognosis and more aggressive clinical course than traditional UC [12, 17] We have described the largest cohort of patients with MPBC reported to date in the literature with baseline disease characteristics for 869 patients and survival analysis on 348 patients. MPBC was associated with a more advanced stage at diagnosis than in conventional UC as shown in our own data and in the previously published literature [12]. The poor prognostic significance of MPBC is evident from a median overall survival that is nearly half that of conventional UC (44.7 v. 91.9 months, p < 0.001).
The earliest population-level analyses was performed in 2013 using the SEER database and included 120 patients diagnosed with MPBC from 2001–2008 [12]. There was no difference in overall survival between MPBC and conventional UC for≥T2 disease but MPBC did have significantly shorter mean OS (45.1 v. 52.7 months, p = 0.0014). On initial diagnosis, MPBC was more likely than UC to be high grade (86.1% v. 38.7%, p < 0.0001) and in those patients who were diagnosed with low grade MPBC the prognosis was no different than that of high-grade disease. The T-stage at diagnosis was≥cT2 in 50.0%, a similar percentage of muscle invasion at initial presentation to what was found in the current study.
More recently in 2015, Wang and Wang [3] combined 98 patients from the SEER 17 database with 213 patients from 11 studies published between 1980 and 2011. They reported an overall survival rate of 84.5%, 57,3% and 42.3% at 1-, 3- and 5- years, respectively. On multivariable analysis, the only predictors associated with an increased risk of death were tumor stage≥T2 (HR 4.69, 95% CI 1.01–21.8, p < 0.05) and being unmarried. Because the SEER database does not capture chemotherapy utilization, neither of these SEER studies were able to control for the effect of systemic chemotherapy onoutcomes.
Regarding optimal treatment for MPBC, there are two pressing questions to answer: does early radical cystectomy improve outcomes in non-muscle invasive MPBC and is there a role for NAC in MPBC? Kamat et al. [17] have advocated for early RC in patients diagnosed with non-muscle-invasive MPBC based on their single institution experience with 44 patients in which 67% (18 of 27) of the patients who chose upfront intravesical Bacille Calmette-Guerin (BCG) progressed to muscle invasion. At the time of cystectomy, those 18 patients were compared to 12 who had undergone immediate cystectomy and found to have a nonsignificant trend towards improved survival in the immediate cystectomy group (5-yr CSS60% v. 72%, p = 0.39). An update of the M.D. Anderson MPBC series in 2014 focused on n = 72 cT1N0M0 cases. Upfront RC was utilized in 36% (n = 26) while 55% (n = 40) received primary BCG [18]. In the primary BCG cohort, 45% progressed to muscle-invasive disease and 35% developed lymph node metastasis. At 5 years, disease specific survival was 62% for the delayed RC group compared with 100% for the upfront RC group (log rank p = 0.015). However the Memorial Sloan Kettering Cancer Center reported on their experience with n = 36 patients with non-muscle invasive MPBC in 2014 [19]. Early RC was utilized in n = 15 and conservative therapy in n = 21. They found that five-year disease specific mortality (17% vs 25% respectively; p = 0.08) and the five-year incidence of metastasis (21% and 34% respectively; p = 0.09) were not significantly different between the groups. Though we were not able to ascertain who received intravesical therapy and therefore unable to directly compare our studies, we did not detect a survival difference between early RC and BPS. However our analysis was limited by the identification of only 33 patients with cT1 MPBC who underwent RC and such a small sample may result in sampling bias.
Neoadjuvant chemotherapy in MPBC is controversial, with a recent survey of members of the Society of Urologic Oncology showing that only 50% recommend NAC followed by radical cystectomy for cT2 disease [13]. While micropapillary histology is a high-risk feature of bladder cancer and these patients may serve to benefit the most from NAC, [20] a recent study of predictors of pT0 after NAC found that variant UC histology predicted against pT0 compared to pure UC (OR 0.09, 95% CI 0.021–0.380) [21]. The same group from MD Anderson Cancer Center reported on 100 patients with MPBC diagnosed at their institution from 1989 through 2004 [11]. There was no survival advantage for NAC versus RC alone but in patients with non-muscle invasive disease a strong trend favoring immediate RC was noted despite a downstaging rate of 61% in the NAC group. Additionally, while there was a statistically significant improvement in survival for patients treated with NAC prior to RC in the all UC model, we found no such benefit if the cohort is limited to patients with MPBC. Despite what we have observed on a population level, a recent study of 82 patients treated at Memorial-Sloan Kettering found that NAC may be useful in MPBC [15]. In their cohort, patients who received NAC were more likely to have pT0 at the time of RC when compared to immediate RC. Their analysis failed to show any difference in survival between NAC and immediate RC but there was a significant improvement in OS for patients who achieved pT0. This would suggest that NAC may be useful yet for MPBC.
Despite using a population database, our treatment analyses were limited by a small sample size, which limited the potential for a more robust survival outcomes analysis. In addition, an important limitation of our database is a lack of other variables, such as performance status, renal function and post-operative complications which may affect both treatment utilization and survival outcomes. In particular, we could not control for performance status, which is the most important factor in deciding to use perioperative chemotherapy [22]. The lack of disease specific survival in the NCDB limited our study of patient outcomes. The database did not capture intravesical therapies or the dose/type of chemotherapy or radiotherapy, which limits our interpretation of our results. Though we did control for patient comorbidity using the CCI, the NCDB does not allow for review of individual patient medical records and as such there remains the possibility that treatment outcomes may be confounded by indication. Because the NCDB receives data from a heterogeneous group of cancer centers and does not undergo a central pathologic review, there may not have been a consistent identification of MPBC. Variant histologies have been found to be underreported outside of academic institutions [23]. Even within a large academic center, the interobserver agreement was only moderate with “non-classic” MPBC [24]. Our database also did not define the type or frequency of chemotherapy, which may affect survival outcomes.
CONCLUSIONS
In a population-level analysis, early RC in cT1 MPBC showed no survival differences and NAC prior to RC did not provide a survival benefit in≥cT2 MPBC. Prognosis for this variant is worse than for UC. Further research should involve prospective trials evaluating the potential treatment options for this rare but aggressive subtype of bladdercancer.
CONFLICT OF INTEREST
None.
ACKNOWLEDGEMENTS
IRB waiver: AAAQ4259
REFERENCES
[1] | Amin MB , Ro JY , el-Sharkawy T , et al. Micropapillary variant of transitional cell carcinoma of the urinary bladder. Histologic pattern resembling ovarian papillary serous carcinoma. Am J Surg Pathol (1994) ;18: (12):1224–32. |
[2] | Siegel RL , Miller KD , Jemal A . Cancer statistics, 2015. CA Cancer J Clin (2015) ;65: (1):5–29. |
[3] | Wang J , Wang FW . The Natural History, Treatment Pattern, and Outcomes of Patients With Micropapillary Bladder Carcinoma. Am J Clin Oncol (2015) ;38: (5):472–8. |
[4] | Johansson SL , Borghede G , Holmang S . Micropapillary bladder carcinoma: A clinicopathological study of 20 cases. J Urol (1999) ;161: (6):1798–1802. |
[5] | Watts KE , Hansel DE . Emerging concepts in micropapillary urothelial carcinoma. Adv Anat Pathol (2010) ;17: (3):182–86. |
[6] | Samaratunga H , Khoo K . Micropapillary variant of urothelial carcinoma of the urinary bladder; a clinicopathological and immunohistochemical study. Histopathology (2004) ;45: (1):55–64. |
[7] | Holmang S , Thomsen J , Johansson SL . Micropapillary carcinoma of the renal pelvis and ureter. J Urol (2006) ;175: (2):463–66; discussion 466-467. |
[8] | Alvarado-Cabrero I , Sierra-Santiesteban FI , Mantilla-Morales A , Hernandez-Hernandez DM . Micropapillary carcinoma of the urothelial tract. A clinicopathologic study of 38 cases. Ann Diagn Pathol (2005) ;9: (1):1–5. |
[9] | Ghoneim IA , Miocinovic R , Stephenson AJ , et al. Neoadjuvant systemic therapy or early cystectomy? Single-center analysis of outcomes after therapy for patients with clinically localized micropapillary urothelial carcinoma of the bladder. Urology (2011) ;77: (4):867–70. |
[10] | Heudel P , El Karak F , Ismaili N , Droz JP , Flechon A . Micropapillary bladder cancer: A review of Leon Berard Cancer Center experience. BMC Urol (2009) ;9: :5–. |
[11] | Kamat AM , Dinney CP , Gee JR , et al. Micropapillary bladder cancer: A review of the University of Texas M. D. Anderson Cancer Center experience with 100 consecutive patients. Cancer (2007) ;110: (1):62–7. |
[12] | Vourganti S , Harbin A , Singer EA , Shuch B , Metwalli AR , Agarwal PK . Low Grade Micropapillary Urothelial Carcinoma, Does It Exist? – Analysis of Management and Outcomes from the Surveillance, Epidemiology and End Results (SEER) Database. J Cancer (2013) ;4: (4):336–42. |
[13] | Willis DL , Flaig TW , Hansel DE , et al. Micropapillary bladder cancer: Current treatment patterns and review of the literature. Urol Oncol (2014) ;32: (6):826–32. |
[14] | Guo CC , Dadhania V , Zhang L , et al. Gene Expression Profile of the Clinically Aggressive Micropapillary Variant of Bladder Cancer. Eur Urol (2016) ;70: (4):611–20. |
[15] | Meeks JJ , Taylor JM , Matsushita K , et al. Pathological response to neoadjuvant chemotherapy for muscle-invasive micropapillary bladder cancer. BJU Int (2013) ;111: (8):E325–330. |
[16] | Bilimoria KY , Stewart AK , Winchester DP , Ko CY . The National Cancer Data Base: A powerful initiative to improve cancer care in the United States. Ann Surg Oncol (2008) ;15: (3):683–90. |
[17] | Kamat AM , Gee JR , Dinney CPN , et al. The Case for Early Cystectomy in the Treatment of Nonmuscle Invasive Micropapillary Bladder Carcinoma. J Urol (2006) ;175: (3):881–5. |
[18] | Willis DL , Fernandez MI , Dickstein RJ , et al. Clinical outcomes of cT1 micropapillary bladder cancer. J Urol (2015) ;193: (4):1129–34. |
[19] | Spaliviero M , Dalbagni G , Bochner BH , et al. Clinical outcome of patients with T1 micropapillary urothelial carcinoma of the bladder. J Urol (2014) ;192: (3):702–07. |
[20] | Culp SH , Dickstein RJ , Grossman HB , et al. Refining patient selection for neoadjuvant chemotherapy before radical cystectomy. J Urol (2014) ;191: (1):40–7. |
[21] | Pokuri VK , Syed JR , Yang Z , et al. Predictors of Complete Pathologic Response (pT0) to Neoadjuvant Chemotherapy in Muscle-invasive Bladder Carcinoma. Clin Genitourin Cancer (2016) ;14: (1):e59–65. |
[22] | Tan WS , Lamb BW , Payne H , et al. Management of Node-Positive Bladder Cancer After Neoadjuvant Chemotherapy and Radical Cystectomy: A Survey of Current UK Practice. Clin Genitourin Cancere (2015) ;13: (3):153–158. |
[23] | Shah RB , Montgomery JS , Montie JE , Kunju LP . Variant (divergent) histologic differentiation in urothelial carcinoma is under-recognized in community practice: Impact of mandatory central pathology review at a large referral hospital. Urol Oncol (2013) ;31: (8):1650–5. |
[24] | Sangoi AR , Beck AH , Amin MB , et al. Interobserver Reproducibility in the Diagnosis of Invasive Micropapillary Carcinoma of the Urinary Tract Among Urologic Pathologists. Am J Surg Path (2010) ;34: (9):1367–76. |
Figures and Tables
Fig.1
Survival outcomes of patients with cT1 disease who underwent BPS compared to RC.
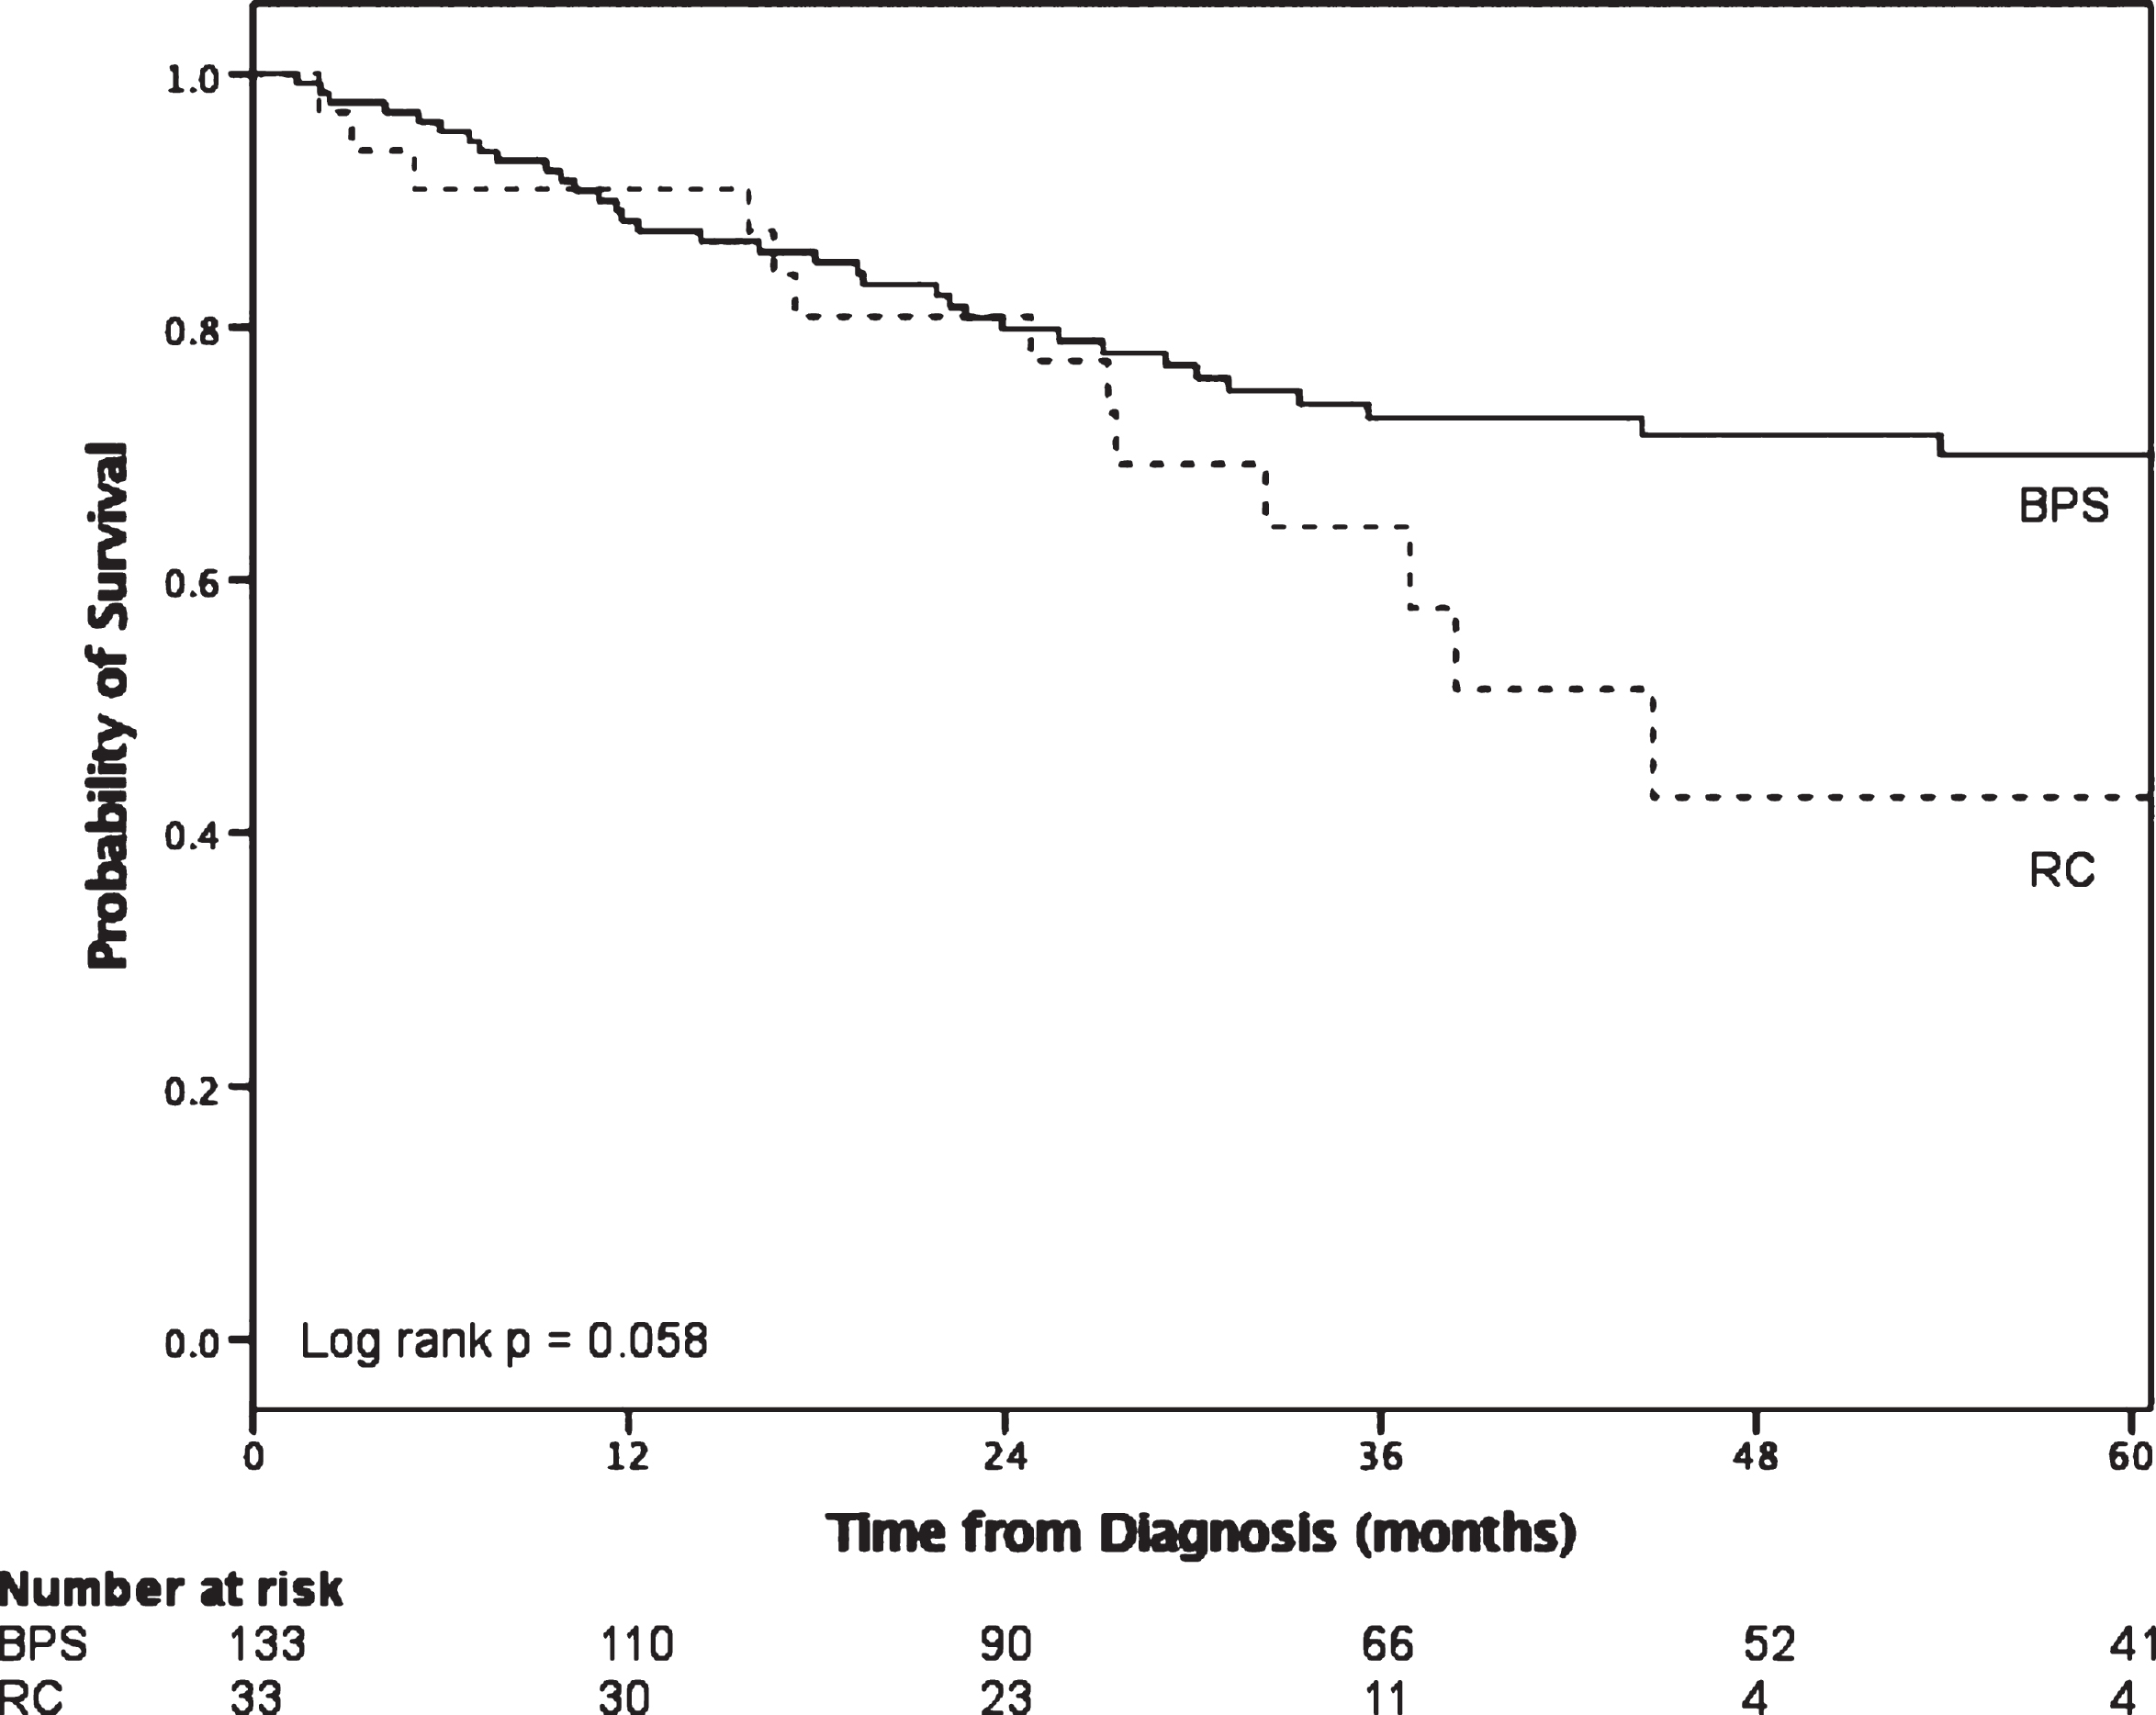
Fig.2
Survival in patients with≥cT2 disease who received radical cystectomy stratified by histology and utilization of neoadjuvant chemotherapy.
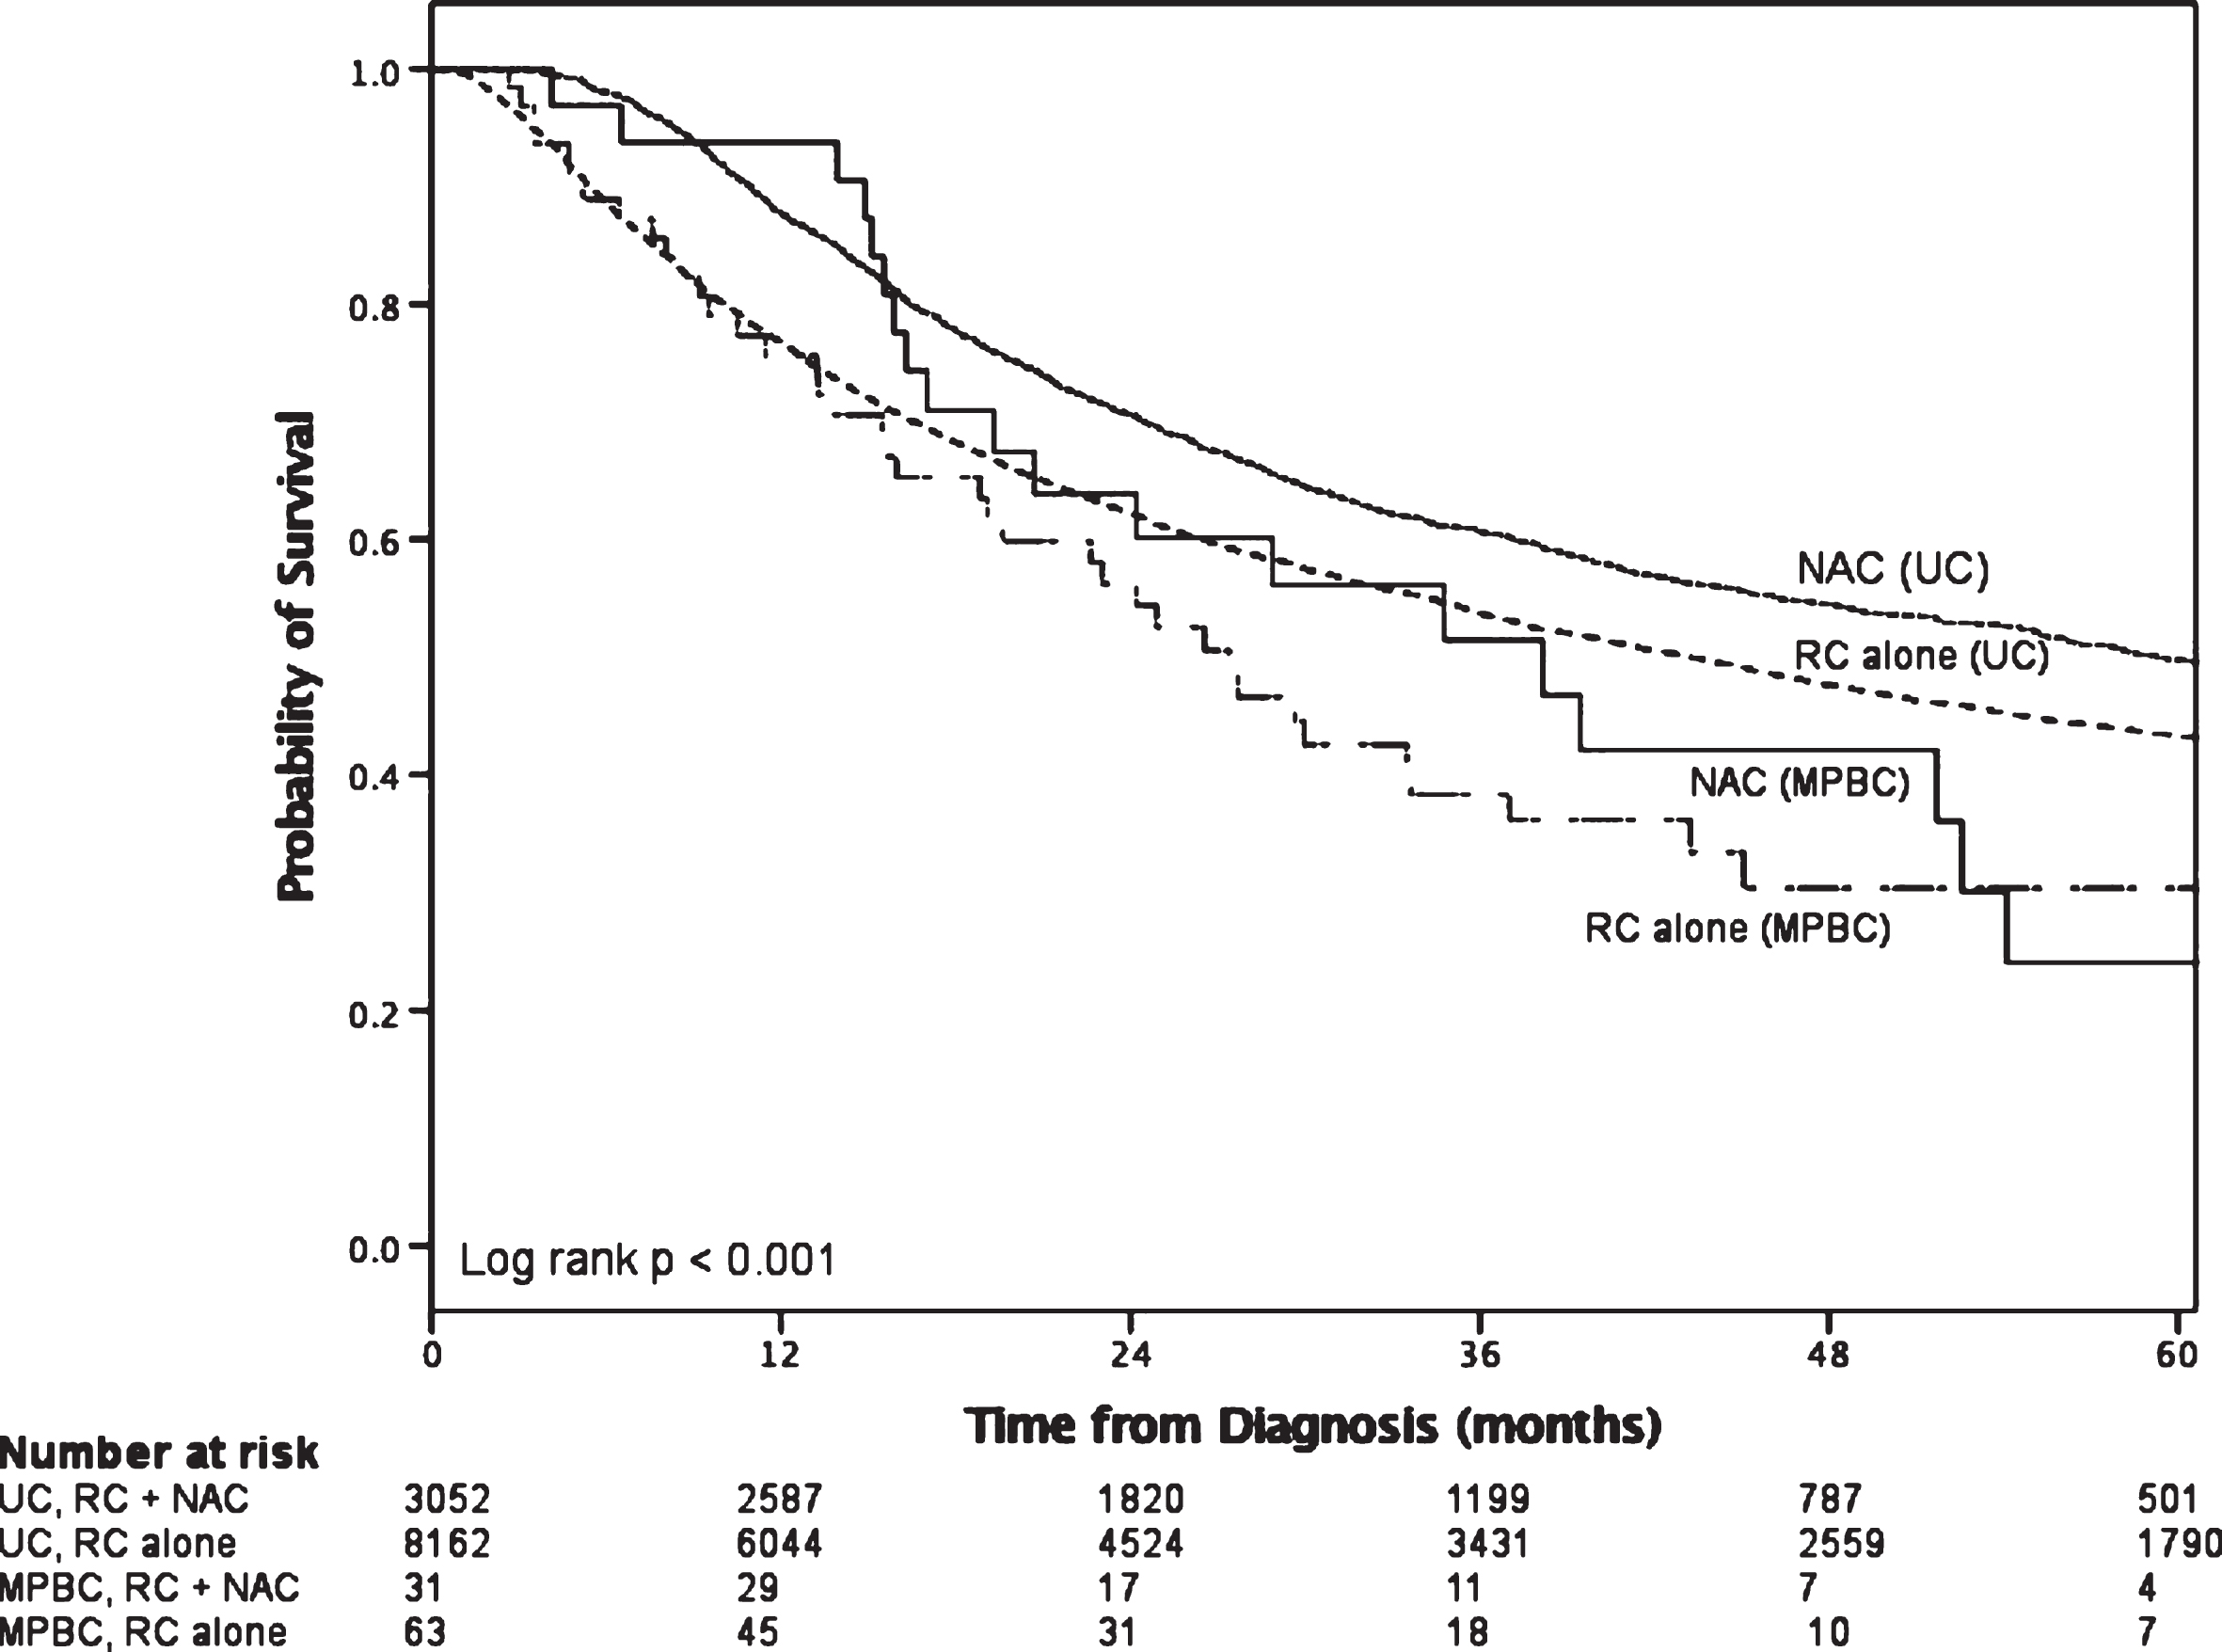
Table 1
Demographic and clincal characteristics of micropapillary and urothelial bladder cancers
| MPBC | Urothelial | |||||||
| Variable | All | Bladder | Radical | *p-value | All UC | Bladder | Radical | *p-value |
| Micropapillary | preservation | Cystectomy | n = 389,603 (%) | preservation | Cystectomy | |||
| n = 869 (%) | surgery | n = 380 (%) | surgery | n = 40,151 (%) | ||||
| n = 462 (%) | n = 349,452 (%) | |||||||
| Age | ||||||||
| <50 | 29 (3.3) | 12 (2.6) | 14 (3.7) | 17,369 (4.4) | 15,269 (4.4) | 2,100 (5.1) | ||
| 50–59 | 128 (14.7) | 52 (11.3) | 73 (19.2) | 49,310 (12.6) | 42,479 (12.2) | 6,831 (16.6) | ||
| 60–69 | 233 (26.8) | 120 (26.0) | 107 (28.2) | 96,118 (24.9) | 84,215 (24.1) | 12,903 (31.4) | ||
| 70–79 | 311 (35.8) | 153 (33.1) | 154 (40.5) | 122,401 (31.3) | 108,390 (31.0) | 13,011 (34.0) | ||
| ≥80 | 168 (19.3) | 125 (27.1) | 32 (8.4) | <0.001 | 104,405 (26.7) | 99,099 (28.4) | 5,306 (12.9) | <0.001 |
| Mean±SD (years) | 69.9±11.0 | 71.1±11.8 | 71.4±11.8 | 67.8±10.4 | <0.001 | |||
| Gender | ||||||||
| Male | 680 (78.3) | 360 (77.9) | 300 (78.9) | 294,366 (75.4) | 262,782 (75.2) | 31,584 (76.8) | ||
| Female | 189 (21.7) | 102 (22.1) | 80 (21.1) | 0.719 | 96,237 (24.6) | 86,670 (24.8) | 9,567 (23.2) | <0.001 |
| Race | ||||||||
| White | 786 (90.4) | 407 (88.1) | 355 (93.4) | 359,543 (92.0) | 322,004 (92.1) | 37,539 (91.2) | ||
| Black | 52 (6.0) | 35 (7.6) | 14 (3.7) | 19,124 (4.9) | 16,838 (4.8) | 2,286 (5.6) | ||
| Other | 18 (2.1) | 12 (2.6) | 6 (1.6) | 7,643 (2.0) | 6,771 (1.9) | 872 (2.1) | ||
| Unknown | 13 (1.5) | 8 (1.7) | 5 (1.3) | 0.062 | 4,293 (1.1) | 3,839 (1.1) | 454 (1.1) | <0.001 |
| Charlson/Deyo Score | ||||||||
| 0 | 620 (71.3) | 330 (71.4) | 269 (70.8) | 318,165 (84.5) | 256,605 (73.4) | 29,045 (70.6) | ||
| 1 | 192 (22.1) | 100 (21.6) | 87 (22.9) | 51,729 (13.7) | 69,975 (20.0) | 9,340 (22.7) | ||
| >1 | 57 (6.6) | 32 (6.9) | 24 (6.3) | 0.871 | 6,781 (1.8) | 22,872 (6.5) | 2,766 (6.7) | <0.001 |
| Type of Facility | ||||||||
| Academic/Research | 475 (55.2) | 207 (45.2) | 255 (67.8) | 107,489 (27.8) | 86,610 (25.0) | 20,879 (51.1) | ||
| Community Cancer | 41 (4.8) | 30 (6.6) | 10 (2.7) | 54,897 (14.2) | 52,034 (15.0) | 2,863 (7.0) | ||
| Comprehensive Community Cancer | 294 (34.1) | 187 (40.8) | 94 (25.0) | 197,139 (50.9) | 182,468 (52.7) | 14,671 (35.9) | ||
| Other | 51 (5.9) | 34 (7.4) | 17 (4.5) | <0.001 | 27,589 (7.1) | 25,108 (7.3) | 2,481 (6.1) | <0.001 |
| Year of diagnosis | ||||||||
| 2004–2008 | 323 (37.2) | 187 (40.5) | 121 (31.8) | 181,809 (46.5) | 162,413 (46.5) | 19,396 (47.1) | ||
| 2009–2013 | 546 (62.8) | 275 (59.5) | 259 (68.2) | 0.010 | 208,794 (53.5) | 187,039 (53.5) | 21,755 (52.9) | 0.011 |
| Grade | ||||||||
| Low | 43 (10.8) | 43 (10.8) | 4 (1.2) | 153,119 (46.4) | 151,208 (51.6) | 1,911 (5.2) | ||
| High | 357 (89.3) | 357 (89.3) | 335 (9.8) | <0.001 | 176,726 (53.6) | 141,619 (48.4) | 35,107 (94.8) | <0.001 |
| Clinical T Stage Group | ||||||||
| cTX | 371 (17.4) | 69 (16.5) | 60 (17.5) | 62,140 (16.5) | 51,238 (15.1) | 10,902 (29.4) | ||
| cT0 | 0 (0.0) | 1 (0.2) | 0 (0.0) | 1,219 (0.3) | 1,142 (0.3) | 77 (0.2) | ||
| cTis | 41 (5.2) | 36 (8.6) | 2 (0.6) | 177,443 (47.2) | 176,246 (52.1) | 1,197 (3.2) | ||
| cT1 | 235 (29.8) | 178 (42.6) | 52 (15.2) | 78,657 (20.9) | 73,767 (21.8) | 4,890 (13.2) | ||
| cT2 | 279 (35.4) | 92 (22.0) | 182 (53.1) | 43,191 (11.5) | 28,018 (8.3) | 15,173 (40.9) | ||
| cT3 | 56 (7.1) | 22 (5.3) | 33 (9.6) | 6,128 (1.6) | 3,349 (1.0) | 2,779 (7.5) | ||
| cT4 | 40 (5.1) | 20 (4.8) | 14 (4.1) | <0.001 | 6,790 (1.8) | 4,730 (1.4) | 2,060 (5.6) | <0.001 |
| Clinical N Stage Group | ||||||||
| cN0 | 589 (70.0) | 325 (70.3) | 264 (69.5) | 302,211 (77.4) | 275,845 (78.9) | 26,366 (64.1) | ||
| cN(+) | 77 (9.1) | 42 (9.1) | 35 (9.2) | 6,984 (1.8) | 4,850 (1.4) | 2,134 (5.2) | ||
| cNX | 176 (20.9) | 95 (20.6) | 81 (21.3) | 0.960 | 81,408 (20.8) | 68,757 (19.7) | 12,651 (30.7) | <0.001 |
| Clinical M Stage Group | ||||||||
| cM0 | 779 (95.3) | 416 (93.1) | 363 (98.1) | 371,083 (98.1) | 331,812 (98.0) | 39,271 (98.6) | ||
| cM1 | 38 (4.7) | 31 (6.9) | 7 (1.9) | 0.001 | 7.183 (1.9) | 6,643 (2.0) | 540 (1.4) | <0.001 |
| Pathologic T Stage Group | ||||||||
| pTX | – | – | 19 (5.0) | – | – | 3,347 (8.1) | ||
| pT0 | – | – | 8 (2.1) | – | – | 1,227 (3.0) | ||
| pTis | – | – | 12 (3.2) | – | – | 2,033 (4.9) | ||
| pT1 | – | – | 32 (8.4) | – | – | 3,997 (9.7) | ||
| pT2 | – | – | 85 (22.4) | – | – | 11,794 (28.7) | ||
| pT3 | – | – | 149 (39.2) | – | – | 12,943 (31.5) | ||
| pT4 | – | – | 75 (19.7) | <0.001 | – | – | 5,810 (14.1) | <0.001 |
| Pathologic N Stage Group | ||||||||
| pN0 | – | – | 143 (37.6) | – | – | 26,107 (63.4) | ||
| pN(+) | – | – | 206 (54.2) | – | – | 9,605 (23.3) | ||
| pNX | – | – | 31 (8.2) | <0.001 | – | – | 5,439 (13.2) | <0.001 |
*P-values derived from chi-square tests for categorical variables and students’ t-test for continuous variables.
Table 2
Overall survival after diagnosis of bladder cancer
| MPBC | UC | ||
| Median (95% CI) | Median (95% CI) | p-value | |
| All patients | 44.7 (33.4–56.0) | 91.9 (91.1–92.7) | <0.001 |
| Non-muscle invasive (≤T1) | DNR | 106.1 (105.1–107.1) | 0.185 |
| Muscle invasive (T2) | 30.0 (21.3–38.6) | 27.7 (27.0–28.4) | 0.505 |
| Locally advanced (≥T3) | 16.4 (7.7–25.2) | 16.8 (16.1–17.5) | 0.382 |
Table 3
Cox proportional hazards analysis of risk of death after diagnosis of bladder cancer
| UC and MPBC | MPBC alone | |||
| HR (95% CI) | p-value | HR (95% CI) | p-value | |
| Age | 1.067 (1.066–1.069) | <0.001 | 1.043 (1.012–1.075) | 0.006 |
| Sex | ||||
| Male | 1.0 | REF | 1.0 | REF |
| Female | 0.902 (0.881–0.922) | <0.001 | 0.809 (0.472–1.386) | n.s. |
| Race | ||||
| White | 1.0 | REF | 1.0 | REF |
| Non-white | 1.057 (1.015–1.101) | 0.007 | 1.134 (0.568–2.267) | n.s. |
| Charlson/Deyo score | ||||
| 0 | 1.0 | REF | 1.0 | REF |
| 1 | 1.398 (1.365–1.431) | <0.001 | 1.479 (0.903–2.424) | n.s. |
| >1 | 2.212 (2.142–2.284) | <0.001 | 0.336 (0.073–1.549) | n.s. |
| Insurance | ||||
| Private | 1.0 | REF | 1.0 | REF |
| Government | 0.88 (0.854–0.906) | <0.001 | 1.443 (0.737–2.828) | n.s. |
| Other | 1.535 (1.461–1.613) | <0.001 | 2.128 (0.659–6.868) | n.s. |
| Income | ||||
| < $38,000 | 1.0 | REF | 1.0 | REF |
| $38,000–$47,999 | 0.966 (0.936–0.998) | 0.037 | 1.112 (0.551–2.246) | n.s. |
| $48,000–$62,999 | 0.867 (0.84–0.895) | <0.001 | 0.86 (0.42–1.761) | n.s. |
| > $63,000 | 0.79 (0.766–0.815) | <0.001 | 0.587 (0.3–1.15) | n.s. |
| AJCC stage | ||||
| ≤T1 | 1.0 | REF | 1.0 | REF |
| T2 | 2.955 (2.874–3.039) | <0.001 | 2.655 (1.428–4.937) | 0.002 |
| ≥T3 | 4.332 (4.147–4.525) | <0.001 | 5.088 (2.363–10.956) | <0.001 |
| Grade | ||||
| Low | 1.0 | REF | 1.0 | REF |
| High | 1.485 (1.451–1.52) | <0.001 | 1.592 (0.597–4.245) | n.s. |
| Histology | ||||
| UC | 1.0 | REF | – | – |
| MPBC | 1.256 (1.032–1.53) | 0.023 | – | – |
| Treatment | ||||
| BPS alone | 1.0 | REF | 1.0 | REF |
| BPS + MMT | 0.844 (0.819–0.869) | <0.001 | 0.66 (0.33–1.316) | n.s. |
| RC Alone | 0.869 (0.832–0.909) | <0.001 | 0.871 (0.43–1.765) | n.s. |
| RC + MMT | 1.015 (0.96–1.074) | n.s. | 1.053 (0.523–2.12) | n.s. |
Table 4
Cox proportional hazards analysis of risk of death for radical cystectomy patients
| UC and MPBC | MPBC alone | |||
| HR (95% CI) | p-value | HR (95% CI) | p-value | |
| Age | 1.019 (1.015–1.023) | <0.001 | 1.053 (0.999–1.110) | n.s. |
| Sex | ||||
| Male | 1.0 | REF | 1.0 | REF |
| Female | 0.968 (0.907–1.034) | n.s. | 0.480 (0.208–1.106) | n.s. |
| Race | ||||
| White | 1.0 | REF | 1.0 | REF |
| Non-white | 1.106 (0.988–1.238) | n.s. | 0.928 (0.242–3.558) | n.s. |
| Charlson/Deyo score | ||||
| 0 | 1.0 | REF | 1.0 | REF |
| ≥1 | 1.276 (1.197–1.361) | <0.001 | 1.411 (0.581–3.424) | n.s. |
| Insurance | ||||
| Private | 1.0 | REF | 1.0 | REF |
| Government | 0.918 (0.846–0.997) | 0.041 | 1.351 (0.451–4.048) | n.s. |
| Other | 1.049 (0.926–1.188) | n.s. | 2.507 (0.429–14.666) | n.s. |
| Income | ||||
| < $38,000 | 1.0 | REF | 1.0 | REF |
| $38,000–$47,999 | 1.025 (0.933–1.126) | n.s. | 2.654 (0.804–8.763) | n.s. |
| $48,000–$62,999 | 0.945 (0.861–1.037) | n.s. | 1.784 (0.513–6.210) | n.s. |
| > $63,000 | 0.930 (0.847–1.021) | n.s. | 2.263 (0.716–7.148) | n.s. |
| Pathologic T stage | ||||
| ≤pT1 | 1.0 | REF | 1.0 | REF |
| pT2 | 1.701 (1.502–1.927) | <0.001 | 2.135 (0.406–11.238) | n.s. |
| ≥pT3 | 4.331 (3.849–4.874) | <0.001 | 4.362 (0.956–19.906) | n.s. |
| Grade | ||||
| Low | 1.0 | REF | 1.0 | REF |
| High | 1.233 (1.051–1.446) | 0.010 | – | – |
| Histology | ||||
| UC | 1.0 | REF | 1.0 | REF |
| MPBC | 1.115 (0.822–1.512) | n.s. | – | – |
| Treatment | ||||
| RC Alone | 1.0 | REF | 1.0 | REF |
| RC + NAC | 1.038 (0.956–1.127) | n.s. | 1.835 (0.769–4.382) | n.s. |
| RC + AC | 0.840 (0.771–0.915) | <0.001 | 1.271 (0.589–2.742) | n.s. |


