
The Relationship between Centralization of Care and Geographic Barriers to Cystectomy for Bladder Cancer
Abstract
Background: Centralization of cystectomy treatment for bladder cancer, while associated with improved outcomes, may impose geographic barriers to care. However, whether this effect may be counterbalanced by an increased number of high volume centers has not previously been explored.
Objective: To characterize changes in geographic disparities to high volume cystectomy centers over time.
Methods: Data on all inpatient admissions for cystectomy in New York State (NYS) from 1997–2011 was obtained from the Department of Health. Using these data, we classified hospitals according to cystectomy volume and measured patient distance traveled to a cystectomy center. Population weights, from the US Census, were used to describe changes in minimum travel distance to high- or very high-volume (HV/VHV) facilities across the NYS population.
Results: Bladder cancer patients underwent cystectomies at 195 hospitals during the study period. In 1997–2001, eleven HV/VHV facilities accounted for 37.5% of all cystectomies, while sixteen HV/VHV hospitals accounted for 71.5% of all procedures during 2007–2011. Median distance traveled by cystectomy patients to all hospitals increased from 9.6 to 14.4 miles in 1997–2001 to 2007–2011, respectively. In the same time span, the median travel distance for the NYS population to a HV/VHV center decreased by 1.9 and 9.4 miles at the median and 75th percentile, respectively.
Conclusions: Our findings demonstrate a complicated relationship between centralization and geographic access. While centralization has led to a decrease in overall access to cystectomy facilities, the process simultaneously improved access to high volume centers.
INTRODUCTION
Radical cystectomy is the standard, and potentially curative, therapy for muscle-invasive bladder cancer [1]. Achieving optimal outcomes after radical cystectomy requires maximizing tumor control while minimizing treatment-related morbidity and mortality [1, 2]. Multiple studies have shown a strong association between facility volume and improved cystectomy outcomes including reduced perioperative morbidity and mortality [3–6], shorter length of stay [7, 8], lower costs [6, 7], and better long-term survival [9]. Moreover, it has been estimated that up to 40% of the decrease in 30-day mortality after cystectomy observed between 2000–2008 was attributable to centralization of care [10]. As a result, multiple stakeholders have advocated for centralization of care to hospitals with high cystectomy volumes [11, 12]. The dialogue on centralization has received renewed attention of late due to the “Take the Volume Pledge,” a public campaign to eliminate use of low-volume centers and surgeons [13].
Alignment of advocacy and market forces (e.g., shrinking reimbursement) have led to significant centralization of cystectomies over the past decade [14]. It is estimated that high-volume hospitals accounted for 50–90% of the cystectomy market in the late-2000s compared to only 35–40% in the prior decade [10, 14, 15]. As a result, many low-volume surgeons have exited the marketplace, decreasing the overall number of available centers. These patterns have generated concerns about increased travel distances for patients seeking surgical care for bladder cancer [10, 16, 17]. Specific concerns include delays in delivery of the initial procedure and fragmented perioperative care, particularly in the management of late complications. However, centralization has also led to an increase in the number of high-cystectomy-volume centers. The net overall impact of centralization of cystectomy care on hospital access thus remains unclear.
Several studies have established that long travel distance is an important barrier to surgical care for bladder cancer [17–20]. These studies are predominantly retrospective analyses of changes in travel patterns among cancer patients. These methods fail to differentiate between patients forced to travel longer distances for care versus those that opted to travel greater distances in light of the volume-mortality benefit. In this study, we describe accessibility using Census data and geo-mapping to capture accessibility across the entire New York State (NYS) population.We further characterize population level changes in access resulting from variations in number and geographic location of high-volume, or higher quality, centers over time. We hypothesized that, despite centralization, increases in the absolute number of high-volume cystectomy centers has improved geographic access to high-quality hospitals across the entire NYS population.
MATERIALS AND METHODS
Data on all inpatient admissions in NYS from 1997–2011 were obtained from the NYS Department of Health’s Statewide Planning and Research Cooperative System (SPARCS) database [21]. SPARCS contains information on patients’ demographics, insurance status, ZIP code of residence, clinical diagnoses and procedure codes (organized by International Classification of Diseases, 9th Revision [ICD-9]), and facility identifiers. Hospital addresses were manually coded via online search based on facility identifiers. The dataset was merged with 2000 and 2010 United States (US) Census data to obtain ecological measures on the percent college educated population, median household income, and urban/rural status. Census and SPARCS datasets were merged using ZIP codes. This study was deemed exempt by the Icahn School of Medicine at Mount Sinai’s Institutional Review Board.
All bladder cancer patients (diagnosis codes 188.X and 236.7) that underwent cystectomy (procedure code: 57.59–57.79 and 68.8) were identified from the registry using ICD-9 codes. Patients with unknown ZIP code of residence or cystectomy center were excluded from the analysis. Patients residing outside of NY State were also excluded.
Currently, there is a lack of consensus on thresholds for classifying cystectomy centers based on their volume. Previous studies have tabulated cumulative hospital cystectomy volume over the study period, and then classified centers into volume quintiles of very low-volume (VLV), low-volume (LV), medium-volume (MV), high-volume (HV), and very high-volume (VHV) [3, 4, 22]. However, this method has been criticized as it yields inconsistent thresholds across studies, due to temporal and geographic variations in hospital volume across study cohorts [8, 23]. In order to address these limitations, we first divided the sample into three 5-year blocks: 1997–2001, 2002–2006, and 2007–2011. Cumulative hospital volume was calculated within each 5-year period prior to restricting the cohort to NY residents. Thresholds separating hospital volume quintiles were determined for the period of least centralization (i.e., 1997–2001) and then applied to subsequent time periods (i.e., 2002–2006 and 2007–2011). This methodology allows for reclassification of hospitals over time. Similar methods have been reported in other volume-outcomes studies [15, 16, 24, 25].
Two approaches were used to describe geographic access. First, using the cohort of cystectomy patients, driving distance traveled to the center (from home ZIP code to cystectomy hospital ZIP code) was calculated using Microsoft MapPoint® and Excel® plugin CDXTech ZipStream™. Route optimization technology from MapPoint® was used to calculate the minimal distance and time between zip codes. Distance traveled was trended over time [16, 24]. Secondly, minimal driving distance and time to any HV/VHV center were calculated from every NYS ZIP code within each 5-year period. Population-weights, from the US Census, were linked to the data by ZIP code in order to describe geographic accessibility across the entire NYS population. Geographic distribution maps, reflecting the location and volume of hospitals within NYS, were created utilizing Python code and the Basemap library. Hospitals were mapped using the latitude and longitude of the hospital ZIP code (code available at https://github.com/stensy/sparcs_bubblemap).
Statistical analyses were carried out with Stata software version 13.1 (StataCorp, College Station, TX). Descriptive statistics were used to characterize temporal changes in the proportion of cystectomies performed at higher volume facilities and the number of hospitals in each volume group. The chi-square test was used to assess unadjusted associations. In order to characterize the relationship between geographic accessibility and utilization of low-volume hospitals, we performed logistic regressions of minimum distance to HV/VHV centers on the utilization of LV/VLV and VLV hospitals. The cohort of cystectomy patients was separated into terciles according to the minimal travel distance to a HV/VHV center in order to simplify the regression. Models were adjusted for age, gender, race, Charlson comorbidity score, insurance status, and Census measures including: median income per household, urban/rural status, and percent population that was college educated. The Bonferroni correction, p < 0.025, was applied to our regression analyses as results are reported across two outcomes, utilization of LV/VLV facility and VLV facility. Wilcoxian signed-rank tests were used to compare non-parametric differences in minimum travel distance and time from 1997–2001 to 2007–2011. All statistical tests were two-sided.
RESULTS
A total of 10,713 bladder cancer patients that underwent cystectomy between 1997–2011 were identified from the SPARCS database. Of these, 9,121 patients met criteria for inclusion in the study (Supplemental Figure). The cohort was predominantly male (73.8%), aged 65–75 (40.0%), white (83.3%), insured by Medicare (60.9%), and without comorbid conditions (39.6%). Using data from 1997–2001, the following volume thresholds were created: ≤2.6, 2.7–5, 5.1–10, 10.1–27.2 and≥27.3 cystectomies per year for VLV, LV, MV, HV and VHV facilities, respectively.
Hospital volume thresholds
Study subjects received care from a total of 195 hospitals between the years of 1997–2011. Consistent with centralization, the proportion of cystectomy patients utilizing HV/VHV facilities increased from 37.4% in 1997–2001 to 71.5% in 2007–2011 (Table 1). A corresponding decrease in the market share of LV/VLV facilities, from 41.6% to 21.9%, was observed concurrently. Similarly, the number of HV/VHV hospitals increased from 11 to 16 and number of LV/VLV centers decreased from 155 to 108 from 1997–2001 to 2007–2011, respectively. Overall there was a decrease in the number of available cystectomy hospitals (184 to 130 hospitals from 1997–2001 to 2007–2011, respectively). Regardless, LV/VLV hospitals outnumbered HV/VHV centers by approximately 7:1 in 2007–2011.
Geographic access among cystectomy patients
Among the cohort of cystectomy patients, distance and time traveled increased over periods of increasing centralization. Median distance traveled increased 4.8 miles overall (from 9.6 to 11.6 to 14.4 miles in 1997–2001 to 2002–2006 to 2007–2011, respectively). Similar increases occurred for median time traveled (medians of 18.6, 20.6, and 24.0 minutes in 1997–2001, 2002–06 and 2007–2011, respectively). Restricting the analysis to HV/VHV patients only, median travel distance had a smaller increase in travel distance at 1.1 miles (from 7.6 to 8.4 to 8.7 miles in 1997–2001, 2002–2006 and 2007–2011, respectively). Similarly, travel time increased by 2.5 minutes (from 25.9 to 28.6 to 28.4 minutes in 1997–2001, 2002–2006 and 2007–2011, respectively).
Figure 1 maps the changing geographic distribution of cystectomy hospitals. Comparison of the maps depicts the decreasing density of cystectomy hospitals as LV and VLV centers exited the marketplace. HV and VHV centers were located in or near NY State’s most population-dense cities, including New York City metropolitan area, Buffalo, Rochester and Albany. Overall, approximately one-third of the cystectomy cohort lived 0–7.5 miles from the nearest HV/VHV center, another third in the >7.5–21 mile range and the final third >21 miles. Logistic regression analyses showed that relative to patients living 0–7.5 miles from a HV/VHV facility, odds ratios (ORs) for utilization of LV/VLV facility of 1.33 (95% confidence interval [CI]: 1.15–1.54) and 2.17 (95% CI: 1.81–2.60) were observed among patients in the >7.5–21 and >21 mile categories, respectively (Table 2). Similar effects were observed in the utilization of VLV facilities among patients >7.5–21 miles (OR: 1.94; 95% CI: 1.63–2.32) and >21 miles (OR: 2.47; 95% CI: 1.99–3.06) from a HV/VHV center. Regardless, there was a group of LV/VLV utilizers that traveled distances in excess of the distance to the nearest HV/VHV center (20.8%, 23.3% and 28.7% of LV/VLV utilizers in 1997–01, 2002–2006 and 2007–2011, respectively).
Geographic access to high volume centers in the New York State population
Cumulative percentage and box plots, generated with US Census data, depict population-level changes in travel distance (Figs. 2A and 2B) and travel time (Figs. 3A and 3B) to HV/VHV centers across NY State. The analyses are repeated in each time period in the study: 1997–2001, 2002–2006 and 2007–2011. The left shift in the cumulative percent curves from 1997–2001 to 2007–2011 demonstrates the decrease in distance and time to HV/VHV centers over time. Median travel distance to a HV/VHV center decreased modestly from 12.2 to 9.4 to 10.3 miles in 1997–2001, 2002–2006 and 2007–2011, respectively (p < 0.001). Similarly, median travel time decreased from 23.3 to 19.3 to 20.6 minutes in 1997–2001, 2002–06 and 2007–2011, respectively (p < 0.001). Concurrently, a 9.4-mile decrease in minimum travel distance and an 8.9-minute fall in minimum travel time were observed at the 75th percentile (observed distances of 30.8, 27.0 and 21.4 miles and times of 44.3, 41.7 and 35.4 minutes in 1997–2001, 2002–06 and 2007–2011; p < 0.001). A similar, but smaller, decrease of 7.0 miles occurred at the 90th percentile (observed distances of 68.5, 62.9, and 61.5 miles in 1997–2001, 2002–06, and 2007–2011, respectively; p < 0.001). No corresponding improvement in travel time was observed at the 90th percentile. The majority of the decrease in travel distance and time occurred in the population living between 15–70 miles or 20–80 minutes from a HV/VHV center. Little to no improvement was observed in the population living the closest and furthest from HV/VHV centers.
DISCUSSION
Radical cystectomy has long been the standard of care for patients with muscle-invasive bladder cancer. Quality improvement efforts have led to significant centralization of cystectomy centers, which is believed to reduce operative mortality [10]. Despite the documented benefits, efforts to expand centralization, such as “Take the Volume Pledge” campaign, have been greeted with notable opposition [26]. A major concern of these healthcare delivery changes is that geographic inequities are imposed upon populations that live far away from HV/VHV centers [16, 17]. Our study demonstrates a mixed relationship between centralization and geographic access. While centralization has led to a decrease in overall access to cystectomy facilities, and overall increased travel for care, the process simultaneously improved access to high volume centers. Examining travel patterns among HV/VHV utilizers shows an 7.7 mile increase in distance traveled from 1997–2001 to 2007–2011, but at a slower rate relative to the general cystectomy population. This result is likely due to competing effects on travel patterns: improvements in minimum distance to HV/VHV centers (which decreases travel) and a larger percentage of the populationseeking care from HV/VHV centers (which may extend travel depending the distribution of said patients). For these reasons, one cannot wholly extrapolate a causal relationship between increased travel distance and decreased geographic access. When examining access in the NYS population rather than among cystectomy patients, minimum required travel distance and time to HV/VHV centers decreased during periods of increasing centralization. If the goal is to redirect patients to higher quality hospitals, consistent with the ‘Take the Volume Pledge’, then centralization has arguably improved geographic access to care.
To our knowledge, this is the first study to report that centralization may have beneficially impacted geographic barriers. The decrease in distance to HV/VHV centers was modest, only 1.9 and 9.4 miles at the median and 75th percentile. However, it is quite notable that these changes occurred passively in the context of centralization. As the process continues, centralization may continue to improve access to higher quality centers. Further, policy makers may leverage this phenomenon to improve access to HV/VHV centers. For example, distributional maps displaying the location of cystectomy centers, such as Fig. 1, may be superimposed onto population density maps to identify optimal locations for the placement of additional HV/VHV centers. State government may set aside tax credits for hospitals in aforementioned locations for the establishment of “centers of excellence”. Alternative strategies may be required to address the needs of patients living in particularly remote regions of the country, such as subsidies to cover travel costs.
We have further shown that LV/VLV centers are still very prevalent in NY State and that distance plays a critical role in their continued utilization. Unfortunately, no studies have evaluated the utility of accessing HV/VHV centers from great distances against the costs associated with significant travel. As of now, patients must individually weigh the benefits of HV/VHV utilization against the financial costs of travel and potential delays secondary to the referral for care, which have also been associated with increased perioperative mortality among bladdercancer patients [27, 28].
Of note, there remain a large subset of patients utilizing LV/VLV facilities and traveling excess distance compared to the nearest HV/VHV center, indicating that there are still barriers to access of HV/VHV hospitals not simply related to travel time or cost. Structural barriers related to facility type and physician access, as well as direct affordability, have been cited as significant obstacles in access to HV/VHV centers and thus appropriate care [22, 29]. Further, cultural obstacles, namely racial disparities, have been shown to be drivers of LV/VLV utilization in large urban cities where HV/VHV cystectomy providers are often located [29]. Though centralization has decreased physical distance and travel time to a HV/VHV center, further changes in access are necessary to provide care to the local, not merely the isolated or more dispersed, populations.
There are several important limitations to our study. First, the volume-mortality benefit was not independently validated in our dataset as the dataset only included inpatient mortality (an extremely rare event). This study assumes that high volume leads to higher quality, which has been robustly demonstrated in larger observational studies [3, 4]. Secondly, our study was limited to New York State. We were not able to characterize the effects of border crossing, nor account for the presence of HV/VHV facilities near the state border. This effect is somewhat attenuated by interstate variations in insurance regulations that favor the receipt of in-state care. Additionally, the findings in this study are geographic in nature, thus limiting generalizability to other states, which most likely have very different distributions in population density. However, centralization and increasing number of HV/VHV centers have been recorded across different cancer procedures and locations [10, 24], suggesting that our findings may be replicated in numerous contexts. Further, we believe the findings can likely be generalized to other highly specialized cancer surgeries (e.g., Whipple, esophagectomy) as these forms of care are often co-located in tertiary referral centers. This study is also limited in that population-density was a fixed characteristic based off the 2010 Census, and thus our findings fail to account for the effects of population shifts over time. This study may have underestimated geographic disparities in 1997–2001 and 2002–2006 given the history of migration out of Upstate New York [30], a location that lacked a HV/VHV center throughout the study timespan. Moreover, we were not able to account for patients’ access to various modes of transportation. Patients without access to a car may be particularly vulnerable in the utilization of LV/VLV hospitals. Other drivers of LV/VLV utilization, namely clinical information conferring low risk for perioperative complications (eg, pathological data), were not available in SPARCs as it is an administrative dataset. Finally, we did not assess the distribution of HV and LV surgeons, which can independently impact outcomes for cystectomy patients.
A key strength of our study is the population-based approach in the analysis of geographic barriers to care. This approach has two major advantages. First, our estimates on access are not impacted by patients selectively opting to travel further for higher quality care. Secondly, our analysis focuses on changes in access to HV/VHV centers, simultaneously recognizing the importance of both quality and distance in the assessment of access. Using this approach, geographic access to HV/VHV centers was found to modestly improve as a result of centralization. Of note, changes in travel distance were experienced differently across the population. Fortunately, the improvements in travel distance were mostly experienced among patients living at moderate-to-great distances from HV/VHV hospitals likely due to the increase in the number of high volume centers over time. It is important to note that reclassification only favorably impacts geographic barriers if the city of a newly ‘reclassified’ HV/VHV hospital does not already have a HV/VHV center. Other strengths of our study include the use of a large database that captured all cystectomies in NYS, regardless of payer type. Finally, geographic barriers were characterized using actual driving distance rather than straight-line distance. Straight-line distance has previously been reported to underestimate driving distances by 20–30% [31].
In conclusion, our study may abate some concerns that centralization imposes geographic barriers unto patients. Regardless, further analyses are needed to assess the needs of patients living in particularly remote regions as well as barriers within communities close to HV/VHV centers. Unfortunately, these analyses have been inhibited by a lack of consensus on fixed volume criteria as a quality measure for cystectomy. Despite the complicated nature of the debate on centralization, inexpensive and affordable methods to address inequities in access do exist. We believe that geographic mapping, as we have done in this study, can assist in the formulation of effective policy to appropriately address inequities in access to care.
FUNDING
This work was supported by the New York Acad-emy of Medicine through the Margaret E. Mahoney Research Fellowship.
DISCLOSURES
Dr. Wisnivesky is a member of the research board of EHE International, has received honorarium from Merck and Quintiles and research grants from Aventis and Quorum. No other conflict of interests or disclosures.
ACKNOWLEDGMENTS
We appreciate Tal Gross, of Columbia Mailman School of Public Health, for providing critical feedback on the manuscript.
Appendices
The supplementary material is available in the electronic version of this article: http://dx.doi.org/10.3233/BLC-160058.
REFERENCES
[1] | Stein JP , Lieskovsky G , Cote R , Groshen S , Feng AC , Boyd S , et al. Radical cystectomy in the treatment of invasive bladder cancer: Long-term results in 1,054 patients. Journal of Clinical Oncology: Official Journal of the American Society of Clinical Oncology (2001) ;19: (3):666–75. PubMed PMID: 11157016. |
[2] | Ghoneim MA , el-Mekresh MM , el-Baz MA , el-Attar IA , Ashamallah A . Radical cystectomy for carcinoma of the bladder: Critical evaluation of the results in 1,026 cases. The Journal of Urology (1997) ;158: (2):393–9. PubMed PMID: 9224310. |
[3] | Birkmeyer JD , Siewers AE , Finlayson EV , Stukel TA , Lucas FL , Batista I , et al. Hospital volume and surgical mortality in the United States. The New England Journal of Medicine (2002) ;346: (15):1128–37. PubMed PMID: 11948273. Epub 2002/04/12. eng. |
[4] | Birkmeyer JD , Stukel TA , Siewers AE , Goodney PP , Wennberg DE , Lucas FL . Surgeon volume and operative mortality in the United States. The New England Journal of Medicine (2003) ;349: (22):2117–27. PubMed PMID: 14645640. |
[5] | Elting LS , Pettaway C , Bekele BN , Grossman HB , Cooksley C , Avritscher EB , et al. Correlation between annual volume of cystectomy, professional staffing, and outcomes: A statewide, population-based study. Cancer (2005) ;104: (5):975–84. PubMed PMID16044400. |
[6] | Leow JJ , Reese S , Trinh QD , Bellmunt J , Chung BI , Kibel AS , et al. The Impact of Surgeon Volume on the Morbidity and Costs of Radical Cystectomy in the United States: A Contemporary Population-Based Analysis. BJU International (2014) . PubMed PMID: 24674655. |
[7] | Gorin MA , Kates M , Mullins JK , Pierorazio PM , Matlaga BR , Schoenberg MP , et al. Impact of hospital volume on perioperative outcomes and costs of radical cystectomy: Analysis of the Maryland Health Services Cost Review Commission database. The Canadian Journal of Urology (2014) ;21: (1):7102–7. PubMed PMID: 24529009. |
[8] | Hollenbeck BK , Dunn RL , Miller DC , Daignault S , Taub DA , Wei JT . Volume-based referral for cancer surgery: Informing the debate. Journal of Clinical Oncology: Official Journal of the American Society of Clinical Oncology (2007) ;25: (1):91–6. PubMed PMID: 17194909. |
[9] | Kulkarni GS , Urbach DR , Austin PC , Fleshner NE , Laupacis A . Higher surgeon and hospital volume improves long-term survival after radical cystectomy. Cancer (2013) . PubMed PMID: 23839861. |
[10] | Finks JF , Osborne NH , Birkmeyer JD . Trends in hospital volume and operative mortality for high-risk surgery. The New England Journal of Medicine (2011) ;364: (22):2128–37. PubMed PMID: 21631325. Pubmed Central PMCID: 3150488. |
[11] | Konety BR , Dhawan V , Allareddy V , Joslyn SA . Impact of hospital and surgeon volume on in-hospital mortality from radical cystectomy: Data from the health care utilization project. The Journal of Urology (2005) ;173: (5):1695–700. PubMed PMID: 15821560. |
[12] | Cooperberg MR , Porter MP , Konety BR . Candidate quality of care indicators for localized bladder cancer. Urologic Oncology (2009) ;27: (4):435–42. PubMed PMID: 19573775. |
[13] | Urbach DR . Pledging to Eliminate Low-Volume Surgery. The New England Journal of Medicine (2015) ;373: (15):1388–90. PubMed PMID: 26444728. |
[14] | Hollenbeck BK , Taub DA , Miller DC , Dunn RL , Montie JE , Wei JT . The regionalization of radical cystectomy to specific medical centers. The Journal of Urology (2005) ;174: (4 Pt 1):1385–9; discussion 9. PubMed PMID: 16145443. |
[15] | Smaldone MC , Simhan J , Kutikov A , Canter DJ , Starkey R , Zhu F , et al. Trends in regionalization of radical cystectomy in three large northeastern states from 1996 to 2009. Urologic Oncology (2012) . PubMed PMID: 22687566. |
[16] | Stitzenberg KB , Sigurdson ER , Egleston BL , Starkey RB , Meropol NJ . Centralization of cancer surgery: Implications for patient access to optimal care. Journal of Clinical Oncology: Official Journal of the American Society of Clinical Oncology (2009) ;27: (28):4671–8. PubMed PMID: 19720926. Pubmed Central PMCID: 3039919. |
[17] | Birkmeyer JD , Siewers AE , Marth NJ , Goodman DC . Regionalization of high-risk surgery and implications for patient travel times. JAMA: The journal of the American Medical Association (2003) ;290: (20):2703–8. PubMed PMID: 14645312. |
[18] | McGuirk MA , Porell FW . Spatial patterns of hospital utilization: The impact of distance and time. Inquiry: A journal of Medical Care Organization, Provision and Financing (1984) ;21: (1):84–95. PubMed PMID: 6232220. |
[19] | Spencer ES , Smith AB . Exploring the 3 As of cystectomy access to care for muscle-invasive bladder cancer. Urologic Oncology (2015) . PubMed PMID: 25579780. |
[20] | Gore JL , Litwin MS , Lai J , Yano EM , Madison R , Setodji C , et al. Use of radical cystectomy for patients with invasive bladder cancer. Journal of the National Cancer Institute (2010) ;102: (11):802–11. PubMed PMID: 20400716. Pubmed Central PMCID: 3245689. |
[21] | NYS DOH. Statewide Planning and Research Cooperative System (SPARCS). Available at: http://www.health.ny.gov/statistics/sparcs/. Accessed Apr 3, (2013) |
[22] | Hollenbeck BK , Wei Y , Birkmeyer JD . Volume, process of care, and operative mortality for cystectomy for bladder cancer. Urology (2007) ;69: (5):871–5. PubMed PMID: 17482924. Pubmed Central PMCID: 1945091. |
[23] | Halm EA , Lee C , Chassin MR . Is volume related to outcome in health care? A systematic review and methodologic critique of the literature. Annals of Internal Medicine (2002) ;137: (6):511–20. PubMed PMID: 12230353. Epub 2002/09/17. eng. |
[24] | Stitzenberg KB , Wong YN , Nielsen ME , Egleston BL , Uzzo RG . Trends in radical prostatectomy: Centralization, robotics, and access to urologic cancer care. Cancer (2012) ;118: (1):54–62. PubMed PMID: 21717436. Pubmed Central PMCID: 3184375. |
[25] | Casey MF , Gross T , Wisnivesky J , Stensland KD , Oh WK , Galsky MD . The Impact of Regionalization of Cystectomy on Racial Disparities in Bladder Cancer Care. The Journal of Urology (2015) ;194: (1):36–41. PubMed PMID: 25623748. |
[26] | Sternberg S . Surgeons push back against minimum volume standards.. US News & World Report. June 23, (2015) . |
[27] | Lee CT , Madii R , Daignault S , Dunn RL , Zhang Y , Montie JE , et al. Cystectomy delay more than 3 months from initial bladder cancer diagnosis results in decreased disease specific and overall survival. The Journal of Urology (2006) ;175: (4):1262–7; discussion 7. PubMed PMID: 16515975. |
[28] | Gore JL , Lai J , Setodji CM , Litwin MS , Saigal CS , Urologic Diseases in America P. Mortality increases when radical cystectomy is delayed more than 12 weeks: Results from a Surveillance, Epidemiology, and End Results-Medicare analysis. Cancer (2009) ;115: (5):988–96. PubMed PMID: 19142878. Pubmed Central PMCID: 2654713. |
[29] | Casey MF , Gross T , Wisnivesky J , Stensland KD , Oh WK , Galsky MD . The impact of regionalization of cystectomies on racial disparities in bladder cancer care. The Journal of Urology (2015) . PubMed PMID: 25623748. |
[30] | Deitz R . Federal Reserve Bank of New York. Population Out-Migration from Upstate NewYork. The Regional Economy of Upstate New York. (2005) . |
[31] | Fortney J , Rost K , Warren J . Comparing alternative methods of measuring geographic access to health services. Health Serv Outcomes Res Methodol (2000) ;1: (2):173–84. |
Figures and Tables
Fig.1
Geographic distribution of cystectomy facilities in New York State by ZIP code over time. Each bubble represents a single cystectomy hospital with bubble size correlating to volume status. (A) 1997–2001, (B) 2002–2006, (C) 2007–2011. Key: VLV (very low volume) hospital: ≤2.6 cystectomies per year. LV (low volume) hospital: 2.7–5 cystectomies per year. MV (medium volume) hospital: 5.1–10 cystectomies per year. HV (high volume) hospital: 10.1–27.2 cystectomies per year. VHV (very high volume) hospital: ≥27.3 cystectomies per year.
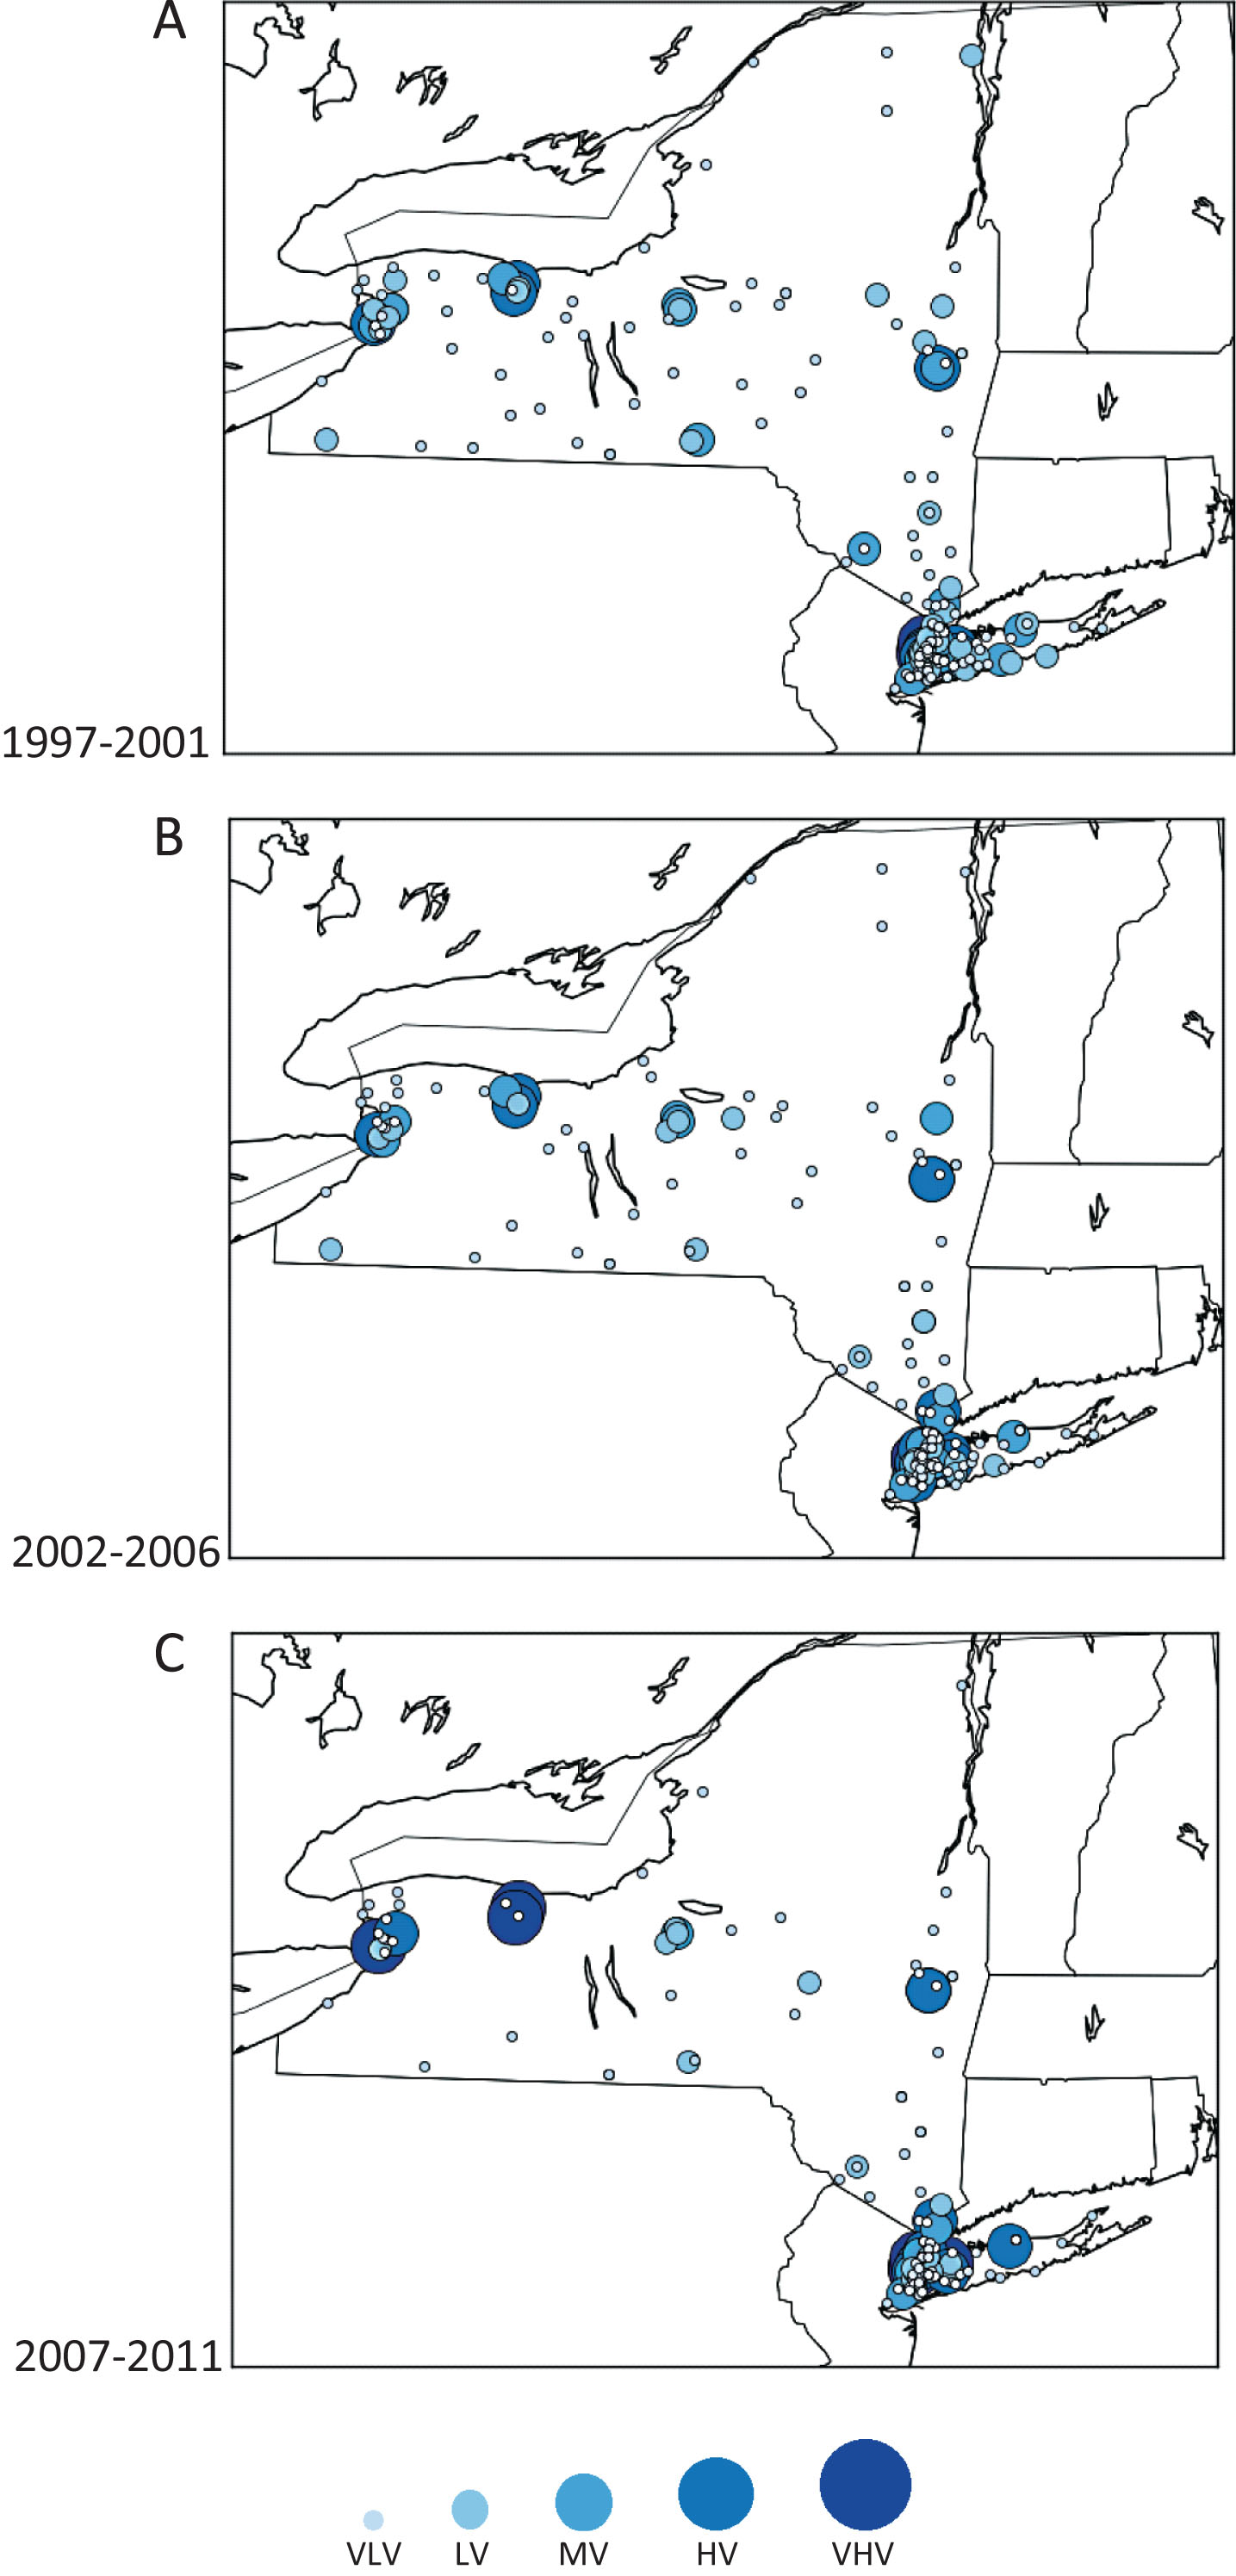
Fig.2
(A) Cumulative percent and (B) box plot distribution of the New York State population living near a HV/VHV center by minimum distance needed to travel.
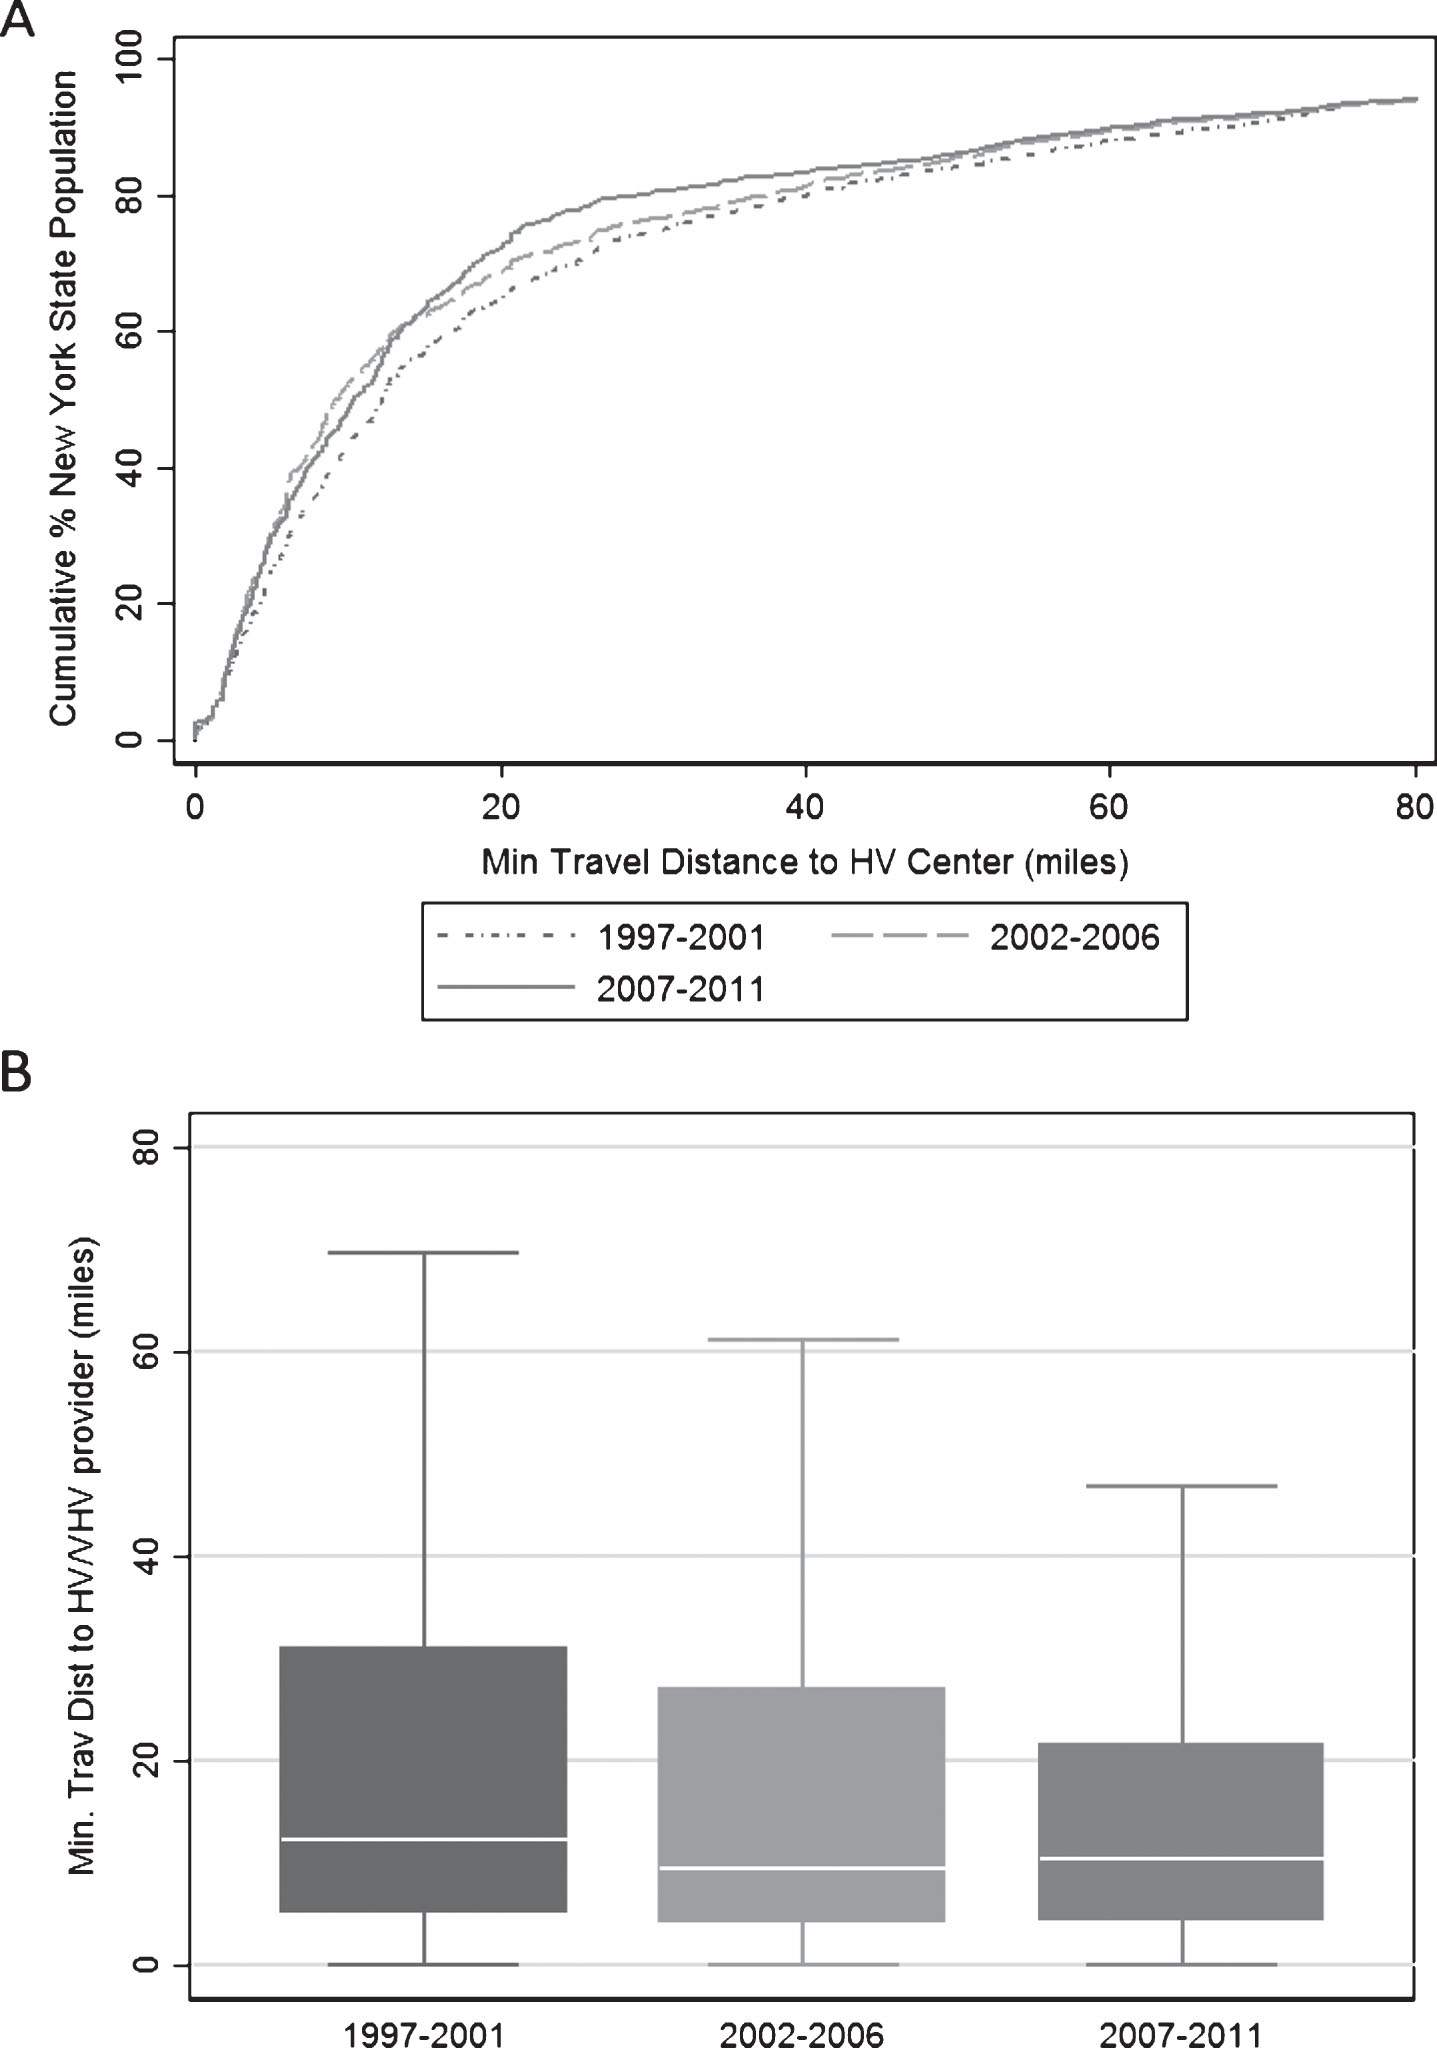
Fig.3
(A) Cumulative percent and (B) box plot distribution of the New York State population living near a HV/VHV center by minimum time needed to travel.
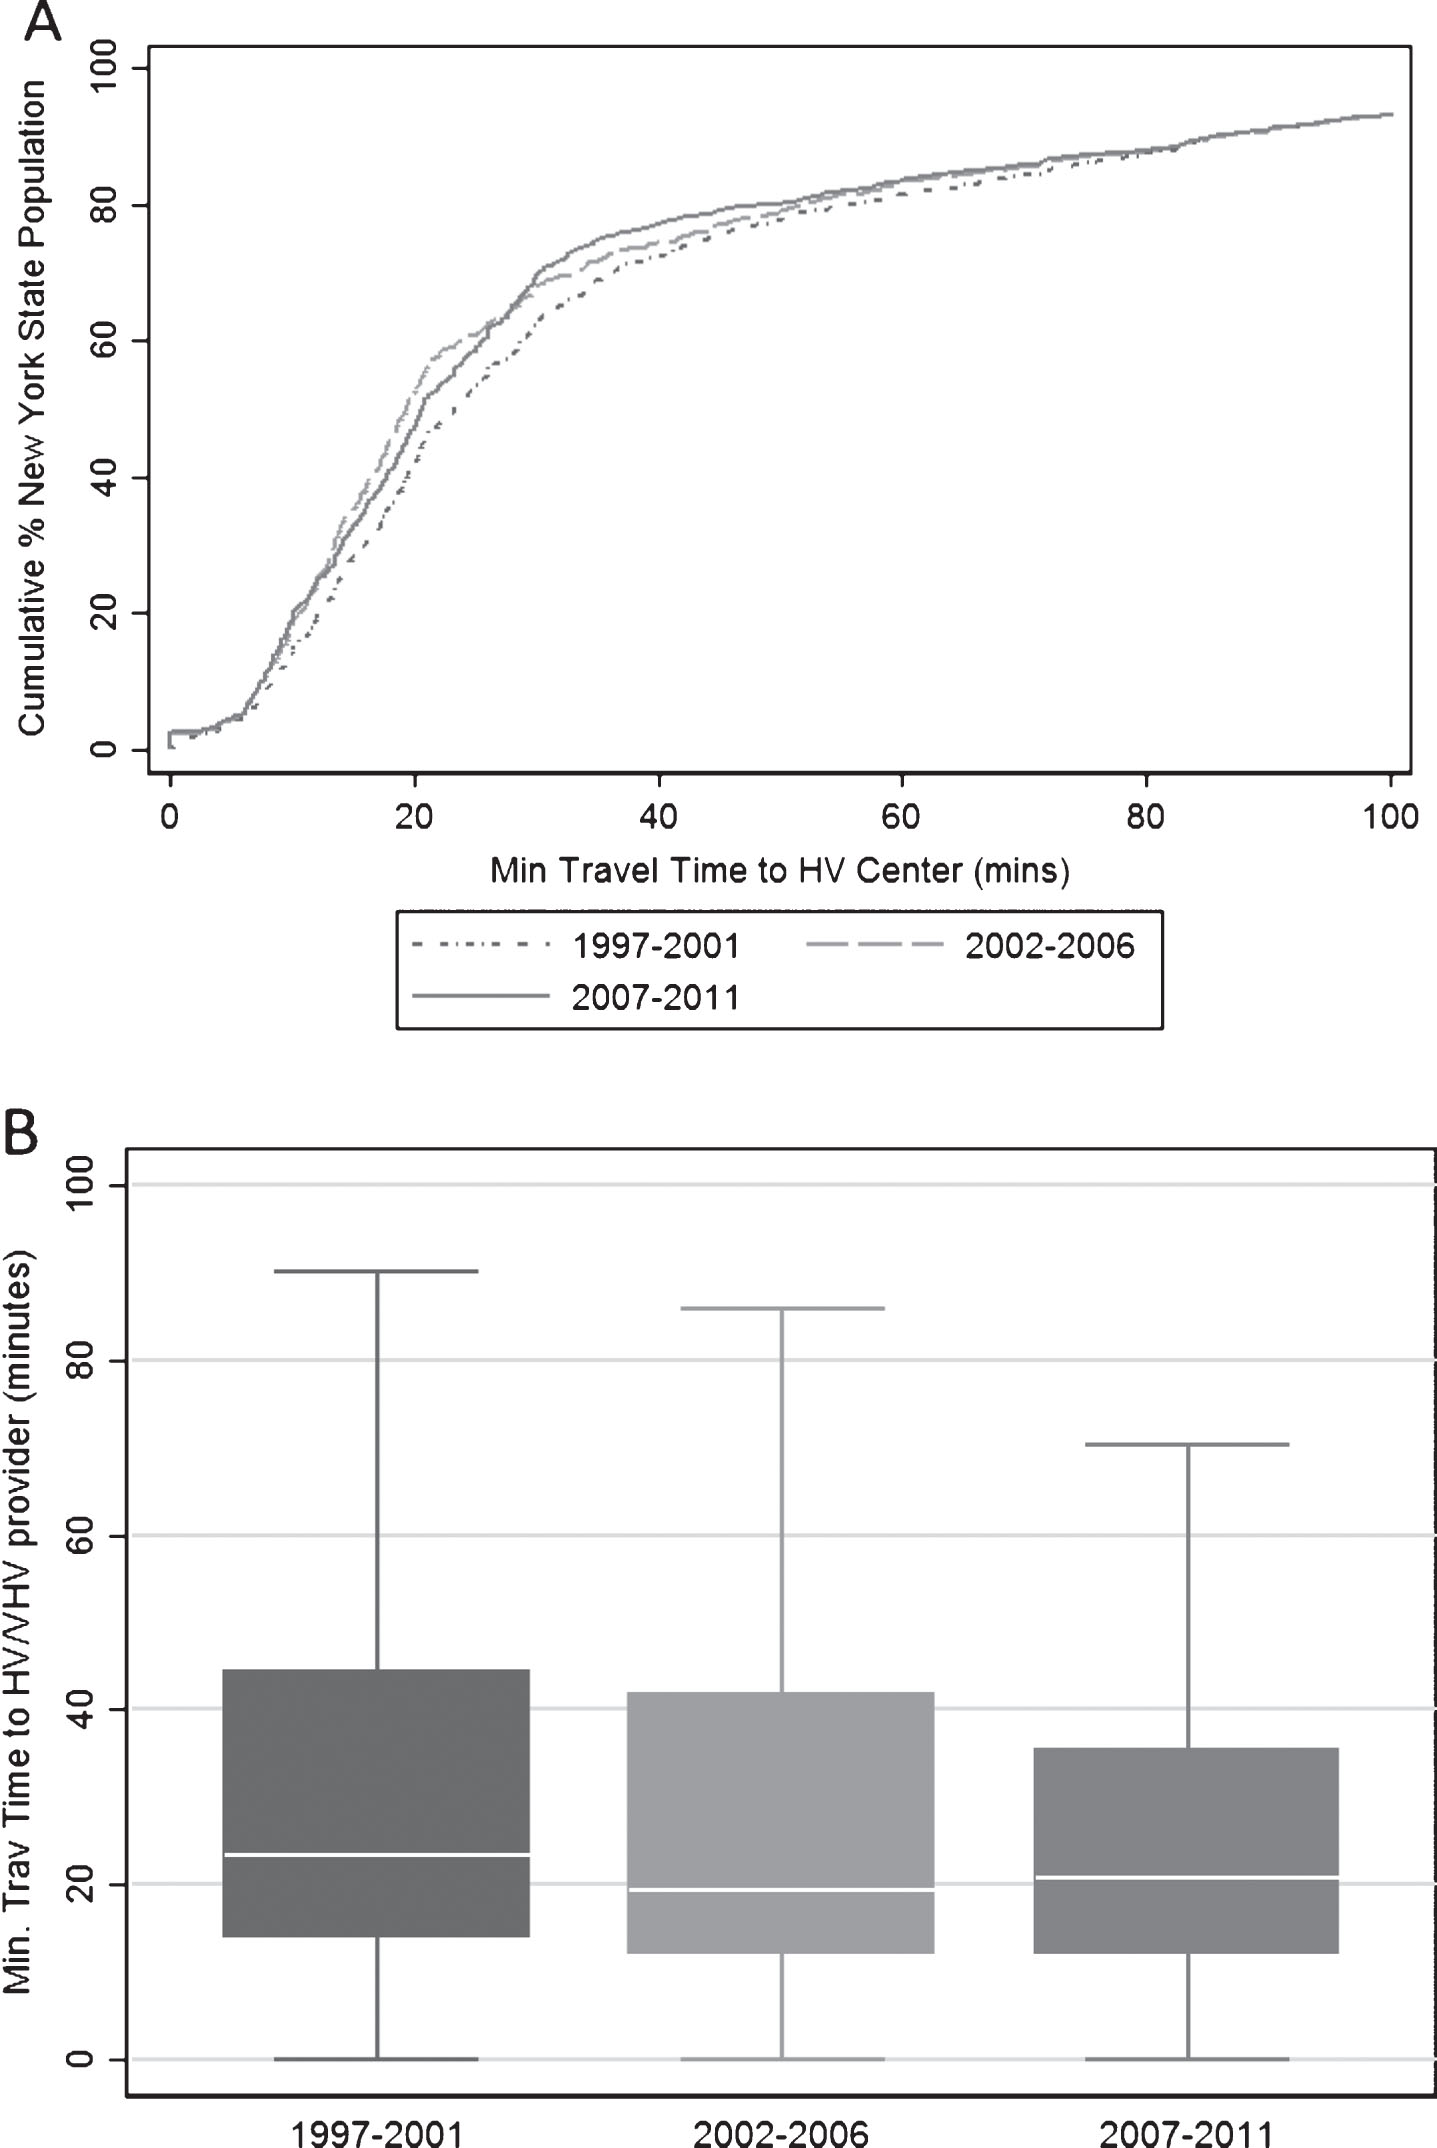
Table 1
Number of hospitals and cystectomies performed by volume status over time
| 1997–2001 | 2002–2006 | 2007–2011 | Total | ||
| Hospital Volume | N (%) | N (%) | N (%) | N (%) | |
| Cystectomy hospitals | Very low volume | 120 (65.2) | 111 (69.4) | 91 (70) | ––* |
| Low volume | 35 (19.0) | 21 (13.1) | 17 (13.1) | ––* | |
| Medium volume | 18 (9.8) | 14 (8.8) | 6 (4.6) | ––* | |
| High volume | 9 (4.9) | 12 (7.5) | 9 (6.9) | ––* | |
| Very high volume | 2 (1.1) | 2 (1.3) | 7 (5.4) | ––* | |
| Total | 184 (100) | 160 (100) | 130 (100) | ––* | |
| Cystectomies performed | Very low volume | 684 (21.5) | 523 (18.1) | 361 (11.8) | 1568 (17.2) |
| Low volume | 641 (20.1) | 396 (13.7) | 307 (10.1) | 1344 (14.7) | |
| Medium volume | 669 (21.0) | 500 (17.3) | 201 (6.6) | 1370 (15.0) | |
| High volume | 698 (21.9) | 907 (31.5) | 661 (21.7) | 2266 (24.8) | |
| Very high volume | 495 (15.5) | 558 (19.4) | 1520 (49.8) | 2573 (28.2) | |
| Total | 3187 (100) | 2884 (100) | 3050 (100) | 9121 (100) |
*Hospitals were allowed to reclassify their volume status across time periods, thus total number of hospitals in each volume grouping is not reported.
Table 2
Logistic regression analysis of utilization of VLV/LV and VLV providers by minimum travel distance to HV/VHV hospitals
| Minimum Travel Distance to HV/VHV Hospital§ | ||||
| LV or VLV Utilization | VLV Utilization | |||
| OR | 95% CI | OR | 95% CI | |
| 0–7.5 Miles | 1 | ref | 1 | ref |
| >7.5–21 Miles | 1.33 | (1.15,1.54) | 1.94 | (1.63,2.32) |
| >21 Miles | 2.17 | (1.81,2.60) | 2.47 | (1.99,3.06) |
§Regressions adjusted for age, gender, race, year of procedure, Charlson comorbidity score, source of admission, payer, annual surgeon volume, and Census variables measured at the level of the ZIP code including: median income per household, urban/rural status, % college educated, % houses that are owner occupied. All p-values≤0.002.


