
A Multi-Center International Study Assessing the Impact of Differences in Baseline Characteristics and Perioperative Care Following Radical Cystectomy
Abstract
Background: To identify potential avenues for quality improvement, we compared the variations in clinical practice and their association with perioperative morbidity and mortality following radical cystectomy (RC) for bladder cancer in the United States (US) and Japan.
Methods: We reviewed our retrospectively collected database of 2240 patients who underwent RC for bladder cancer at the University of Michigan (n = 1427) and in 21 Japanese institutions (n = 813) between 1997 and 2014. We performed a systematic comparison of clinical and perioperative factors and assessed predictors of perioperative morbidity and mortality. Death within 90 days of surgery was the primary outcome.
Results: There were apparent differences between the two study populations. Notably, US patients had a significantly greater BMI and higher ASA score. In Japanese institutions, median postoperative hospital stay was significantly higher (40 days vs. 7 days, p < 0.001) and 90-day readmission rates were significantly lower (0.6% vs. 26.8% , p < 0.001). There was a total of 1372/2240 (61.2%) patients with complications within 90 days and 66/2240 (2.9%) patient deaths. Significant predictors of 90-day mortality were older age (OR 1.04, CI 1.01–1.07), higher body mass index (OR 1.07, CI 1.02–1.12), node-positive disease (OR 3.14, CI 1.78–5.47), increased blood loss (OR 1.02, CI 1.01–1.03), and major (Clavien-grade 3 or greater) complication (OR 3.29, CI 1.88–5.71).
Conclusion: Despite major differences in baseline characteristics and care of cystectomy patients between the two study populations, peri-operative mortality rates proved to be comparable. This data supports an exploration of non-traditional factors that may influence mortality after cystectomy.
INTRODUCTION
Radical cystectomy (RC) is associated with high perioperative morbidity and mortality, ranging from 50–80% and 2–8% , respectively [1, 2]. Despite improvements in surgical techniques and advancements in anesthesia, these substantial perioperative risks are challenging in every country where the procedure is performed [3, 4]. While there have been numerous proposed approaches to improving perioperative care surrounding RC coming from multiple countries [5, 6], few studies have explored the diversity in clinical practice between countries to gain additional insights.
The United States (US) and Japan are two countries known to have broadly disparate practice patterns in managing patients undergoing RC. For example, data from The Organization for Economic Co-operation and Development (OECD) show that the US has the shortest hospital stay among OECD countries, whereas Japan has the longest [7]. Furthermore, charges for RC are three times higher in the US compared to Japan [8]. Although these differences are likely primarily driven by larger scale differences in healthcare systems, they provide a background for potential quality improvement in both countries.
The aim of the present study was to identify the key differences in clinical practice patterns for patients undergoing RC at a US institution compared to several Japanese institutions and to determine whether any can be linked to reduced perioperative morbidity and mortality.
MATERIALS AND METHODS
Patients
We performed a retrospective review of patients with bladder cancer who underwent RC, pelvic lymphadenectomy and urinary diversion at the University of Michigan Hospital System and 21 Japanese institutions, consisting of Hokkaido University Hospital and 20 affiliated institutions. In these 20 affiliated hospitals, all surgeries were performed under the supervision of Japanese Board Certified Urologists. Institutional review board approval was obtained and all analyses were performed using de-identified data. We identified 1450 consecutive patients who underwent RC without simultaneous nephroureterectomy at the US institution from January 1997 through April 2014 and 834 consecutive patients who underwent RC without simultaneous nephroureterectomy at the Japanese institutions from May 1997 through April 2010. Twenty-three patients (1.6%) from the US institution and twenty-one patients (2.5%) from the Japanese institutions were excluded because of incomplete data. In total, 1427 patients from the US institution and 813 patients from the Japanese institutions were considered for the final analyses. Ninety day follow-up was available for all patients.
The postoperative care at the US institution and Japanese institutions was performed as previously described and in accordance with institutional care pathways [1, 9]. This generally included perioperative subcutaneous low-molecular-weight heparin at the US institution from the time of surgery to hospital discharge, while prophylactic anticoagulation was not given at any of the Japanese institutions. Additionally, while urinary diversions in both countries included ileal conduits and continent diversions, some patients in Japan underwent cutaneous ureterostomy. This was generally reserved for older patients with a short life expectancy, patients with severe comorbidity, and/or those, with a low performance status. The extent of lymph node dissection was individually determined by each surgeon at all institutions included in this study.
Patient information, including age, sex, body mass index (BMI), American Society of Anesthesiologists (ASA) score, prior comorbidity (cerebrovascular comorbidity, pulmonary comorbidity, history of diabetes, history of hypertension, history of coronary artery disease), administration of neoadjuvant chemotherapy, pathological stage, urinary diversion type, estimated blood loss (EBL), and postoperative hospital stay were all recorded from patient charts. Pathologic staging was reported according to the current AJCC staging system (7th edition). The primary endpoint was death within 90 days of surgery, and complications within 90 days were assessed as a secondary endpoint. Each complication was graded in accordance with the modified Clavien-Dindo classification system and grouped into 11 categories as reported by Shabsigh et al. [10]. In cases of multiple complications, each one was individually counted when analyzing categories of complications.
Statistical analysis
For analysis of the primary and secondary endpoints, univariable and multivariable logistic regression using stepwise bidirectional variable selection were performed in order to assess how patient factors and practice patterns were associated with 90-day major morbidity (Clavien grade 3 or greater) and mortality. For the stopping rule, a p-value threshold of 0.20 was used, indicating that effects were entered into or removed from the model during a mixed step at p values below or above 0.20, respectively. Odds ratios are presented with the 95% CI. Medians and interquartile ranges (IQRs) were generated for continuously coded variables; frequencies and proportions were generated for categorical variables. The Mann-Whitney and Pearson’s χ2-test were used to assess differences in medians and proportions, respectively. Statistical analysis was performed using JMP ® software (SAS Institute, Cary, NC).
RESULTS
Patient characteristics
The characteristics of the 2240 patients are listed in Table 1. Of these patients, 1733 (77.4%) were male and 507 (22.6%) female, and the male to female ratio was similar between the two groups. The median (IQR) age was 68 (60–75) years and the median (IQR) BMI was 26.0 (22.9–29.7) kg/m2. There were a number of differences in baseline characteristics between the two groups, as the US cohort tended to be younger, have a greater BMI, and a higher ASA score, while the Japanese cohort tended to have more recorded comorbidities. Additionally, patients in the US more commonly received neoadjuvant chemotherapy (32.0% to 3.4% , p < 0.001) and underwent a robotic operative approach, whereas patients in Japan more commonly had T2 or greater disease at cystectomy (66.8% vs. 49.2% , p < 0.001). Ileal conduits represented about 60% of all diversion in both groups, while cutaneous ureterostomy was not performed at the US institution.
Within 90 days from cystectomy, there were 1372 patients (61.2%) experiencing any complication, 410 (18.4%) with major complications. There were 388 patients (17.3%) requiring readmission and 66 (2.9%) deaths within 90 days. The median (IQR) postoperative hospital stay was 7 (6–10) days in the US and 40 (30–55) days in Japan (p < 0.001), and 90-day readmission rates were significantly lower in Japan (0.6% vs. 26.8% , p < 0.001). In terms of surgical volume, the median (IQR) number of annual cystectomies per institution was 119 (103–177) in the US and 4 (3–6) in Japan (p < 0.001). Differences in clinical practice patterns between the US and JP are summarized in supplementary Table 1.
Perioperative morbidity
The unadjusted complication rates were higher in Japan for total complications (70.0% vs. 56.1% , p < 0.001) and major complications (23.4% vs. 15.6% , p < 0.001). Table 2 shows a summary of complication types and categories between the two groups. Across all patients, the most frequent morbidities were gastrointestinal (29.3%), infectious (24.0%), wound-related (14.4%), and genitourinary (12.3%). The most common major morbidities were genitourinary (24.7%), gastrointestinal (19.3%), infectious (18.1%), and wound-related (17.3%). All morbidities and major morbidities between the two groups were calculated and illustrated as a pie chart (Fig. 1a and 1b).
There were a number of differences in complication types between institutions. For complications of any grade, patients in the US more commonly had post-operative bleeding (3.5 vs. 0.5% , p < 0.001), cardiac (5.1 vs. 0.7% , p < 0.001), gastrointestinal (31.0 vs. 26.2% , p = 0.013), thromboembolic (4.7 vs. 0.3% , p < 0.001), and unclassified (8.5 vs. 1.7% , p < 0.001) complications. Patients in the Japanese cohort were more likely to have genitourinary (16.1 vs. 10.3% , p < 0.001), infectious (29.3 vs. 21.1% , p < 0.001), and wound-related (21.7 vs. 10.5% , p < 0.001) morbidities. Major morbidities occurring more frequently in the US cohort were infectious (24.2 vs. 10.0% , p < 0.001), thromboembolic (3.8 vs. 0.4% , p = 0.009), intraoperative such as bowel or vascular injury (5.7 vs. 1.3% , p = 0.006), and unclassified (11.5 vs. 0.8% , p < 0.001), whereas the Japanese institutions had more gastrointestinal (37.1 vs. 5.7% , p < 0.001) and wound related (23.3 vs. 12.7% , p = 0.001) major complications. Perioperative blood transfusion was more common in Japan (77 vs. 20% , p < 0.001), although transfusions in the Japanese cohort frequently were autologous (Supplementary Table 2).
Predictors of 90-d mortality
There were a total of 49 deaths within 90 days in the US cohort (3.4%) compared with 17 in the Japanese cohort (2.1% , p = 0.071). Table 3 gives the unadjusted and multivariable logistic regression analyses predicting 90-day mortality in this cohort. After stepwise modeling, age (OR 1.04 per year, 95% CI 1.01–1.07, p = 0.011), BMI (OR 1.07 per each kg/m2, 95% CI 1.02–1.12, p = 0.004), pathologic nodal stage (OR 3.14, 95% CI 1.78–5.47, p < 0.001), EBL (OR 1.02 per 100 ml, 95% CI 1.01–1.03, p = 0.006) and the occurrence of a major complication (OR 3.29, 95% CI 1.88–5.71, p < 0.001) were independent predictors of 90-day mortality. There was no significant difference in mortality rates between the US and Japanese cohorts after adjusting for relevant covariates. As an exploratory analysis, we also used a propensity score-matched approach (n = 459 each) with a caliper coefficient of 0.20. No significant difference in postoperative 90-d mortality was identified between the subset of US patients and their Japanese counterparts (p = 0.53). We also performed multivariable logistic regression with BMI as a binary variable (<30, 30+). The Odds Ratio (OR) for BMI (<30 kg/m2, 30+ kg/m2) was 2.67 (95% CI 1.51 – 4.68) and the other significant variables remained the same (Supplementary Table 3). Although we also included all the variables in the multivariable analysis that have a p-value < 0.2 on univariable analysis (Supplementary Table 4), the significant variables remained the same in the multivariable analyses.
In addition, we analyzed the differences in mortality rates among Japanese institutions. We categorized patients as having undergone surgery at high or low volume hospitals, using the median hospital cystectomy volume as the cut-point (4 cases). Although there was an apparent lower mortality rate in higher volume facilities (3.1% vs. 1.8%), the difference was not significant (p = 0.31).
Predictors of 90-d major (grade 3–5) morbidity
Next, we examined factors associated withmajor perioperative complications in this patient population. The results of the univariable andmultivariable logistic regression analyses are given in Table 4 and indicate that BMI (OR 1.04, 95% CI 1.02–1.07, p < 0.001), ASA score (OR 1.35, 95% CI 1.02–1.80, p = 0.037), number of comorbidities (OR 1.33, 95% CI 1.04–1.69, p = 0.022), form ofurinary diversion (p = 0.001), EBL (OR 1.02, 95% CI 1.01–1.03, p < 0.001) and treatment at the USinstitution (OR 0.47, 95% CI 0.34–0.65, p < 0.001) were independent predictors of 90-day majorcomplications. We also assessed multivariablemodels which included all variables having ap-value < 0.2 on univariable analysis (Supplementary Table 5), and the significant variables remained unchanged.
DISCUSSION
Given the complex nature of caring for patients who undergo RC, the present study sought to capitalize on the wide variation in care between a US institution and several Japanese institutions in order to determine whether differences in clinical practices may lead to differences in 90-day morbidity and mortality. While substantial differences in patient characteristics and perioperative management were identified, the primary outcome of 90-day mortality proved to be comparable between two countries. To the best of our knowledge, this is the first study comparing the perioperative characteristics and outcomes between institutions in the US and Japan following RC for bladder cancer.
There were a number of fundamental differences in the approach to patients undergoing RC that were identified in this study. Most notably, there were large discrepancies in the length of hospital stay, with a median length of hospital stay of 7 days in the US compared to 40 days in Japan. The question of whether a much longer hospital stay may be protective against perioperative morbidity and mortality has generally remained unanswered and is particularly relevant as enhanced recovery after surgery protocols are being rapidly implemented in the US and Europe in order to expedite post-operative recovery [5]. Conversely, it is the custom in Japan that patients remain in the hospital until all catheters and drains have been removed, as has been observed elsewhere [11]. While this practice in Japan may be driven by both patients and providers as well as by the nature of the health care systems, the substantially longer hospital stay after RC did not appear to provide any benefit in terms of reducing complications or deaths following surgery. However, patients in the Japanese cohort were significantly less likely to require readmission. This is particularly relevant as cystectomy has one of the highest readmission rates of any major surgery, indicating perhaps that longer hospital-based or equivalent outpatient care may be warranted in the US in order to avoid readmission and its burden on patients and health systems [12].
We also found that the use of neoadjuvant chemotherapy was significantly higher in the US compared to Japan (32.0% and 3.4% , respectively) and may be reflected in the higher rate of pT2 disease at cystectomy in the Japanese cohort (49.2% vs. 66.8%). The pT0 rate was also significantly higher in the US compared to Japan (17.2% and 9.0% , respectively). Although the infrequent administration of neoadjuvant chemotherapy at Japanese institutions is comparable to many published series [13, 14], this finding raises important concerns regarding the underutilization of neoadjuvant chemotherapy. While there have previously been concerns that neoadjuvant chemotherapy could increase the risk of perioperative complications [15], we found no such correlation in this study. The results of the present study suggest that increasing the administration of neoadjuvant chemotherapy in Japan, and potentially at the US institution as well, may be a key opportunity for quality improvement.
There were also notable differences in baseline characteristics between the two study populations that are worthy of mention. Patients in the US tended to have a greater BMI (median 28.1 kg/m2 compared to 23 kg/m2) and higher ASA score (51.2% categorized as ASA I or II in the US compared to 92.7% in Japan). This could reflect differences in the general health of the populations and/or selection of candidates for RC. The US population is known to have the highest BMI of high-income countries [16], and mean BMI in the USA (28.5 kg/m2 for male and 28.3 kg/m2 for female) is substantially higher than that in Japan (23.5 kg/m2 for male and 21.9 kg/m2 for female).
Despite these significant differences, the 90-day mortality rates between cohorts were similar and compatible with previous reports [1, 2]. As anticipated, age, nodal metastasis, EBL, and the occurrence of a major complication were all associated with 90-day mortality in this unique patient set [14, 17, 18]. Interestingly, we also found BMI to be an important predictor of 90-day mortality. While some institutes previously reported an association between BMI and morbidity (both low and high grade) after RC [3, 15], no direct association with perioperative mortality was reported. Additionally, very low BMI is also a strong predictor of 90-day mortality [19].
While there were some observed differences in the overall rate of post-operative complications in the two cohorts, perhaps the most salient findings from this study arise from a comparison of the types of complications that occurred. For example, clostridium difficile infections were far more common in the US, while Japanese institutions had a considerably larger number of patients who suffered from high grade ileus. The latter may be explained by the relatively common placement of a transnasal ileus tube extending into the distal small bowel, performed under radiologic guidance in patients with moderate to severe nausea/emesis or abdominal distention [20]. Additionally, the higher EBL and rate of major complications in the Japanese cohort could directly affect the postoperative ileus rates, as previously reported [21].
In assessing predictors of 90-day major complications, we identified obesity (BMI), comorbidity (ASA and number of comorbidities), form of urinary diversion, EBL, and treatment location as significant factors. These specific findings are in line with prior reports and demonstrate that these key predictors are robust across a highly diverse set of patients managed by very distinct care pathways [22–24]. While some factors, such as diversion type, are likely simply markers of patient age and comorbidity (i.e. confounding by indication), factors such as BMI and comorbidity are likely to be causal in nature. Additionally, the decreased probability of major complications observed in the US cohort may be primarily related to differences in hospital volume [24]. This did not translate into significant differences in perioperative mortality between the two groups, however, implying that the ability to rescue patients from these complications was comparable [25].
It is also important to note the substantially higher rate of thromboembolic complications in the US in this study (4.7% vs. 0.3%). This is particularly notable in light of the standard use of perioperative subcutaneous heparin during most of the study period in the US but not in Japan. While contemporary RC series demonstrate that the incidence ranges from 2.9% to7.4% in the US [26, 27], Japanese cohorts have previously been shown to have low rates of thromboembolic events, ranging from 0.3% to 0.5% [1, 28]. Similarly, the annual incidence of venous thromboembolism in the US is estimated at 70 to 120 events per 100,000 people compared to 16 to 17 events per 100,000 persons in Asia [29, 30]. Interestingly, Singhal et al. recently reported that Asians and Caucasians demonstrate different hemostatic responses to surgery, at least in part due to differences in baseline levels of clotting factors [30]. While we are unable to tease out the factors behind the discrepancy in thromboembolic complications observed here, these data suggest that baseline risk likely drive the occurrence of thromboembolic events to a much greater extent than perioperative prophylactic measures.
The present study has important limitations that must be considered. Given the retrospective design, we were unable to identify or control for the variations in clinical pathways and postoperative monitoring resulting from the heterogeneous clinical pathways among the Japanese institutes, as well as potential differences in data acquisition. Complications may be charted more completely in Japan as patients are in the hospital for a much longer period compared to the US. Perioperative standards, including surgical approaches, were not equally distributed between the two countries during the study period, and there were significant differences in patient baseline characteristics. Unfortunately, some important information relevant to morbidity and mortality was not available for analysis in our current study, including length of antibiotic use, time to oral diet, length of surgery, frailty score, and discharge disposition. In addition, there were significant differences in surgical volume between the US and Japanese institutions, which may explain some important differences in post-operative outcomes. Last, a single high volume center in the US was compared with 21 centers in Hokkaido. Including other lower volume US centers could result in different baseline and surgical characteristics and offer additional insights into differences in practice patterns between the US and Japan. However, we believe that our cohort includes representative patient populations from all of the participating institutions, facilitating the unique findings identified here. We believe that these data present a meaningful opportunity for continued quality improvement leveraging international differences in patterns of care.
We identified considerable differences in the management of patients undergoing RC in the US compared to Japan, most notably the administration of neoadjuvant chemotherapy, surgical approach, and length of hospital stay. Despite these differences in patient care as well as the marked differences in baseline characteristics between the two groups, post-operative mortality rates were similar. This suggests that efforts to further drive down peri-operative mortality following this complex procedure will require new and innovative management approaches.
CONFLICT OF INTEREST
Brent K. Hollenbeck serves as an advisory role to Elsevier as associate editor of Urology; Brent K. Hollenbeck received a research funding from National Cancer Institute, National Institute on Aging, American cancer society.
Takahiro Osawa, Cheryl T. Lee, Takashige Abe, Norikata Takada, Khaled S. Hafez, Jeffrey S. Montgomery, Alon Z. Weizer, Ted A. Skolarus, Sachiyo Murai, Nobuo Shinohara, Todd M. Morgan have no conflicts of interest.
ACKNOWLEDGMENTS
The authors thank Heather Crossley, Amy Gursky, Akira Kumagai, Ataru Sazawa, Gaku Mouri, Haruo Seki, Hidenori Katano, Hiroshi Sano, Hiroyuki Matsuda, Ichiro Takeuchi, Junji Ishizaki, Junri Shindo, Katsuki Miura, Katsuya Nonomura, Kazushi Hirakawa, Keiji Sugishita, Keita Minami, Ken Morita, Kimiyoshi Mitsuhashi, Kinya Matsumura, Kouichi Kanagawa, Kunihiko Tsuchiya, Manabu Kitahara, Masaki Togashi, Masami Nantani, Masashi Murakumo, Naoto Miyajima, Ryuji Matsumoto, Satoru Maruyama, Satoshi Nagamori, Shigeo Sakashita, Shin Suzuki, Shinji Kamota, Soshu Sato, Takanori Sakuta, Takanori Yamashita, Takaya Hioka, Takenori Ono, Takeshi Shibata, Takuya Sato, Tango Mochizuki, Tatsuo Kaneda, Tatsuya Mori, Tomoshige Akino, Toru Harabayashi, Toshiki Aoyagi, Toshimori Seki, Yuichiro Shinno, Yukiko Kanno, and Yutaka Toyoda for data collection.
Appendices
The supplementary information is available in the electronic version of this article: http://dx.doi.org/10.3233/BLC-150043.
REFERENCES
[1] | Takada N , Abe T , Shinohara N , Sazawa A , Maruyama S , Shinno Y , et al . Peri-operative morbidity and mortality related to radical cystectomy: A multi-institutional retrospective study in Japan. BJU international (2012) ;110: (11 Pt B):756–764. |
[2] | Yuh BE , Nazmy M , Ruel NH , Jankowski JT , Menchaca AR , Torrey RR , et al . Standardized analysis of frequency and severity of complications after robot-assisted radical cystectomy. European Urology (2012) ;62: (5):806–813. |
[3] | Gandaglia G , Varda B , Sood A , Pucheril D , Konijeti R , Sammon JD , et al . Short-term perioperative outcomes of patients treated with radical cystectomy for bladder cancer included in the National Surgical Quality Improvement Program (NSQIP) database. Canadian Urological Association Journal=Journal de l’Association des Urologues du Canada (2014) ;8: (9-10):E681–E687. |
[4] | Richards KA , Steinberg GD . Perioperative outcomes in radical cystectomy: How to reduce morbidity? Current Opinion in Urology ((2013) ;23: (5):456–465. |
[5] | Djaladat H , Daneshmand S . Enhanced recovery pathway following radical cystectomy. Current Opinion in Urology (2014) ;24: (2):135–139. |
[6] | Patel HR , Cerantola Y , Valerio M , Persson B , Jichlinski P , Ljungqvist O , et al . Enhanced recovery after surgery: Are we ready, and can we afford not to implement these pathways for patients undergoing radical cystectomy? European Urology ((2014) ;65: (2):263–266. |
[7] | Hashimoto H , Ikegami N , Shibuya K , Izumida N , Noguchi H , Yasunaga H , et al . Cost containment and quality of care in Japan: Is there a trade-off? Lancet (2011) ;378: (9797):1174–1182. |
[8] | Sugihara T , Yasunaga H , Horiguchi H , Fushimi K , Dalton JE , Schold J , et al . Performance comparisons in major uro-oncological surgeries between the USA and Japan. International Journal Of Urology: Official Journal of the Japanese Urological Association (2014) ;21: (11):1145–1150. |
[9] | Styn NR , Montgomery JS , Wood DP , Hafez KS , Lee CT , Tallman C , et al . Matched comparison of robotic-assisted and open radical cystectomy. Urology (2012) ;79: (6):1303–1308. |
[10] | Shabsigh A , Korets R , Vora KC , Brooks CM , Cronin AM , Savage C , et al . Defining early morbidity of radical cystectomy for patients with bladder cancer using a standardized reporting methodology. European Urology (2009) ;55: (1):164–174. |
[11] | Karl A , Buchner A , Becker A , Staehler M , Seitz M , Khoder W , et al . A new concept for early recovery after surgery for patients undergoing radical cystectomy for bladder cancer: Results of a prospective randomized study. The Journal of Urology (2014) ;191: (2):335–340. |
[12] | Skolarus TA , Jacobs BL , Schroeck FR , He C , Helfand AM , Helm J , et al . Understanding Readmission Intensity After Radical Cystectomy. The Journal of Urology (2014) . |
[13] | Yafi FA , Aprikian AG , Chin JL , Fradet Y , Izawa J , Estey E , et al . Contemporary outcomes of 2287 patients with bladder cancer who were treated with radical cystectomy: A Canadian multicentre experience. BJU International (2011) ;108: (4):539–545. |
[14] | Aziz A , May M , Burger M , Palisaar RJ , Trinh QD , Fritsche HM , et al . Prediction of 90-day mortality after radical cystectomy for bladder cancer in a prospective European multicenter cohort. European Urology (2014) ;66: (1):156–163. |
[15] | Johar RS , Hayn MH , Stegemann AP , Ahmed K , Agarwal P , Balbay MD , et al . Complications after robot-assisted radical cystectomy: Results from the International Robotic Cystectomy Consortium. European Urology (2013) ;64: (1):52–57. |
[16] | Finucane MM , Stevens GA , Cowan MJ , Danaei G , Lin JK , Paciorek CJ , et al . National, regional, and global trends in body-mass index since 1980: Systematic analysis of health examination surveys and epidemiological studies with 960 country-years and 9.1 million participants. Lancet (2011) ;377: (9765):557–567. |
[17] | Isbarn H , Jeldres C , Zini L , Perrotte P , Baillargeon-Gagne S , Capitanio U , et al . A population based assessment of perioperative mortality after cystectomy for bladder cancer. The Journal of Urology (2009) ;182: (1):70–77. |
[18] | Morgan TM , Barocas DA , Chang SS , Phillips SE , Salem S , Clark PE , et al . The relationship between perioperative blood transfusion and overall mortality in patients undergoing radical cystectomy for bladder cancer. Urologic Oncology (2013) ;31: (6):871–877. |
[19] | Gregg JR , Cookson MS , Phillips S , Salem S , Chang SS , Clark PE , et al . Effect of preoperative nutritional deficiency on mortality after radical cystectomy for bladder cancer. The Journal of Urology (2011) ;185: (1):90–96. |
[20] | Chen XL , Ji F , Lin Q , Chen YP , Lin JJ , Ye F , et al . A prospective randomized trial of transnasal ileus tube vs nasogastric tube for adhesive small bowel obstruction. World J Gastroenterol (2012) ;18: (16):1968–1974. |
[21] | Chang SS , Cookson MS , Baumgartner RG , Wells N , Smith JA Jr . Analysis of early complications after radical cystectomy: Results of a collaborative care pathway. The Journal of Urology (2002) ;167: (5):2012–2016. |
[22] | Schiavina R , Borghesi M , Guidi M , Vagnoni V , Zukerman Z , Pultrone C , et al . Perioperative complications and mortality after radical cystectomy when using a standardized reporting methodology. Clinical Genitourinary Cancer (2013) ;11: (2):189–197. |
[23] | Hollenbeck BK , Miller DC , Taub D , Dunn RL , Khuri SF , Henderson WG , et al . Identifying Risk Factors for Potentially Avoidable Complications Following Radical Cystectomy. The Journal of Urology (2005) ;174: (4):1231–1237. |
[24] | Elting LS , Pettaway C , Bekele BN , Grossman HB , Cooksley C , Avritscher EB , et al . Correlation between annual volume of cystectomy, professional staffing, and outcomes: A statewide, population-based study. Cancer (2005) ;104: (5):975–984. |
[25] | Ghaferi AA , Birkmeyer JD , Dimick JB . Hospital volume and failure to rescue with high-risk surgery. Med Care (2011) ;49: (12):1076–1081. |
[26] | Svatek RS , Fisher MB , Matin SF , Kamat AM , Grossman HB , Nogueras-Gonzalez GM , et al . Risk factor analysis in a contemporary cystectomy cohort using standardized reporting methodology and adverse event criteria. The Journal of Urology (2010) ;183: (3):929–934. |
[27] | Sun AJ , Djaladat H , Schuckman A , Miranda G , Cai J , Daneshmand S . Venous thromboembolism following radical cystectomy: Significant predictors, comparison of different anticoagulants and timing of events. The Journal of Urology (2015) ;193: (2):565–569. |
[28] | Iwai A , Koga F , Fujii Y , Masuda H , Saito K , Numao N , et al . Perioperative complications of radical cystectomy after induction chemoradiotherapy in bladder-sparing protocol against muscle-invasive bladder cancer: A single institutional retrospective comparative study with primary radical cystectomy. Jpn J Clin Oncol (2011) ;41: (12):1373–1379. |
[29] | White RH . The epidemiology of venous thromboembolism. Circulation (2003) ;107: (23 Suppl 1):I4–I8. |
[30] | Singhal D , Smorodinsky E , Guo L . Differences in coagulation among Asians and Caucasians and the implication for reconstructive microsurgery. J Reconstr Microsurg (2011) ;27: (1):57–62. |
Figures and Tables
Fig.1
Pie chart showing breakdown of total (a) and major (b) complications in the US institution (inside) and Japanese institutions(outside).
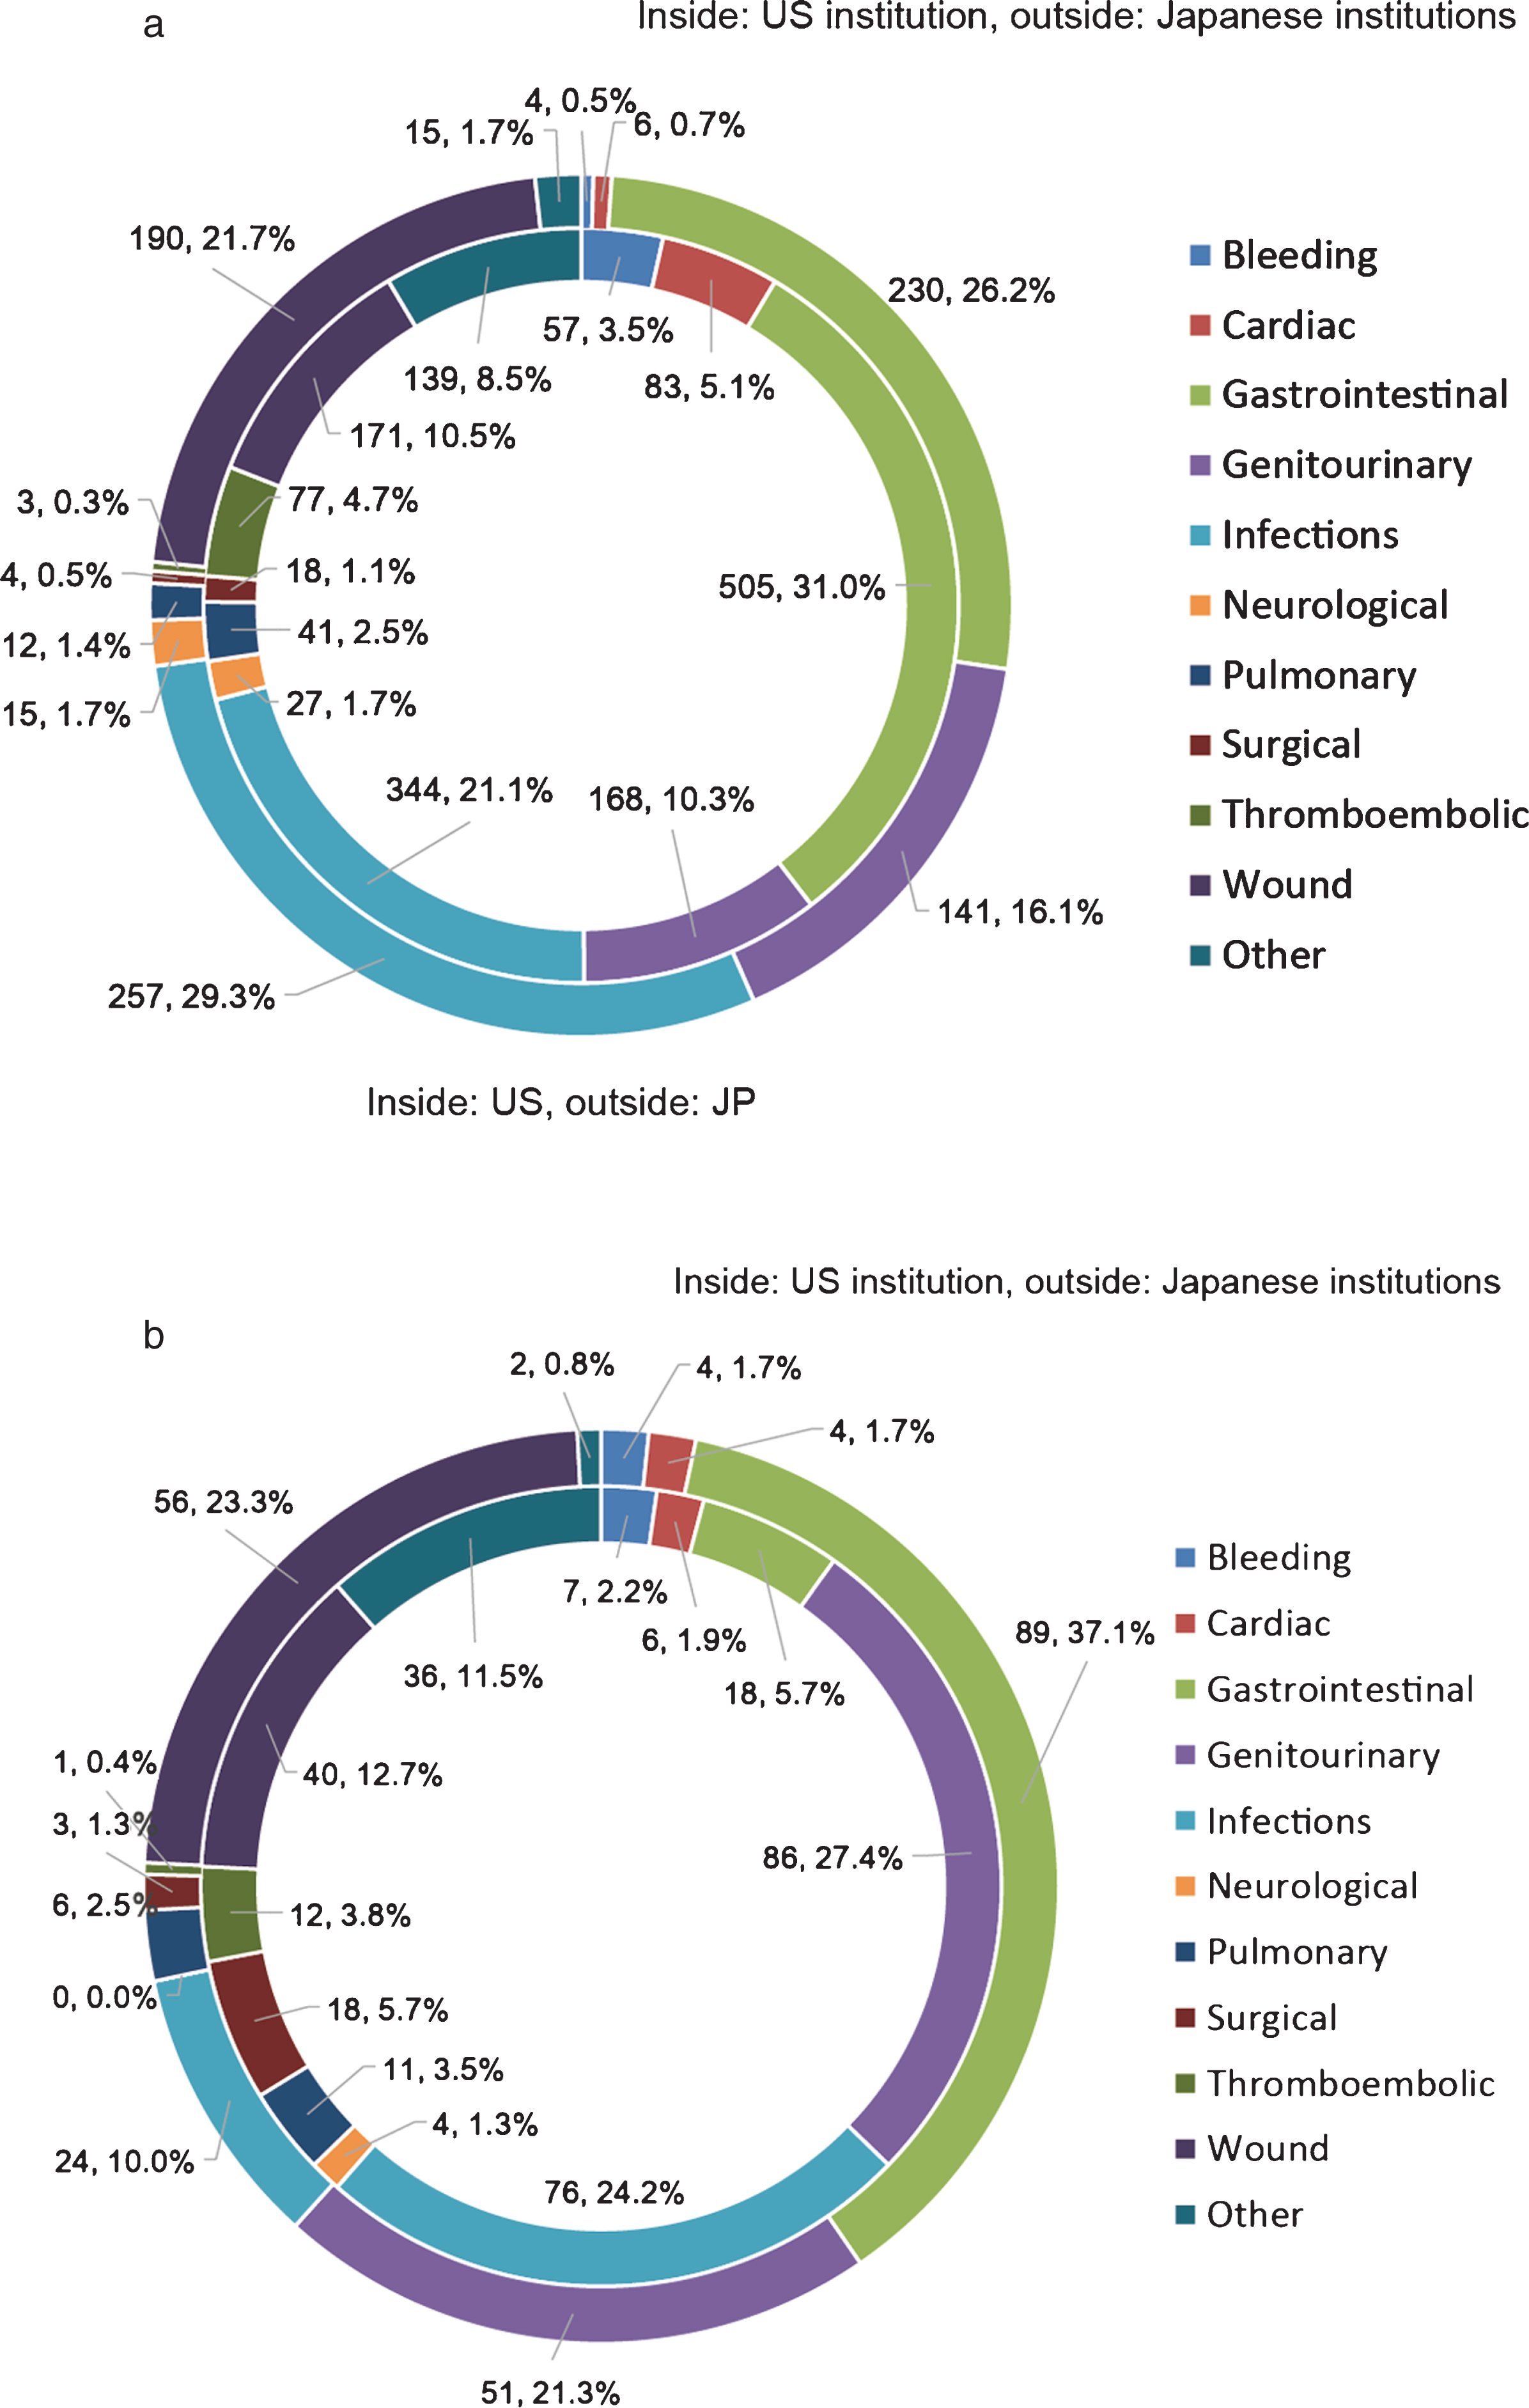
Table 1
Comparison of clinical characteristics in the US institution (n = 1427) and Japanese institutions (n = 813)
| Total | US institution | Japanese institutions | p value | |
| Sex, n (%) | ||||
| Male | 1733 (77.4%) | 1107 (77.6%) | 626 (77.0%) | 0.754 |
| Female | 507 (22.6%) | 320 (22.4%) | 187 (23.0%) | |
| Median age (IQR) | 68 (60–75) | 67 (59–74) | 71 (62–76) | <0.001 |
| BMI, kg/m2 (n = 2213) | ||||
| Median (IQR) | 26.0 (22.9–29.7) | 28.1 (25.0–31.6) | 23 (20.8–25.2) | <0.001 |
| No. ASA score, n (%) (n = 2158) | ||||
| I–II | 1414 (65.5%) | 724 (51.2%) | 690 (92.7%) | <0.001 |
| III–IV | 744 (34.5%) | 690 (48.8%) | 54 (7.3%) | |
| Number of comorbidities, n (%) | ||||
| 0–1 | 1539 (68.7%) | 1045 (73.2%) | 494 (60.8%) | <0.001 |
| 2–5 | 701 (31.3%) | 382 (26.8%) | 319 (39.2%) | |
| Neoadjuvant chemotherapy, n (%) | ||||
| Yes | 484 (21.6%) | 456 (32.0%) | 28 (3.4%) | <0.001 |
| No | 1756 (78.4%) | 971 (68.0%) | 785 (96.6%) | |
| Pathologic T stage, n (%) (n = 2236) | ||||
| ≦T1 | 993 (44.4%) | 724 (50.8%) | 269 (33.2%) | <0.001 |
| ≧T2 | 1243 (55.6%) | 702 (49.2%) | 541 (66.8%) | |
| Pathologic N stage, n (%) (n = 2083) | ||||
| Positive | 389 (18.7%) | 250 (18.8%) | 139 (18.5%) | 0.849 |
| Negative | 1694 (81.3%) | 1080 (81.2%) | 614 (81.5%) | |
| Surgical approach, n (%) | ||||
| Open | 2084 (93.0%) | 1271 (89.1%) | 813 (100%) | <0.001 |
| Robot-assisted | 156 (7.0%) | 156 (10.9%) | – | |
| Form of urinary diversion, n (%) | ||||
| Continent | 714 (31.9%) | 553 (38.8%) | 161 (19.8%) | <0.001 |
| Ileal conduit | 1336 (59.6%) | 869 (60.8%) | 467 (57.4%) | |
| Cutaneous ureterostomy | 178 (8.0%) | – | 178 (21.9%) | |
| No diversion | 12 (0.5%) | 5 (0.4%) | 7 (0.9%) | |
| EBL, mL (n = 2224) | ||||
| Median (IQR) | 750 (400–1300) | 550 (350–900) | 1298 (800–1964) | <0.001 |
| Postoperative hospital stay, days | ||||
| Median (IQR) | 11 (7–33) | 7 (6–10) | 40 (30–55) | <0.001 |
| Hospital volume, RC/yr, median (IQR) | 119 (103–177) | 4 (3–6) | <0.001 | |
| 90 day complication, n (%) | ||||
| Yes | 1372 (61.2%) | 801 (56.1%) | 571 (70.0%) | <0.001 |
| No | 868 (38.8%) | 626 (43.9%) | 242 (30.0%) | |
| 90 day major complication, n (%) (n = 2227) | ||||
| Yes | 410 (18.4%) | 223 (15.6%) | 187 (23.4%) | <0.001 |
| No | 1817 (81.6%) | 1204 (84.4%) | 613 (76.6%) | |
| 90 day readmission, n (%) | ||||
| Yes | 388 (17.3%) | 383 (26.8%) | 5 (0.600%) | <0.001 |
| No | 1852 (82.7%) | 1044 (73.2%) | 808 (99.4%) | |
| 90 day mortality, n (%) | ||||
| Yes | 66 (2.9%) | 49 (3.4%) | 17 (2.1%) | 0.071 |
| No | 2174 (97.1%) | 1378 (96.6%) | 796 (97.9%) | |
Continuous data: Mann–Whitney U-test. Categorical data: Pearson’s χ2-test.
Table 2
Summary of all complication types in the US institution and Japanese institutions
| Complications | All complications | Major complications Clavien-Dindo grade≧3 | ||||||
| Total, n (%) | US institution n (%) | Japanese institutions, n (%) | p value | Total, n (%) | US institution n (%) | Japanese institutions, n (%) | p value | |
| Bleeding | 61 (2.4) | 57 (3.5) | 4 (0.5) | <0.001 | 11 (2.0) | 7 (2.2) | 4 (1.7) | 0.638 |
| Anemia requiring transfusion | 59 | 56 | 3 | 9 | 6 | 3 | ||
| postoperative bleed other than GI | 2 | 1 | 1 | 2 | 1 | 1 | ||
| Cardiac | 89 (3.6) | 83 (5.1) | 6 (0.7) | <0.001 | 10 (1.8) | 6 (1.9) | 4 (1.7) | 0.831 |
| Arrhythmia | 44 | 42 | 2 | 3 | 2 | 1 | ||
| Congestive Heart Failure | 6 | 4 | 2 | 2 | – | 2 | ||
| Myocardial infarction | 13 | 11 | 2 | 5 | 4 | 1 | ||
| Other | 26 | 26 | – | – | – | – | ||
| Gastrointestinal | 735 (29.3) | 505 (31.0) | 230 (26.2) | 0.013 | 107 (19.3) | 18 (5.7) | 89 (37.1) | <0.001 |
| Anastomotic bowel leak | 19 | 5 | 14 | 12 | 5 | 7 | ||
| Clostridium difficile colitis | 109 | 96 | 13 | 2 | 1 | 1 | ||
| Gastrointestinal bleeding | 24 | 16 | 8 | 6 | 3 | 3 | ||
| Ileus | 524 | 338 | 186 | 80 | 4 | 76 | ||
| Other | 59 | 50 | 9 | 7 | 5 | 2 | ||
| Genitourinary | 309 (12.3) | 168 (10.3) | 141 (16.1) | <0.001 | 137 (24.7) | 86 (27.4) | 51 (21.3) | 0.010 |
| Renal failure/insufficiency | 63 | 59 | 4 | 15 | 14 | 1 | ||
| Stomal ischemia | 7 | 2 | 5 | 6 | 1 | 5 | ||
| Stomal stenosis | 2 | 1 | 1 | 1 | – | 1 | ||
| Ureteral obstruction | 125 | 32 | 93 | 55 | 29 | 26 | ||
| Urinary fistula | 18 | 15 | 3 | 14 | 12 | 2 | ||
| Urinary leak | 82 | 48 | 34 | 41 | 26 | 15 | ||
| Other | 12 | 11 | 1 | 5 | 4 | 1 | ||
| Infections | 601 (24.0) | 344 (21.1) | 257 (29.3) | <0.001 | 100 (18.1) | 76 (24.2) | 24 (10.0) | <0.001 |
| Abscess | 54 | 51 | 3 | 46 | 44 | 2 | ||
| FUO | 28 | 3 | 25 | – | – | – | ||
| Sepsis | 97 | 87 | 10 | 26 | 21 | 5 | ||
| UTI | 377 | 196 | 181 | 22 | 9 | 13 | ||
| Other | 45 | 7 | 38 | 6 | 2 | 4 | ||
| Neurological | 42 (1.7) | 27 (1.7) | 15 (1.7) | 0.920 | 4 (0.7) | 4 (1.3) | 0 (0) | 0.079 |
| CVA/TIA | 15 | 9 | 6 | 4 | 4 | – | ||
| Delirium/Agitation | 16 | 11 | 5 | – | – | – | ||
| Peripheral neuropathy | 7 | 5 | 2 | – | – | – | ||
| Other | 4 | 2 | 2 | – | – | – | ||
| Pulmonary | 53 (2.1) | 41 (2.5) | 12 (1.4) | 0.057 | 17 (3.1) | 11 (3.5) | 6 (2.5) | 0.498 |
| Aspiration pneumonia | 32 | 26 | 6 | 3 | 1 | 2 | ||
| Pleural effusion | 3 | 2 | 1 | 2 | 1 | 1 | ||
| Respiratory distress | 13 | 10 | 3 | 9 | 6 | 3 | ||
| Other | 5 | 3 | 2 | 3 | 3 | – | ||
| Intraoperative | 22 (0.9) | 18 (1.1) | 4 (0.5) | 0.097 | 21 (3.8) | 18 (5.7) | 3 (1.3) | 0.006 |
| Bowel injury | 14 | 11 | 3 | 13 | 11 | 2 | ||
| Vascular injury | 3 | 3 | – | 3 | 3 | – | ||
| Other | 5 | 4 | 1 | 5 | 4 | 1 | ||
| Thromboembolic | 80 (3.2) | 77 (4.7) | 3 (0.3) | <0.001 | 13 (2.3) | 12 (3.8) | 1 (0.4) | 0.009 |
| Deep venous thrombosis | 58 | 57 | 1 | 6 | 6 | – | ||
| Pulmonary embolism | 22 | 20 | 2 | 7 | 6 | 1 | ||
| Wound | 361 (14.4) | 171 (10.5) | 190 (21.7) | <0.001 | 96 (17.3) | 40 (12.7) | 56 (23.3) | 0.001 |
| Facial dehiscence/evisceration | 5 | 4 | 1 | 4 | 3 | 1 | ||
| Incisional hernia | 3 | – | 3 | 1 | 1 | – | ||
| Wound dehiscence | 60 | 33 | 27 | 37 | 19 | 18 | ||
| Wound infection | 287 | 128 | 159 | 52 | 17 | 35 | ||
| Other | 6 | 6 | – | 2 | – | 2 | ||
| Other | 154 (6.1) | 139 (8.5) | 15 (1.7) | <0.001 | 38 (6.9) | 36 (11.5) | 2 (0.8) | <0.001 |
| Acidosis | 6 | 5 | 1 | – | – | – | ||
| Electrolyte abnormality | 13 | 11 | 2 | 1 | 1 | – | ||
| Failure to thrive | 40 | 40 | – | 3 | 3 | – | ||
| Lymphocele | 23 | 21 | 2 | 18 | 18 | – | ||
| Rare complications | 70 | 61 | 9 | 10 | 8 | 2 | ||
| Trauma | 1 | – | 1 | – | – | – | ||
| Other | 1 | 1 | – | 6 | 6 | – | ||
| Total | 2507 | 1630 | 877 | 554 | 314 | 240 | ||
Continuous data: Mann–Whitney U-test. Categorical data: Pearson’s χ 2-test.
Table 3
Uni- and multivariable analyses of variables potentially involved in the risk of 90 day mortality
| Variable | Univariable analysis | Multivariable analysis | ||
| Odds ratio (95% CI) | p value | Odds ratio (95% CI) | p value | |
| Sex (referent: Female) | 0.99 (0.57–1.85) | 0.990 | ||
| Age yr, (continuous) | 1.03 (1.00–1.06) | 0.020 | 1.04 (1.01–1.07) | 0.011 |
| BMI, kg/m2 (continuous) | 1.05 (1.00–1.09) | 0.031 | 1.07 (1.02–1.12) | 0.004 |
| ASA score III-IV (referent: I-II) | 1.88 (1.14–3.09) | 0.013 | ||
| Number of comorbidities, 2–5 (referent: 0-1) | 1.64 (0.99–2.69) | 0.054 | ||
| Pathologic stage ≧T2 (referent: ≦T1) | 2.18 (1.28–3.86) | 0.004 | ||
| Pathologic N stage, pN+ (referent: pN0) | 2.84 (1.63–4.87) | <0.001 | 3.14 (1.78–5.47) | <0.001 |
| Neoadjuvant chemotherapy (referent: non) | 0.98 (0.52–1.73) | 0.940 | ||
| Surgical approach (referent: robotic) | 1.59 (0.58–6.56) | 0.410 | ||
| Form of urinary diversion | 0.200 | |||
| Continent | Referent | |||
| No diversion | 4.55 (0.24–25.95) | 0.240 | ||
| Cutaneous ureterostomy | 2.05 (0.77–5.00) | 0.150 | ||
| Ileal conduit | 1.70 (0.95–3.24) | 0.074 | ||
| EBL, 100 mL interval | 1.02 (1.01–1.03) | 0.001 | 1.02 (1.01–1.03) | 0.006 |
| Postoperative hospital stay, 10day interval | 0.96 (0.85–1.05) | 0.380 | ||
| US institution or Japanese institutions (referent: Japanese institutions) | 1.66 (0.97–2.99) | 0.064 | ||
| Major complication, (referent: non) | 3.5 (2.1–5.75) | <0.001 | 3.29 (1.88–5.71) | <0.001 |
Table 4
Uni- and multivariable analyses of variables potentially involved in the risk of 90-day major morbidity
| Variable | Univariable analysis | Multivariable analysis | ||
| Odds ratio (95% CI) | p value | Odds ratio (95% CI) | p value | |
| Sex (referent: Female) | 1.28 (0.98–1.68) | 0.068 | 1.28 (0.97–1.71) | 0.087 |
| Age yr, (continuous) | 1.01 (1.00–1.02) | 0.019 | ||
| BMI, kg/m2 (continuous) | 1.02 (0.99–1.04) | 0.083 | 1.04 (1.02–1.07) | <0.001 |
| ASA score III-IV (referent: I-II) | 1.18 (0.94–1.48) | 0.157 | 1.35 (1.02–1.80) | 0.037 |
| Number of comorbidities, 2–5 (referent: 0-1) | 1.74 (1.39–2.16) | <0.001 | 1.33 (1.04–1.69) | 0.022 |
| Pathologic stage ≧T2 (referent: ≦T1) | 1.16 (0.93–1.44) | 0.191 | ||
| Pathologic N stage, pN+(referent: pN0) | 1.00 (0.75–1.33) | 0.983 | ||
| Neoadjuvant chemotherapy (referent: non) | 0.73 (0.55–0.95) | 0.021 | ||
| Surgical approach (referent: robotic) | 0.99 (0.66–1.53) | 0.952 | ||
| Form of urinary diversion | <0.001 | 0.001 | ||
| Continent | Referent | Referent | ||
| No diversion | 1.29 (0.20 –4.98) | 0.753 | 1.34 (0.19–5.76) | 0.727 |
| Cutaneous ureterostomy | 1.41 (0.89–2.17) | 0.141 | 0.85 (0.49–1.42) | 0.535 |
| Ileal conduit | 1.73 (1.35–2.23) | <0.001 | 1.57 (1.20–2.07) | 0.009 |
| EBL, 100 mL interval | 1.02 (1.01–1.03) | <0.001 | 1.02 (1.01–1.03) | <0.001 |
| US institution or Japanese institutions (referent: Japanese institutions) | 0.61 (0.49–0.75) | <0.001 | 0.47 (0.34–0.65) | <0.001 |


