
Application of motion history image (MHI) on dynamic fluorescent imaging for monitoring cerebral ischemia induced by occlusion of middle cerebral artery (MCA) in mouse brain
Abstract
Background:
We use a temporal template method, the motion history image (MHI), to visualize the hypoperfusion (decreased blood flow) during an acute cerebral ischemic event in a mouse brain. The MHI method was implemented on the dynamic fluorescent (DF) data images.
Aims:
Our aim was to implement the MHI method on the DF imaging data and visualize the regions where perfusion evolves with time.
Methodology:
The MHI method was used to process the DF data images recorded during an acute cerebral ischemic event in a mouse brain.
Results:
We demonstrate that, the MHI images clearly illustrates the locations where perfusion decreases during occlusion and that is more easily obtained in comparison to a visual inspection of all of the raw DF images constituting the recordings.
Conclusion:
MHI can be a useful tool for the clinical and research studies.
1.Introduction
Visualizing the hemodynamic changes and perturbations in cerebral blood flow is important in medical field especially in the physiological and pathological aspects [1]. Monitoring microvascular perfusion is also important in clinical and research fields [2] for better diagnostics and further treatment. Though different techniques have been adopted, laser based imaging systems are gaining attention to visualize the microvascular perfusion. The main laser based techniques are the laser Doppler flowmetry (LDF), laser Doppler imaging (LDI), and laser speckle contrast imaging (LSCI) [3–5]. Each technique has its own advantages and limitations when compared with other methods. Among these methods the LSCI has the advantage of being a full-field imaging technique and has been applied in many applications [6–8]. However, this technique has one of the drawbacks in which large amount of data has to be processed. This in turn becomes a lengthy and tedious task for processing the images for results. In order to support the performance of this task, a new algorithm such as motion history image (MHI) [9,10] has already been proposed. It has been applied to a variety of LSCI data to visualize the regions where perfusion changes occur [9,10]. Though the MHI algorithm was a novel achievement towards microvascular imaging, it has been applied only to the LSCI data to monitor the perfusion changes [9,10].
Moreover, using the MHI method on LSCI data, certain limitations were noticed. One of the limitations was that it provides information on perfusion variations only [10]. It was not possible to differentiate between high and low perfusion values using the MHI method [10]. In order to overcome these limitations, in the present study we propose and validate the use of MHI algorithm to the dynamic fluorescent imaging (DF) data to visualize the hypoperfusion (decreased blood flow) during an acute cerebral ischemic event. The potential of fluorescent imaging techniques were widely applied in several biomedical applications [11,12] and for the study of cortical hemodynamic changes during induced occlusion of middle cerebral artery (MCA) in a mouse brain [1].
2.Materials and methods
2.1.Theory
The MHI is a view-based temporal template method [13–15]. It has been applied successfully to various LSCI data to visualize the perfusion variation locations during different stimuli [9,10]. It generates a single bidimensional map from an image sequence showing perfusion variations in time. In the generated image, each pixel is a function of recency of motion (perfusion variations in our case) of the image sequence.
MHI detects the motion of an object based on the time stamps of pixels over a set of images corresponding to a motion sequence. MHI computes a single static and bidimensional map that integrates both the spatial location as well as the temporal history of motion in the object and thus the spatial and temporal resolutions gets retained. The bidimensional MHI image can be constructed according to the algorithm that each pixel in the MHI is labeled with the timestamp (hour, minute, second, and millisecond etc.) and will be dropped out if it does not present significant change following a certain time lapse, known as the lifetime of the MHI. In the MHI, the most recent movement appears as bright in the gray scale.
The MHI
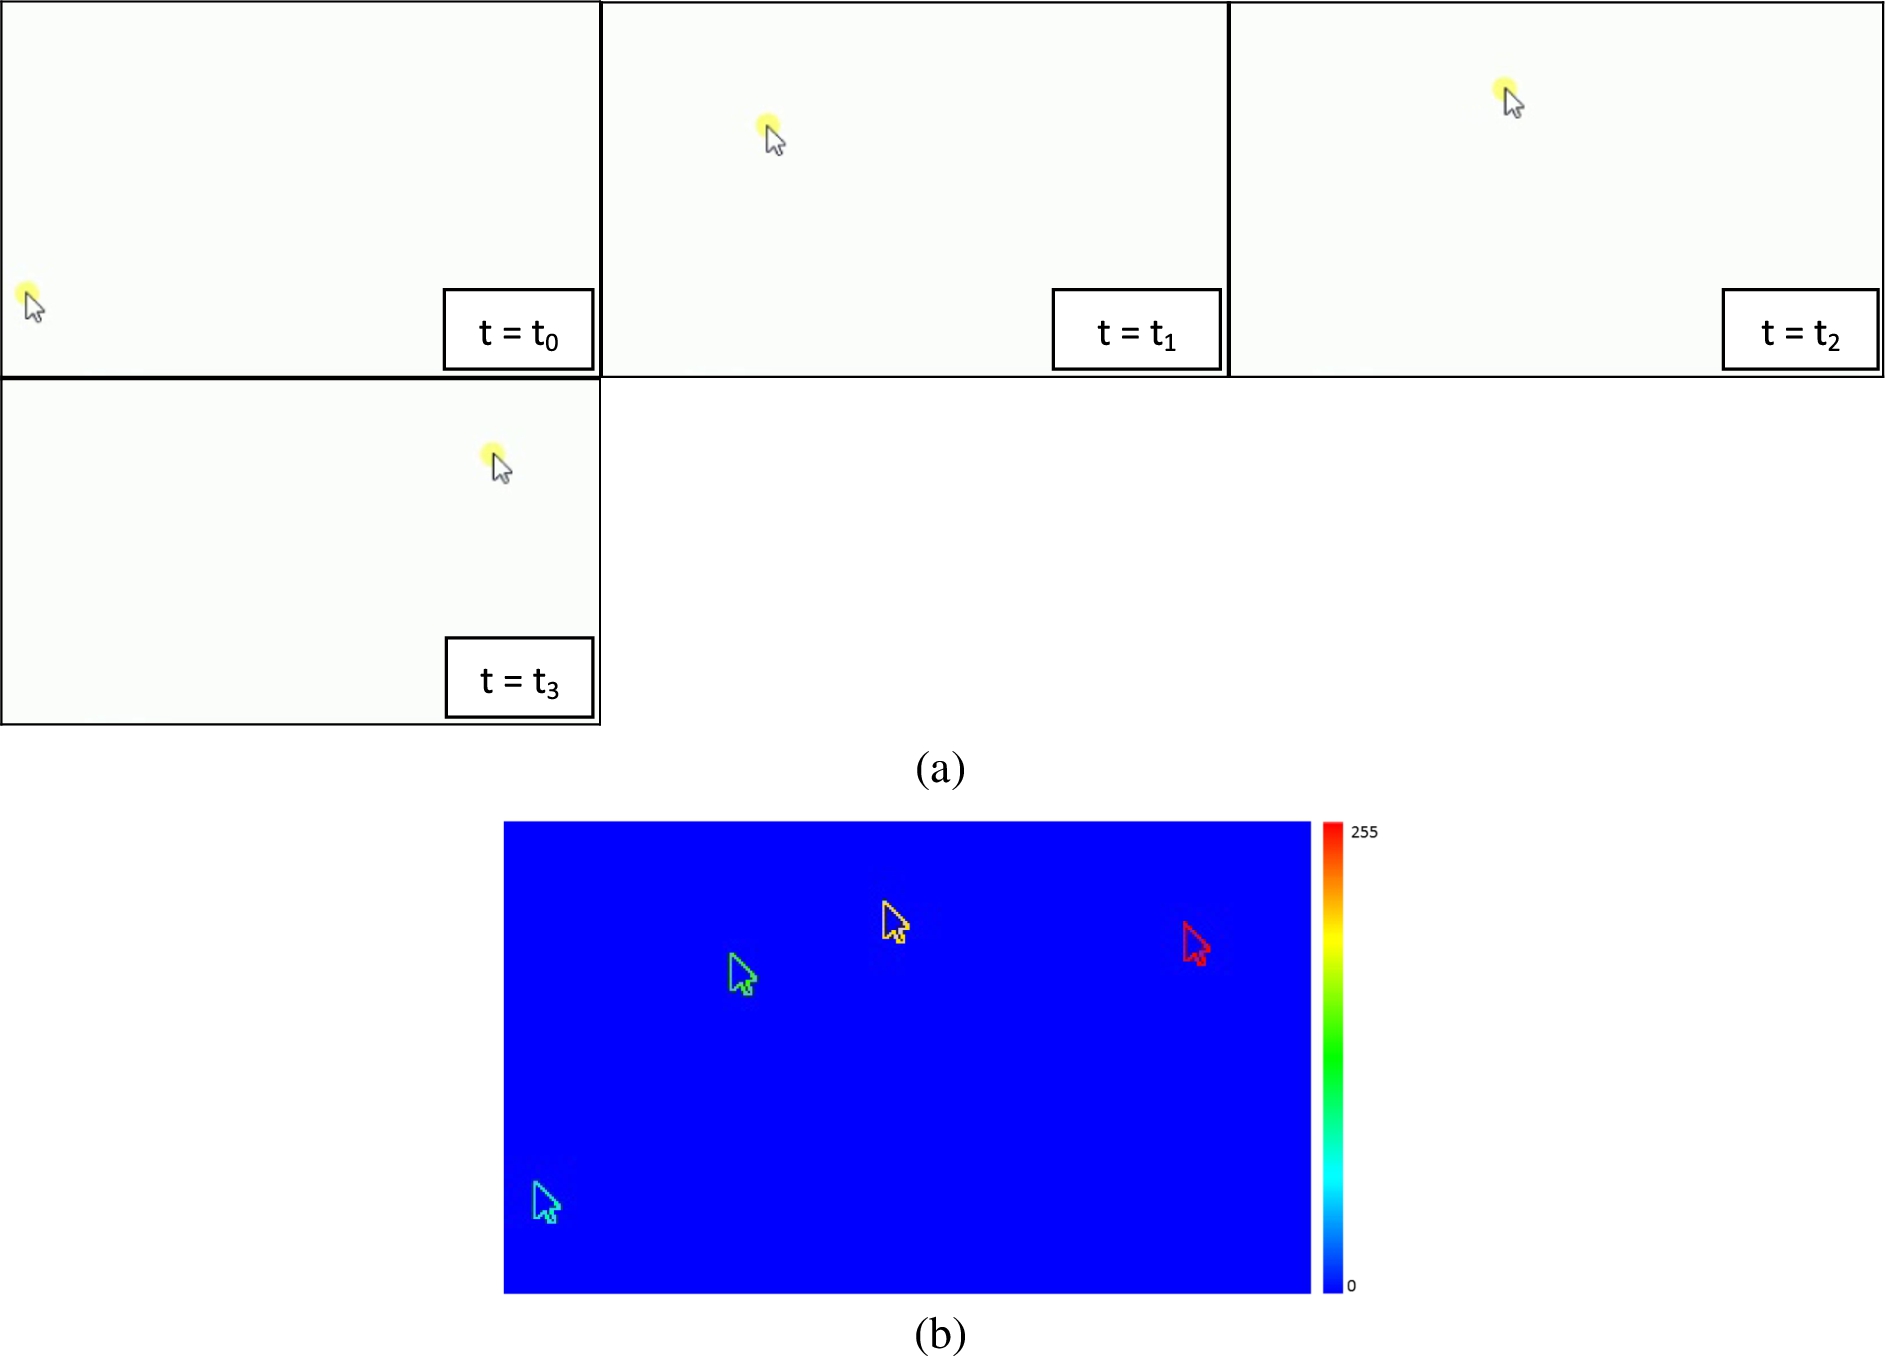
Figure 1(a) shows an example of random movement of cursor at different time points on a computer screen. The corresponding MHI image presented in Fig. 1(b) clearly shows all the spatial as well as temporal movements of the cursor. The most recent movement is shown by red color while the initial motion by blue color. Thus a bidimentional image reflecting the motion with time can be generated using MHI.
Fig. 1.
(a) Movement of cursor on a computer screen at different time points of event. (b) MHI image generated by computing threshold image of the difference of images shown in Fig. 1(a). The MHI clearly shows the movements of the cursor at different time points. As can be seen the most recent motion is highlighted by red color while the initial cursor position during its motion is represented by blue color.
![The DF images (Copyright Scientific Reports, Springer Nature, Reproduced with permission) showing effect of occlusion of the middle cerebral artery (MCA) in the right hemisphere of a mouse brain [1]. The color bar for the corresponding images is indicated in ref. [1].](https://content.iospress.com:443/media/bsi/2017/6-3-4/bsi-6-3-4-bsi170/bsi-6-bsi170-g002.jpg)
2.2.Materials
We demonstrate the application of the MHI algorithm on DF data recorded during occlusion of the middle cerebral artery (MCAO) in a mouse [1]. The data consists of a real-time video sequence of DF images during occlusion of the middle cerebral artery (MCAO) in a mouse. The acute cerebral ischemic event was produced by occlusion of the middle cerebral artery (MCA) [1].
The images show cortical blood flow following occlusion of the middle cerebral artery (MCAO) [1]. The video footage was acquired during a 20 seconds interval after the fluorescein administration into the tail vein and details of the experiment and image acquisition procedure can be studied in reference [1].
3.Results and discussion
3.1.Monitoring perfusion variation during an induced occlusion of the middle cerebral artery (MCA) of a mouse brain
Figure 2 presents typical frames sequence of DF images recorded during an acute cerebral ischemic event where the effect of occlusion on the perfusion in the right hemisphere can be seen. The sequence rather shows the kinetics of blood flow and blood vessels appear as brighter areas [1]. The blood perfusion variation can be followed at different time points of the event. An acute cerebral ischemic event was induced by occlusion of the middle cerebral artery (MCA) of mice [1]. Each image corresponds to the time after the occlusion.
Fig. 3.
The MHIs showing clearly the areas with low perfusion in the right hemisphere of a mouse brain during induced occlusion of the middle cerebral artery (MCA). Each MHI was generated from a stack of DF images around a particular time point given in Fig. 2. For the computation of each MHI, a buffer of 8 images with a threshold value of 14 was used.
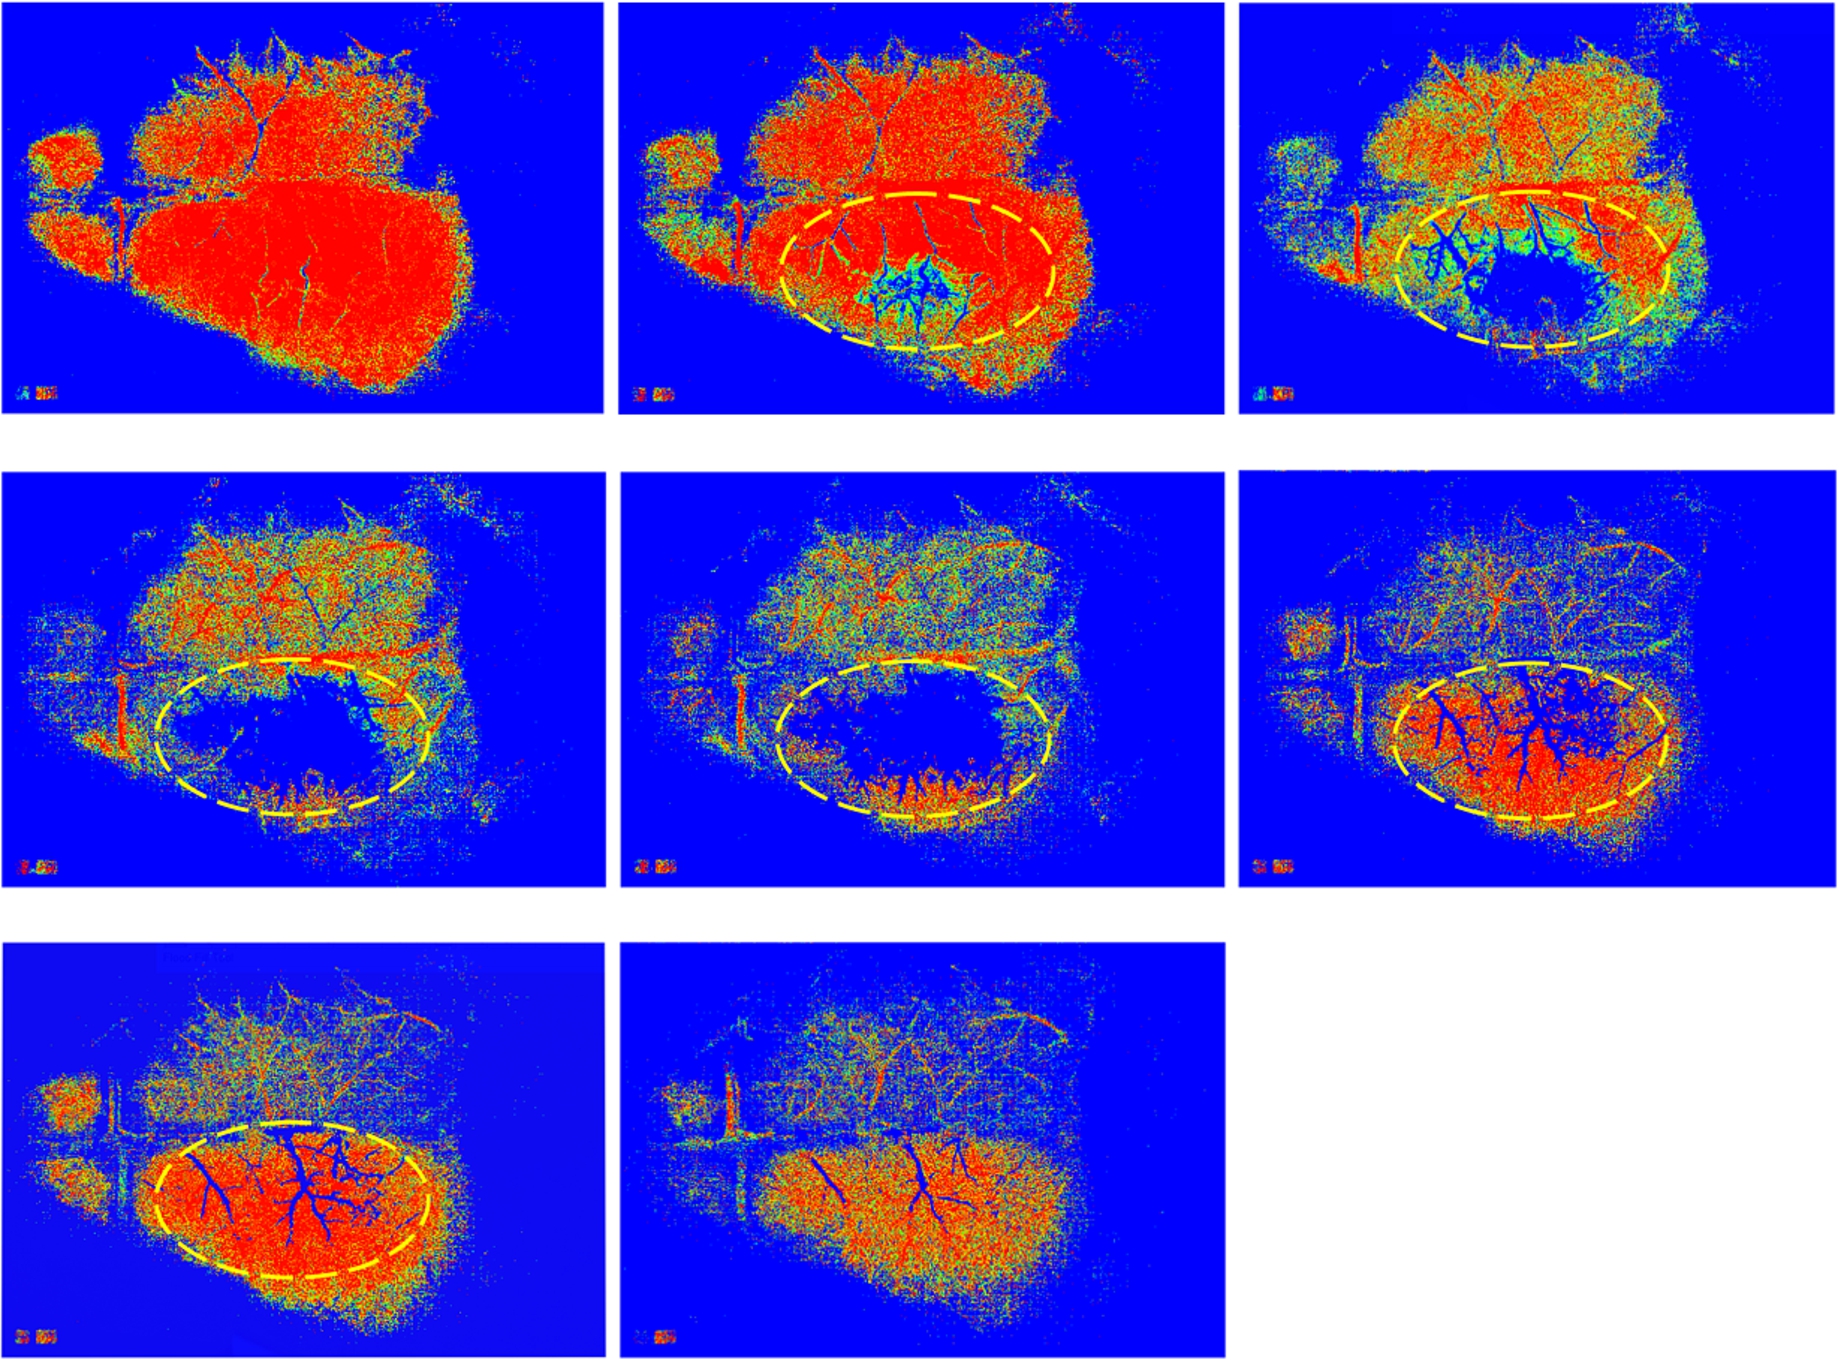
Fig. 4.
MHI images computed with different threshold values and with a buffer size of 8. The threshold value is equal to (a) 6; (b) 14; (c) 24; (d) 34.
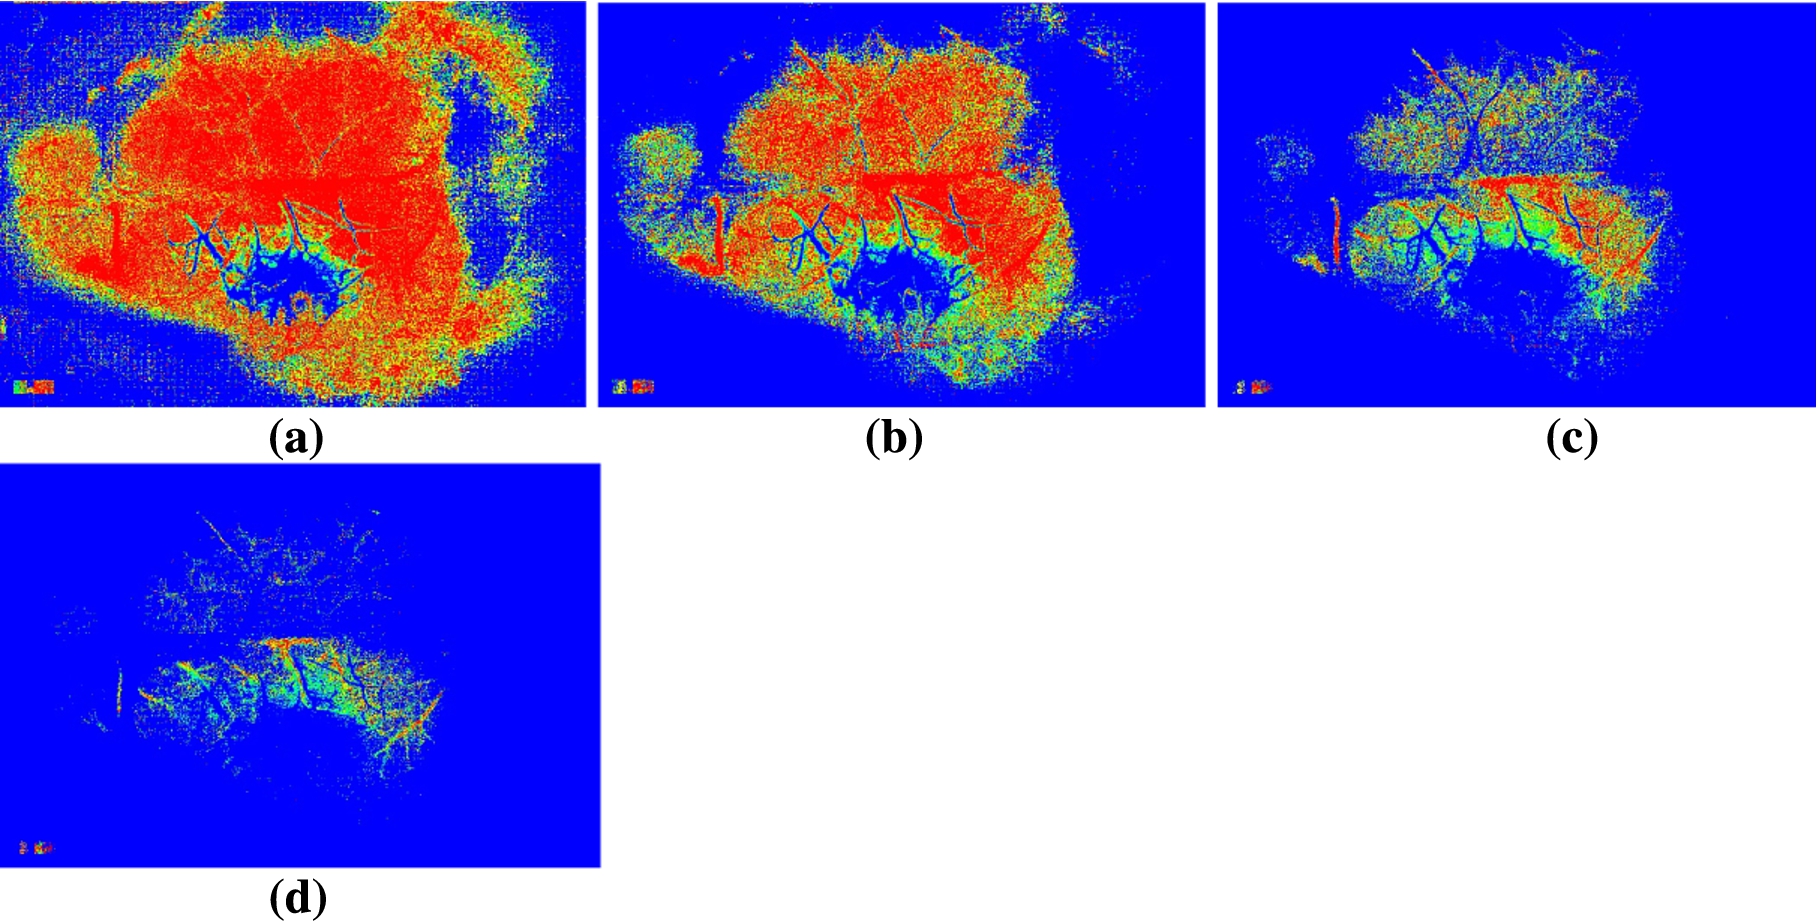
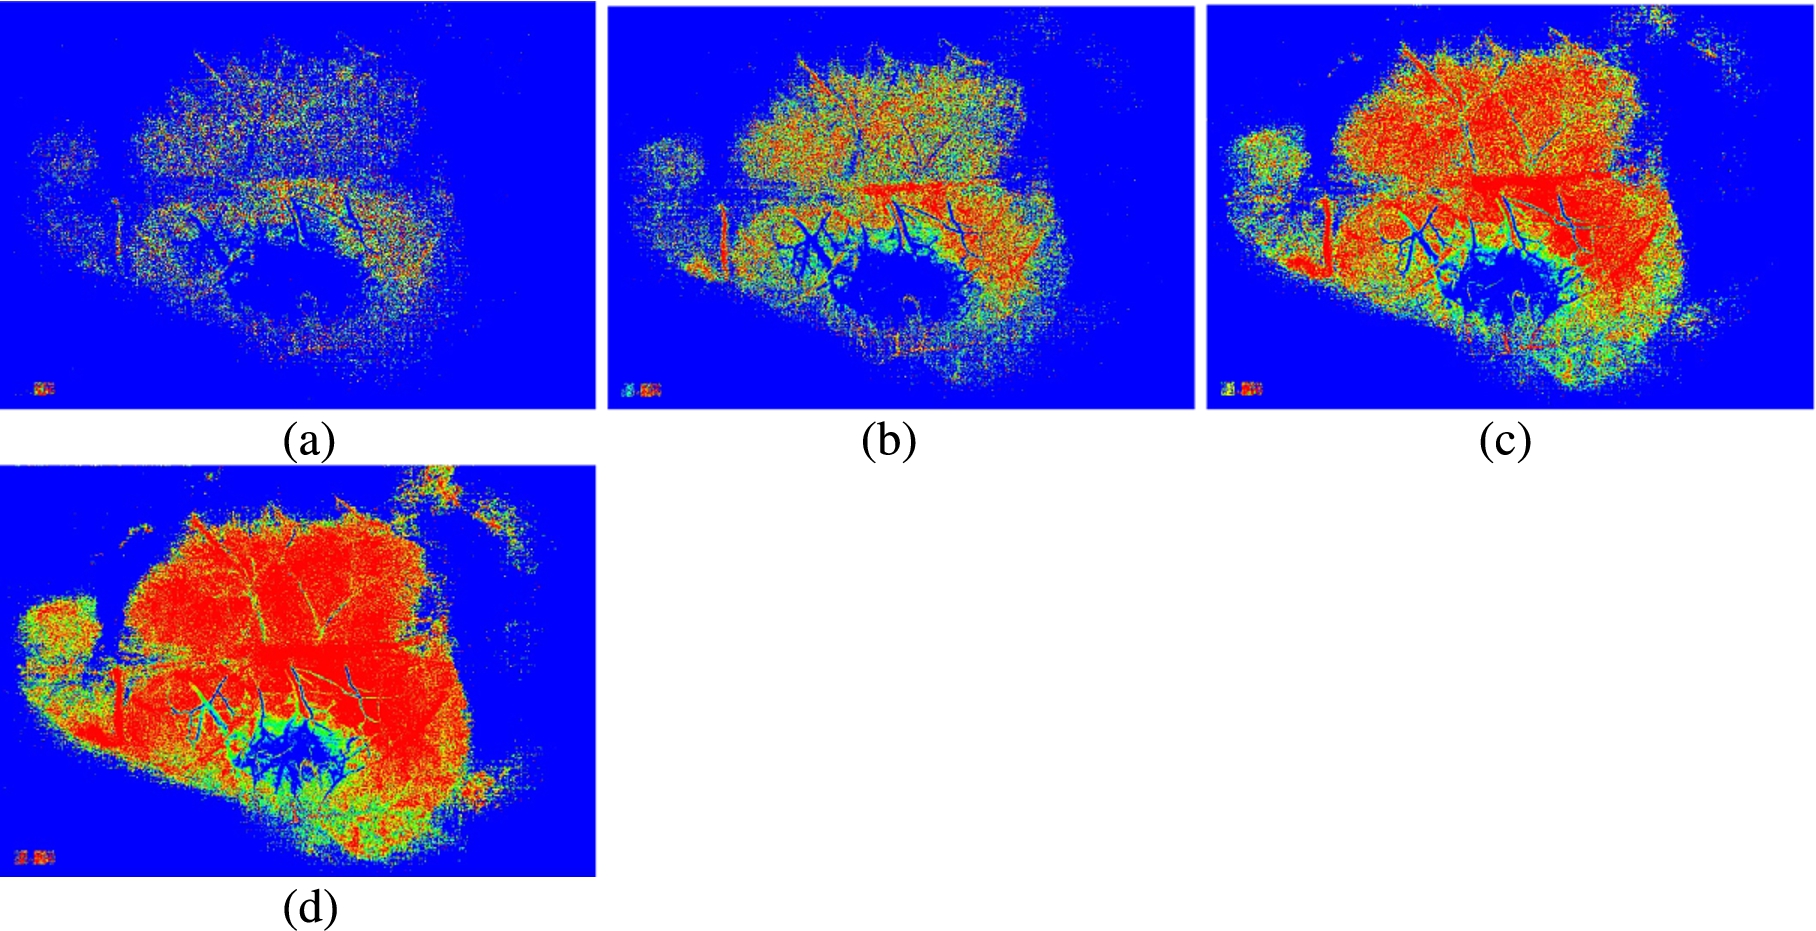
Fig. 5.
MHI images generated with different buffer sizes with a threshold value of 14. The buffer size is equal to (a) 4; (b) 6; (c) 8; (d) 10.
To visualize the cerebral blood flow changes during occlusion, MHI method was implemented on the corresponding DF images [1]. Figure 3 shows the corresponding MHI images at different time points of event. Each MHI was computed from DF images around the frames shown in Fig. 2. The MHIs clearly illustrates the locations where perfusion decreases during occlusion. This was found more pronounced than in the raw DF images shown. The colors in the corresponding MHIs can be used to indicate perfusion evolution with time and since the sampling frequency of the data is known, a quantitative relationship between colorbar (pixel values) and the time points could be obtained [9,10].
For the computation of each MHI map, we used a buffer of 8 images with a threshold value of 14 over a stack of images shown in Fig. 2.
In the MHI, proper adjustment of its parameters values such as the level of threshold and the buffer size enhances the quality of images [9,10].
3.2.Effect of threshold values and buffer size on the MHI map
Figure 4 shows the effect of threshold values on the resulting MHI image. It shows MHI images generated with different threshold values and a buffer size of 8. From the Fig. 4 one can observe that the adjustment of threshold value reinforces the ability to distinguish distinct areas of activity (here perfusion areas).
Figure 5 shows the MHI images generated with different buffer size and a threshold value of 14. From the Fig. 5 we observe that the buffer size determines the ability to get information linked with lower activities (here low perfusion value during occlusion).
4.Conclusions
In order to give support to the clinician or researchers, we had applied a view based temporal template method, the MHI on DF data and demonstrated the use of MHI algorithm to visualize the hypoperfusion during an acute cerebral ischemic event in mouse brain. Using MHI method, areas of lesion (occlusion) have clearly been illustrated.
Acknowledgement
The authors are sincerely thankful to the editorial board of ‘Scientific Reports’ for giving consent regarding the reuse of the supplementary data (video) of the publication [1]. We also thank Prof. Vyacheslav Kalchenko (The Weizmann Institute of Science, Israel) for his assistance through ResearchGate.
Conflict of interest
The authors declare that they have no conflict of interest.
Role of funding source
This work was financially supported by the institution of the authors.
Ethical approval
All procedures were performed on the published supplementary data (of Scientific Reports) of reference [1]. An ethical approval was not needed.
Informed consent
The authors have used a published supplementary data (video) from the reference [1] and the data used is licensed under a Creative Commons Attribution-NonCommercial-NoDerivs 4.0 International License (http://creativecommons.org/licenses/by-nc-nd/4.0/). Therefore, as informed by the licensee (M/s Editorial board, Scientific Reports, Springer Nature), it is free to use the supplementary data (video) for research.
References
[1] | V. Kalchenko, D. Israeli, Y. Kuznetsov and A. Harmelin, Transcranial optical vascular imaging (TOVI) of cortical hemodynamics in mouse brain, Scientific Reports. 4: ((2014) ), 5839. doi:10.1038/srep05839. |
[2] | Ansari et al., Imaging functional blood vessels by the laser speckle imaging (LSI) technique using Q-statistics of the generalized differences algorithm, Microvascular Research 107: ((2016) ), 46–50. doi:10.1016/j.mvr.2016.04.012. |
[3] | A. Humeau-Heurtier, E. Guerreschi, P. Abraham and G. Mahé, Relevance of laser Doppler and laser speckle techniques for assessing vascular function: State of the art and future trends, IEEE Trans. Biomed. Eng. 60: ((2013) ), 659–666. doi:10.1109/TBME.2013.2243449. |
[4] | R. Bi, J. Dong, C.L. Poh and K. Lee, Optical methods for blood perfusion measurement-theoretical comparison among four different modalities, J. Opt. Soc. Am. A Opt. Image Sci. Vis. 32: ((2015) ), 860–866. doi:10.1364/JOSAA.32.000860. |
[5] | J.L. Cracowski and M. Roustit, Currentmethods to assess human cutaneous blood flow: An updated focus on laser-based-techniques, Microcirculation 23: ((2016) ), 337–344. doi:10.1111/micc.12257. |
[6] | J. Allen and K. Howell, Microvascular imaging: Techniques and opportunities for clinical physiological measurements, Physiol. Meas. 35: ((2014) ), R91–R141. doi:10.1088/0967-3334/35/7/R91. |
[7] | S.M. Kazmi, L.M. Richards, C.J. Schrandt, M.A. Davis and A.K. Dunn, Expanding applications, accuracy, and interpretation of laser speckle contrast imaging of cerebral blood flow, J. Cereb. Blood Flow Metab. 35: ((2015) ), 1076–1084. doi:10.1038/jcbfm.2015.84. |
[8] | D.W. Paul, P. Ghassemi, J.C. Ramella-Roman, N.J. Prindeze, L.T. Moffatt, A. Alkhalil and J.W. Shupp, Noninvasive imaging technologies for cutaneous wound assessment: A review, Wound Repair Regen. 23: ((2015) ), 149–162. doi:10.1111/wrr.12262. |
[9] | M.Z. Ansari et al., Visualization of perfusion changes with laser speckle contrast imaging using the method of motion history image, Microvascular Research 107: ((2016) ), 106–109. doi:10.1016/j.mvr.2016.06.003. |
[10] | M.Z. Ansari et al., Monitoring microvascular perfusion variations with laser speckle contrast imaging using a view-based temporal template method, Microvascular Research 111: ((2017) ), 49–59. doi:10.1016/j.mvr.2016.12.004. |
[11] | S.J. Glover, R.J. Maude, T.E. Taylor, M.E. Molyneux and N.A. Beare, Malarial retinopathy and fluorescein angiography findings in a Malawian child with cerebral malaria, Lancet Infect. Dis. 10: ((2010) ), 440. doi:10.1016/S1473-3099(10)70073-6. |
[12] | M.A. Kamp et al., Microscope-integrated quantitative analysis of intraoperative indocyanine green fluorescence angiography for blood flow assessment: First experience in 30 patients, Neurosurgery 70: ((2012) ), 65–73; discussion 73–74. |
[13] | J. Davis and A. Bobick, The representation and recognition of action using temporal templates, in: Proc. Comp. Vis. and Pattern Rec. IEEE, (1997) , pp. 928–934. |
[14] | A. Bobick and J. Davis, The recognition of human movement using temporal templates, IEEE Trans. Pattern Anal. Mach. Intell. 23: (3) ((2001) ), 257–267. doi:10.1109/34.910878. |
[15] | R.P. Godinho, M.M. Silva, J.R. Nozela and R.A. Braga, Online biospeckle assessment without loss of definition and resolution by motion history image, Opt. Lasers Eng. 50: (3) ((2012) ), 366–372. doi:10.1016/j.optlaseng.2011.10.023. |
[16] | M.A.R. Ahad, J.K. Tan, H. Kim and S. Ishikawa, Motion history image: Its variants and applications, Mach. Vis. Appl. 23: ((2012) ), 255–281. doi:10.1007/s00138-010-0298-4. |


