
Intake of arsenic and selenium in a Bangladeshi population investigated using inductively coupled plasma mass spectrometry
Abstract
Millions of people in Bangladesh are exposed to high concentration of the toxic element arsenic (As) through drinking water and consumption of foods. It has also been reported that Bangladeshis have a low intake of the essential element selenium (Se), which is known to be important as an antioxidant and has been suggested to counteract the toxicity of As. We report here on total intake of As and Se in a Bangladeshi population, based on inductively coupled plasma mass spectrometric (ICP-MS) analysis of a range of Bangladeshi foods. The total daily intake of As and Se from foods was estimated to be 74.2 and 87.7 µg/day, respectively. If As from water, used for drinking and cooking rice, is included the TDI increases to 385 µg of total As per day. An important finding of our study, contrary to suggestions given in other reports, is that the Bangladeshi diet does not appear to be deficient in Se and this may explain why the blood Se concentrations in Bangladeshis is similar to the USA population. This requires further investigation and detailed dietary and human biomonitoring studies on the Bangladeshi population should be conducted. Rice and fish were the main sources of dietary As and Se for Bangladeshis. Leafy vegetables could also be a significant contributor of high concentration of As in the Bangladeshi diet. The flesh and eggs of Hilsha (Tenualosa ilisha) species of fish were found to contain particularly high levels of total arsenic (range 0.77–6.15 mg/kg) although this is likely to be dominated by the non-toxic organoarsenic species.
1.Introduction
Exposure to arsenic (As) through drinking water has been linked to the development of various diseases, including hyperkeratosis and skin lesions, and millions of people are at risk of developing cancer in Bangladesh where exposure to As is one of the highest in the world [48]. Use of As rich groundwater for irrigation of crops in Bangladesh is adding to this problem as high concentrations of As have been detected in rice and vegetables grown in that country [2,6,33,58,70]. Although exposure to As from drinking water has been extensively investigated, intake of As from foods needs to be considered as it may also be an important source of exposure [20,71].
Many UK Bangladeshis consume food products that are similar to Bangladeshis residing in Bangladesh. This is possible because many Bangladeshi foods, including vegetables and fish, are imported into the UK [6,56]. Certain diseases including cancers and diabetes have been linked to elevated exposure to toxic elements [17,47,48]. According to the Health Survey for England 2004, UK Bangladeshi men have a higher prevalence of diabetic disease compared with other UK communities [98]. We have previously reported that concentrations of toxic As species in Bangladeshi food is high and expressed concern that UK Bangladeshi may be at risk of increased exposure to toxic As [6]. Furthermore, a recent study has reported that urinary inorganic As and dimethylarsinic acid (DMA) concentrations are higher in UK Bangladeshis compared to the general UK population [20]. A more recent study, involving 18,470 Bangladeshis, residing in Bangladesh, revealed that rice consumption was positively associated with urinary total As [71]. The latter study also showed an increasing trend in skin lesion prevalence and skin lesion incidence associated with increased consumption of rice.
Selenium (Se) is an essential element that has many functions in the human body. It has been reported that Se has preventive potency against Keshan disease and has important antioxidant activities [83,84,99]. It has been suggested that Se protects the body against As toxicity [81,96] and can have a positive role in the immune system functions [61]. The Recommended Dietary Allowance (RDA) for Se has been estimated to be 55 and 70 µg/day for women and men respectively (dependent upon average body weight) [25]. However, the maximum daily intake of Se has been estimated to be 5 µg/kg b.w./day, i.e. 300 µg/day for a 60 kg individual [41]. A recent study suggested that Se concentration of 60 µg/day for women and 60 µg/day for men are necessary for adequate intake [57]. Se deficiency in Bangladeshis has also been reported [95]. In a later report, these authors suggested that Bangladeshi foods are likely to have low concentration of Se due to low Se concentration in Bangladeshi soils [94].
There are few studies on the intake of As and Se from non-food sources, such as betel quid chewing and baked clay (geophagy), in populations that are exposed to As through drinking water. Betel quid is widely consumed in Bangladesh and India [6,8]. Piper betel leaves and areca nut are the main components in a betel quid. The concentration of As in Piper betel leaves have been determined by Al-Rmalli et al. [6], and in areca nut by Signes-Pastor et al. [90]. In our previous study, As and Se in both betel quids [8] and baked clay [7] were comprehensively investigated. In the current paper, we provide the most detailed estimation of the total daily intake (TDI) of As and Se in the Bangladeshi population thus far investigated. The study provides valuable information regarding exposure to As and Se and the relationship between these elements in the Bangladeshi diet.
2.Materials and methods
2.1.Sample collection
Different types of foods and non-foods which are widely consumed in Bangladesh were analysed. Foods including rice and vegetables, fruits, fish, and non-foods such as betel quid and its components, were purchased from UK based ethnic shops in the cities of Leicester, Birmingham, London and Luton during the months of September 2008 and June 2010. The products analysed in this study were mainly of Bangladeshi origin and are popular within Bangladeshi communities living in the UK and in Bangladesh.
Food samples were treated before digestion in different ways. Rice and puffed rice were ground using a coffee grinder and then kept for analysis. Vegetables were washed three times with tap water and then once with distilled water. The vegetable samples were then dried to constant weight at 80°C overnight. The dried samples were ground to a powder for analysis. The moisture content for vegetable samples was determined from the difference in weights, measured before and after drying. Frozen fish samples were dried overnight using a lyophiliser. The moisture content of the fish samples was determined as for other foods. The fish samples were then ground and prepared for analysis.
2.2.Sample digestion
Rice, vegetables (leafy and non-leafy), fruits, betel quid and fish samples were digested using a microwave digester. A dry ground weight (0.3–0.5 g) of sample was mixed with 4 ml of 70% nitric acid (HNO3) (Romil-UpA™, Romil Ltd., Cambridge, UK) and 2 ml of hydrogen peroxide (H2O2) and then microwave digested for 40 minutes at a total pressure of 20 bars and a maximum temperature of 150°C (Anton Paar – Multiwave 3000 Microwave Sample Preparation System, Graz, Austria). The digested solutions were evaporated to dryness and then diluted to 25 ml in volumetric flasks with ultra-pure water (Romil-UpS™, Romil Ltd., Cambridge, UK) prior to analysis. Some of these foods were digested using a microwave digestion unit at a maximum temperature of 170°C (CEM, Microwave digestion MAR Xpress, Matthews, NC, USA).
2.3.Determination of As and Se concentrations
Concentrations of trace elements in the digested samples were determined by inductively coupled plasma mass spectrometry (ICP-MS). A Thermo-Fisher Scientific X-SeriesII instrument equipped with CCTED (collision cell technology with energy discrimination). Scandium (50 µg/L), rhodium (10 µg/L) and iridium (5 µg/L) in the preferred matrix of 2% HNO3 was used. The instrument parameters used were as follows: forward power (1,404 W); hexa-pole bias (−18.0 V); pole bias (−14.0 V); reaction cell gas flow rate (4 ml/min); nebuliser (carrier gas) flow rate (0.82 L/min); extraction lens (−129.4 V); quadru-pole dwell times (20 ms). External calibration standards for elements were prepared in the range 0–100 µg/L. Samples were introduced via a covered autosampler (CetacASX-520) through a concentric glass venture nebuliser (ThermoFisher Scientific Inc., Waltham, MA, USA). The data processing was undertaken using a Plasmalab software (version 2.5.4; Thermo-Fisher Scientific, UK), set to employ separate calibration blocks and internal cross-calibration where required.
2.4.Quality control and standard reference material
In this study, all the sample masses were measured to an accuracy of ±0.1 mg. Elemental concentrations obtained by the ICP-MS technique were evaluated using certified reference materials and were found to be in good agreement with the certified values. The analytical procedure and the reliability of the digestion process of the samples were validated by analysis of different types of standard reference materials (see Table 1). The average recoveries of references material ranged from 87 to 105% for all measurement runs.
Table 1
ICP-MS determined As and Se concentrations (µg/kg ± SD) in standard reference materials
| Reference material | Element | Certified value | Found value |
| Rice flour (NIES No. 10-b) | As | 0.110 | 0.103 |
| Se | 0.02 | 0.021 | |
| Seaweed (NIES No. 9) | As | ||
| Se | 0.05 | 0.06 | |
| Typical Japanese diet (NIES No. 27) | As | ||
| Se |
3.Results
Concentrations of As and Se in rice, fish, vegetables and non-foods (betel quid) imported from Bangladesh and sold in the UK markets were determined. Data for rice, vegetables and fruits are presented in Fig. 1, while that for fish samples are presented in Table 2. Our data for betel quids have been derived from our previously published work [8]. The content of As and Se in aromatic rice is also taken from one of our recent publications [9]. Details regarding As and Se content in different types of foods are presented in Table S1 (supplementary material). Mean concentrations of As and Se present in foods and non-foods were used for calculating the TDI for the Bangladeshi population residing in Araihazar Upazila (Narayanganj district) based on the Food Frequency Questionnaire (FFQ) derived data of Zablotska et al. [108].
Fig. 1.
Mean concentrations (fresh weight) of As and Se in 295 samples of Bangladeshi foods including rice, vegetables and fruits. Bars represent standard deviation (SD).
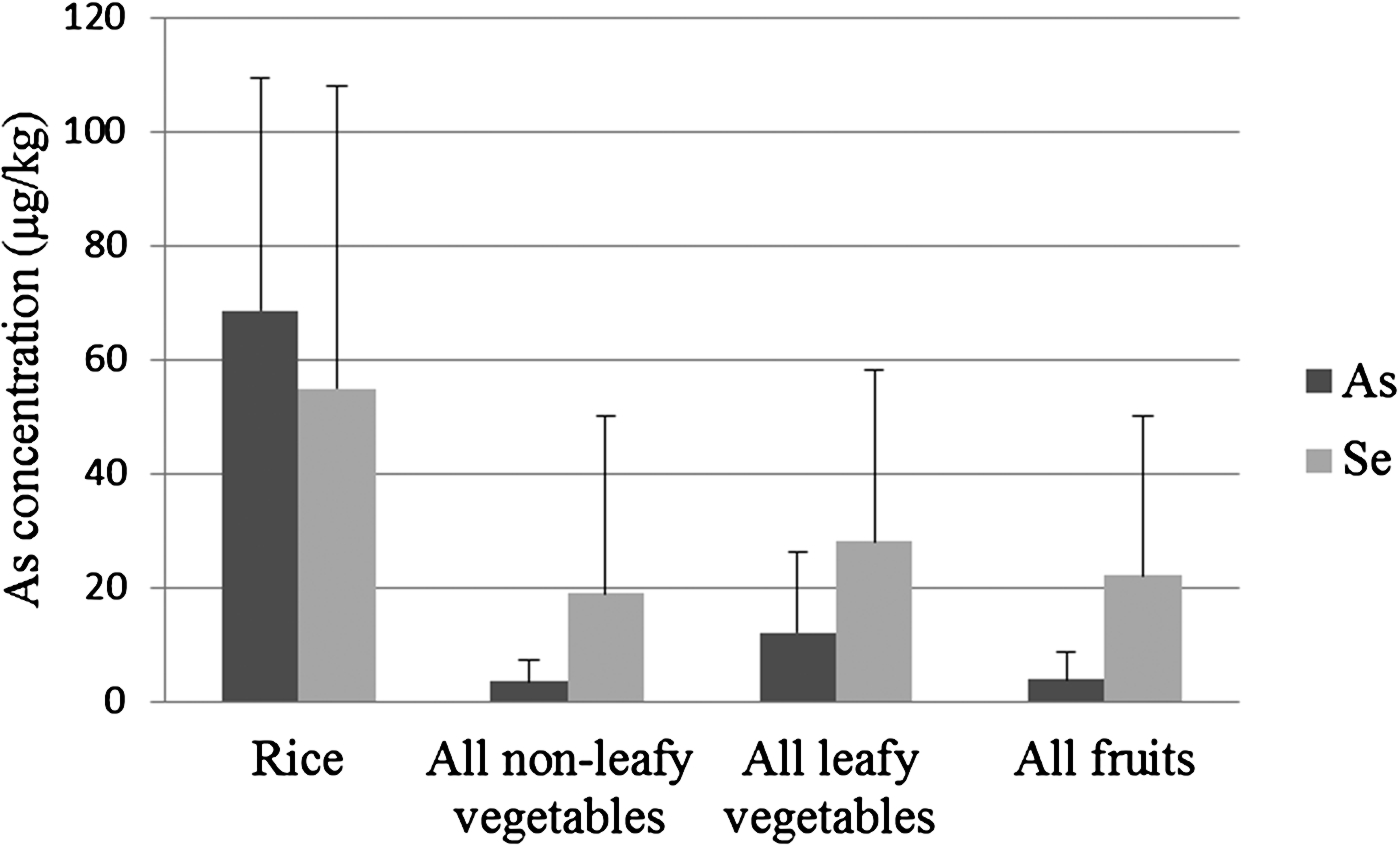
Table 2
ICP-MS determined As and Se (mg/kg) concentrations in different types of fish consumed by Bangladeshis
| Sample | n | As | Se | ||||
| Mean ± SD | Min | Max | Mean ± SD | Min | Max | ||
| Big fish | |||||||
| Hilsha (Tenualosa ilisha) (BD) | 15 | 0.77 | 4.44 | 0.21 | 1.25 | ||
| Hilsha (from Myanmar) | 3 | 4.36 | 6.15 | 0.41 | 0.46 | ||
| Rhui (Labeo rohita) (BD) | 14 | 0.006 | 0.153 | 0.05 | 0.35 | ||
| Rhui (from Myanmar) | 1 | 0.105 | – | – | 0.54 | – | – |
| Ayre (Sperata aor) | 5 | 0.004 | 0.032 | 0.03 | 0.36 | ||
| Shoal (Micropterus cataractae) | 1 | 0.012 | – | – | 3.06 | – | – |
| Shoal fish (liver) | 1 | 0.016 | – | – | 1.66 | – | – |
| Mrigala (Cirrhinus cirrhosus) | 1 | 0.005 | – | – | 0.08 | – | – |
| Mean* | |||||||
| Small fish | |||||||
| Puti (Puntius puntio) | 5 | 2.2 | 0.18 | 0.27 | 0.48 | ||
| Unidentified (silver coloured) | 2 | 1.2 | 3.1 | 2.3 | 3.4 | ||
| Keski (Carica soborna) | 2 | 0.21 | 1.5 | 0.7 | 0.8 | ||
| Chapila (Gudusia chapra) | 2 | 0.08 | 0.49 | 0.4 | 0.7 | ||
| Taki (Channa punctata) | 2 | 0.12 | 0.09 | 0.19 | 0.20 | ||
| Nodoi (Nandus nandus) | 2 | 0.09 | 0.18 | 0.2 | 0.5 | ||
| Tit punti (Puntius ticto) | 2 | 0.02 | 0.12 | 0.29 | 0.30 | ||
| Mean | |||||||
| Eggs | |||||||
| Fish egg (Hilsha) (BD) | 10 | 1.3 | 4.8 | 0.71 | 2.80 | ||
| Fish egg (Hilsha) (from Myanmar) | 1 | 4.8 | – | – | 1.48 | – | – |
* Mean of big fish excluding shoal fish (liver).
BD: Bangladesh.
Rice is a staple food for Bangladeshis and was found to contain As concentrations significantly higher than the other categories of foods shown in Fig. 1 (see also Table S1). Of the types of rice analysed, the highest As concentrations determined were for puffed rice (widely consumed by Bangladeshis) and uncooked rice, at 173 and 160.8 µg/kg respectively, with an overall mean of 68.5 µg/kg (Fig. 1). Aromatic rice has lower As and higher Se concentrations [9]. Of the vegetables, the highest mean concentration of As (33.5 µg/kg) was found in data shak (Amaranths lividus), while that for Se was in cumin (at 573 µg/kg). Cumin seeds (Cuminum cyminum) are used, in small quantities as spice, when cooking curries. Lentils, which are a dietary staple of Bangladeshis, also contained relatively high concentrations of Se, with a mean of 152 µg/kg. Generally, low mean concentrations of As were detected in non-leafy vegetables.
Fish is the major animal food consumed in Bangladesh. In the present study, 11 varieties of freshwater fish and one variety of sea fish (Hilsha) sold in ethnic Bangladeshi shops in the UK were analysed (Table 2). The highest As concentration (6.15 mg/kg) was found in Hilsha (Tenualosa ilisha) fish. Concentrations of As ranged from 0.004–6.15 mg/kg for big fish flesh and 0.02–3.1 mg/kg for small fish (Table 2). Generally, Se concentrations in small fish and big fish are similar (Table 2). Se concentrations were 0.8 and 2.8 mg/kg (mean values) in a small fish known as Keski (Carica soborna) and an unidentified silver coloured fish (small fish), respectively. However, Se concentrations in the big fish category showed a wide range at 0.03–3.1 mg/kg (Table 2).
Table 3 shows daily intakes of these elements from all foods (including drinking water), at 301 and 90.4 µg/day for As and Se respectively (this does not include As in water used for cooking foods). It also presents the estimation of daily intakes of As and Se from consumption of two important Bangladeshi foods, fish (31.8 and 35.2 µg/day, respectively) and steamed rice (34.3 and 27.4 µg/day, respectively). It is interesting to note that, besides rice and fish, betel quids can make a significant contribution to the daily intake of Se (Table 3).
Table 3
Daily intakea (µg/day) in foods, betel quid and water for Bangladeshis
| Food | As | Se |
| Meatb | 0.14 | 0.64 |
| Poultryb | 0.10 | 2.70 |
| Fish | 31.8 | 35.2 |
| Leafy vegetables | 2.58 | 4.8 |
| Lentil and beans | 2.58 | 3.9 |
| Steamed rice | 34.3e | 27.4 |
| Puffed rice | 2.18 | 1.1 |
| Tea infusions | 0.15 | 0.14 |
| Othersc | 0.40 | 11.8 |
| Sum of foods | 74.2f | 87.7 |
| Waterd | 226.8 | 2.7 |
| Total daily intake | 301g | 90.4 |
| Betel quids (6) | 5 | 25 |
| TDI including 6 betel quids* | 306 | 115.4 |
a The quantity of food (fresh weight) consumed (g/day) was taken from a previous study [108].
b Animal products measured in this study from the UK markets.
c Other foods including dairy products, nuts, soft drinks, non-leafy vegetables.
d Estimated using data taken from Frisbie et al. [39].
e If 1 L of water (containing 84 µg/L As – Bangladeshi average [39]) is used to cook the rice, by the complete evaporation method, the As intake from rice will increase to 118.3 µg/day.
f If As from water (1 L with 84 µg/L As), used to cook the 500 g the rice by the complete evaporation method is included, the TDI from foods will increase to 158.2 µg/day.
g If As from water (1 L with 84 µg/L As), used to cook the 500 g the rice by the complete evaporation method, is included the TDI will increase to 385 µg/day.
* When six betel quids (non-food item) are included in the estimations. A previous study reported an average daily consumption of six betel quids by Bangladeshis [8].
Figures 2 and 3 show the percentage contribution to daily intake of As and Se for different Bangladeshi foods. Figure 2(A) shows that fish and steamed rice are the main source of As from food categories, whereas water (Fig. 2(B)) is the main contributor to daily intake of As in Bangladesh. Interestingly, fish and steamed rice were also the main sources of Se in the food category (Fig. 3(A)). Percent daily intake, excluding drinking water, for As and Se were 44 and 31% for steamed rice, respectively (Figs 2(A) and 3(A)), and 43 and 40% for fish, respectively (Table 3). Tables 4 and 5 show the TDI of As and Se around the world. The TDI of As for the present study was higher compared with other countries, with the exception of India (Table 4). If As contribution from water used to cook rice is included, the TDI for As increases further. For example, assuming 1 L of water, with an average of 84 µg/L of As [39], is used for cooking 500 g of rice (total As content of 34.3 µg) by the complete evaporation method, the daily intake of As from steamed rice will increase from 34.3 µg/day to 118.3 µg/day. This will increase the TDI for As from 301 µg/day to 385 µg/day. This is still lower than the TDI of As for the Indian population (see Table 4).
Fig. 2.
Daily intake of As from Bangladeshi foods. (A) Daily As intake (%) through different Bangladeshi foodstuffs (100% = 74.2 µg As per day), (B) Total Daily As intake (%) from all Bangladeshi foods and non-foods (betel quids), considered in the current study, including water (100% = 306 µg As per day). Six betel quids were included based on the questionnaire findings regarding daily consumption by Bangladeshis [8].
![Daily intake of As from Bangladeshi foods. (A) Daily As intake (%) through different Bangladeshi foodstuffs (100% = 74.2 µg As per day), (B) Total Daily As intake (%) from all Bangladeshi foods and non-foods (betel quids), considered in the current study, including water (100% = 306 µg As per day). Six betel quids were included based on the questionnaire findings regarding daily consumption by Bangladeshis [8].](https://content.iospress.com:443/media/bsi/2016/5-4/bsi-5-4-bsi154/bsi-5-bsi154-g002.jpg)
Fig. 3.
Daily intake of Se in Bangladeshi foods including betel quids. (A) Daily Se intake (%) through different Bangladeshi foodstuffs (100% = 87.7 µg Se per day), (B) Total Daily Se intake (%) for all Bangladeshi foods and non-foods, considered in the current study, including water (100% = 115.4 µg Se per day). Six betel quids were included based on the questionnaire findings regarding daily consumption by Bangladeshis [8].
![Daily intake of Se in Bangladeshi foods including betel quids. (A) Daily Se intake (%) through different Bangladeshi foodstuffs (100% = 87.7 µg Se per day), (B) Total Daily Se intake (%) for all Bangladeshi foods and non-foods, considered in the current study, including water (100% = 115.4 µg Se per day). Six betel quids were included based on the questionnaire findings regarding daily consumption by Bangladeshis [8].](https://content.iospress.com:443/media/bsi/2016/5-4/bsi-5-4-bsi154/bsi-5-bsi154-g003.jpg)
Table 4
Estimation of the total daily (TDI) intake of As around the world and its comparison with estimates from the current study
| Country | TDI of As (µg/day) | Reference |
| Austria | 27 | [105] |
| Australia/New Zealand | 30–41 | [42] |
| Bangladesh, Food | 68 | [58] |
| Bangladesh, Foods + water | 150 (43–490) | [79] |
| Bangladesh, Only vegetables | 105 | [55] |
| Bangladesh, Foods | 74 | Present study excluding non-foods |
| Bangladesh, Foods + water | 301 | Present study excluding betel quid |
| Bangladesh, Foods + water + cooking water in rice* | 385 | Present study excluding betel quid |
| Canada | 48.5 | [26] |
| Croatia | 11.7 | [88] |
| Denmark, mainly fish consumption | 118 | [62] |
| France | 109 | [64] |
| France | 46.8 | [12] |
| Germany | 6.9 (0.6–98) | [104] |
| India | 801 | [86] |
| Japan | 182 (27–376) | [76] |
| Japan | 160–280 | [100] |
| Korea | 38.5 | [65] |
| Mexico, in summer | 69.3 | [28] |
| Mexico, in winter | 56 | [28] |
| Pakistan | 83–104 | [11] |
| Spain | 221 | [29] |
| Spain | 245 | [30] |
| Sweden | 60 | [54] |
| Thailand | 105–406 | [102] |
| Thailand | 287 (68.2–564) | [87] |
| UK | 63 | [106] |
| UK | 55 | [40] |
| UK | 61–64 | [41] |
| USA | 155.2 | [89] |
| USA | 58.1 | [34] |
| USA | 195 | [23] |
Total daily intakes (TDI) of As for different countries around the world and compared with the estimation of the daily intake of As for Bangladeshis from the present study. Figures in parentheses give the range of measured values.
* This includes As from water used for cooking the rice by the complete evaporation method. This assumes 1 L of water, containing 84 µg/L As (Bangladeshi average according Frisbie et al. [39]), is used for cooking 500 g of rice containing a total 34.3 µg As.
Table 5
Estimation of the total daily intake (TDI) of Se for different countries around the world compared with estimation of the intake of Se for Bangladeshis
| Country | TDI of Se (µg/day) | Reference |
| Argentina | 24–32 | [91] |
| Australia | 57–87 | [37] |
| Australia/New Zealand | 97–171 | [42] |
| Bangladesh, Foods | 87.7 | Present study excluding water and betel quid |
| Bangladesh, Foods + Water | 90.4 | Present study excluding betel quid |
| Bangladesh, Foods + Water + 6 Betel quids | 115.4 | Present study including betel quid |
| Belgium | 28–61 | [85] |
| Brazil, Sao Paulo | 28–37 | [69] |
| Canada | 98–224 | [45] |
| China | 3–11 | [32] |
| China | 48 | [107] |
| China | 44 | [43] |
| China (Xian city) | 26 | [24] |
| China (Dashan village) | 115 | [15] |
| China (Shitai village) | 52 | [15] |
| Denmark | 48 | [62] |
| Finland, before use of Se fertilizer | 25 | [13] |
| Finland, after use of Se fertilizer | 67–110 | [10] |
| Finland (Vegans) | 79 | [36] |
| Finland (Non-vegetarians) | 149 | [36] |
| France | 42 | [63] |
| Greece | 39.2 | [80] |
| Hong Kong | 140 | [97] |
| India | 27–48 | [68] |
| Iran | 54.5 | [73] |
| Ireland | 50 | [78] |
| Italy | 43 | [3] |
| Japan | 104–199 | [74] |
| Japan | 118 | [75] |
| Japan | 129 | [49] |
| Korea | 58 | [22] |
| Libya | 13–44 | [35] |
| Lithuania | 100 | [46] |
| México | 61–73 | [103] |
| Nepal | 23 | [77] |
| Netherlands | 67 | [38] |
| Norway | 80 | [72] |
| Poland | 25 | [92] |
| Poland | 41 | [53] |
| Saudi Arabia | 93 | [5] |
| Saudi Arabia | 75–122 | [4] |
| Scotland, UK | 30–60 | [67] |
| Slovenia | 87 | [93] |
| Slovenia | 48 | [82] |
| Spain | 32.3 | [31] |
| Spain | 60 | [32] |
| Sweden | 38 | [32] |
| Switzerland | 70 | [32] |
| Thailand | 44.1–91 | [102] |
| Turkey | 30 | [32] |
| UK | 34 | [16] |
| UK | 32–34 | [40] |
| UK | 48–58 | [41] |
| USA | 110–126 | [34] |
| USA | 60–160 | [66] |
The highest daily As intake in Bangladesh comes from drinking water (226.8 µg/day; [39]). However, very low Se concentration (<3.0 µg/L) in Bangladeshi groundwater has been reported, with a daily intake of Se from drinking water of 2.7 µg/day [39]. Based on the current study, beans and lentils (3.9 µg Se/day) contribute 4% to the total daily intake of Se (see Fig. 3(A)). When betel-quid (non-food) and water is included in the estimation, our study revealed that consuming six betel quids can provide 25 µg of Se per day which is equivalent to 21.7% of the total intake of Se (see Fig. 3(B)). The relatively high TDI of Se for the present study suggests that Bangladeshis consume higher quantities of Se than many other countries around the world including highly developed countries in Europe and elsewhere (Table 5).
4.Discussion
This is the first study to comprehensively determine the TDI of Se for a Bangladeshi population. Furthermore, the total intake of As was determined based on As content of the largest number and the most diverse range of foods ever considered for a Bangladeshi population. Betel quid, as a non-food item, is widely consumed in Bangladesh [8] and therefore its contribution in the dietary intake of As and Se was included in the current study. The consumption of baked clay is much less widespread and therefore it has not been included in the estimations.
In Bangladesh, As contaminated groundwater is often used for irrigation of crops and vegetables. Therefore, it is a potential route of entry of As and other toxic elements into crops and vegetables grown in the As contaminated areas. Some reported studies of As concentrations of Bangladeshi vegetables sampled various vegetables from regions of Bangladesh that are known to have high concentration of As in the ground water [2,27,55]. Alam et al. [2] reported that the highest concentrations of As were detected in different types of vegetables including ghotkol, taro (loti from Arum plant) and snake gourd at 446, 440 and 489 µg/kg (dry weight) respectively, and a mean of 225 µg/kg (dry weight) for all vegetables. In the discussion below, we have converted our fresh weight values to dry weight values so that comparison could be made with the latter and other studies which reported their data in the form of dry weight. The mean As concentration in leafy vegetable determined in the current study was much lower than that reported by Alam et al. [2]: 96 vs. 225 µg/kg dry weight. In another study, leafy vegetables from Bangladesh were found to contain As over the range 90 to 3,990 µg/kg (dry weight) [27], whereas for the current study the range was 17–278 µg/kg (dry weight). In both of the previous studies [2,27] vegetables were selected from regions of Bangladesh that are known to contain very high concentration of As in the groundwater. However, in the present study, it was not possible to establish whether or not the vegetables, which were sold in the UK markets, came from As affected regions of Bangladesh. Furthermore, we did not have sufficient information in certain cases to be sure that the foods originated from Bangladesh and in some cases we had to rely on As and Se contents of some products that are from other countries. This is one of the limitations of the current study which relied on many foods (especially vegetables and spices) sold in the UK ethnic shops instead of collecting them directly from Bangladesh. This problem is not applicable to rice, which were obtained directly from Bangladesh. Overall, the As intake reported in the current study may be an under-estimation.
Rice contained high concentrations of As (Fig. 1) and Bangladeshis consume large quantities of rice per day (approximately 500 g dry weight). Previously, we [9] and others [70] have determined As concentrations in different types of Bangladeshi rice. We reported that Bangladeshi aromatic rice contained relatively low concentration of As (48.5 µg/kg), compared to non-aromatic rice at 81 µg/kg [9]. Others found the mean of total As in Bangladeshi rice was 130 µg/kg [70], which is considerably higher than the As concentration (68.5 µg/kg) found in rice in the current study (Fig. 1). Nevertheless, As in rice even at this latter concentration does contribute a high proportion to daily intake of As, which was estimated to be 44% of TDI (calculated excluding drinking water). This contribution will further increase if As from water, that is used to cook the rice, is included. In a recent study we showed that exposure to As can be reduced by consuming aromatic rice instead of non-aromatic rice [9]. Consumption of aromatic rice, instead of an equivalent quantity of non-aromatic rice, can reduce the TDI (excluding drinking water and water used for cooking rice) of As to 32.4% of TDI, i.e. ca. 26% reduction.
Hilsha fish and its eggs contained the highest concentrations of As. This fish migrates from the sea to inland rivers to spawn [50]. The relatively high concentrations of As in this sea fish is not surprising since fish from the sea are known to contain higher concentration of As compared to freshwater fish [60]. Like with other fish from the sea, most of the As in Hilsha is likely to be organoarsenic compounds, such as arsenobetaine and arsenocholine. Hilsha is the single largest and most valuable fish in Bangladesh, contributing between 22–25% of the total fish production in the country [14]. It is the national fish of Bangladesh and is very popular across the country. However, in recent years its price has risen to such an extent that it is beyond the reach of the poorest consumers.
Daily intake of As from all vegetables was estimated to be 5.16 µg/day (7% of TDI of foods), with leafy vegetables contributing to half of this intake (Table 3). The data presented in this study shows that Bangladeshis are exposed to higher concentrations of As from steamed rice consumption (46% of TDI of foods) compared to vegetable consumption (7% of TDI of foods). This does not include As from water that is used for cooking rice. In our previous study we have shown that the As in Bangladeshi rice is predominately inorganic [9]. However, more detailed speciation of As in other Bangladeshi foods, including fish, are required to carry out a full risk assessment of the impact of dietary As on human health in Bangladesh.
The daily intake of As in Bangladesh was found to be 301 µg/day when including drinking water (daily intake from foods is 74 µg/day). If As from water, used to cook rice (500 g with 1 L of water), is included the TDI increases to 385 µg/day. These values are higher than that for the Japanese population (160–280 µg/day; [100]) and is much higher than that reported previously for the daily intake for other countries, with the exception of a region in India (West Bengal) where the daily intake of As was reported to be 801 µg/day [86]. In contrast to levels found in the current study, Kile et al. [58] reported that the daily intake of As in Bangladesh, based on a duplicate diet survey (excluding water), was 68 µg/day (median value). Another study on Bangladesh reported that the mean daily intake of As from water and food was 150 µg/day (range 43–490) [79]. The TDI for As from the Kile et al. [58] study was very similar to the finding in the current study for foods (74 µg/day), which shows that both the As concentration in Bangladeshi foods and the daily consumption are similar for these studies. However, if As from water, used to cook the rice is included, the TDI of As from foods estimated in our study is much higher (158.2 µg/day). Kile et al. [58] found that when the As concentration in the drinking water is low, the main contributor to As intake comes from food. Their study focused on the Pabna region of Bangladesh and the situation may be different for other regions. More recently, a value of 105 µg/day, just from consumption of vegetables was estimated for Bangladeshis [55] (see Table 4). Although there are differences in the estimates of daily intake between different studies, overall the concentration of As in the Bangladeshi diet is very high and may explain the observation of adverse health outcomes in the Bangladeshi population. Rice is a major contributor of dietary As in Bangladesh and a recent study has shown a correlation between As exposure and rice consumption in Bangladeshis [71].
Deficiency of essential elements (such as Se) can be harmful for the human body. Se is an antioxidant element which has been suggested to counteract As toxicity [51]. Thus deficiency in the intake of Se could result in an increase in As induced ill health in the Bangladeshi population [95]. Hence, it is important to include in the diet foods that are rich in this essential element. In a previous study on vegetables from India, Se concentrations in leafy and non-leafy vegetables were determined [86]. Se concentrations reported by these researchers were 0.72, 8.4, 0.2 and 223 µg/kg fresh weight for leafy vegetables, beans, spinach and lentil, respectively. With the exception of Se concentration in lentils, the concentrations for the vegetables in the Indian study are lower than the findings of the current study (see Table S1) for Bangladeshi vegetables (Se concentration in lentil was 152 µg/kg; generally, lentils contained the highest concentration of Se in all the cereals and vegetables analysed). In a previous UK study, Se in green vegetables, potatoes and other vegetables were found to be 10, 8 and 20 µg/kg fresh weight, respectively [106]. These concentrations are lower than those determined for the Bangladeshi vegetables presented in the current study (Fig. 1 and Table S1). Daily intakes of Se from green vegetables consumption for Bangladeshis were estimated (in the current study) to be 8.7 µg/day (Table 3). In a recent study we have shown that Se concentration in aromatic rice is much higher compared to non-aromatic rice [9].
The TDI of the essential element Se for Bangladeshis, estimated in the present study, was 90.4 µg/day. Bangladeshi rice and fish are the main contributors to the daily intake of Se. We have revealed, for the first time, that betel quids can be a significant source of Se for Bangladeshis, providing 25 µg/day for someone consuming six betel quids. However, betel quids generally contain tobacco and also has elements that are harmful to human health [8]. Many Bangladeshis are known to consume betel quids on a daily basis and we used an average daily intake of six betel quids, for our calculations, based on a questionnaire analysis [8]. Countries with adequate Se in their diet includes include Japan and the USA. The TDI of Se was estimated to be 118 and 110–126 µ g/day for Japan and USA, respectively [34,75]. The TDI for Japanese and American populations were similar to that estimated for Bangladeshis in the present study, which suggests that Bangladeshis do not have a diet that is deficient in Se. This is in contrast to Spallholz et al. [95] who suggested that Bangladeshi foods are likely to have low concentration of this element, based on Bangladeshi soils containing low concentration of Se [94]. The high Se content of foods analysed in the present study may not be representative of all Bangladeshi foods, leading to an overestimate of the TDI for Se. However, the high estimate for the Se intake is consistent with the blood Se status of Bangladeshis reported by others [21,44] who found a mean concentration of 150.2 µg/L and 127 µg/L, respectively. Such high blood Se concentrations are similar to values found in populations that are known to have sufficient Se in their diet such as the USA [19]. Furthermore, there is no evidence in the literature for any disease among Bangladeshis related to Se deficiency, such as Keshan disease.
Selenium has been suggested to counteract the toxicity of As and researchers are carrying out clinical trials on As exposed Bangladeshi population by giving them Se supplements [1]. In this trial, Bangladeshis from Chandpur district were fed 200 µg of sodium selenite per day. More recently, a clinical trial is underway feeding a group of Bangladeshis lentil that have high Se content with a view to increase their Se intake [59]. Lentil is a popular food in Bangladesh and contains high levels of other nutrients that are deficient in many in Bangladeshis, including proteins. However, it is unfortunate that these supplementation trials did not discuss earlier studies that have revealed high blood Se levels for Bangladeshis [21,44]. Our estimate of the Se intake (current study) also suggests that Bangladeshis are not deficient in Se and are consistent with literature reports on high blood Se levels in Bangladeshis [21,44]. Considering these facts, a detailed Se status of Bangladeshis is needed especially because there are conflicting reports on the effects of Se supplementation on cancer and diabetes for other populations [52,84]. One of the leading experts on Se and human health, Margaret Rayman, has reviewed the literature and concluded that the effects of Se on human health are multiple and complex [84]. She also stressed that Se supplementation should only be undertaken in populations with low or relatively low selenium status. In her article [84], she discussed the findings of the Nutritional Prevention of Cancer (NPC) trial in the USA which showed increased risks of cancer, non-melanoma skin cancer and type-2 diabetes with selenium supplementation. On the basis of these results Rayman [84] states the following: “The implications are clear: people whose serum or plasma selenium concentration is already 122 µg/L or higher – a large proportion of the US population – should not supplement with selenium.” In light of this, it needs to be pointed out that blood Se levels for Bangladeshis, in some cases, exceed the latter limit with one study showing blood Se levels [21] as high as 259 µg/L (range 88.5–258.8 µg/L; mean 150.1 µg/L). A more recent study [44] also showed very high blood Se levels for a Bangladeshi population (range 59.5–222 µg/L; average 127 µg/L). Ivory et al. [52] found beneficial and detrimental effects on cellular immunity towards flu when a healthy population in the UK, with marginal Se status, were given Se supplements. On the basis of their findings, they highlighted the need for a thorough investigation of the risks and benefits of Se-supplementation. They stressed that this is particularly important for those who are vulnerable, chronically ill and the elderly [52].
It is important to note that many Bangladeshis do not have a balanced diet and often lack sufficient quantities of animal products. Se intake from animal products, other than fish, is very low. The high blood Se levels reported in previous studies [21,44] could be due to Se derived from betel quids rather than from foods. This needs to be investigated in the future. The Bangladeshi population could have a limited intake of certain Se species that are found in animal products, especially meat. They may have a lower intake of selenomethionine and selenocysteine, which are the predominant Se species found in meat consumed by humans [101]. Furthermore, it has been previously reported that meat is an important source of bioavailable Se [18]. Elorinne et al. [36] reported that Se intake for vegans (79 µg/day) was much lower compared to non-vegetarians (149 µg/day). The difference was attributed to the fact that over 70% of the Se intake in the Finnish population is derived mainly from animal products.
A recent study reported that blood Se is inversely associated with urinary As in both children and adults in Bangladesh [44]. The authors suggested that Se may interact with As to form an Se-As conjugate, using a glutathione complex, facilitating the biliary elimination of As. It is possible that this loss of Se through conjugation with As, and excretion via the biliary system, may result in a deficiency of essential Se for Bangladeshis with a high intake of As. We recommend further studies to investigate the Se status of Bangladeshis in order to evaluate the need for supplementation and other changes in their diet.
The present article is one of the most detailed evaluations of the TDI for As and Se for Bangladeshis residing in Bangladesh. However, we were limited to the analysis of only a selection of foods consumed in Bangladesh and relied on many foods that were sold in the UK. We also relied on food intake from a previous study focusing on a specific As affected region (Araihazar) of Bangladesh and this may not reflect the general diet of Bangladeshis in other regions. Therefore, more comprehensive studies are necessary, including a total diet study in Bangladesh where foods grown in arsenic affected and non-affected regions are compared along with human biomonitoring studies. Such studies would reveal the extent of As exposure, and possible Se deficiency, paving the way for establishing appropriate public health improvement programmes. A comprehensive human biomonitoring program, similar to the National Health and Nutrition Examination Survey (NHANES) in the USA, is needed in Bangladesh. This would ensure that clinical trials and other intervention projects are initiated with adequate background data.
5.Conclusion
For the first time the total dietary intake of Se in the Bangladeshi population has been estimated through data derived from analysis of rice, vegetables, fish and non-foods using ICP-MS. Rice and fish were the main dietary source of Se. A surprise finding of our study was the high contribution of Se from betel quids which has not been previously discussed. In contrast to what has been suggested by others, we found the intake of Se through the Bangladeshi diet was similar to that reported for populations in other countries with sufficient Se intake, including the USA. This may explain why the blood Se concentrations in Bangladeshis was reported to be similar to that seen in the USA population. Therefore, a comprehensive study on the Se status of Bangladeshis is needed. There is no doubt that Bangladeshis have low intake of animal products, which suggests that they have a reduced intake of certain Se species. However, rigorous scientific research is needed to establish the existing Se intake and status (analysis of foods and blood etc) before initiating supplementation trials. Although high concentration of As were detected in leafy vegetables, such as lal shak (Amaranthus gangeticus), non-leafy vegetables can contribute towards lowering the intake of toxic elements and raising the intake of Se. The data indicates that Bangladeshis are exposed to high concentration of As from their diet and that a multipronged strategy is required to reduce their exposure to As. This could include changes in agricultural practices that reduce entry of As and other toxic elements in the food chain, and appropriate modification of the Bangladeshi diet to lower the intake of foods that are very high in As. Increasing the consumption of foods that contain high concentration of Se and low As, such as lentils and animal products, would be desirable for Bangladeshis identified to have low Se status. The consumption of aromatic rice, instead of non-aromatic rice, which we have previously shown to have low As and higher concentration of Se and Zn, could also be considered for such groups [9].
References
[1] | M. Alauddin, T. Wheaton, M. Valencia, E. Stekolchik, J.E. Spallholz, P.F. La Porte, S. Ahmed, B. Chakaraborty, M. Bhattacharjee, A.B.M. Zakaria and S. Sultana, Clinical trial involving selenium supplementation to counter arsenic toxicity among rural population in Bangladesh, in: Understanding the Geological and Medical Interface of Arsenic-As 2012: Proceedings of the 4th International Congress on Arsenic in the Environment, 22–27 July, 2012, Cairns, Australia, CRC Press, (2012) , p. 143. |
[2] | M.G.M. Alam, E.T. Snow and A. Tanaka, Arsenic and heavy metal contamination of vegetables grown in Samta village, Bangladesh, Science of the Total Environment 308: ((2003) ), 83–96. doi:10.1016/S0048-9697(02)00651-4. |
[3] | M. Allegrini, E. Lanzola and M. Gallorini, Dietary selenium intake in a coronary heart disease study in northern Italy, Nutrition Research 5: ((1985) ), S-398–S-402. |
[4] | K.M. Al-Ahmary, Selenium content in selected foods from the Saudi Arabia market and estimation of the daily intake, Arabian Journal of Chemistry 2: ((2009) ), 95–99. doi:10.1016/j.arabjc.2009.10.004. |
[5] | A.M. Al-Othman, Z.A. Al-Othman, G.E. El-Desoky, M.A. Aboul-Soud, M.A. Habila and J.P. Giesy, Daily intake of selenium and concentrations in blood of residents of Riyadh City, Saudi Arabia, Environmental Geochemical Health 34: ((2012) ), 417–431. doi:10.1007/s10653-011-9448-5. |
[6] | S.W. Al-Rmalli, P.I. Haris, C.F. Harrington and M. Ayub, A survey of arsenic in foodstuffs on sale in the United Kingdom and imported from Bangladesh, Science of the Total Environment 337: ((2005) ), 23–30. doi:10.1016/j.scitotenv.2004.06.008. |
[7] | S.W. Al-Rmalli, R.O. Jenkins, M.J. Watts and P.I. Haris, Risk of human exposure to arsenic and other toxic elements from geophagy: Trace element analysis of baked clay using inductively coupled plasma mass spectrometry, Environmental Health 9: ((2010) ), 79. doi:10.1186/1476-069X-9-79. |
[8] | S.W. Al-Rmalli, R.O. Jenkins and P.I. Haris, Betel quid chewing elevates human exposure to arsenic, cadmium and lead, Journal of Hazardous Materials 190: (1–3) ((2011) ), 69–74. doi:10.1016/j.jhazmat.2011.02.068. |
[9] | S.W. Al-Rmalli, R.O. Jenkins, M.J. Watts and P.I. Haris, Reducing human exposure to arsenic, and simultaneously increasing selenium and zinc intake, by substituting non-aromatic rice with aromatic rice in the diet, Biomedical Spectroscopy and Imaging 1: ((2012) ), 365–381. |
[10] | M. Anttolainen, L.M. Valsta, G. Alfthan and P. Keemola, Effect of extreme fish consumption on dietary and plasma antioxidant levels and fatty acid composition, European Journal of Clinical Nutrition 5: ((1996) ), 741–746. |
[11] | M.B. Arain, T.G. Kazi, J.A. Baig, M.K. Jamali, H.I. Afridi, A.Q. Shah, N. Jalbani and R.A. Sarfraz, Determination of arsenic levels in lake water, sediment, and foodstuff from selected area of Sindh, Pakistan: Estimation of daily dietary intake, Food and Chemical Toxicology 47: ((2009) ), 242–248. doi:10.1016/j.fct.2008.11.009. |
[12] | N. Arnich, V. Sirot, G. Riviere, J. Jean, L. Noël, T. Guerin and J.C. Leblanc, Dietary exposure to trace elements and health risk assessment in the 2nd French Total Diet Study, Food and Chemical Toxicology 50: ((2012) ), 2432–2449. doi:10.1016/j.fct.2012.04.016. |
[13] | A. Aro, G. Alfthan and P. Varo, Effects of supplementation of fertilizers on human selenium status in Finland, Analyst 120: ((1995) ), 841–843. doi:10.1039/an9952000841. |
[14] | B.K. Bala, F.M. Arshad, E.F. Alias, S.F. Sidique, K.M. Noh, M.K. Rowshon and M.M. Islam, Sustainable exploitation of hilsa fish (Tenualosa ilisha) population in Bangladesh: Modeling and policy implications, Ecological Modelling 283: ((2014) ), 19–30. doi:10.1016/j.ecolmodel.2014.03.013. |
[15] | G.S. Bañuelos, J. Tang, Y. Hou, X. Yin and L. Yuan, Environmental pathways and dietary intake of selenium in a selenium rich rural community in China: A natural biofortification case study, in: Global Advances in Selenium Research from Theory to Application: Proceedings of the 4th International Conference on Selenium in the Environment and Human Health 2015, CRC Press, (2015) , p. 147. doi:10.1201/b19240-75. |
[16] | M.N.I. Barclay, A. MacPherson and J. Dixon, Selenium content of a range of UK foods, Journal of Food Composition & Analysis 8: ((1995) ), 307–318. doi:10.1006/jfca.1995.1025. |
[17] | A. Bernard, Cadmium & its adverse effects on human health, Indian Journal of Medical Research 128: ((2008) ), 557–564. |
[18] | H.K. Biesalski, Meat as a component of a healthy diet – Are there any risks or benefits if meat is avoided in the diet?, Meat Science 70: (3) ((2005) ), 509–524. doi:10.1016/j.meatsci.2004.07.017. |
[19] | J. Bleys, A. Navas-Acien and E. Guallar, Serum selenium and diabetes in U.S. adults, Diabetes Care 30: ((2007) ), 829–834. doi:10.2337/dc06-1726. |
[20] | C. Cascio, A. Raab, R.O. Jenkins, J. Feldmann, A.A. Meharg and P.I. Haris, The impact of a rice based diet on urinary arsenic, Journal of Environmental Monitoring 13: ((2010) ), 257–265. doi:10.1039/C0EM00482K. |
[21] | Y. Chen, M. Hall, J.H. Graziano, V. Slavkovich, A. Van Geen, F. Parvez and H. Ahsan, A prospective study of blood selenium levels and the risk of arsenic – Related premalignant skin lesions, Cancer Epidemiological Biomarkers Prev. 16: ((2007) ), 207–213. doi:10.1158/1055-9965.EPI-06-0581. |
[22] | Y. Choi, J. Kim, H.S. Lee, C.I. Kim, I.K. Hwang, H.K. Park and C.H. Oh, Selenium content in representative Korean foods, Journal of Food Composition and Analysis 22: ((2009) ), 117–122. doi:10.1016/j.jfca.2008.11.009. |
[23] | B. Cleland, A. Tsuchiya, D.A. Kalman, R. Dills, T.M. Burbacher, J.W. White, E.M. Faustman and K. Marien, Arsenic exposure within the Korean community (United States) based on dietary behavior and arsenic levels in hair, urine, air, and water, Environmental Health Perspectives 117: ((2009) ), 632–638. doi:10.1289/ehp.11827. |
[24] | Z.W. Cui, R. Wang, J. Huang, D.L. Liang and Z.H. Wang, Selenium content of food and estimation of dietary intake in Xi’an, China, in: Global Advances in Selenium Research from Theory to Application: Proceedings of the 4th International Conference on Selenium in the Environment and Human Health 2015, CRC Press, (2015) , p. 99. |
[25] | National Academy of Sciences, Trace elements, in: Recommended Dietary Allowances, National Academy Press, Washington, D.C., (1989) , pp. 195–246. |
[26] | R.W. Dabeka, A.D. McKenzie, G.M.A. Lacroix, C. Cleroux, S. Bowe, R.A. Graham, H.B.S. Conaher and P. Verdier, Survey of arsenic in total diet food composites and estimation of the dietary intake of arsenic by Canadian adults and children, Journal of AOAC International 76: ((1993) ), 14–25. |
[27] | H.K. Das, A.K. Mitra, P.K. Sengupta, A. Hossain, F. Islam and G.H. Rabbani, Arsenic concentrations in rice, vegetables, and fish in Bangladesh: A preliminary study, Environment International 30: ((2004) ), 383–387. doi:10.1016/j.envint.2003.09.005. |
[28] | L.M. Del Razo, G.G. Garcia-Vargas, J. Garcia-Salcedo, M.F. Sanmiguel, M. Rivera and M.C. Hernandez, Arsenic levels in cooked food and assessment of adult dietary intake of arsenic in the Region Lagunera, Mexico Cebriana, Food and Chemical Toxicology 40: ((2002) ), 1423–1431. doi:10.1016/S0278-6915(02)00074-1. |
[29] | C. Delgado-Andrade, M. Navarro, H. Lopez and M.C. Lopez, Determination of total arsenic levels by hydride generation atomic absorption spectrometry in foods from South-East Spain: Estimation of daily dietary intake, Food Additives and Contaminants 20: ((2003) ), 923–932. doi:10.1080/02652030310001594450. |
[30] | V. Devesa, M.L. Macho, M. Jalón, I. Urieta, O. Muñoz, M.A. Súñer, F. Lopez, D. Velez and R. Montoro, Arsenic in cooked seafood products: Study on the effect of cooking on total and inorganic arsenic contents, Journal of Agricultural and Food Chemistry 49: ((2001) ), 4132–4140. doi:10.1021/jf010274l. |
[31] | J.P. Diaz-Alarcon, M. Navarro, H. Lopez and M.C. Lopez, Determination of selenium in meat products by hydride generation atomic absorption spectrometry – Se levels in meat, organ meat, and sausages in Spain, Journal of Agricultural Food Chemistry 44: ((1996) ), 494–497. |
[32] | E. Dumont, F. Vanhaecke and R. Cornelis, Selenium speciation from food source tometabolites: A critical review, Analytical & Bioanalytical Chemistry 385: ((2006) ), 1304–1323. doi:10.1007/s00216-006-0529-8. |
[33] | J.M. Duxbury, A.B. Mayer, J.G. Lauren and N. Hassan, Food chain aspects of arsenic contamination in Bangladesh: Effects on quality and productivity of rice, Journal of Environmental Sciene and Health Part A – Toxic/Hazardous Substances & Environmental Engineering 38: ((2003) ), 61–69. |
[34] | S.K. Egan, S.S. Tao, J.A. Pennington and P.M. Bolger, US Food and Drug Administration’s Total Diet Study: Intake of nutritional and toxic elements, 1991–1996, Food Additives & Contaminations 19: ((2002) ), 103–125. |
[35] | U.M. El-Ghawi, A.A. Al-Sadeq, M.M. Bejey and M.B. Alamin, Determination of selenium in Libyan food items using pseudocyclic instrumental neutron activation analysis, Biological Trace Elements Research 107: ((2005) ), 61–71. doi:10.1385/BTER:107:1:061. |
[36] | A.L. Elorinne, G. Alfthan, I. Erlund, H. Kivimäki, A. Paju, I. Salminen, U. Turpeinen, S. Voutilainen and J. Laakso, Food and nutrient intake and nutritional status of Finnish vegans and non-vegetarians, PloS One 11: (2) ((2016) ), e0148235. doi:10.1371/journal.pone.0148235. |
[37] | J.J. Fardy, G.D. McOrist and Y.J. Farrar, The determination of selenium status in the Australian diet using neutron activation analysis, Journal of Radioanalytical and Nuclear Chemistry 133: ((1989) ), 397–405. doi:10.1007/BF02060512. |
[38] | L.H. Foster and S. Sumar, Selenium in health and disease: A review, Crit. Rev. Food Science & Nutrition 37: ((1997) ), 211–228. doi:10.1080/10408399709527773. |
[39] | S.H. Frisbie, R. Ortega, D.M. Maynard and B. Sarkar, The concentrations of arsenic and other toxic elements in Bangladesh’s drinking water, Environmental Health Perspectives 110: ((2002) ), 1147–1153. doi:10.1289/ehp.021101147. |
[40] | FSA, Expert group on vitamins and minerals, revised review of selenium. evm/99/17.revised Aug2002, Food Standard Agency, 2002. |
[41] | FSA, Measurement of the concentrations of metals and other elements from the 2006 UK total diet study, Food Standard Agency, 2009. |
[42] | FSANZ (Food Standards Australia New Zealand), 23rd Australian Total Diet Study, 2011, https://www.foodstandards.gov.au/publications/documents/FSANZ%2023rd%20ATDS_v8_.pdf (Last accessed 5, 2015). |
[43] | J. Gao, Y. Liu, Y. Huang, Z.-Q. Lin, G.S. Banuelos, M.H.-W. Lam and X. Yin, Daily selenium intake in a moderate selenium deficiency area of Suzhou, China, Food Chemistry 125: ((2011) ), 1088–1093. doi:10.1016/j.foodchem.2010.11.137. |
[44] | C.M. George, M. Gamble, V. Slavkovich, D. Levy, A. Ahmed, H. Ahsan and J. Graziano, A cross-sectional study of the impact of blood selenium on blood and urinary arsenic concentrations in Bangladesh, Environ Health 12: ((2013) ), 52. doi:10.1186/1476-069X-12-52. |
[45] | G. Gissel-Nielsen, Effects of selenium supplementation of field crops, in: Environmental Chemistry of Selenium, W.T. Frankenberger and R.A. Engberg, eds, Marcel Dekker, New York, (1998) , pp. 99–112. |
[46] | N.A. Golubkina, M.V. Shagova and V.B. Spirichev, Selenium intake by the population of Lithuania, Vopr Pitan 1: ((1992) ), 35–37. |
[47] | T.E. Gunter, C.E. Gavin, M. Aschner and K.K. Gunter, Speciation of manganese in cells and mitochondria: A search for the proximal cause of manganese neurotoxicity, Neurotoxicology 27: ((2006) ), 765–776. doi:10.1016/j.neuro.2006.05.002. |
[48] | D. Hafeman, H. Ahsan, T. Islam and E. Louis, Betel quid: Its tremor-producing effects in residents of Araihazar, Bangladesh, Movement Disorders 21: ((2006) ), 567–571. doi:10.1002/mds.20754. |
[49] | K. Hirai, K. Noda and H. Danbara, Selenium intake based on representative diets in Japan, 1957 to 1989, Nutrition Research 16: ((1996) ), 1471–1477. doi:10.1016/0271-5317(96)00160-1. |
[50] | M.S. Hossain, S. Sarker, S.R. Chowdhury and S.M. Sharifuzzaman, Discovering spawning ground of Hilsa shad (Tenualosa ilisha) in the coastal waters of Bangladesh, Ecological Modelling 282: ((2014) ), 59–68. doi:10.1016/j.ecolmodel.2014.03.001. |
[51] | Y.M. Hsueh, Y.F. Ko, Y.K. Huang, H.W. Chen, H.Y. Chiou, Y.L. Huang, Y. Mo-Hsiung and C.J. Chen, Determinants of inorganic arsenic methylation capability among residents of the Lanyang Basin, Taiwan: Arsenic and selenium exposure and alcohol consumption, Toxicology Letters 137: ((2003) ), 49–63. doi:10.1016/S0378-4274(02)00380-6. |
[52] | K. Ivory, E. Prieto, C. Spinks, C.N. Armagh, A.J. Goldson, J.R. Dainty and C. Nicoletti, Selenium supplementation has beneficial and detrimental effects on immunity to influenza vaccine in older adults, Clinical Nutrition (2015). doi:10.1016/j.clnu.2015.12.003. |
[53] | E. Jablonska, J. Gromadzinska, A. Klos, J. Bertrandt, K. Skibniewska, A. Darago and W. Wasowicz, Selenium, zinc and copper in the Polish diet, Journal of Food Composition and Analysis 31: (2) ((2013) ), 259–265. doi:10.1016/j.jfca.2013.05.016. |
[54] | L. Jorhem, W. Becker and S. Slorach, Intake of 17 elements by Swedish women, determined by a 24-h duplicate portion study, Journal of Food Composition and Analysis 11: ((1998) ), 32–46. doi:10.1006/jfca.1998.0562. |
[55] | R.A. Karim, S.M. Hossain, M.M.H. Miah, K. Nehar and M.S.H. Mubin, Arsenic and heavy metal concentrations in surface soils and vegetables of Feni district in Bangladesh, Environmental Monitoring and Assessment 145: ((2008) ), 417–425. doi:10.1007/s10661-007-0050-3. |
[56] | T. Kassam-Khamis, P.A. Judd and J.E. Thomas, Frequency of consumption and nutrient composition of composite dishes commonly consumed in the UK by South Asian Muslims originating from Bangladesh, Pakistan and East Africa (Ismailis), Journal of Human Nutritional Dietary 13: ((2000) ), 185–196. doi:10.1046/j.1365-277x.2000.00230.x. |
[57] | A.P. Kipp, D. Strohm, R. Brigelius-Flohé, L. Schomburg, A. Bechthold, E. Leschik-Bonnet, H. Heseker and G.N.S. Dge, Revised reference values for selenium intake, Journal of Trace Elements in Medicine and Biology 32: ((2015) ), 195–199. doi:10.1016/j.jtemb.2015.07.005. |
[58] | M.L. Kile, E.A. Houseman, C.V. Breton, T. Smith, O. Quamruz Zaman, M. Rahman, G. Mahiuddin and D.C. Christiani, Dietary arsenic exposure in Bangladesh, Environmental Health Perspectives 115: ((2007) ), 889–893. doi:10.1289/ehp.9462. |
[59] | R.M. Krohn, R. Raqib, E. Akhtar, A. Vandenberg and J.E. Smits, A high-selenium lentil dietary intervention in Bangladesh to counteract arsenic toxicity: Study protocol for a randomized controlled trial, Trials 17: (1) ((2016) ), 1. doi:10.1186/s13063-015-1128-9. |
[60] | T. Kunito, R. Kubota, J. Fujihara, T. Agusa and S. Tanabe, Arsenic in marine mammals, seabirds, and sea turtles, in: Reviews of Environmental Contamination and Toxicology, Springer, New York, (2008) , pp. 31–69. doi:10.1007/978-0-387-77030-7_2. |
[61] | H.J.S. Larsen, Relations between selenium and immunity, Norwegian Journal of Agricultural Sciences Supplement 11: ((1993) ), 105–119. |
[62] | E.H. Larsen, N.L. Andersen, A. Muller, A. Petersen, G.K. Mortensen and J. Petersen, Monitoring the content and intake of trace elements from food in Denmark, Food Additives and Contaminants 19: ((2002) ), 33–46. doi:10.1080/02652030110087447. |
[63] | J.C. Leblanc, T. Guérin, L. Noël, G. Calamassi-Tran, J.L. Volatier and P. Verger, Dietary exposure estimates of 18 elements from the 1st French Total Diet Study, Food Additives and Contaminants 22: ((2005) ), 624–641. doi:10.1080/02652030500135367. |
[64] | M. Leblanc, J.A. Morales, J. Borrego and F. Elbaz-Poulichet, 450-year-old mining pollution in southwestern Spain: Long-term implications for modern mining pollution, Econ. Geol. 95: ((2000) ), 655–662. |
[65] | H. Lee, Y. Cho, S. Park, S. Kye, B. Kim, T. Hahm, M. Kim, J. Lee and C. Kim, Dietary exposure of the Korean population to arsenic, cadmium, lead and mercury, Journal of Food Composition and Analysis 19: ((2006) ), S31–S37. doi:10.1016/j.jfca.2005.10.006. |
[66] | M.P. Longnecker, P.R. Taylor, O.A. Levander, S.M. Howe, C. Veillon and P.A. McAdam, Selenium in diet, blood, and toenails in relation to human health in a seleniferous area, American Journal Clinic & Nutrition 53: ((1991) ), 1288–1294. |
[67] | A. MacPherson, M.N. Barclay, R. Scott and R.W. Yates, Loss of Canadian wheat imports lowers selenium intake and status of the Scottish population, in: Trace Elements in Man and Animals, P.W. Fischer, M.R. L’Abbe, K.A. Cockell and R.S. Gibson, eds, NRC Research Press, Ottawa, (1997) , pp. 203–205. |
[68] | T.R. Mahalingam, S. Vijayalakshmi, R. Krishna Prabhu, A. Thiruvengadasami, A. Wilber, C.K. Mathews and K. Radha Shanmugasundaram, Studies on some trace and minor elements in blood: A survey of the Kalpakkam (India) population – Part III: Studies on dietary intake and its correlation to blood levels, Biological Trace Element Research 57: ((1997) ), 223–238. doi:10.1007/BF02785291. |
[69] | V.A. Maihara, I.B. Gonzaga, V.L. Silva, D.I.T. Fávaro, M.B.A. Vasconcellos and S.M.F. Cozzolino, Daily dietary selenium intake of selected Brazilian population groups, Journal of Radioanalytical and Nuclear Chemistry 259: ((2004) ), 465–468. doi:10.1023/B:JRNC.0000020919.58559.dd. |
[70] | A.A. Meharg, P.N. Williams, E. Adomako, Y.Y. Lawgali, C. Deacon, A. Villada, R.C.J. Cambell, G. Sun, Y.G. Zhu, J. Feldmann, A. Raab, F.J. Zhao, R. Islam, S. Hossain and J. Yanai, Geographical variation in total and inorganic arsenic content of polished (white) rice, Environmental Science & Technology 43: ((2009) ), 1612–1617. doi:10.1021/es802612a. |
[71] | S. Melkonian, M. Argos, M.N. Hall, Y. Chen, F. Parvez, B. Pierce, H. Cao, B. Aschebrook-Kilfoy, A. Ahmed, T. Islam, V. Slavcovich, M. Gamble, P.I. Haris, J.H. Graziano and H. Ahsan, Urinary and dietary analysis of 18,470 Bangladeshis reveal a correlation of rice consumption with arsenic exposure and toxicity, PLOS ONE 8: (11) ((2013) ), e80691. doi:10.1371/journal.pone.0080691. |
[72] | H.M. Meltzer, G. Norheim, E. Bjørge Løken and H. Holm, Supplementation with wheat selenium induces a dose-dependent response in serum and urine of a Se-replete population, British Journal of Nutrition 67: ((1992) ), 287–294. doi:10.1079/BJN19920032. |
[73] | S. Mirzaeian, R. Ghiasvand, F. Sadeghian, M. Sheikhi, Z.S. Khosravi, G. Askari, A. Shiranian and G. Yadegarfar, Assessing the micronutrient and macronutrient intakes in female students and comparing them with the set standard values, Journal of Education and Health Promotion 2: (1) ((2013) ), 1. doi:10.4103/2277-9531.106636. |
[74] | Y. Miyazaki, H. Koyama, T. Hongo, Y. Sasada, M. Nojiri and S. Suzuki, Nutritional consideration for changes in dietary habit and health promotion practices in community health care; from the view point of selenium. [Nippon koshu eisei zasshi], Japanese Journal of Public Health 48: ((2001) ), 243–257. |
[75] | Y. Miyazaki, H. Koyama, Y. Sasada, H. Satoh, M. Nojiri and S. Suzuki, Dietary habits and selenium intake of residents in mountain and coastal communities in Japan, Journal of Nutrition Science Vitaminology 50: ((2004) ), 309–319. doi:10.3177/jnsv.50.309. |
[76] | T. Mohri, A. Hisanaga and N. Ishinishi, Arsenic intake and excretion by Japanese adults: A 7-day duplicate diet study, Food Chemistry & Toxicology 28: ((1990) ), 521–529. doi:10.1016/0278-6915(90)90123-5. |
[77] | P.B. Moser, R.D. Reynolds, S. Acharya, M.P. Howard, M.B. Andon and S.A. Lewis, Copper, iron, zinc, and selenium dietary intake and status of Nepalese lactating women and their breast-fed infants, American Journal of Clinical Nutrition 47: ((1988) ), 729–734. |
[78] | J. Murphy, E.M. Hannon, M. Kiely, A. Flynn and K.D. Cashman, Selenium intakes in 18–64-y-old Irish adults, European Journal of Clinical Nutrition 56: ((2002) ), 402–408. doi:10.1038/sj.ejcn.1601323. |
[79] | K. Ohno, T. Yanase, Y. Matsuo, T. Kimura, M.H. Rahman and Y. Magara, Arsenic intake via water and food by a population living in an arsenic-affected area of Bangladesh, Science of the Total Environment 381: ((2007) ), 68–76. doi:10.1016/j.scitotenv.2007.03.019. |
[80] | E.C. Pappa, A.C. Pappas and P.F. Surai, Selenium content in selected foods from the Greek marked and estimation of the daily intake, Science of the Total Environment. 372: ((2006) ), 100–108. doi:10.1016/j.scitotenv.2006.08.008. |
[81] | J.R. Pilsner, M.N. Hall, X.H. Liu, H. Ahsan, V. Ilievski, V. Slavkovich, D. Levy, P. Factor-Litvak, J.H. Graziano and M.V. Gamble, Associations of plasma selenium with arsenic and genomic methylation of leukocyte DNA in Bangladesh, Environmental Health Perspectives 119: ((2011) ), 113–118. doi:10.1289/ehp.1001937. |
[82] | L. Pograjc, V. Stibilj and I. Falnoga, Impact of intensive physical activity on selenium status, Biological Trace Element Research 145: (3) ((2012) ), 291–299. doi:10.1007/s12011-011-9204-9. |
[83] | M.P. Rayman, The importance of selenium to human health, The Lancet 356: (9225) ((2000) ), 233–241. doi:10.1016/S0140-6736(00)02490-9. |
[84] | M.P. Rayman, Selenium and human health, The Lancet 379: (9822) ((2012) ), 1256–1268. doi:10.1016/S0140-6736(11)61452-9. |
[85] | H.J. Robberecht, P. Hendrix, R. Van Cauwenbergh and H.A. Deelstra, Actual dietary intake of selenium in Belgium, using duplicate portion sampling, Z. Lebensm Unters Frosch 199: ((1994) ), 251–254. doi:10.1007/BF01193306. |
[86] | T. Roychowdhury, H. Tokunaga and M. Ando, Survey of arsenic and other heavy metals in food composites and drinking water and estimation of dietary intake by the villagers from an arsenic-affected area of West Bengal, India, Science of the Total Environment 308: ((2003) ), 15–35. doi:10.1016/S0048-9697(02)00612-5. |
[87] | S. Ruangwises and P. Saipan, Dietary intake of total and inorganic arsenic by adults in arsenic-contaminated area of Ron Phibun District, Thailand. Bulletin of Environmental Contamination and Toxicology 84: ((2010) ), 274–277. doi:10.1007/s00128-009-9927-x. |
[88] | J. Sapunar-Postruinik, D. Baiulic and H. Kubala, Estimation of dietary intake of arsenic in the general population of the Republic of Croatia, Science of the Total Environment 191: ((1996) ), 119–123. doi:10.1016/0048-9697(96)05253-9. |
[89] | K.A. Scanlon, D.L. MacIntosh, K.A. Hammerstrom and P.B. Ryan, A longitudinal investigation of solid-food based dietary exposure to selected elements, Journal of Exposure Analysis and Environmental Epidemiology 9: ((1999) ), 485–493. doi:10.1038/sj.jea.7500044. |
[90] | A.J. Signes-Pastor, K. Mitra, S. Sarkhel, M. Hobbes, F. Burlo, W.T. De Groot and A.A. Carbonell-Barrachina, Arsenic speciation in food and estimation of the dietary intake of inorganic arsenic in a rural village of West Bengal, India, Journal of Agricultural and Food Chemistry 56: ((2008) ), 9469–9474. doi:10.1021/jf801600j. |
[91] | M. Sigrist, L. Brusa, D. Campagnoli and H. Beldoménico, Determination of selenium in selected food samples from Argentina and estimation of their contribution to the Se dietary intake, Food Chemistry 134: ((2012) ), 1932–1937. doi:10.1016/j.foodchem.2012.03.116. |
[92] | K.A. Skibniewska, M. Dymkowska-Malesa, P. Siwik, A. Kot and E. Jabłońska, Nutritive value of Olsztyn University students diet, Przeglad lekarski 64: ((2006) ), 15–18. |
[93] | P. Smrkolj, L. Pograjc, C. Hlastan-Ribič and V. Stibilj, Selenium content in selected Slovenian foodstuffs and estimated daily intakes of selenium, Food Chemistry 90: ((2005) ), 691–697. doi:10.1016/j.foodchem.2004.04.028. |
[94] | J.E. Spallholz, L.M. Boylan, J.D. Robertson, L. Smith, M.M. Rahman, J. Hook and R. Rigdon, Selenium and arsenic content of agricultural soils from Bangladesh and Nepal, Toxicological and Environmental Chemistry 90: ((2008) ), 203–210. doi:10.1080/02772240701419347. |
[95] | J.E. Spallholz, L.M. Boylana and M.M. Rhaman, Environmental hypothesis: Is poor dietary selenium intake an underlying factor for arsenicosis and cancer in Bangladesh and West Bengal, India, Science of the Total Environment 323: ((2004) ), 21–32. doi:10.1016/j.scitotenv.2003.09.034. |
[96] | R.A. Sunde and W.G. Hoekstra, Structure, synthesis and function of glutathione-peroxidase, Nutrition Reviews 38: ((1980) ), 265–273. doi:10.1111/j.1753-4887.1980.tb05957.x. |
[97] | The First Hong Kong Total Diet Study, Publication of the Centre for Food Safety of the Food and Environmental Hygiene Department of the Government of the Hong Kong Special Administrative Region, 2014, http://www.cfs.gov.hk/english/programme/programme_firm/files/Report_on_the_1st_HK_Total_Diet_Study_Minerals_e.pdf (Last accessed 5 December 2015). |
[98] | The Information Centre, Health survey for England 2004: Health of ethnic minorities, 2006, http://www.hscic.gov.uk/catalogue/PUB01170/hea-surv-ethn-min-eng-2004-rep-v1.pdf (Last accessed 5 December 2015). |
[99] | U. Tinggi, Selenium: Its role as antioxidant in human health, Environmental Health and Preventive Medicine 13: ((2008) ), 102–108. doi:10.1007/s12199-007-0019-4. |
[100] | T. Tsuda, T. Inoue, M. Kojima and S. Akoi, Market basket and duplicate portion estimation of dietary intake of cadmium, mercury, arsenic, copper, manganese and zinc by Japanese adults, Journal of AOAC International 78: ((1995) ), 1363–1368. |
[101] | P.A. Tsuji, C.D. Davis and J.A. Milner, Selenium: Dietary sources and human requirements, in: Selenium, Springer, New York, (2012) , pp. 517–529. |
[102] | V. Tupwongse, P. Parkpian, P. Watcharasit and P. Satayavivad, Determination of levels of Mn, As, and other metals in water, sediment, and biota from Phayao Lake, Northern Thailand, and assessment of dietary exposure, Journal of Environmental Science and Health Part A 42: ((2007) ), 1029–1041. doi:10.1080/10934520701418458. |
[103] | J.L. Valentine, M.E. Cebrian, G.G. Garcia-Vargas, B. Faraji, J. Kuo, H.J. Gibb and P.A. Lachenbruch, Daily selenium intake estimates for residents of arsenic-endemic areas, Environmental Research 64: ((1994) ), 1–9. doi:10.1006/enrs.1994.1001. |
[104] | M. Wilhelm, J. Wittsiepe, P. Schrey, L. Lajoie-Junge and V. Busch, Dietary intake of arsenic, mercury and selenium by children from a German North Sea island using duplicate portion sampling, Journal of Trace Element & Medical Biology 17: (2) ((2003) ), 123–132. doi:10.1016/S0946-672X(03)80008-1. |
[105] | H. Woidich and W. Pfannhauser, Heavy-metals in foods – Analytical control in Austria, Nahrung-Food 21: ((1977) ), 685–695. doi:10.1002/food.19770210806. |
[106] | G. Ysart, P. Miller, H. Crews, P. Robb, M. Baxter, C. De l’Argy, S. Lofthouse, C. Sargent and N. Harrison, Dietary exposure estimates of 30 elements from the UK Total Diet Study, Food Additives and Contaminants 16: ((1999) ), 391–403. doi:10.1080/026520399283876. |
[107] | D. Yu, D. Liang, L. Lei, R. Zhang, X. Sun and Z. Lin, Selenium geochemical distribution in the environment and predicted human daily dietary intake in northeastern Qinghai, China, Environmental Science and Pollution Research 22: ((2015) ), 11224–11235. doi:10.1007/s11356-015-4310-4. |
[108] | L.B. Zablotska, Y. Chen, J.H. Graziano, F. Parvez, A. Van Geen, G.R. Howe and H. Ahsan, Protective effects of B vitamins and antioxidants on the risk of arsenic-related skin lesions in Bangladesh, Environ Health Perspect 116: ((2008) ), 1056–1062. doi:10.1289/ehp.10707. |


