
Analysis of protein microarrays by FTIR imaging
Abstract
BACKGROUND:
Proteins are sensitive to environmental conditions. Whether they are produced for therapeutic purposes or for fundamental research, the integrity of their structure and post-traductional modifications are key issues. Measuring glycosylation or phosphorylation level as well as their secondary structure most often rely on complex and indirect experiments. Infrared spectroscopy presents a series of advantages related to its multivariate character. There is a lack of high-throughput methods able to analyse these parameters.
OBJECTIVE:
In this paper we attempted to combine protein microarrays and infrared imaging for high throughput analysis of proteins.
METHODS:
A protein microarrayer was used to produce protein microarrays on BaF2 slides transparent in the mid-infrared. Spot density was about 25 spots/mm2. A 128 × 128 focal plane array infrared detector was used to record images of the protein microarrays.
RESULTS:
We show that 100 µm diameter spot are easily analyzed. Spots obtained with low protein concentrations, resulting in an average of a single protein monolayer (ca 3 fg/µm2 for a 66 kDa protein) provided good quality spectra.
CONCLUSIONS:
Infrared imaging is a label free, high throughput method, able to analyse protein microarrays and to take advantage from the wide information available in the infrared spectra.
1.Introduction
Following the sequencing of the entire human genome, DNA microarrays were developed and applied to large-scale genomics research, comprising up to tens of thousands of different oligonucleotide probes per square centimetre. Yet, despite their huge potential and the increasing role of non-coding DNA, proteins remain the key players in cellular processes. The human genome contains about 20,000 genes but the human proteome is thought to contain up to
Protein microarrays also called biochips provide information on proteins and their interactions with other proteins, ligands, receptors, antibody affinity, binding partners and high throughput analysis. Microarrays supplies useful tools for clinical studies (vaccine development, disease diagnosis, drug screening for example) as well as an important approach to give advancements in analytical studies [16].
Fourier transform infrared (FTIR) spectroscopy provides a unique opportunity to analyze protein samples. FTIR spectroscopy is based upon the interaction between the IR radiation and the covalent bonds of molecules in presence. Within the mid-infrared range (4000–400 cm−1 or 2.5–25 µm) all organic functions lead to specific IR absorption bands. Each compound has a characteristic set of absorption bands in its infrared spectrum. Importantly, all molecular types contribute to the IR spectrum and this contribution depends on their exact molecular structure. For instance, the head group, length and unsaturation of membrane lipids contribute all to the IR spectral signature [3,5]. Similarly, lipid/protein ratio, DNA condensation state and many other parameters can be obtained from the spectra [1,6,15]. Furthermore, IR spectra account not only for the chemical nature of cell molecules but also for their conformation. They are in particular very sensitive to protein secondary structure [2,8–10,12]. When coupled with a microscope device, this technique provides spatially resolved information on the sample. There is therefore today the opportunity to combine protein microarrays and infrared imaging for high throughput analysis of proteins. The question is now to evaluate whether the ca 100 pl drops delivered by protein microarrayer printers are sufficient to obtain good quality infrared spectra when starting from protein solution in a concentration range around 0.1 to 10 mg/ml available in pharmaceutical preparations. The present paper addresses this question using some well-characterized proteins such as lysozyme, albumin and hemoglobin.
2.Materials and methods
2.1.Microarrays
Microarrays were printed with an Arrayjet Marathon non-contact inkjet Microarrayer (ArrayJet, Roslin, UK) on BaF2 slides. Samples were pipetted from a 384 well plate as the source using a 12 sample low volume Jet Spyder (Arrayjet). Drops of ca 100 pl protein solutions (0.1 to 10 mg/ml protein in 2 mM Hepes pH7.0/Ethylene Glycol 1/1 v/v) were deposited to form regular arrays. Spot-to-spot distance in X and Y directions was 200 µm. Spot diameter was about 100 µm, but this may vary with the nature of the protein. Each sample was spotted 5 times (5 duplicates). Ethylene Glycol was then evaporated overnight under vacuum before spectra recording. Temperature (18–20°C), relative humidity (40–60%) and HEPA air filtration control was provided by a Jetmosphere TM Environmental Control system (ArrayJet, Roslin, UK) that maintains a constant printing environment. All buffer solutions were filtered on 0.2 µm filters. Lysozyme (chicken egg white), albumin (chicken egg white) and hemoglobin (bovine blood) were supplied by Sigma Aldrich.
2.2.FTIR imaging and data processing
2.2.1.FTIR data acquisition
FTIR data were collected using an Agilent 128 × 128 focal plane array (FPA) mid-IR imager. No binning was applied. Spectra were collected between 3950 and 900 cm−1 at a nominal resolution of 8 cm−1. Each spectrum was the mean of 64 scans. The microscope was equipped with a liquid nitrogen cooled 128 × 128 Mercury Cadmium Telluride (MCT) Focal Plane Array (FPA) detector and a 15× objective (NA = 0.62). Every element of the FPA acts as an independent and discrete detector from which a full spectrum is obtained. The corresponding pixel covers an area of 5.5 × 5.5 µm2. The data were collected in transmission mode from sample regions of 700 × 700 µm2. One FTIR image (unit image) results in 16,384 spectra. To cover larger sample areas an automatic tiling combined several FTIR unit images in order to obtain one large mosaic FTIR image. The background (64 scans) was acquired in the absence of sample.
2.2.2.Pre-processing of IR spectra
The spectra were baseline-corrected. Straight lines were interpolated between the spectra points at 3620, 2995, 2800, 2395, 2247, 1765, 1724, 1480, 1355, 1144 and 950 cm−1 and subtracted from each spectrum. Principal component analysis (PCA) was performed on the entire dataset and used here as a noise reduction method.
Correction of the IR spectra and PCA were carried out by Kinetics, a custom-made program running under Matlab (Mathworks, Inc.). PCA was also used to remove noise from the spectra. PCA denoising is based on the fact that noise is unique to each spectrum and essentially uncorrelated to variations observed in other spectra. On the other hand, variations related to protein absorbance throughout the image are correlated and account for the largest part of the variance. For spectra shown in Fig. 3, a PCA was run on all the spectra from the image and the spectra were then rebuilt with the contribution of the first 9 PCs, discarding the contributions brought by the other PCs.
2.2.3.Image segmentation
The process has been described before [4]. Yet, here, the analysis was performed on the infrared image build to report the absorbance at 1654 cm−1 and not on a bright field image as previously reported. Briefly, a simple routine was written under Matlab which first enhances the image contrast by applying a 2D second derivative followed by a 20 point apodization. Computation was conveniently run on the Fourier transform of the image. In a second step, level contours were obtained. A filter was set to eliminate contours that were too large, too small, unclosed or too elongated (tested from the perimeter/area ratio) to be related to protein spots. The level of the contour retained was interactively modified by the user and the contours passing the filters were also reported on the image. When the contour level was optimal, retained spots were numbered automatically. A final visual check was done to ensure all the numbered spots that were retained for further analyses perfectly match spots well identified on the infrared image. On the FTIR image, all the pixels inside a closed contour were collected and averaged to yield the mean spot spectrum.
Fig. 1.
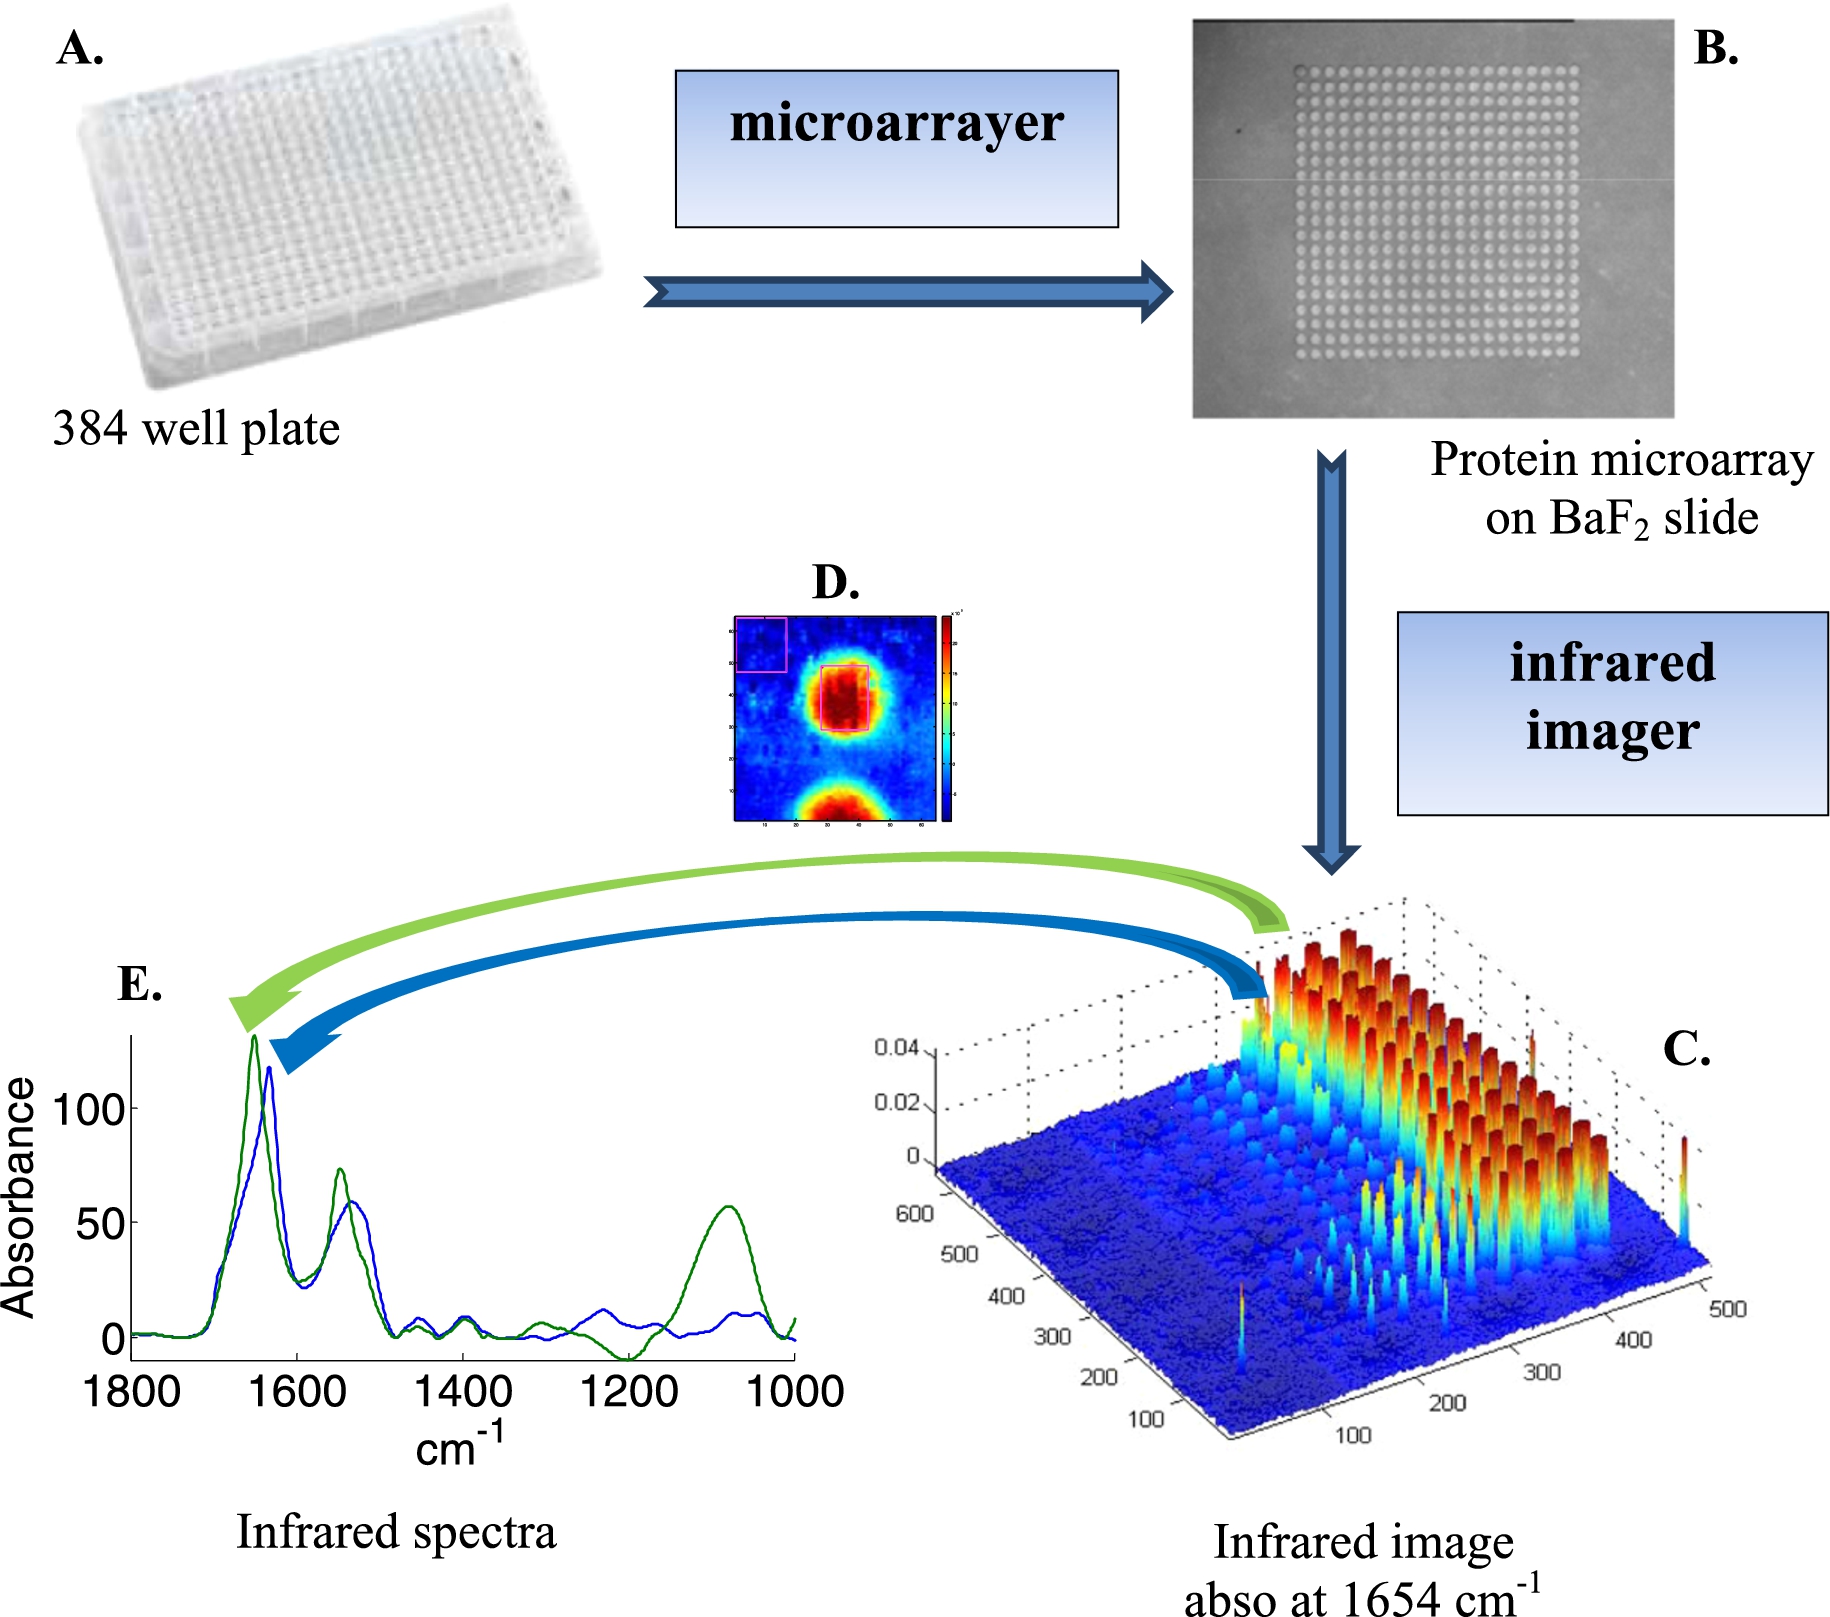
Schematic representation of the acquisition of infrared spectra of hundreds of different samples using a microarrayer. Samples are placed in a 384-well plate (A). A microarrayer then spots about 100 pl of each sample on an infrared transparent slide such as BaF2 (B). An infrared imager records an “image” of the spots (C) where each pixel (voxel) is a full infrared spectrum recorded between 3950 and 900 cm−1. After analysis of each spot (D), one mean spectrum can be extracted from each sample (E).
3.Results
Protein microarrayers allow the building of 2D arrays of spots of protein solution at rather high density. Size of the spots can be maintained below 100 µm, the center to center distance being 150–200 µm, resulting in 44 to 25 spots per mm2 respectively. Infrared imaging based on FPA is a particularly efficient way to record infrared images. The 128 × 128 FPA used in this study records 16,384 spectra over an area of 0.7 × 0.7 mm2 in ca 3 min. Larger areas are covered by stitching together (tiling) unit images. For instance a 3 × 3 tile image covers 2.1 × 2.1 mm2, i.e. 396 to 225 spots respectively for the densities mentioned above. A schematic representation of the measurement process is presented at Fig. 1. The microarrayer robot pipets the protein solution from a 384-well plate (Fig. 1(A)) to build a protein microarray on an infrared transparent slide such as BaF2 (Fig. 1(B)). The protein microarray is then imaged by an infrared imager. Each pixel (voxel) of the image is a full infrared spectrum recorded between 3950 and 900 cm−1 (Fig. 1(C)). As usual, a background image is recorded before and each spectrum composing the image of the sample is ratioed (transmittance spectra) against the background spectrum recorded with the same detector. Yet, any variation in environmental conditions (water vapor content, CO2, temperature, alignment) results in unwanted signal in the ratioed spectrum. One of the great advantages of this approach is that the empty space found between the spots can be used as a background. This is schematically illustrated in Fig. 1(D). The square drawn in the upper left part of Fig. 1(D) contains several hundreds of spectra that can be extracted, averaged and this average is finally subtracted from all the spectra of the image. In our hands, this tremendously improved the quality of the spectra (Fig. 1(E)), indicating that the background recorded before the sample is not sufficient to obtain the best possible quality spectra. In order to further improve the quality of the spectra, a principal component analysis (PCA) was carried out on the 3950–900 cm−1 spectral range. Each spectrum was then rebuilt using the 12 first principal components (PCs) representing more than 99.99% of the total variance. The residual variance was discarded. Such a “noise reduction” by PCA has been described before [11] and significantly improved the quality of the spectra.
Fig. 2.
(A) Infrared image (absorbance at 1654 cm−1) of a protein microarray containing ca 100 pl spots of three proteins: lysozyme, albumin and hemoglobin at various concentrations, respectively 0.1, 0.25, 0.5, 0.8, 1.0, 2.5, 8 and 10 mg/ml. Each condition was repeated 5 times. The buffer contained 50% (v/v) ethylene glycol that was evaporated under vacuum before infrared imaging. (B) Enlargement of one row containing ca 100 pl of albumin at 0.1, 0.25, 0.5, 0.8, 1.0, 2.5, 5, 8 and 10 mg/ml.
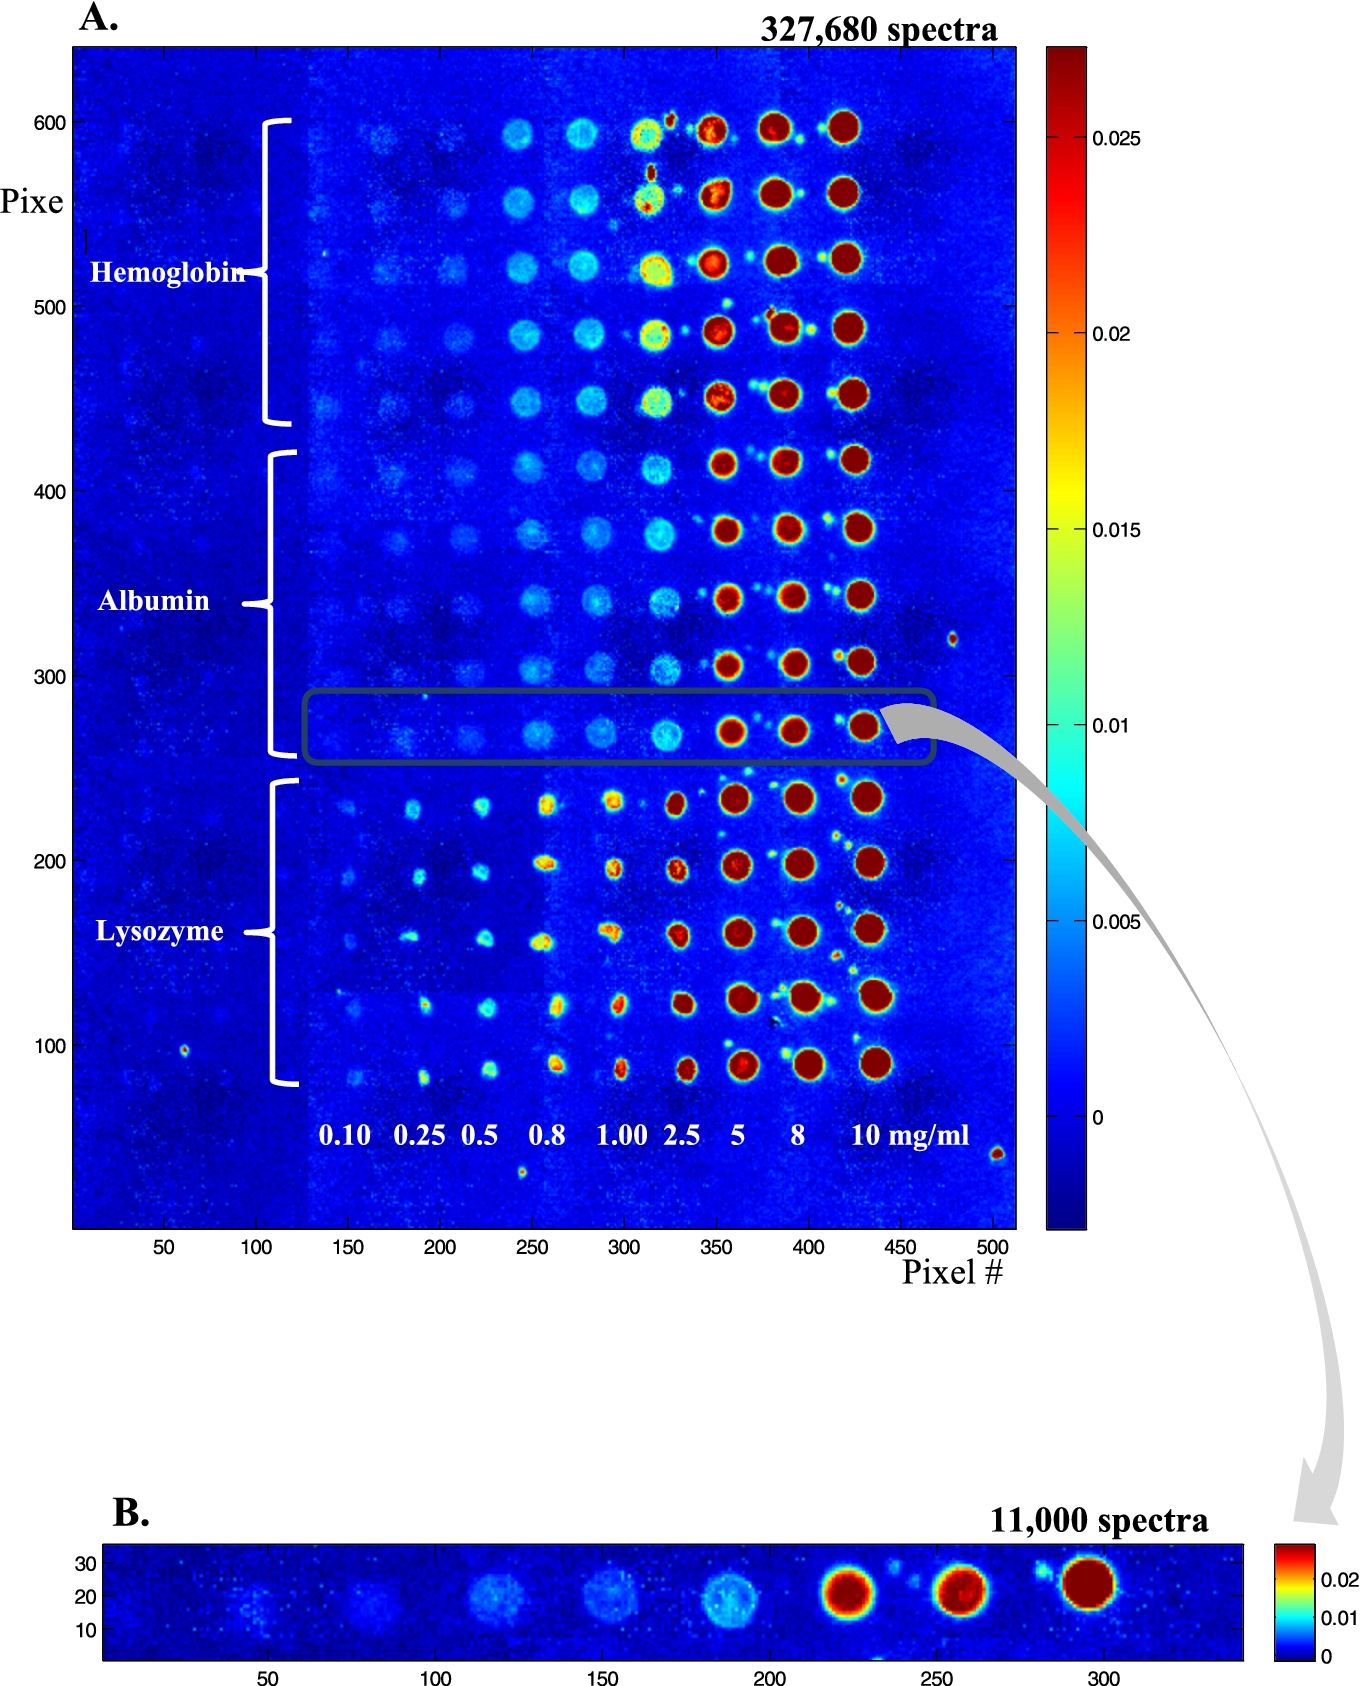
In order to test the sensitivity of the method, lysozyme, albumin and hemoglobin solutions were prepared at concentrations from 10 to 0.1 mg/ml and spotted on a BaF2 slide (Fig. 2(A)). Each row was repeated 5 times, resulting in a total of 15 rows, 5 for each protein. Figure 2(A) is a 4 × 5 tiled infrared image containing 327,680 spectra. It can be noted that lysozyme (bottom) spot shape is quite different from the shape observed for albumin (middle) and hemoglobin (top). At the highest concentrations (5 mg/ml and higher), all have the same appearance. Below 5 mg/ml, lysozyme spots tend to collapse into smaller spots of high protein concentration. Conversely, for hemoglobin, and to a lesser extent for albumin, spot size is maintained and some “coffee ring” effect is observed with an annulus of higher concentration at the edge of the spots. Importantly, as indicated by the color bar scale, the absorbance never exceeds 0.026, ruling out non-linearity with concentration. Yet, the inhomogeneous distribution of the protein in the spot indicates that if quantitative measurements are required, the data from the entire spot will have to be integrated. Figure 2(A) also shows the presence of small satellites spots usually present near the mother spot. Such spilling is difficult to avoid and places a limit to the surface density of the spots. To avoid potential mixing with neighboring spots, a distance of ca 100 µm between spot borders appears to be a reasonable safeguard. Figure 2(B) presents an enlargement of an albumin row. Such a single row still contains ca 11,000 spectra which are further examined in Fig. 3. In Fig. 3, single spectra obtained by selecting a pixel by chance (mouse click) are shown for the protein concentrations from 1 mg/ml and below. Considering the volume delivered by the microarrayer is ca 100 pl and a protein concentration of 1 mg/ml, each spot contains about 100 pg of protein. As each spot is covered by ca 330 pixels, on the average a pixel reports the spectrum of 300 fg of proteins (10 fg/µm2). For a 66 kDa protein, we have therefore 91,000 protein molecules/µm2. If the protein size is ca 6 nm (this is the size of the side of a cube of the same volume as the albumin molecule, albumin is in fact a quite elongated protein), a single protein monolayer counts 28,000 proteins/µm2. It turns that we reach an average of a 1 protein monolayer for a concentration of about 0.3 mg/ml. At that level, single spectra are still of good quality as indicated in Fig. 3.
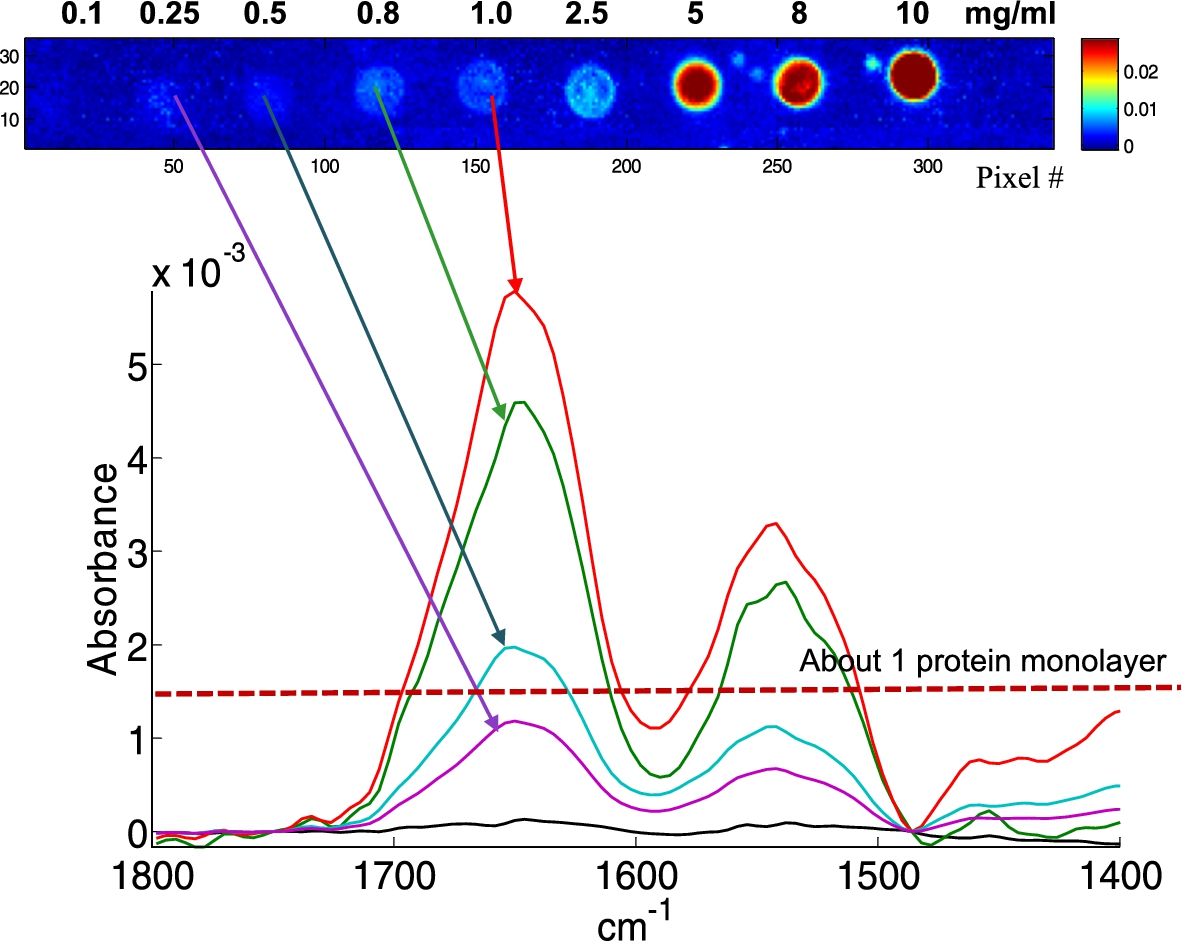
Fig. 3.
Example of single pixel spectra extracted from albumin spots obtained from 1.0, 0.8, 0.5 and 0.25 mg/ml solutions, as indicated by the arrows. The concentration resulting, on the average, in a 1 protein monolayer is indicated by the dotted line.
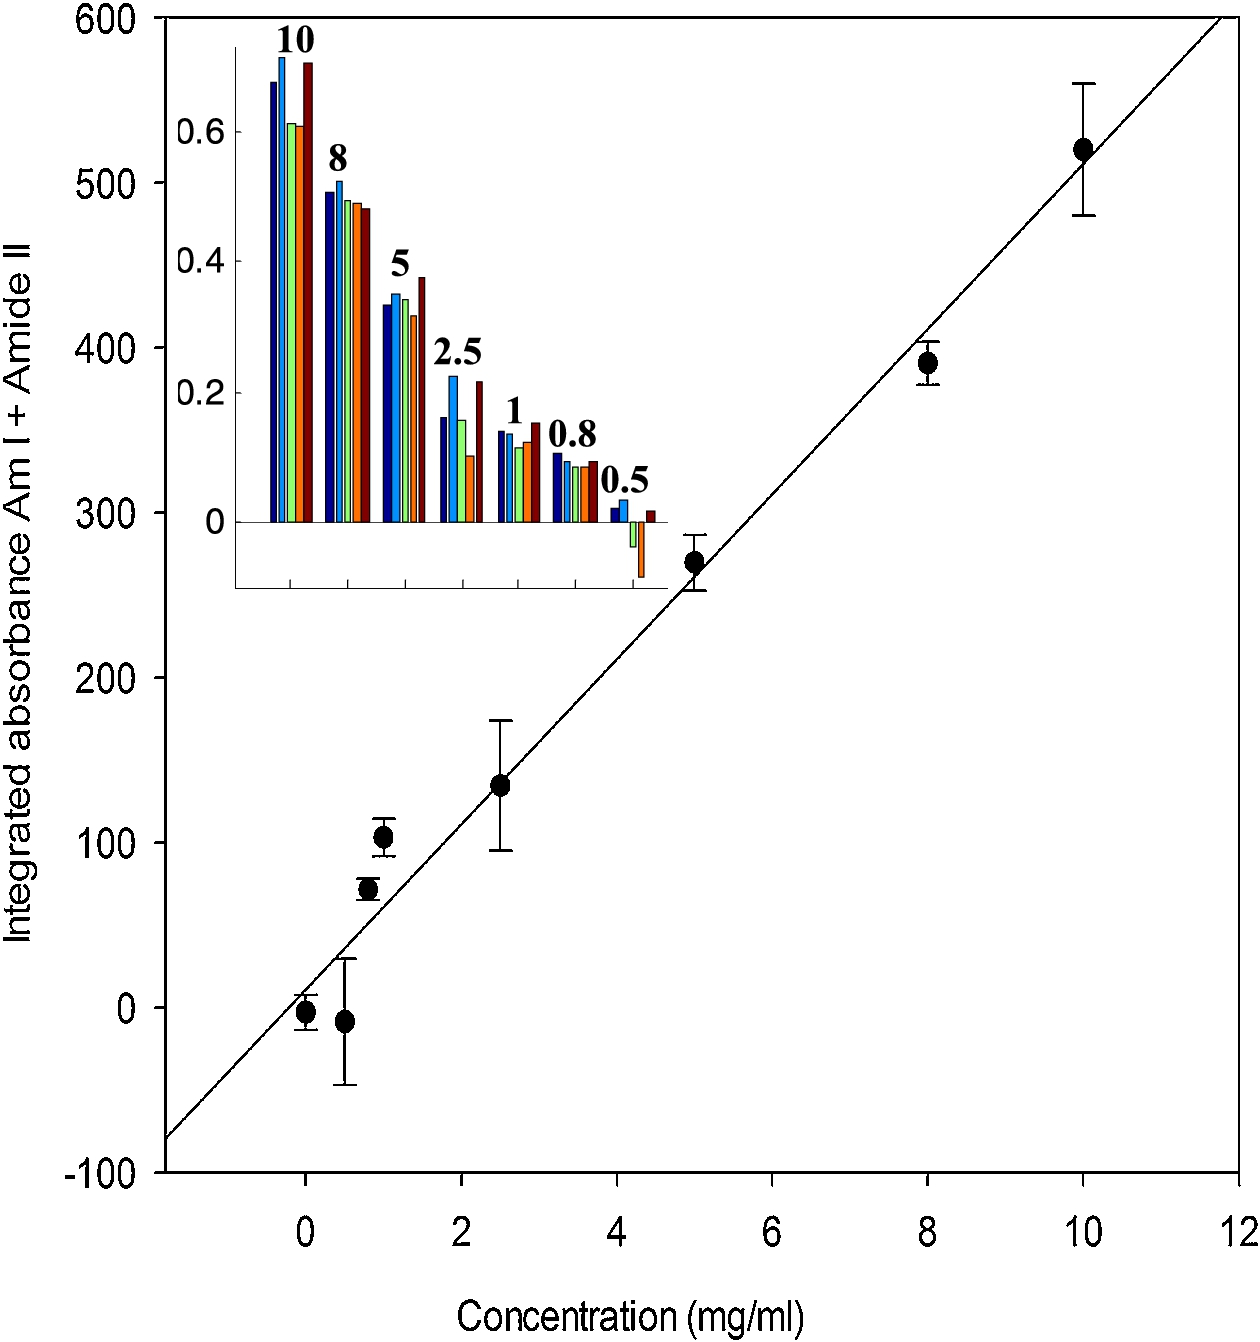
In order to provide quantitative data and better spectra, it is of interest to sum up all the spectra present in a spot. Two approaches have been explored. The first one consists in using image segmentation to circle the spots. Results are reported in Fig. 4(A) for the microarray described in Fig. 2. The process is convenient and works with little human input but fails to identify the weakest spots. Another approach is to place a grid of squares, each fully including one spot. The mean spectrum of all the spectra present in each square can then be computed automatically. The area of the Amide I + Amide II bands was computed here for each mean spectrum and reported as a function of protein concentration in Fig. 5. The inset in Fig. 5 shows the distribution of the Amide I + Amide II areas among the five replicates available for each concentration. It appears from both the histogram and the standard deviation in Fig. 5 that reproducibility is not perfect. As all data come from the same solution, it is likely that variability arouse from variability in the nanodrop volume deposited on the slide. Adding an internal standard in the protein solution could improve the reproducibility.
Fig. 4.
Analysis of the protein microarray described in Fig. 2. (A) An image segmentation procedure allows to draw the boundaries of each spot. All spectra present within these boundaries are extracted and averaged. (B) A regular grid of squares is placed on the microarray, all spectra present in each square are extracted and averaged.
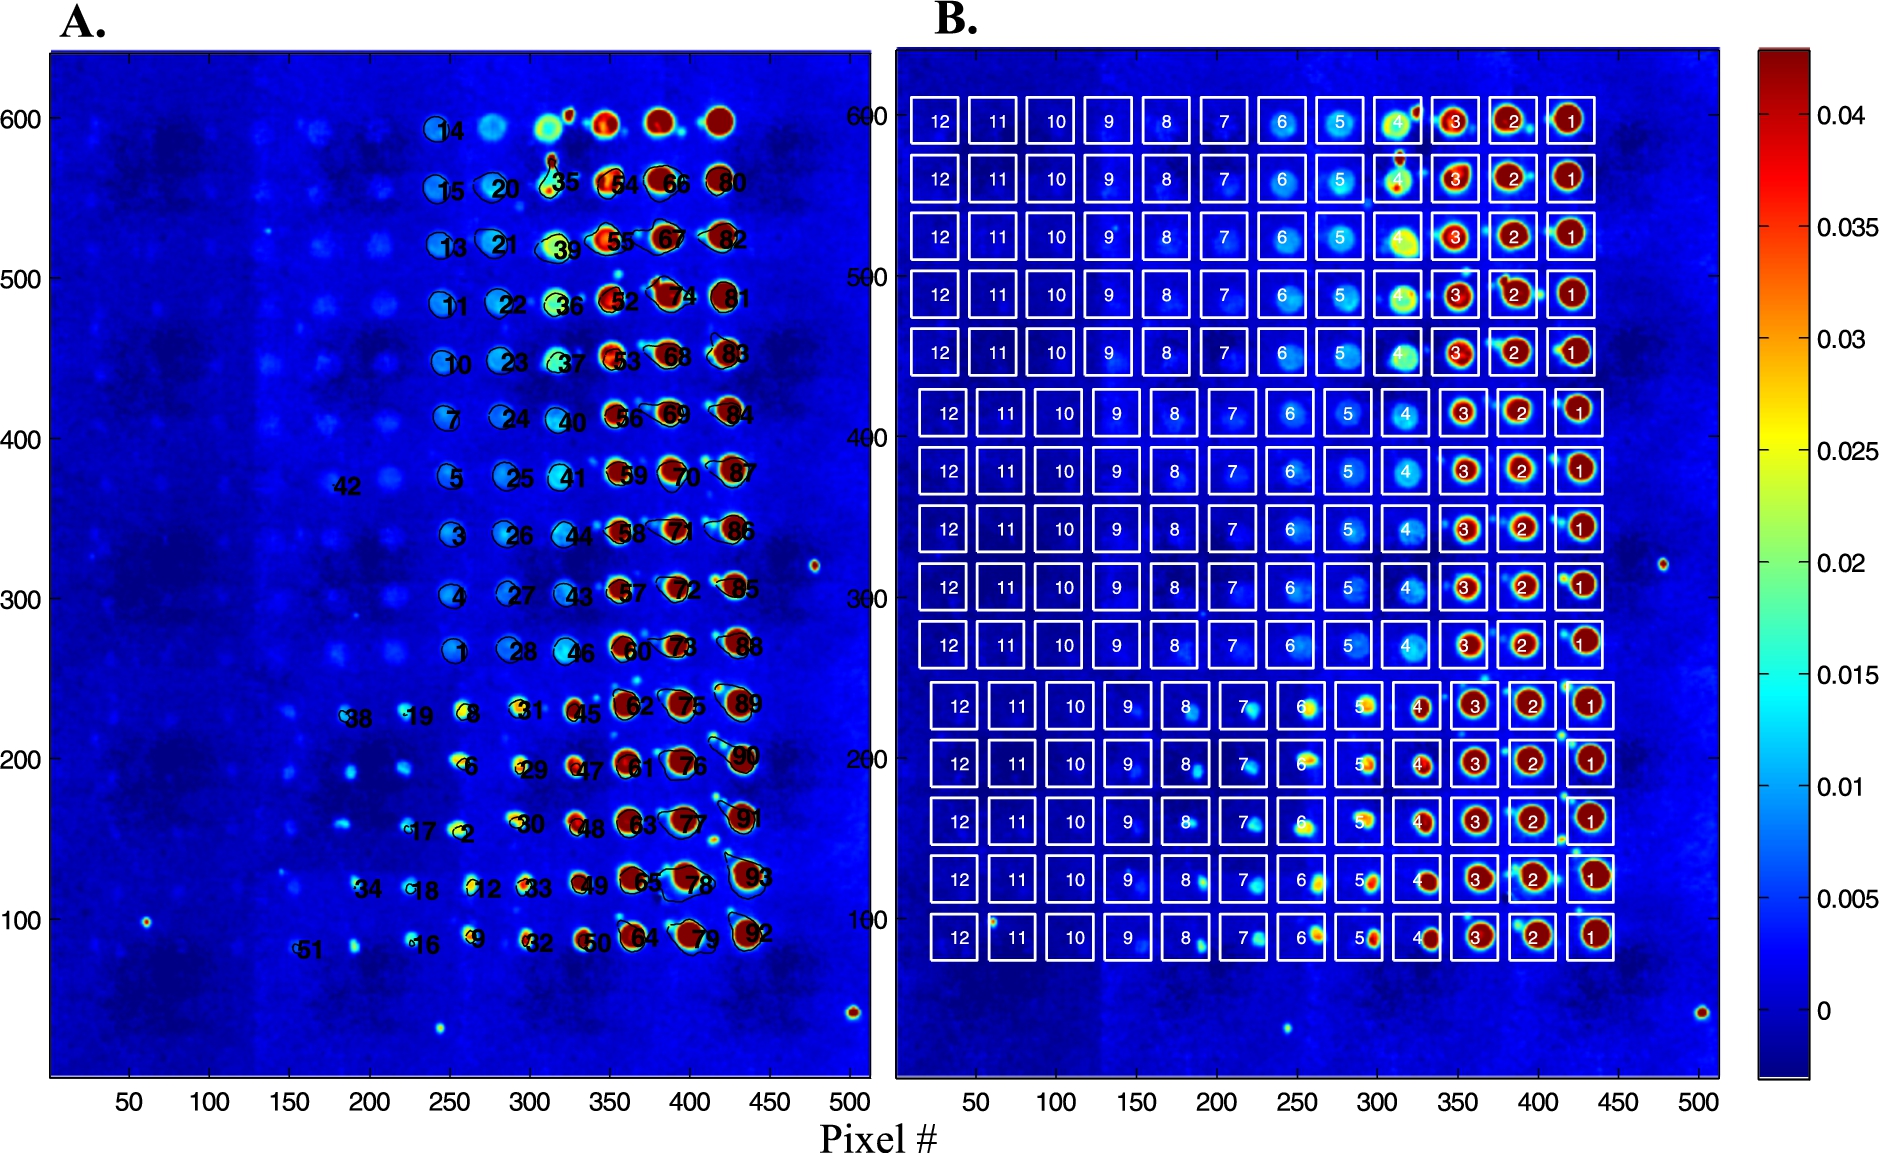
Fig. 5.
Relation between the integrated absorbance under the amide I and amide II bands (between 1750 and 1485 cm−1) and the protein concentration of the spots. Inset: distribution of the values for 5 replicates recorded for each of the 12 concentrations tested.
4.Discussion
Proteins are sensitive to environmental conditions. Whether they are produced for therapeutic purposes or for fundamental research, the integrity of their structure and post-traductional modifications are key issues. Measuring glycosylation or phosphorylation level as well as their secondary structure most often rely on complex and indirect experiments. Infrared spectroscopy presents a series of advantages related to its multivariate character. Briefly, the advantages of infrared spectroscopy are
(1) label free detection: this is not only convenient as labelled proteins may be either not commercially available or very expensive, but it also enhances quality because the labeling procedure often destroys part of the protein structure,
(2) direct and absolute quantification of proteins: Infrared detection intrinsically contains the amount of spotted protein as it is the peptide bound that is quantified
(3) full imprint of proteins: in contrast to most detection methods which provide a single signal (SPR, peroxidase activity, fluorescence, …) infrared imaging provides a complete vibrational spectrum of the binding molecule which includes information on post-translational modification (phosphorylation, glycosylation) and on protein secondary structure [7,18].
The results presented in this paper show that high quality spectra can be obtained from minute amounts of proteins, i.e. below a single monolayer of proteins. This is important as it opens the way to use infrared imaging, instead of fluorescence for instance, for detection of binding. This work also shows that it is now possible to produce high throughput protein analysis by combination of microarrays technology and infrared spectroscopy imaging allowing hundreds of proteins to be quantitatively analyzed in a few minutes. In theory, spot density could be increased but their size should remain significantly above the resolution of infrared imaging. As pointed out by earlier [17], IR images are characterized by a poor resolution (with respect to the achievement of visible light microscopy) as expected from the diffraction-limited resolution, e.g.
In conclusion, protein microarrays composed of hundreds of microspots can be analyzed by infrared imaging, providing a rapid, label free and sensitive method to monitor protein structure and post-translational modifications in a truly high throughput way.
Acknowledgements
We thank the Walloon Region (Belgium) EQUIP program (DG06/EQUIP 2013/Convention 1318159) for financial support. E.G. is Research Director with the National Fund for Scientific Research (Belgium).
References
1 | [[1]] S. Boydston-White, T. Chernenko, A. Regina, M. Miljkovic, C. Matthaus et al., Microspectroscopy of single proliferating HeLa cells, Vib. Spectrosc. 38: ((2005) ), 169–177. |
2 | [[2]] H.H. De Jongh, E. Goormaghtigh, J.M. Ruysschaert and H.H. de-Jongh, Amide-proton exchange of water-soluble proteins of different structural classes studied at the submolecular level by infrared spectroscopy, Biochemistry 36: ((1997) ), 13603–13610. |
3 | [[3]] A. Derenne, T. Claessens, C. Conus and E. Goormaghtigh, Infrared spectroscopy of membrane lipids, in: Encyclopedia of Biophysics, G.C.K. Roberts, ed., Springer, Berlin, (2013) , pp. 1074–1081. |
4 | [[4]] A. Derenne, A. Mignolet and E. Goormaghtigh, FTIR spectral signature of anticancer drug effects on PC-3 cancer cells: Is there any influence of the cell cycle?, Analyst 138: ((2013) ), 3998–4005. doi:10.1039/c3an00225j. |
5 | [[5]] A. Derenne, O. Vandersleyen and E. Goormaghtigh, Lipid quantification method using FTIR spectroscopy applied on cancer cell extracts, Biochim. Biophys. Acta 1841: ((2014) ), 1200–1209. doi:10.1016/j.bbalip.2013.10.010. |
6 | [[6]] M. Diem, L. Chiriboga, P. Lasch and A. Pacifico, IR spectra and IR spectral maps of individual normal and cancerous cells, Biopolymers 67: ((2002) ), 349–353. |
7 | [[7]] A. Goldsztein, S. Babar, M. Voue, J. De Coninck, J. Conti et al., Gastric ATPase phosphorylation/dephosphorylation monitored by new FTIR-based BIA-ATR biosensors, Spectroscopy 24: ((2010) ), 257–260. |
8 | [[8]] E. Goormaghtigh, V. Cabiaux and J.M. Ruysschaert, Determination of soluble and membrane protein structure by Fourier transform infrared spectroscopy. III. Secondary structures, Subcell. Biochem. 23: ((1994) ), 405–450. |
9 | [[9]] E. Goormaghtigh, R. Gasper, A. Benard, A. Goldsztein and V. Raussens, Protein secondary structure content in solution, films and tissues: Redundancy and complementarity of the information content in circular dichroism, transmission and ATR FTIR spectra, Biochim. Biophys. Acta, Proteins Proteomics 1794: ((2009) ), 1332–1343. |
10 | [[10]] E. Goormaghtigh, J.M. Ruysschaert and V. Raussens, Evaluation of the information content in infrared spectra for protein secondary structure determination, Biophys. J. 90: ((2006) ), 2946–2957. |
11 | [[11]] Y.M. Jung, Kim, S. Bin and I. Noda, New approach to generalized two-dimensional correlation spectroscopy. II: Eigenvalue manipulation transformation (EMT) for noise suppression, Appl. Spectrosc. 57: ((2003) ), 557–563. |
12 | [[12]] E. Kleiren, J.M. Ruysschaert, E. Goormaghtigh and V. Raussens, Development of a quantitative and conformation-sensitive ATR-FTIR biosensor for Alzheimer’s disease: The effect of deuteration on the detection of the Aβ peptide, Spectroscopy 24: ((2010) ), 61–66. |
13 | [[13]] P. Lasch and D. Naumann, Spatial resolution in infrared microspectroscopic imaging of tissues, Biochim. Biophys. Acta 1758: ((2006) ), 814–829. |
14 | [[14]] E.C. Mattson, M.J. Nasse, M. Rak, K.M. Gough and C.J. Hirschmugl, Restoration and spectral recovery of mid-infrared chemical images, Anal. Chem. 84: ((2012) ), 6173–6180. |
15 | [[15]] A. Pevsner and M. Diem, Infrared spectroscopic studies of major cellular components. Part II: The effect of hydration on the spectra of nucleic acids, Appl. Spectrosc. 55: ((2001) ), 1502–1505. |
16 | [[16]] V. Romanov, S.N. Davidoff, A.R. Miles, D.W. Grainger, B.K. Gale et al., A critical comparison of protein microarray fabrication technologies, Analyst 139: ((2014) ), 1303–1326. doi:10.1039/c3an01577g. |
17 | [[17]] M. Smolina and E. Goormaghtigh, Infrared imaging of MDA-MB-231 breast cancer cell line phenotypes in 2D and 3D cultures, Analyst 140: ((2015) ), 2336–2343. |
18 | [[18]] M. Voue, E. Goormaghtigh, F. Homble, J. Marchand-Brynaert, J. Conti et al., Biochemical interaction analysis on ATR devices: A wet chemistry approach for surface functionalization, Langmuir 23: ((2007) ), 949–955. |


