
The development of biomolecular Raman optical activity spectroscopy
Following its first observation over 40 years ago, Raman optical activity (ROA), which may be measured as a small difference in the intensity of vibrational Raman scattering from chiral molecules in right- and left-circularly polarized incident light or, equivalently, the intensity of a small circularly polarized component in the scattered light using incident light of fixed polarization, has evolved into a powerful chiroptical spectroscopy for studying a large range of biomolecules in aqueous solution. The long and tortuous path leading to the first observations of ROA in biomolecules in 1989, in which the author was closely involved from the very beginning, is documented, followed by a survey of subsequent developments and applications up to the present day. Among other things, ROA provides information about motif and fold, as well as secondary structure, of proteins; solution structure of carbohydrates; polypeptide and carbohydrate structure of intact glycoproteins; new insight into structural elements present in unfolded protein sequences; and protein and nucleic acid structure of intact viruses. Quantum chemical simulations of observed Raman optical activity spectra provide the complete three-dimensional structure, together with information about conformational dynamics, of smaller biomolecules. Biomolecular ROA measurements are now routine thanks to a commercial instrument based on a novel design becoming available in 2004.
1.Introduction
The techniques of X-ray crystallography and nuclear magnetic resonance (NMR) spectroscopy dominate structural biology due to their ability to reveal the details of biomolecular structure at atomic resolution. However, there are limitations to their applicability. For example, many proteins are difficult to crystallize while many others have structures too large to be solved by current NMR methods. For many years the chiroptical spectroscopic techniques of optical rotation (OR) and circular dichroism (CD), which are sensitive to molecular chirality (meaning right- or left-handedness), have been used routinely as a probe of the stereochemistry of chiral molecules [8,29,30]. Although not providing information at atomic resolution, OR and CD are nonetheless widely used for studying the solution stereochemistry and behaviour of chiral biomolecules, especially in protein science [29,30]. At visible and ultraviolet (UV) wavelengths, OR and CD are associated with electronic transitions and originate in differential refraction and absorption, respectively, of left- and right-circularly polarized light. By extending optical activity measurements into the vibrational spectrum, more detailed and reliable stereochemical information can be obtained because a vibrational spectrum, infrared or Raman, contains many more structure-sensitive bands than an electronic spectrum. Such measurements were suggested as early as the 1930s, but were not realized until new developments in instrument technology facilitated detection of the very weak signals. The resulting vibrational optical activity (VOA) techniques of vibrational circular dichroism (VCD) and Raman optical activity (ROA) finally emerged in the early 1970s [8,17,29,30,80,88].
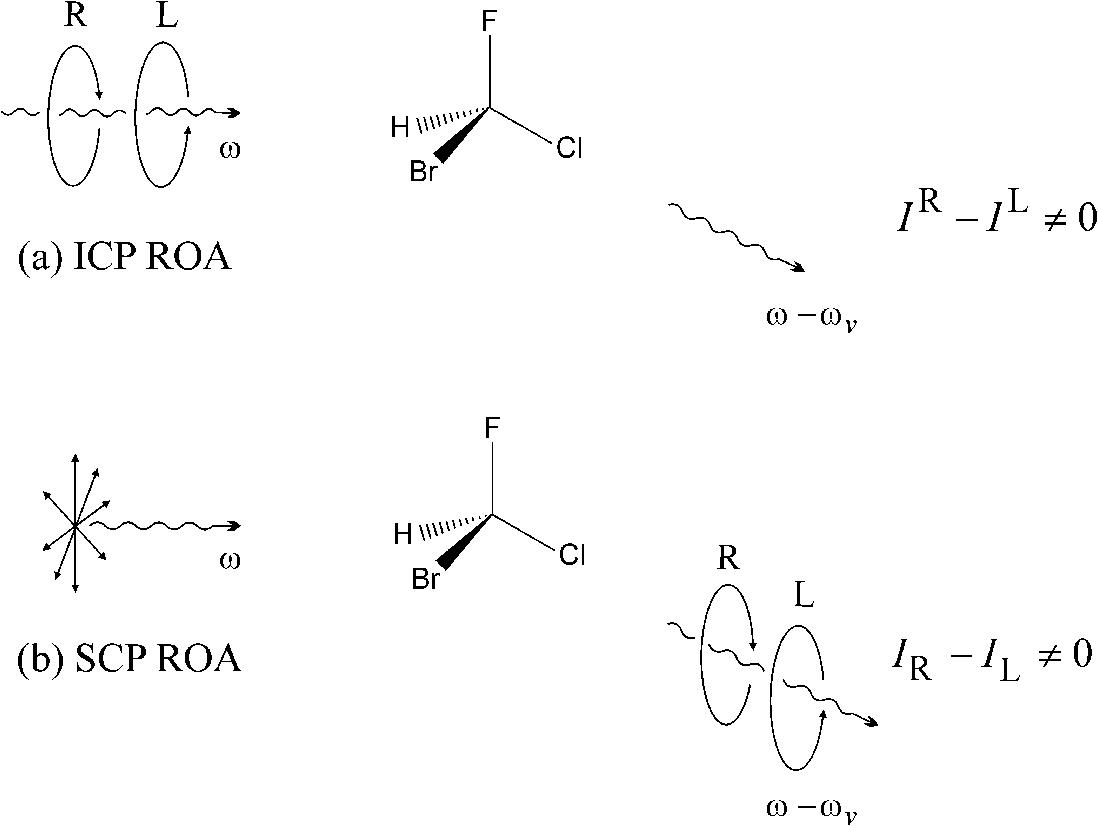
ROA measures a small difference in the intensity of vibrational Raman scattering from chiral molecules in right- and left-circularly polarized incident light or, equivalently, the intensity of a small circularly polarized component in the scattered light using incident light of fixed polarization [8,17,23,29,30,58,80,84,88] (Fig. 1). The first and second experiments are called incident circular polarization (ICP) and scattered circular polarization (SCP) ROA, respectively. Raman spectroscopy itself provides molecular vibrational spectra associated with all the
Fig. 1.
Two equivalent ROA experiments in transparent Stokes vibrational Raman scattering at angular frequency
Conventional Raman spectroscopy has several favourable characteristics which have led to many applications in biomolecular science [43,70,98]. In particular, the complete vibrational spectrum from ∼50 to 4000 cm−1 is accessible on one simple instrument, and both H2O and D2O are excellent solvents for Raman studies. ROA is able to build on these advantages by adding an extra sensitivity to three-dimensional structure through its dependence on absolute handedness, and has developed into an incisive probe of structure and behaviour of biomolecules in aqueous solution [9–11,20,21,26,105,106]. Its simple routine application, with no restrictions on the size of the biomolecules, makes ROA ideal for studying many timely problems.
I have been closely associated with ROA from the very beginning: theoretical prediction, first observation, instrument development and my ultimate goal, namely application to the molecules of life. Rather than being a comprehensive review of ROA, this article provides an account of the subject from my personal perspective.
2.History of ROA
I arrived in Oxford in the autumn of 1966 to work in theoretical chemistry as a graduate student of Peter W. Atkins at the Physical Chemistry Laboratory. My D.Phil. project was to develop a theory of intensity-dependent optical rotation in an intense laser beam. Peter had recently become aware of the new subject of nonlinear optics and was interested in the natural optical activity of chiral molecules. One important lesson I learned from Peter was not to be intimidated by theoretical physics, and to mine it for techniques to solve molecular problems. This led to my decision to treat the problem within the framework of the quantum field theory of light scattering to develop a theory of linear and nonlinear optical phenomena involving chiral molecules, and of general polarization phenomena involving molecular scattering of polarized light. One important feature that facilitated the formulation of the theory of optical activity phenomena was my use of a multipole interaction Hamiltonian in which electric dipole, magnetic dipole and higher multipole interactions with the electric and magnetic components of the radiation field are specified at the start, rather than the standard interaction Hamiltonian involving the vector potential [8]. This period introduced me to the fascination of chirality and the novel phenomena supported by chiral molecules.
The most important outcome of my D.Phil. work was the discovery of a new polarized light scattering mechanism from chiral molecules responsible for the new phenomena of Rayleigh and Raman optical activity that defined much of my subsequent academic career, something outwith the main theme of my D.Phil. project. I would haunt the cavernous basement of Blackwells Bookshop on The Broad where I explored the extensive collection of books on theoretical physics and theoretical chemistry for inspiration. In one such book by Roger Newton [82] that I purchased in 1967, I noticed in a section on polarized light scattering that scattered light acquires an ellipticity that depends on the imaginary part of the product of components of the scattering amplitude. I knew from my quantum field theory of natural optical rotation that the real part of the scattering amplitude can be reduced to the quantum-mechanical expression for the electric dipole–electric dipole dynamic molecular polarizability tensor, and the imaginary part to the electric dipole–magnetic dipole optical activity tensor. I immediately realized that interference between light waves scattered via the polarizability and optical activity tensors of a chiral molecule would generate a small ellipticity, equivalent to a small circularly polarized component, in the Rayleigh and Raman scattered light from chiral molecules. This new mechanism was not in the literature at the time, being missed in George Plazcek’s otherwise comprehensive and definitive treatment of the theory of Rayleigh and Raman scattering [86]. In this way the new subject of Rayleigh and Raman optical activity was born. However, it was nearly stillborn, because I left my briefcase containing the handwritten draft manuscript of my paper with Peter on the subject [6] on the pavement in Mansfield Road when getting into my car. On discovering it was missing when I got home, I rushed back to find to my great relief that an honest passer-by had found it and handed it in to the janitor at the Physical Chemistry Laboratory!
At the end of my D.Phil. project, I was awarded a personal Postdoctoral Research Fellowship from the Science Research Council (SRC) to work with A. David Buckingham, Professor of Theoretical Chemistry in Cambridge. My original plan was to work on the theory of chemical reactivity. However, I could not forget my prediction of the new circular polarization effects in Rayleigh and Raman light scattering from chiral molecules, especially since the effect in Raman scattering, which I christened Raman optical activity (ROA), held promise for a completely new form of chiroptical spectroscopy in which stereochemical information might be obtained via vibrational transitions. In other words, ROA provided a possible route to the measurement of VOA, which at that time remained elusive.
The introduction of the electro-optic modulator (Pockels cell) in the early 1960s led to the routine measurement of CD as the differential absorption of left- and right-circularly polarized light in the visible and ultraviolet spectral regions. I realized that, rather than attempting the difficult task of measuring a small circularly polarized component in the Raman scattered light from chiral molecules, the alternative strategy of measuring a small difference in the intensity of the scattered light in right- and left-circularly polarized incident light could be more favourable and might be facilitated by using an electro-optic modulator to switch the polarization of an incident visible laser beam between right- and left-circular at a suitable frequency, with the detection slaved to the modulation in order to extract the tiny ROA difference signal. Accordingly, I revised my original theory to emphasise the Raman circular intensity difference (CID) associated with the ICP measurement strategy (Fig. 1(a)), and also took the opportunity to incorporate the electric dipole–electric quadrupole optical activity tensor into the theory of ROA. Something I learned early on from David Buckingham was that, although this tensor does not contribute to OR and CD in isotropic samples, it contributes in oriented samples like crystals [8,41]; and I realized that it also contributes to ROA in the same order as the electric dipole–magnetic dipole tensor even in isotropic samples. I recall going into David’s office to show him this new formulation, at which point David pointed to his blackboard on which was written exactly the same result! David had been thinking along similar lines. So we agreed to join forces, and wrote what became the definitive paper on the molecular theory of ROA [13].
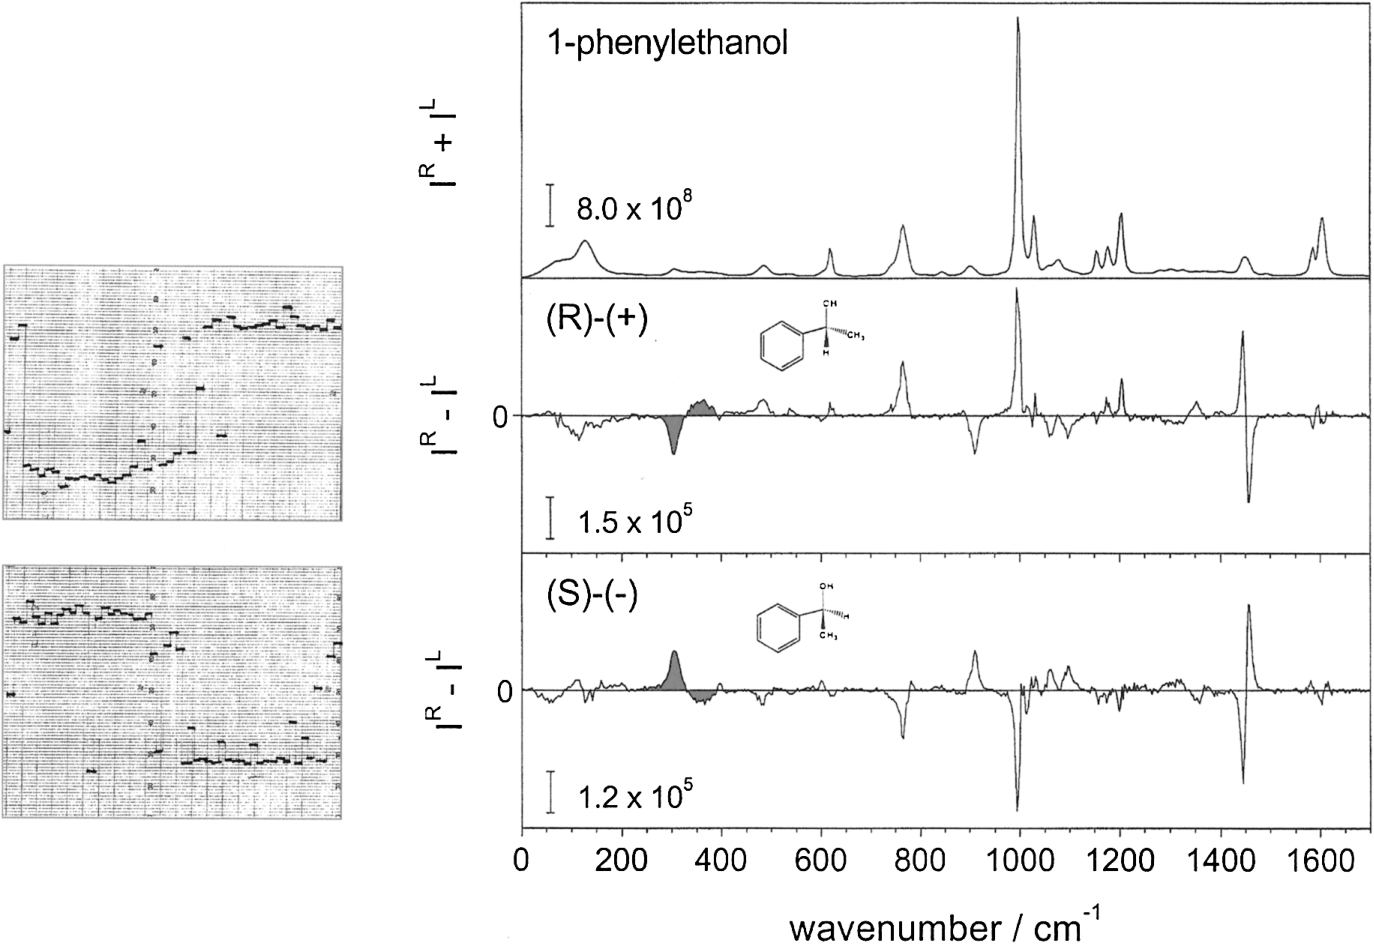
David Buckingham had much experience with delicate experiments involving polarized laser light, such as Kerr effect measurements, and had a small laboratory in the basement of the University Chemical Laboratory for such work. So we decided to attempt to measure ROA. Unfortunately David was unable to obtain funding from the SRC for this project; but I was not prepared to abandon it and in 1971 managed to obtain funding for a year from the National Research Development Corporation (NRDC) in exchange for patent rights (unfortunately the patent expired long before technology finally caught up with our early work and rendered a commercial instrument viable). This work was greatly aided by Martin P. Bogaard, David’s postdoctoral research assistant at the time, plus the availability of an early argon ion laser from David’s laboratory, together with the use of a Coderg PH1 double-grating Raman spectrometer located in the Inorganic Chemistry Department. This caused some friction with other users of the Raman spectrometer since it was necessary to replace the existing helium–neon laser with the much more powerful argon ion laser carried up from David’s basement laboratory. ROA is a tiny effect, with CIDs less than one part in a thousand of the conventional Raman intensity, which is itself very weak, so the experiment was extremely challenging. Crucial to our ultimate success was employment of a dual synchronous photon counter, a detector that had recently been developed for optical astronomy. This was synchronized with the switching, by means of the electro-optic modulator, of the blue 488 nm argon ion laser beam between right- and left-circular polarization in order to extract the tiny ROA CIDs as the instrument scanned slowly over a small spectral range. However, the initial experiments were a miserable failure, with the CIDs being swamped by enormous polarization artefacts. At this point in early 1972 Martin Bogaard returned home to Australia, leaving me to try and rescue the project. At this stage the electro-optic modulator was driven by a high-voltage sign wave via a transformer, which meant that the laser beam passed through elliptical and linear polarization states during the transition from right to left circular. I knew from my general theory of polarized light scattering that the artefacts originated in these linearly polarized components, and that square-wave modulation between pure right- and left-circular polarization states was essential. However, high-voltage square-wave amplifiers were not available at the time, so in desperation I hit on the idea of using Zener diodes to clip the top and bottom of the low-voltage input sign wave and hope that the transformer would pass it. Despite scepticism from electronics experts, the clipped sign wave was passed, and by synchronizing the dual photon counter to switch on and off at the beginning and end of each voltage plateau, the linear polarization states in between could be eliminated from the measurement. Another crucial factor was the realization that the dominant artefacts originated in isotropic scattering from polarized Raman bands, so polarized Raman scattering was eliminated by making the measurements in depolarized right-angle scattering (i.e. through a horizontal Polaroid analyzer). Success followed quickly, with the first observations of genuine ROA being achieved in the summer of 1972. The samples were both enantiomers of neat 1-phenylethanol and 1-phenylethylamine, the report being published in early 1973 [12]. Figure 2(left) displays our original ROA chart recorder traces for the two enantiomers of 1-phenylethanol in the spectral region ∼290–400 cm−1, with the ROA spectra for the same molecules over a much wider spectral range recorded on a multichannel instrument in 2003. The same ROA couplets (shaded) as in the original report are reproduced. This work is now recognized as the first observation of VOA of molecular origin [80]. This was followed in 1974 by the first report using the more obvious approach using circular dichroism of infrared radiation (VCD) by George Holzwarth and colleagues working at the University of Chicago [56].
Fig. 2.
The original 1972 ICP ROA chart recorder traces in the spectral region ∼290–400 cm−1 for the two enantiomers of 1-phenylethanol (left), compared with ICP spectra recorded on a multichannel instrument in 2003 (right) in which the same couplets (shaded) as in the original report are reproduced.
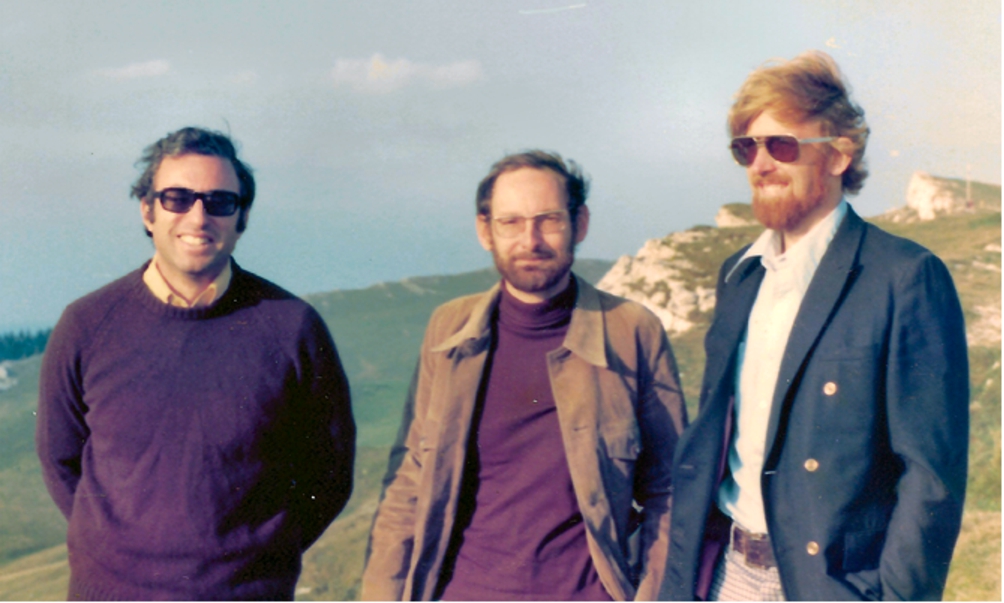
These first attempts to measure ROA were highly controversial, with several groups publishing the large polarization artefacts to which such measurements are highly susceptible, and claiming them as real ROA. It was not until 1975 that these first reported ROA spectra were confirmed as the first genuine observations by Werner Hug and colleagues [62] using an instrument Werner built at the Western Regional Research Centre of the US Department of Agriculture in Berkeley, California, while working as a postdoctoral researcher at the University of California, Berkeley. Werner subsequently took a faculty position at the University of Fribourg in Switzerland where he made crucial contributions to ROA instrumentation, which ultimately led to the introduction of a commercial instrument in 2004. Figure 3 shows me with Werner, together with Laurence A. Nafie, another early VOA pioneer, in the Jura in Switzerland in September 1976.
Fig. 3.
The author (left) with Werner Hug (centre) and Laurence Nafie in the Jura, Switzerland, in September 1976. (Colors are visible in the online version of the article; http://dx.doi.org/10.3233/BSI-150113.)
While in Cambridge I developed with David Buckingham a theory of ROA induced in achiral samples by a magnetic field parallel to the incident laser beam [14], and went on to make the first observation of this ROA analogue of the Faraday effect in resonance Raman scattering from a dilute solution of the haem protein ferrocytochrome c [7]. This was achieved by boring holes through the pole pieces of a permanent magnet to allow passage of the laser beam, with the rectangular sample cell experiencing a magnetic field of 1 T within a 1 cm pole gap, the Raman spectrum being measured in right-angle scattering. Magnetic ROA has much potential, little exploited as yet, in physics, chemistry and biomolecular science, especially in paramagnetic samples where it can function as ‘Raman electron paramagnetic resonance (EPR)’ via spin-flip Raman scattering pathways [8,25].
At this time, an important goal was to understand how natural ROA is generated within chiral molecular structures in order to extract stereochemical information from observed spectra. Inspired by an important paper by David Buckingham and Christopher Longuet-Higgins [42] on the origin-dependence of the electric dipole–magnetic dipole and electric dipole–electric quadrupole molecular property tensors, I developed an influential ‘two-group’ theory of ROA [15]. This demonstrated that the ROA generated by a simple chiral structure comprising two achiral anisotropic groups or bonds held in a twisted chiral arrangement originates in interference between waves scattered independently from the two groups; whereas the corresponding natural optical rotation requires dynamic coupling between the two as in the Kirkwood model [8].
Following my appointment to a Lectureship in the Chemistry Department at the University of Glasgow in the autumn of 1975, I quickly established an experimental research programme in ROA, facilitated by taking the ROA equipment with me from Cambridge, which was now based on a Coderg T800 triple-grating Raman spectrometer, and set about measuring the ROA spectra of a large number of chiral organic molecules over the range 100–1800 cm−1. But by the early 1980s I realized that if ROA was to achieve its potential as a powerful new probe of stereochemistry of chiral molecules, and eventually of biomolecules, the speed of measurement would need to be drastically increased. The scanning spectrometers based on photomultiplier detection would need to be replaced by spectrographs with multichannel detectors. I expended much effort on a double-grating instrument using an intensified diode array detector [24], and did measure some useful multichannel ROA spectra on this instrument up until 1990, but much greater sensitivity was still needed. Fortunately, several new developments came to the rescue. First, in 1988, Lutz Hecht from the University of Essen joined my group on a Personal Fellowship from the Deutsche Forschungsgemeinschaft, being appointed several years later to a Lectureship in the Department. Lutz’s expertise in spectroscopic instrumentation, and his meticulous approach, proved of immense value to the subsequent developments in ROA at Glasgow. Second, the implementation of a backscattering geometry, in place of the right-angle scattering employed up to this time, was pivotal. I had long appreciated that backscattering could be highly advantageous: within the simple two-group model, the ROA intensity is maximised in backscattering and zero in the forward direction [8,16], with a later analysis showing that a given signal-to-noise ratio could be achieved eight times faster in backscattering than in polarized right-angle scattering [50,53], something that ultimately proved vital for the measurement of ROA of biomolecules. In fact the difficult problem of implementing backscattered ROA had been solved as early as 1979 by Werner Hug in Freibourg [57], but sadly his instrument, along with the preliminary data, was destroyed by fire, which led him to abandon experimental ROA work for some years. I contacted Werner in 1988 to seek advice about setting up backscattering in Glasgow; he responded by generously donating his backscattering optical attachment that had survived the fire. This was based on a mirror set at 45° to the laser beam (with a small central hole to pass the incident laser beam) to deflect the backscattered Raman light into the collection optics of the spectrograph. A crucial feature was the use of a Lyot depolarizer to scramble the Raman light before striking the mirror, without which huge polarization artefacts are generated. This enabled backscattering to be quickly set up in Glasgow early in 1989, using the diode array multichannel spectrometer, and the first results published within a few months [53], with the first observations of ROA in forward scattering following soon after [22]. Third was the award of an equipment grant of £100,000 from the Wolfson foundation, which coincided with the recent availability of backthinned charge-coupled device (CCD) detectors developed for optical astronomy. Thanks also to the recent introduction of high efficiency notch and edge filters to block scattered light at the incident laser frequency, single grating spectrographs could now be used in place of the double- and triple-grating instruments previously employed to reject stray light from the intense Rayleigh line. All this together led to the construction of a new generation of instrument in my Glasgow laboratory capable of measuring the ROA spectra of biomolecules in aqueous solution [52], with our first observations on peptides and proteins being achieved in 1990 [19]. The subsequent availability of high-throughput single-grating Raman spectrographs based on transmission, in place of reflection, diffraction gratings using volume holographic technology developed from ‘head-up’ displays in the cockpits of fighter aircraft produced a significantly improved final version [51].
With these new instruments, the 1990s was a period of great activity in the Glasgow ROA laboratory, with a large range of chiral molecular structures being studied, the main focus being on biomolecules [21]. I became, inter alia, an expert in protein science, and up to my retirement in 2009 used ROA to address many problems at the forefront of biomolecular science, including protein fold determination, protein misfolding and disease, immunogenicity, protein and carbohydrate structure of intact glycoproteins, and protein and nucleic acid structure of intact viruses. ROA has much potential in structural genomics, especially for those proteins (the majority) that are inaccessible to X-ray crystallography and multidimensional NMR. The protein and virus studies were greatly boosted by, among others, Ewan W. Blanch, who joined the group as a postdoctoral researcher from the University of New England in 1996, and went on to a Lectureship at the University of Manchester where he set up his own ROA and biomolecular spectroscopy laboratory; he is now at RMIT University, Melbourne, Australia.
The remarkable analytical power of ROA demonstrated by the many studies in Glasgow and elsewhere stimulated the development of a commercial ROA instrument by Rina K. Dukor and Laurence A. Nafie as President and co-founder of BioTools, Inc. This instrument was based on a completely new design by Werner Hug which measured the original predicted form of ROA, namely small circularly polarized components in the Raman-scattered light, rather than the CID, and which has many advantages [59–61]. I purchased the first BioTools ROA instrument in 2004, optimized it for studying biomolecules in aqueous solution, and demonstrated its power and versatility as a routine instrument. With the availability of this instrument, together with the development of efficient ab initio calculation programs, ROA is becoming the spectroscopic method of choice for the study of chiral systems in physics, chemistry and life science. It is especially valuable in the pharmaceutical industry: determination of absolute configuration is vital when drugs are chiral since different pharmacological activity and toxicity can reside in different enantiomers. Vibrational optical activity, both VCD and ROA, has been widely adopted in the pharmaceutical industry for absolute configuration determination owing to its relative simplicity, and even greater reliability, compared with the standard method of X-ray crystallography since the sample can be a pure liquid or a solution rather than a crystal. ROA has the added advantage that it can be highly informative for biopharmaceuticals such as glycoproteins, which are difficult to characterise and monitor using other techniques.
3.Outline of ROA theory
3.1.The ROA observables
In the fundamental scattering mechanism responsible for ROA discovered during my D.Phil. work [6], interference between the light waves scattered via the molecular polarizability and optical activity tensors of the molecule yields a dependence of the scattered intensity on the degree of circular polarization of the incident light and to a circular component in the scattered light. The subsequent more definitive Barron–Buckingham paper [13] introduced the dimensionless CID
(1)
In terms of the electric dipole–electric dipole molecular polarizability tensor
The various tensor component products have been averaged over all orientations of the scattering molecule to generate collections of products that are invariant to axis rotations. Specifically,
It was mentioned above that, as well as the circular intensity difference, ROA is also manifest as a small circularly polarized component in the scattered beam [6,8,16,80,81]. Within the far-from-resonance approximation, measurement of this circular component (SCP ROA) as
These results apply specifically to Rayleigh (elastic) scattering. For Raman (inelastic) scattering the same basic CID expressions apply but with the molecular property tensors replaced by corresponding vibrational Raman transition tensors between the initial and final vibrational states
For the case of a molecule composed entirely of idealized axially symmetric achiral bonds, for which
Since conventional Raman intensities are the same in forward and backward scattering, backscattering boosts the ROA signal relative to the background Raman intensity and is therefore the best experimental strategy for most ROA studies of biomolecules in aqueous solution due to the weak signals and high backgrounds [50,53].
3.2.Calculation of ROA spectra
Calculation of ROA spectra is an important aspect of the technique since successful simulations of observed spectra can provide the complete solution structure (conformation, absolute configuration, conformational populations) and conformational dynamics of chiral molecules. Calculations of the ROA observables, which are usually based on the Placzek approximation, can proceed in several ways. Models of ROA exist such as the bond-polarizability (valence-optical) model in which the molecule is decomposed into bonds or groups supporting local internal vibrational coordinates [8,48]. However, due to the approximations inherent in these models, such calculations do not reproduce experimental data at all well. Models can, nonetheless, provide valuable physical insight into the generation of ROA [8], which is often not transparent in the computationally superior ab initio approach, now the method of choice [17,80,84]. An ab initio quantum-chemical method, based on calculations of
Subsequent approaches produced significant improvements in the quality of ab initio ROA calculations. By including basis sets containing moderately diffuse p-type orbitals on hydrogen atoms, Zuber and Hug demonstrated that ab initio ROA calculations of a similar high level of quality to those of VCD may be achieved [109]. This is significant because, in many systems including small chiral organic molecules but especially in proteins (vide infra), it is found that vibrations with large contributions from C−H and N−H deformations often generate large ROA signals. Interest in ROA calculations among theoreticians is growing, with a plethora of publications providing further refinements and applications to ever-larger systems. Currently, ROA calculations may be performed using the DALTON [45] and Gaussian [49] software packages: the latest 09 version of Gaussian implements an analytic time-dependent protocol for the calculation of the ROA property-tensor derivatives, both Hartree–Fock (HF) and density functional theory (DFT), resulting in an order-of-magnitude increase in speed of the calculations. Further details, including many more references, may be found in some recent reviews of ROA computations [79,80,85,92,93].
As an example of what may routinely be achieved, Fig. 4 presents experimental and simulated Raman and ROA spectra of 1-phenylethanol. This was taken from a study which revisited the samples used for the first observations of ROA, namely both enantiomers of 1-phenylethanol and 1-phenylethylamine, using state-of-the-art instrumentation and calculations [69]. The experimental backscattered SCP Raman and ROA spectra of both enantiomers of 1-phenylethanol are displayed in Fig. 4, together with the corresponding simulated Raman and ROA spectra of the (+)-(R)-enantiomer, which closely reproduce the experimental spectra. It is often necessary to allow some degree of conformational freedom in order to simulate the observed Raman and ROA bandshapes, something especially important for many biomolecules [67,68]. In the present case, a Boltzmann average over several hundred rotameric conformations of the phenyl and −OH groups was taken. Clearly, assignments of absolute configurations are completely secure from ROA results of this quality.
Fig. 4.
Experimental and calculated backscattered SCP Raman and ROA spectra of (+)-(R)-1-phenylethanol (adapted from [69]). The absolute intensities are arbitrary, but the dimensionless ratios
![Experimental and calculated backscattered SCP Raman and ROA spectra of (+)-(R)-1-phenylethanol (adapted from [69]). The absolute intensities are arbitrary, but the dimensionless ratios (IR−IL)/(IR+IL) are meaningful and may be compared between experimental and simulated spectra.](https://content.iospress.com:443/media/bsi/2015/4-3/bsi-4-3-bsi113/bsi-4-bsi113-g004.jpg)
4.Instrumentation
As explained above, a backscattering geometry has proved essential for the routine measurement of ROA spectra of biomolecules in aqueous solution. Backscattered ROA spectra may be acquired using both the ICP and SCP measurement strategies, although the designs of the corresponding instruments are completely different.
A backscattering ICP measurement strategy was used in our Glasgow laboratory for some years and provided a large number of biomolecular ROA spectra. The final version of the Glasgow backscattering biomolecular ICP ROA instrument is described in detail elsewhere [51]. Essentially, a visible 514.5 nm argon ion laser beam is weakly focused into the sample solution contained in a small rectangular fused quartz cell. The cone of backscattered light is reflected off a 45° mirror, which has a small central hole drilled to allow passage of the incident laser beam, through an edge filter to remove the Rayleigh line and into the collection optics of a single-grating spectrograph containing a volume holographic transmission grating with a backthinned CCD detector, allowing the full spectral range to be measured in a single acquisition. To measure the small ROA signals, the spectral acquisition is synchronized with an electro-optic modulator used to switch the state of polarization of the incident laser beam between right and left circular at a suitable rate. Spectra are displayed in analog-to-digital converter units as a function of the Stokes Raman wavenumber shift with respect to the exciting laser line. Typical laser power at the sample is ∼700 mW and sample concentrations of proteins, polypeptides and nucleic acids are ∼30–100 mg/ml while those of intact viruses are ∼5–30 mg/ml. Under these conditions ROA spectra over the range ∼600–1700 cm−1 may be obtained in ∼5–24 hours for proteins and nucleic acids and ∼1–4 days for intact viruses. Although ROA spectra may be recorded down to ∼200 cm−1 on favourable samples such as carbohydrates, spectra below ∼600 cm−1 can be unreliable from highly scattering samples like proteins due to offsets associated with the intense Rayleigh wing. Measurements may be performed over the temperature range ∼0–60°C by directing dry air downwards over the sample cell from a device used to cool protein crystals in X-ray diffraction experiments, in order to study dynamic behaviour. Figure 5 shows a diagram of this instrument.
Fig. 5.
The optical design of the final version of the Glasgow backscattering ICP ROA instrument. Adapted from [51]. (Colors are visible in the online version of the article; http://dx.doi.org/10.3233/BSI-150113.)
![The optical design of the final version of the Glasgow backscattering ICP ROA instrument. Adapted from [51]. (Colors are visible in the online version of the article; http://dx.doi.org/10.3233/BSI-150113.)](https://content.iospress.com:443/media/bsi/2015/4-3/bsi-4-3-bsi113/bsi-4-bsi113-g005.jpg)
Although this backscattering ICP ROA instrument served to establish ROA in biomolecular science and the design remains useful, routine ROA studies were held back by the delicate nature of the associated measurements. This situation has now changed thanks to a new design of ROA instrument by Werner Hug based on the use of the SCP strategy [59–61]. In particular, ‘flicker noise’ arising from dust particles, density fluctuations, laser power fluctuations, etc. are eliminated since the intensity difference measurements required to extract the circularly polarized components of the scattered beam are taken between two orthogonal components of the scattered light measured during the same acquisition period. The flicker noise consequently cancels, resulting in improved signal-to-noise characteristics. The basic design is illustrated in Fig. 6. The incident visible laser beam at 532 nm from a frequency-doubled continuous Nd/YAG laser, the initial linear polarization of which is ‘scrambled’ by a fast rotation of the azimuth, is deflected into the sample cell using a small prism. The cone of backscattered light is collimated onto a liquid crystal retarder set to convert right- and left-circular polarization states into linear polarization states with azimuths perpendicular and parallel, respectively, to the plane of the instrument, followed by an edge filter to remove the intense Rayleigh line. A beam-splitting cube then diverts the perpendicular component at 90° to the propagation direction of the parallel component, which passes through undiverted. In this way, the right- and left-circularly polarized components of the backscattered light are separated and collected into the ends of two fiber optics. Each fiber optic converts the cross section from circular at the input end to a linear configuration at the output end that matches the entrance slit of a fast imaging spectrograph, thereby enabling separate Raman spectra for the right- and left-circularly polarized components of the scattered light to be dispersed simultaneously one above the other onto the chip of a backthinned CCD detector. Subtraction then provides the required SCP ROA spectrum corresponding to small circularly polarized components in the Raman bands. Small differences in the two detection channels are compensated by interconverting their function through the switching of the liquid crystal retarder from the
Fig. 6.
Simplified optical design of the BioTools ChiralRAMAN backscattering SCP ROA instrument. The lenses are represented by double-headed arrows. Adapted from [61].
![Simplified optical design of the BioTools ChiralRAMAN backscattering SCP ROA instrument. The lenses are represented by double-headed arrows. Adapted from [61].](https://content.iospress.com:443/media/bsi/2015/4-3/bsi-4-3-bsi113/bsi-4-bsi113-g006.jpg)
A commercial instrument based on the Hug design that incorporates a sophisticated artefact-suppression protocol, based on a ‘virtual enantiomers’ approach which greatly facilitates the routine acquisition of reliable ROA spectra [59,60], was developed (the previously mentioned ChiralRAMAN from BioTools, Inc.). It provides high-quality protein ROA spectra in ∼2–5 h, several times faster than our home-built ICP ROA instruments, using a sample volume of ∼30 µl and ∼500 mW of focused laser power at the sample, and extends protein ROA data acquisition routinely to the low-wavenumber region ∼200–600 cm−1. For neat liquid samples of small chiral molecules, it provides high-quality ROA spectra in just a few minutes.
In this article ROA spectra acquired both with our earlier home-built instruments employing the ICP strategy and with the SCP ChiralRAMAN instrument are presented.
5.ROA of Biomolecules
5.1.General
The dramatic improvements in instrumentation in the late 1980s, described above, rendered biomolecules in aqueous solution accessible to ROA for the first time. It was not long before studies on amino acids, peptides, proteins, carbohydrates, glycoproteins, nucleic acids and even viruses were being made in my Glasgow laboratory. The pioneering first decade of biomolecular ROA work in Glasgow is reviewed in [21]. It quickly became apparent that ROA is much more incisive than conventional vibrational spectroscopy for the study of biomolecules. The normal modes of vibration of biomolecules can be highly complex, with contributions from vibrational coordinates within both the backbone and side chains. ROA spectroscopy is able to provide more informative, less complex, spectra than conventional infrared or Raman since the largest signals are often associated with vibrational coordinates that sample the most rigid and chiral parts of the structure. These are usually located within the backbone and often give rise to ROA band patterns characteristic of the backbone conformation. Polypeptides in the standard conformations defined by characteristic Ramachandran ϕ, ψ angles found in secondary, loop and turn structure within proteins are particularly favourable in this respect since signals from the peptide backbone usually dominate the ROA spectrum. In contrast, the parent conventional Raman spectrum of a protein is dominated by bands arising from the amino acid side chains which often obscure the peptide backbone bands. Carbohydrate ROA spectra are similarly dominated by signals from skeletal vibrations, in this case centred on the constituent sugar rings and the connecting glycosidic links. Although the parent Raman spectra of nucleic acids are dominated by bands from the intrinsic base vibrations, signals characteristic of the stereochemical arrangements of the bases, the sugar rings, and the sugar–phosphate backbone dominate their ROA spectra.
The time scale of the Raman scattering event (∼3.3 × 10⁻¹⁴ s for a vibration with Stokes wavenumber shift ∼1000 cm−1 excited in the visible) is much shorter than that of the fastest conformational fluctuations. The ROA spectrum is therefore a superposition of ‘snapshot’ spectra from all the distinct conformations present in the sample at equilibrium. In contrast, the long timescale of NMR means that it only senses the average structure of interconverting conformers and requires reliable molecular dynamics (MD) simulations to interpret the data. Furthermore, since ROA observables depend on absolute chirality, there is a cancellation of contributions from quasi-enantiomeric structures, which can arise as mobile structures explore the range of accessible conformations. These factors result in ROA exhibiting an enhanced sensitivity to the dynamic aspects of biomolecular structure, making it a new source of information on order–disorder and other types of structural transitions. In contrast, observables that are ‘blind’ to chirality, such as conventional Raman band intensities, are generally additive and therefore less sensitive to conformational mobility.
Ab initio ROA computations are starting to make an impact on studies of the aqueous solution conformations of biomolecules. For example, an analysis of the conformational space of zwitterionic L-alanine revealed that shapes of Raman and ROA bands are to a large extent determined by rotation of NH3+, COO− and CH3 groups and hence that it is essential to take into account dynamic factors for successful simulations [67]. And by transferring molecular property tensors from smaller fragments to the whole structure, together with optimization in normal coordinates, the influence of side chains on Raman and ROA spectra of poly(L-proline) was simulated by averaging different proline ring conformations [68], with later DFT calculations and experimental ROA spectra of a series of proline oligomers providing insight into polyproline folding [90]. By using the molecular property tensor transfer method, smaller proteins such as insulin are starting to become accessible to quantum-chemical simulations of their ROA spectra [103]; however, an earlier calculation on metallothionein was achieved without using any approximation such as the tensor transfer method [73]. These promising initial studies suggest that comparison of measured ROA spectra with simulations may eventually become a routine method for determination of the three-dimensional solution structures of proteins.
The short timescale advantage of ROA was illustrated in a determination of conformational populations of some simple sugars in aqueous solution, for comparison with conformations observed in the gas phase, in which basis sets of computed ROA spectra were used to construct weighted sums which approximately reproduced the observed ROA spectra [74]. A new modelling strategy has been developed for coping with the impact of solvent effects on ROA analysis [79], which are especially dramatic for carbohydrates. An example of its power for facilitating the application of ROA to probe the structure and dynamics of biomolecules in aqueous solution was convincingly demonstrated recently in a combined DFT and MD study of two biologically significant carbohydrates, namely D-glucuronic acid and N-acetyl-D-glucosamine [78]. By performing a full MD simulation of hydration effects from a large number of explicit water molecules, together with extensive conformational averaging, excellent agreement was found between measured and calculated ROA spectra. On account of the multiple solvated hydroxyl groups present, without such extensive simulation of hydration only poor agreement obtains.
5.2.Protein structure
ROA has much potential for protein structure determination in solution [105]. Hen lysozyme provides a good first example of a protein ROA spectrum (Fig. 7). The largest features, associated with secondary structure, appear in the amide I region ∼1630–1700 cm−1 assigned mostly to the C=O stretch, and the extended amide III region ∼1230–1350 cm−1 assigned mostly to the in-phase combination of the in-plane N−H deformation with the C−N stretch together with Cα−H deformations. But every feature, including the weaker side-chain bands, is real and reproducible and is reporting on some element of the three-dimensional structure. Shown beneath the ∼1200–1450 cm−1 region is our very first protein ROA spectrum, measured on hen lysozyme in 1990 [19]: it may be seen that it was indeed the ‘real thing’ and represented a milestone in the spectroscopy of biomolecules, although at the time we had no idea if we were simply recording rubbish, or what it meant if genuine! Since then, hundreds of protein ROA spectra have been recorded and interpreted. It was soon apparent that, in addition to signatures of secondary structure like α-helix [76] and β-sheet [75], characteristic signals from loops and turns also appear which means that, rather than dwelling on ROA bands characteristic of secondary structure elements and how the corresponding percentages may be extracted, as is commonly done for other spectroscopic techniques, basic structural types or even motifs and folds in some cases might be recognized from the overall ROA band patterns. This is illustrated by the ROA spectra for a set of proteins with different folds displayed in Fig. 8. An example of how protein ROA spectra contain motif or fold information is provided by the negative band at ∼1374 cm−1 assigned to β-turns in the ROA spectrum of the
Fig. 7.
The backscattered Raman and ROA spectra of hen lysozyme in aqueous solution measured on a modern SCP instrument, together with our first protein ROA spectrum recorded with an ICP instrument in 1990 in the ∼1200–1450 cm−1 range taken from [19]. (Colors are visible in the online version of the article; http://dx.doi.org/10.3233/BSI-150113.)
![The backscattered Raman and ROA spectra of hen lysozyme in aqueous solution measured on a modern SCP instrument, together with our first protein ROA spectrum recorded with an ICP instrument in 1990 in the ∼1200–1450 cm−1 range taken from [19]. (Colors are visible in the online version of the article; http://dx.doi.org/10.3233/BSI-150113.)](https://content.iospress.com:443/media/bsi/2015/4-3/bsi-4-3-bsi113/bsi-4-bsi113-g007.jpg)
Fig. 8.
The backscattered SCP Raman and ROA spectra for a set of proteins with different folds, all in aqueous solution. Adapted from [105]. (Colors are visible in the online version of the article; http://dx.doi.org/10.3233/BSI-150113.)
![The backscattered SCP Raman and ROA spectra for a set of proteins with different folds, all in aqueous solution. Adapted from [105]. (Colors are visible in the online version of the article; http://dx.doi.org/10.3233/BSI-150113.)](https://content.iospress.com:443/media/bsi/2015/4-3/bsi-4-3-bsi113/bsi-4-bsi113-g008.jpg)
Fig. 9.
A two-dimensional NLM plot for a set of 85 polypeptide, protein and virus ROA spectra. The numbers refers to members of a set of disordered peptides and unfolded proteins which revealed striking differences between the structural characteristics of natively unfolded proteins and proteins unfolded by denaturation. More complete definitions of the structural types are: all α, ≳60% α-helix with little or no other secondary structure; mainly α, ≳35% α-helix and a small amount of β-sheet (∼5–15%);
![A two-dimensional NLM plot for a set of 85 polypeptide, protein and virus ROA spectra. The numbers refers to members of a set of disordered peptides and unfolded proteins which revealed striking differences between the structural characteristics of natively unfolded proteins and proteins unfolded by denaturation. More complete definitions of the structural types are: all α, ≳60% α-helix with little or no other secondary structure; mainly α, ≳35% α-helix and a small amount of β-sheet (∼5–15%); αβ, similar significant amounts of α-helix and β-sheet; mainly β, ≳35% β-sheet and a small amount of α-helix (∼5–15%); all β, ≳45% β-sheet with little or no other secondary structure; mainly disordered/irregular, little secondary structure; all disordered/irregular, no secondary structure. The black squares identify a subset of mainly α proteins containing mostly α-helix and disordered structure with little or no β-sheet. Adapted from [107]. (The colors are visible in the online version of the article; http://dx.doi.org/10.3233/BSI-150113.)](https://content.iospress.com:443/media/bsi/2015/4-3/bsi-4-3-bsi113/bsi-4-bsi113-g009.jpg)
The large number of resolved structure-sensitive bands in protein ROA spectra makes them suitable for the application of multivariate analysis (pattern recognition) techniques to extract structural information. Useful structural relationships among proteins may be obtained by analyzing their ROA spectra using the method of principal component analysis (PCA) [10,11,75,105]. The more advanced multivariate analysis method called nonlinear mapping (NLM) was found to yield even better results, with a two-dimensional (2D) NLM plot (Fig. 9) for a large set of polypeptide, protein and virus ROA spectra in aqueous solution showing excellent clustering corresponding to different types of structure [106,108]. Clusters corresponding to the following structural classes are observed: all α, mainly α,
Fig. 10.
Averages of the standardized backscattered ROA spectra (ICP and SCP) in aqueous solution for the seven main protein structure classes within a set of 80 polypeptide, protein and virus ROA spectra. The vertical axis represents arbitrary intensities standardized to put the spectra on an equal footing. Adapted from [108].
![Averages of the standardized backscattered ROA spectra (ICP and SCP) in aqueous solution for the seven main protein structure classes within a set of 80 polypeptide, protein and virus ROA spectra. The vertical axis represents arbitrary intensities standardized to put the spectra on an equal footing. Adapted from [108].](https://content.iospress.com:443/media/bsi/2015/4-3/bsi-4-3-bsi113/bsi-4-bsi113-g010.jpg)
As well as structure classes, analytical methods have also been applied to determine quantitative secondary structure content. Applying the partial least squares algorithm with fivefold cross validation to 44 ROA and 24 Raman protein spectra from the same dataset as that used for the PCA and NLM analysis outlined above, secondary structure contents could be determined with considerably better accuracy than any other spectroscopic method, including UVCD, yet reported [71].
Additional details provided by ROA include discrimination between hydrated and unhydrated α-helix [76,102] and possibly β-sheet [75], and side chain conformation [20,26,105,106] including the absolute stereochemistry of side chains such as tryptophan [33,63].
5.3.Unfolded proteins, PPII helix and ‘a careful disorderliness’
ROA is proving valuable for the study of proteins that are unfolded in their native functional state. Such ‘natively unfolded’ or ‘intrinsically disordered’ proteins are now recognized as constituting an important structural class that have a variety of important functions [46,47,99]. ROA has helped to establish this new area of protein science [10]. A study of residual structure in disordered peptides and unfolded proteins carried out via multivariate analysis and ab initio simulation of ROA spectra revealed striking differences between the structural characteristics of natively unfolded proteins and proteins unfolded by denaturation [107]. The former tend to cluster in the mainly disordered/irregular region of the 2D NLM plot and contain a significant amount of the PPII conformation; the latter appear in other regions and contain significant amounts of β-sheet in the case of reduced proteins, and of α-helix in the case of acid molten globules (Fig. 9). Multivariate analysis was also used to reinforce the visual interpretation of the ROA spectra measured during a study which found dramatic differences in the influence of Cu2+ and Mn2+ ions on prion protein folding: the former induced an almost completely disordered irregular (non-PPII) structure, whereas the latter reinforced the α-helix content [104].
ROA is especially valuable for the identification of PPII helix in unfolded protein states. Although originally defined for the conformation adopted by polymers of L-proline, the PPII helix can be supported by amino acid sequences other than those based on L-proline. It consists of a left-handed helix occupying a region of the Ramachandran surface adjacent to the β-region. The extended nature of the PPII helix precludes intrachain hydrogen bonds, the structure being stabilized instead by main chain hydrogen bonding with water molecules and side chains. Its plastic adaptable structure facilitates its role as a flexible structured linker between helices and β-strands in folded proteins [2] and may be important in the regulatory multiple weak interactions that are increasingly being recognized as associated with intrinsically disordered sequences within proteins [46,47,99]. The absence of intrachain hydrogen bonds, together with its inherent flexibility, means that the PPII helix is not readily amenable to traditional methods of structure determination with the result that it tends to be overlooked within the mainstream structural biology community. Although the PPII conformation is indistinguishable from an irregular structure by 1H NMR [95], it can be distinguished from random coil in polypeptides using other optical spectroscopies [40,94,95], but these have difficulty in identifying it when other conformational elements are present, as in proteins. However, it is readily identified even in proteins using ROA [77], which has proved valuable for studying PPII in unfolded and partially folded proteins [10] such as caseins [96] and wheat gluten proteins [35], and its possible role in amyloid fibril formation in certain protein misfolding diseases, either in natively unfolded proteins such as α-synuclein and tau [96], or in proteins containing both disordered and structured domains such as a prefibrillar denatured state of human lysozyme [36] and the prion protein [32]. The ROA spectrum of β-casein, displayed in Fig. 8, is characteristic of a PPII-rich structure, the main features being the strong positive ROA band at ∼1318 cm−1 together with the weak positive ROA band at ∼1673 cm−1.
The manner in which hydration stabilises the PPII helical conformation in a plastic adaptable manner is especially important since it enables ‘disordered’ sequences in folded and natively unfolded proteins to perform many essential functions [2,40,95]. Furthermore, hydrated PPII structure may facilitate protein folding since it pre-organizes the unfolded state thereby lowering the entropy and reducing the conformational space to be searched [94]. ROA has demonstrated that interconversion between the PPII element of disordered structure and hydrated α-helix is a facile process [36], a conclusion subsequently confirmed by UV Raman [3], and this process may be exploited in certain order–disorder transitions in many systems. For example, some natively unfolded proteins are known to adopt an α-helical conformation when binding to partner functional proteins [47]. The common assumption that residual helical structure in the unfolded sequences is central to the coupled folding–binding process has been shown recently to be incorrect from the finding that selective replacement of residues with the helix-breaking residue proline left the folding–binding of all the proline-containing mutants largely unaffected [91], a result consistent with the concept of a central role for PPII in the function of natively unfolded proteins.
As outlined in Section 5.6, ROA has demonstrated that PPII comprises much of the large amounts of disordered structure observed in some viral coat proteins, which may be associated with the requirement for rapid adaptability and conformational and structural changes. PPII may also be important for the immune response. This idea arose from an ROA study of PPII structure in poly(L-lysine) dendrigrafts (DGLs), which revealed that although generation 1 supported predominantly the PPII conformation, the PPII content steadily decreased with increasing generation, with a concomitant increase in other backbone conformations [64]. This behaviour may be due to increasing crowding of the lysine side chains, together with suppression of backbone hydration, with increasing branching. Suppression of the PPII content of DGLs with increasing branching could be associated with their nonimmunogenic properties (http://www.colcom.eu). Intrinsic disorder is known to be crucial in the immune response: short disordered peptides are good antigens, whereas long disordered regions and intrinsically disordered proteins initiate only weak immune responses or are completely nonimmunogenic [100].
All this suggests that the dictum “there are some enterprises in which a careful disorderliness is the true method” (Herman Melville, Moby Dick), with PPII the quintessential ‘carefully disordered’ conformation, seems to be just as applicable to protein structure, folding and function as it was to chasing whales around the globe!
5.4.Carbohydrates and glycoproteins
Carbohydrates in aqueous solution are favourable samples for ROA studies, giving rich and informative band structures over a wide range of the vibrational spectrum. Our many studies in Glasgow from the early 1990s onwards [21,106] revealed that monosaccharide ROA spectra contain information on the ring conformation, the relative disposition of hydroxyl groups around the ring, the absolute configuration and axial or equatorial orientation of groups attached to the anomeric carbon, and the exocyclic CH2OH conformation; disaccharide ROA spectra contain information on the type and conformation of the glycosidic link; and oligo- and polysaccharide ROA spectra can distinguish disordered structure from extended order such as helical. As outlined earlier, complete solution structure and conformational dynamics of carbohydrates in aqueous solution are now accessible from ROA measurements combined with computational modelling.
Fig. 11.
Backscattered SCP Raman and ROA spectra of yeast external invertase, together with those of two mannose trisaccharides prominent in the glycan chains, all in aqueous solution. Adapted from [65]. (Colors are visible in the online version of the article; http://dx.doi.org/10.3233/BSI-150113.)
![Backscattered SCP Raman and ROA spectra of yeast external invertase, together with those of two mannose trisaccharides prominent in the glycan chains, all in aqueous solution. Adapted from [65]. (Colors are visible in the online version of the article; http://dx.doi.org/10.3233/BSI-150113.)](https://content.iospress.com:443/media/bsi/2015/4-3/bsi-4-3-bsi113/bsi-4-bsi113-g011.jpg)
Intact glycoproteins also provide excellent ROA spectra with clear bands originating in both the polypeptide and carbohydrate components from which information about the structure of both components may be deduced [106]. This should be valuable in view of the central importance of glycoproteins in biochemistry and the biopharmaceutical industry, and the fact that they are difficult to study using the conventional techniques of structural biology. The results of a recent study of a high-mannose glycoprotein, yeast external invertase [65], are summarized in Fig. 11. The ROA spectrum is dominated by signals characteristic of the constituent Man–Man linkages of the glycan chains. The absence of any polypeptide secondary structure ROA bands suggests that the high glycosylation (∼50%) holds the polypeptide backbone in a relatively rigid (non-PPII) disordered conformation.
5.5.Nucleic acids
Although ROA studies of nucleic acids are not as advanced as for proteins, the results so far are promising [11,21]. Studies on pyrimidine nucleosides and synthetic polyribonucleotides [27] provided a basis for the interpretation of ROA spectra of RNA and DNA [28]. Unique ROA fingerprints of several distinct RNA structural motifs have also been reported [55]. ROA is sensitive to four different sources of nucleic acid chirality: the chiral base-stacking arrangement of intrinsically achiral base rings, the chiral disposition of the base and sugar rings with respect to the C−N glycosidic links, the inherent chirality associated with the asymmetric centers of the sugar rings, and the chiral conformation of the sugar–phosphate backbone.
The Raman and ROA spectra of calf thymus DNA, and of phenylalanine-specific transfer RNA (tRNAPhe) in the presence and absence of Mg2+ ions, are shown in Fig. 12 [28]. Although the ROA spectra of the DNA and the two RNAs are similar, important differences of detail exist. The main differences originate in the DNA taking up a B-type double helix in which the sugar puckers are mainly C2′-endo and the RNAs taking up A-type double helical segments where the sugar puckers are mainly C3′-endo. There are smaller differences between the two RNA spectra and these are most apparent in the sugar–phosphate region ∼900–1150 cm−1. It is known that Mg2+ ions are necessary to hold RNAs in their specific tertiary folds. As illustrated in Fig. 12, for tRNAPhe in the presence of Mg2+ this is a compact L-shaped form; whereas in the absence of Mg2+ the tRNAPhe adopts an open cloverleaf secondary structure. The Mg2+-free tRNAPhe shows a strong negative–positive–negative ROA triplet (shaded) at ∼992, 1048 and 1091 cm−1 which is very similar to that found in A-type polyribonucleotides [27] and is assigned to the C3′-endo sugar pucker. This signature is weaker and more complex in the ROA spectrum of the Mg2+-bound sample, suggesting a wider range of sugar puckers associated with the loops and turns that characterize the tertiary structure of the folded form.
Fig. 12.
Backscattered ICP Raman and ROA spectra of (a) calf thymus DNA, (b) Mg2+-bound tRNAPhe and its associated L-shaped tertiary fold and (c) Mg2+-free tRNAPhe and its associated open cloverleaf secondary structure, in aqueous solution. Adapted from [28].
![Backscattered ICP Raman and ROA spectra of (a) calf thymus DNA, (b) Mg2+-bound tRNAPhe and its associated L-shaped tertiary fold and (c) Mg2+-free tRNAPhe and its associated open cloverleaf secondary structure, in aqueous solution. Adapted from [28].](https://content.iospress.com:443/media/bsi/2015/4-3/bsi-4-3-bsi113/bsi-4-bsi113-g012.jpg)
5.6.Viruses
Knowledge of the structure of viruses at the molecular level is essential for understanding their modus operandi. However, key structural biology techniques such as X-ray crystal or fibre diffraction, or cryo-electron microscopy, are not always applicable. Conventional Raman is valuable in studies of intact viruses at the molecular level as it is able to simultaneously probe both the protein and nucleic acid constituents [98]. The additional incisiveness of ROA further enhances the value of Raman spectroscopy in structural virology. Remarkably, ROA spectra may be obtained for most types of intact virus in aqueous solution, including filamentous, cylindrical and icosahedral [11,34], as illustrated in Fig. 13. Even more remarkable is that valuable information such as the folds of the major coat proteins can simply be ‘read off’! For example, the ROA band pattern for the filamentous bacteriophage fd at the top is highly characteristic of an extended helix and looks very similar to that of α-helical polypeptides [10,11,21,76,105,106]; that of the second, tobacco mosaic virus, is characteristic of proteins with a helix bundle fold; those of the third and fourth, satellite tobacco virus and the MS2 virus capsid, are characteristic of up-down antiparallel β-sheet [75], with that of STMV containing additional bands characteristic of a significant amount of disordered structure from the many long strands.
Fig. 13.
Typical backscattered ICP Raman and ROA spectra of different structural types of virus, all in aqueous solution. The distinct folds of the corresponding major coat proteins are shown on the right. Adapted from [34]. (Colors are visible in the online version of the article; http://dx.doi.org/10.3233/BSI-150113.)
![Typical backscattered ICP Raman and ROA spectra of different structural types of virus, all in aqueous solution. The distinct folds of the corresponding major coat proteins are shown on the right. Adapted from [34]. (Colors are visible in the online version of the article; http://dx.doi.org/10.3233/BSI-150113.)](https://content.iospress.com:443/media/bsi/2015/4-3/bsi-4-3-bsi113/bsi-4-bsi113-g013.jpg)
The first virus ROA spectra were reported for filamentous bacteriophages [31]; these data facilitated the identification of ROA bands associated with unhydrated and hydrated α-helix since large amounts of both types are present in the overlapping extended helical coat proteins in the intact viruses. ROA has also proved useful in the comparison of the helix bundle coat protein structure of the rod-shaped viruses potato virus X (PVX) and narcissus mosaic virus (NMV) with that of TMV [38]. Also, a remarkable discovery that tryptophan conformation and absolute stereochemistry could be determined from the signs of the tryptophan W3 ROA bands was made from ROA data on filamentous bacteriophages [33], further insight into this assignment being provided by later DFT calculations [63]. The importance of intrinsic disorder in viral coat proteins is being increasingly recognized, especially to facilitate rapid changes at almost all stages of their life cycle, with many functions attributed to disordered regions [101]. In fact the strong positive ∼1316 cm−1 band in the ROA spectrum of STMV (Fig. 13) reveals that the many long disordered strands in the coat protein X-ray structure comprise mainly PPII structure. Similarly the ROA spectrum of tobacco rattle virus reveals that it contains a large amount of PPII structure, much more than TMV, and could serve to fill the extra volume required by the larger diameter of the cylindrical TRV particles relative to those of TMV [37].
Finally, the special power of ROA in structural virology was illustrated by a study on cowpea mosaic virus [34] in which the ROA spectrum of the intact virus was separated into three spectra characteristic of the jelly roll β-sandwich fold of the identical coat proteins making up the icosahedral capsid and of the two separately encapsidated distinct nucleic acid genomes, RNA1 and RNA2. A comparison with the magnesium-free tRNA ROA spectrum discussed in Section 5.5 revealed that both RNA1 and RNA2 in the core have identical A-type helical conformations, information not available from the X-ray crystal structure.
6.Future directions
ROA should be particularly valuable for the determination of protein structure and function in the post-genomic era, especially for the many proteins specified by a genome, be they folded, unfolded or partially unfolded, which are inaccessible to X-ray and NMR methods. ROA will be useful even for those proteins that do crystallize since it provides fold information, albeit not at atomic resolution, and could be valuable for solving X-ray crystal structures by molecular replacement methods because ROA data will identify those proteins with the most structural similarity to the proteins under study.
The apparent lack of an upper size limit to the structures that may be studied with ROA, exemplified by the lysine dendrigraft generations and the intact viruses, together with its short timescale which facilitates studies of conformational dynamics in aqueous solution, exemplified by simulations on carbohydrates, offers significant advantages over NMR for some applications. Furthermore, since many of the thousands of known viruses are likely to be inaccessible to the key techniques of structural biology, structural virology is a particularly promising area for ROA on account of the ease with which the folds of the major coat proteins may be ‘read off’ from their ROA spectra and differences of detail identified between coat proteins of different viruses having the same basic fold, and also due to its ability to provide information about the nucleic acid core and protein–nucleic acid interactions. It may also be possible to obtain information about the carbohydrate structure and dynamics of viral envelope glycoproteins.
In addition to the determination of the absolute configuration of chiral drugs, the pharmaceutical industry is becoming increasingly aware of the value of ROA for characterising and monitoring glycoprotein biopharmaceuticals since it is uniquely sensitive to the structural and conformational details of both the polypeptide backbones and carbohydrate chains of the intact biomolecules in aqueous solution. A recently published example was the use of ROA for the structural characterization of a monoclonal antibody subjected to heat stress [97]. Now that patent protection is expiring on the first tranche of biopharmaceuticals, companies are working to produce ‘biosimilars’ which reproduce the overall structure, function and clinical characteristics of the original product. Biological drugs are produced in living cells, not chemical plants, so copies can at best only be highly similar to the original. Since the hurdles imposed by regulatory authorities will be much higher for biosimilars than for generic versions of small-molecule drugs, ROA is expected to be valuable for their characterisation and validation on account of its unique ability to detect subtle structural and conformational differences compared with the original. What a pity our original 1971 patent – which covered all applications of Rayleigh and Raman optical activity – expired long ago!
Two-dimensional spectroscopic correlation methods, based on linear relationships between spectral data obtained under a perturbing influence such as change of temperature or pH, have the potential to increase the amount of information that may be extracted from ROA spectra. Spectral resolution is enhanced by spreading bands over a second dimension which can provide, inter alia, unambiguous band assignments. Studies of the α-helix to β-sheet transition of poly(L-lysine) as a function of temperature [4], and of the α-helix to disordered transition in poly(L-glutamic acid) as a function of pH [5], have demonstrated the value of two-dimensional ROA measurements in biomolecular science.
An especially important future direction is the further development of computational simulations of ROA spectra, in particular the dramatic influence of water solvation, since this will be essential in order to exploit fully the wealth of information they can provide. A recent review of the progress that has been made in recent years in achieving reliable and accurate simulations also highlights how the remarkable sensitivity of ROA to molecular structure and dynamics can be exploited in force field design and vibrational analysis [79].
Several new types of ROA experiments and the associated instrumentation are under active development with a view to biomolecular applications. Although resonance ROA is still in its infancy [80], it has the potential to boost the intensity by several orders of magnitude, thereby enabling much more dilute samples to be studied. Resonance and pre-resonance UV ROA measurements on biomolecules, using UV lasers or perhaps synchrotron beams for the light source, could be especially valuable. A backscattering ICP ROA instrument using deep UV excitation at 244 nm from a frequency-doubled continuous argon ion laser has been developed and is starting to provide data on both small chiral organic molecules and biomolecules [66]. The possibility of a large increase in the sensitivity of ROA of biomolecules via surface enhanced Raman scattering (SERS) is attractive [1], but reliable experimental data so far are scarce and rather disappointing. Although genuine SERS ROA has now been observed in the form of mirror-image bands for D- and L-ribose [89], and modelled theoretically [83], the technique does not yet appear to be useful for the routine study of biomolecules. A nonlinear version of ROA has been realized recently by means of coherent anti-Stokes Raman scattering (CARS) [54]. This first observation of ROA with a pulsed laser source holds promise for unravelling the dynamics of biomolecules in aqueous solution.
Despite these new types of ROA experiment, ‘conventional’ ROA measurements with transparent samples in aqueous solution using visible laser excitation is expected to remain the simplest and most informative strategy for most routine biomolecular studies. Although there has been a huge increase in sensitivity from the first 1972 ROA instrument to the latest versions and which has facilitated the applications to biomolecules, further reductions in measurement times, sample concentrations, etc., remain highly desirable to widen the realm of applications. From the beginning, ROA instrument development has fed voraciously on new optical–electronic technology, especially with regard to detectors for use in optical astronomy, and this trend is expected to continue from advances in, inter alia, photonics for astronomical applications [39].
A sufficient body of experimental data has now been accumulated and analysed to demonstrate that ROA can provide new and incisive information about chiral molecular systems complementary to that obtained from other techniques. The many applications of ROA to biomolecular science that are outlined in this article provide the merest glimpse of what is now possible. Indeed, a recent review [84] of the current state of ROA theory, instrumentation and applications, together with an outline of future extensions, concludes with the statement: “The examples shown in the present review demonstrate an enormous potential of the ROA technique, both in the classical field of biomolecular studies, and in new applications including heterogeneous and large scale systems”.
Acknowledgements
I thank the many students, research assistants and collaborators who have contributed to the Glasgow biomolecular ROA programme. I am also grateful to the EPSRC and BBSRC for funding over many years, but especially to the Wolfson Foundation for providing an equipment grant at a critical time in 1989, which enabled the Glasgow backscattering ICP ROA instrument to be constructed using the latest technology, and without which the biomolecular ROA work described here may not have come about. Likewise the EPSRC for a Senior Fellowship (1995–2000) that gave me the freedom to concentrate on the development of biomolecular ROA.
References
1 | [[1]] S. Abdali and E.W. Blanch, Surface enhanced Raman optical activity (SEROA), Chem. Soc. Rev. 37: ((2008) ), 980–992. |
2 | [[2]] A.A. Adzhubei and M.J.E. Sternberg, Polyproline II helix in proteins: Structure and function, J. Mol. Biol. 425: ((2013) ), 2100–2132. |
3 | [[3]] S.A. Asher, A.V. Mikhonin and S. Bykov, UV Raman demonstrates that α-helical polyalanine peptides melt to polyproline II conformations, J. Am. Chem. Soc. 126: ((2004) ), 8433–8440. |
4 | [[4]] L. Ashton, L.D. Barron, B. Czarnik-Matusewicz, L. Hecht, J. Hyde and E.W. Blanch, Two-dimensional correlation analysis of Raman optical activity data on the α-helix-to-β-sheet transition in poly(L-lysine), Mol. Phys. 104: ((2006) ), 1429–1455. |
5 | [[5]] L. Ashton, L.D. Barron, L. Hecht, J. Hyde and E.W. Blanch, Two-dimensional Raman and Raman optical activity correlation analysis of the α-helix-to-disordered transition in poly(L-glutamic acid), Analyst 132: ((2007) ), 468–479. |
6 | [[6]] P.W. Atkins and L.D. Barron, Rayleigh scattering of polarized photons by molecules, Mol. Phys. 16: ((1969) ), 453–466. |
7 | [[7]] L.D. Barron, Magnetic vibrational optical activity in the resonance Raman spectrum of ferrocytochrome c, Nature 257: ((1975) ), 372–374. |
8 | [[8]] L.D. Barron, Molecular Light Scattering and Optical Activity, 2nd edn, Cambridge Univ. Press, Cambridge, (2004) . |
9 | [[9]] L.D. Barron, Structure and behaviour of biomolecules from Raman optical activity, Curr. Opin. Struct. Biol. 16: ((2006) ), 638–643. |
10 | [[10]] L.D. Barron, E.W. Blanch and L. Hecht, Unfolded proteins studied by Raman optical activity, Adv. Protein Chem. 62: ((2002) ), 51–90. |
11 | [[11]] L.D. Barron, E.W. Blanch, I.H. McColl, C.D. Syme, L. Hecht and K. Nielsen, Structure and behaviour of proteins, nucleic acids and viruses from Raman optical activity, Spectroscopy 17: ((2003) ), 101–126. |
12 | [[12]] L.D. Barron, M.P. Bogaard and A.D. Buckingham, Raman scattering of circularly polarized light by optically active molecules, J. Am. Chem. Soc. 95: ((1973) ), 603–605. |
13 | [[13]] L.D. Barron and A.D. Buckingham, Rayleigh and Raman scattering from optically active molecules, Mol. Phys. 20: ((1971) ), 1111–1119. |
14 | [[14]] L.D. Barron and A.D. Buckingham, Rayleigh and Raman scattering by molecules in magnetic fields, Mol. Phys. 23: ((1972) ), 145–150. |
15 | [[15]] L.D. Barron and A.D. Buckingham, A simple two-group model for Rayleigh and Raman optical activity, J. Am. Chem. Soc. 96: ((1974) ), 4769–4773. |
16 | [[16]] L.D. Barron and A.D. Buckingham, Rayleigh and Raman optical activity, Ann. Rev. Phys. Chem. 26: ((1975) ), 381–396. |
17 | [[17]] L.D. Barron and A.D. Buckingham, Vibrational optical activity, Chem. Phys. Lett. 492: ((2010) ), 199–213. |
18 | [[18]] L.D. Barron and J.R. Escribano, Stokes–antiStokes asymmetry in natural Raman optical activity, Chem. Phys. 98: ((1985) ), 437–446. |
19 | [[19]] L.D. Barron, A.R. Gargaro and Z.Q. Wen, Vibrational Raman optical activity of peptides and proteins, J. Chem. Soc., Chem. Commun. ((1990) ), 1034–1036. |
20 | [[20]] L.D. Barron and L. Hecht, Structure and behavior of biomolecules from Raman optical activity, in: Comprehensive Chiroptical Spectroscopy, Vol. 2: , N. Berova, P.L. Polavarapu, K. Nakanishi and R.W. Woody, eds, Wiley, Hoboken, NJ, (2012) , pp. 759–793. |
21 | [[21]] L.D. Barron, L. Hecht, E.W. Blanch and A.F. Bell, Solution structure and dynamics of biomolecules from Raman optical activity, Prog. Biophys. Mol. Biol. 73: ((2000) ), 1–49. |
22 | [[22]] L.D. Barron, L. Hecht, A.R. Gargaro and W. Hug, Vibrational Raman optical activity in forward scattering: Trans-pinane and β-pinene, J. Raman Spectrosc. 21: ((1990) ), 375–379. |
23 | [[23]] L.D. Barron, L. Hecht, I.H. McColl and E.W. Blanch, Raman optical activity comes of age, Mol. Phys. 102: ((2004) ), 731–744. |
24 | [[24]] L.D. Barron, J.F. Torrance and D.J. Cutler, A new multichannel Raman optical activity instrument, J. Raman Spectrosc. 18: ((1987) ), 281–287. |
25 | [[25]] L.D. Barron and J. Vrbancich, Magnetic Raman optical activity, Adv. Infrared Raman Spectrosc. 12: ((1985) ), 215–272. |
26 | [[26]] L.D. Barron, F. Zhu, L. Hecht and N.W. Isaacs, in: Methods in Protein Structure and Stability Analysis, V.N. Uversky and E.A. Permyakov, eds, Nova Science Publishers, New York, (2007) , pp. 27–68. |
27 | [[27]] A.F. Bell, L. Hecht and L.D. Barron, Vibrational Raman optical activity as a probe of polyribonucleotide solution stereochemistry, J. Am. Chem. Soc. 119: ((1997) ), 6006–6013. |
28 | [[28]] A.F. Bell, L. Hecht and L.D. Barron, Vibrational Raman optical activity of DNA and RNA, J. Am. Chem. Soc. 120: ((1998) ), 5820–5821. |
29 | [[29]] N. Berova, P.L. Polavarapu, K. Nakanishi and R.W. Woody (eds), Comprehensive Chiroptical Spectroscopy, Vol. 1: , Wiley, Hoboken, NJ, (2012) . |
30 | [[30]] N. Berova, P.L. Polavarapu, K. Nakanishi and R.W. Woody (eds), Comprehensive Chiroptical Spectroscopy, Vol. 2: , Wiley, Hoboken, NJ, (2012) . |
31 | [[31]] E.W. Blanch, A.F. Bell, L. Hecht, L.A. Day and L.D. Barron, Raman optical activity of filamentous bacteriophages: Hydration of α-helices, J. Mol. Biol. 290: ((1999) ), 1–7. |
32 | [[32]] E.W. Blanch, A.C. Gill, A.G.O. Rhie, J. Hope, L. Hecht, K. Nielsen and L.D. Barron, Raman optical activity demonstrates poly(L-proline) II helix in the N-terminal region of the ovine prion protein: Implications for function and misfunction, J. Mol. Biol. 343: ((2004) ), 467–476. |
33 | [[33]] E.W. Blanch, L. Hecht, L.A. Day, D.M. Pederson and L.D. Barron, Tryptophan absolute stereochemistry in viral coat proteins from Raman optical activity, J. Am. Chem. Soc. 123: ((2001) ), 4863–4864. |
34 | [[34]] E.W. Blanch, L. Hecht, C.D. Syme, V. Volpetti, G.P. Lomonossoff, K. Nielsen and L.D. Barron, Molecular structure of viruses from Raman optical activity, J. Gen. Virol. 83: ((2002) ), 2593–2600. |
35 | [[35]] E.W. Blanch, D.K. Kasarda, L. Hecht, K. Nielsen and L.D. Barron, New insight into the solution structures of wheat gluten proteins from Raman optical activity, Biochemistry 42: ((2003) ), 5665–5673. |
36 | [[36]] E.W. Blanch, L.A. Morozova-Roche, D.A.E. Cochran, A.J. Doig, L. Hecht and L.D. Barron, Is polyproline II helix the killer conformation? A Raman optical activity study of the amyloidogenic prefibrillar intermediate of human lysozyme, J. Mol. Biol. 301: ((2000) ), 553–563. |
37 | [[37]] E.W. Blanch, D.J. Robinson, L. Hecht and L.D. Barron, A comparison of the solution structures of tobacco rattle and tobacco mosaic viruses from Raman optical activity, J. Gen. Virol. 82: ((2001) ), 1499–1502. |
38 | [[38]] E.W. Blanch, D.J. Robinson, L. Hecht, C.D. Syme, K. Nielsen and L.D. Barron, Solution structures of potato virus X and narcissus mosaic virus from Raman optical activity, J. Gen. Virol. 83: ((2002) ), 241–246. |
39 | [[39]] J. Bland-Hawthorn and P. Kern, Molding the flow of light: Photonics in astronomy, Physics Today 65: (5) ((2012) ), 31–37. |
40 | [[40]] B. Bochicchio and A.M. Tamburro, Polyproline II structure in proteins: Identification by chiroptical spectroscopies, stability and functions, Chirality 14: ((2002) ), 782–792. |
41 | [[41]] A.D. Buckingham and M.B. Dunn, Optical activity of oriented molecules, J. Chem. Soc. A ((1971) ), 1988–1991. |
42 | [[42]] A.D. Buckingham and H.C. Longuet-Higgins, The quadrupole moments of dipolar molecules, Mol. Phys. 14: ((1968) ), 63–72. |
43 | [[43]] P.R. Carey, Biochemical Applications of Raman and Resonance Raman Spectroscopies, Academic Press, New York, (1982) . |
44 | [[44]] J. Costante, L. Hecht, P.L. Polavarapu, A. Collet and L.D. Barron, Absolute configuration of bromochlorofluoromethane from experimental and ab initio theoretical vibrational Raman optical activity, Angew. Chem. Int. Ed. Engl. 36: ((1997) ), 885–887. |
45 | [[45]] DALTON, A molecular electronic structure program, Release DALTON13, available at: http://daltonprogram.org. |
46 | [[46]] A.K. Dunker, I. Silman, V.N. Uversky and J.L. Sussman, Function and structure of intrinsically disordered proteins, Curr. Opin. Struct. Biol. 18: ((2008) ), 756–764. |
47 | [[47]] H.J. Dyson and P.E. Wright, Intrinsically unstructured proteins and their functions, Nature Reviews 6: ((2005) ), 197–208. |
48 | [[48]] J.R. Escribano and L.D. Barron, Valence optical theory of vibrational circular dichroism and Raman optical activity, Mol. Phys. 65: ((1988) ), 327–344. |
49 | [[49]] Gaussian 09, Revision D.01, M.J. Frisch, G.W. Trucks, H.B. Schlegel, G.E. Scuseria, M.A. Robb, J.R. Cheeseman, G. Scalmani, V. Barone, B. Mennucci, G.A. Petersson, H. Nakatsuji, M. Caricato, X. Li, H.P. Hratchian, A.F. Izmaylov, J. Bloino, G. Zheng, J.L. Sonnenberg, M. Hada, M. Ehara, K. Toyota, R. Fukuda, J. Hasegawa, M. Ishida, T. Nakajima, Y. Honda, O. Kitao, H. Nakai, T. Vreven, J.A. Montgomery Jr., J.E. Peralta, F. Ogliaro, M. Bearpark, J.J. Heyd, E. Brothers, K.N. Kudin, V.N. Staroverov, R. Kobayashi, J. Normand, K. Raghavachari, A. Rendell, J.C. Burant, S.S. Iyengar, J. Tomasi, M. Cossi, N. Rega, N.J. Millam, M. Klene, J.E. Knox, J.B. Cross, V. Bakken, C. Adamo, J. Jaramillo, R. Gomperts, R.E. Stratmann, O. Yazyev, A.J. Austin, R. Cammi, C. Pomelli, J.W. Ochterski, R.L. Martin, K. Morokuma, V.G. Zakrzewski, G.A. Voth, P. Salvador, J.J. Dannenberg, S. Dapprich, A.D. Daniels, Ö. Farkas, J.B. Foresman, J.V. Ortiz, J. Cioslowski and D.J. Fox, Gaussian, Inc., Wallingford CT, 2009. |
50 | [[50]] L. Hecht and L.D. Barron, An analysis of modulation experiments for Raman optical activity, Appl. Spectrosc. 44: ((1990) ), 483–490. |
51 | [[51]] L. Hecht, L.D. Barron, E.W. Blanch, A.F. Bell and L.A. Day, Raman optical activity instrument for studies of biopolymer structure and dynamics, J. Raman Spectrosc. 30: ((1999) ), 815–825. |
52 | [[52]] L. Hecht, L.D. Barron, A.R. Gargaro, Z.Q. Wen and W. Hug, Raman optical activity instrument for biochemical studies, J. Raman Spectrosc. 23: ((1992) ), 401–441. |
53 | [[53]] L. Hecht, L.D. Barron and W. Hug, Vibrational Raman optical activity in backscattering, Chem. Phys. Lett. 158: ((1989) ), 341–344. |
54 | [[54]] K. Hiramatsu, M. Okuno, H. Kano, P. Leproux, V. Couderc and H. Hamaguchi, Observation of Raman optical activity by heterodyne-detected polarization-resolved coherent anti-Stokes Raman scattering, Phys. Rev. Lett. 109: ((2012) ), 083901. |
55 | [[55]] A.J. Hobro, M. Rouhi, G.L. Conn and E.W. Blanch, Raman and Raman optical activity (ROA) analysis of RNA structural motifs, Vib. Spectrosc. 48: ((2008) ), 37–43. |
56 | [[56]] G. Holzwarth, E.C. Hsu, H.S. Mosher, T.R. Faulkner and A. Moscowitz, Infrared circular dichroism of carbon–hydrogen and carbon–deuterium stretching modes. Observations, J. Am. Chem. Soc. 96: ((1974) ), 251–252. |
57 | [[57]] W. Hug, Instrumental and theoretical advances in Raman optical activity, in: Raman Spectroscopy, J. Lascombe and P.V. Huong, eds, Wiley, Chichester, (1982) , pp. 3–12. |
58 | [[58]] W. Hug, Raman optical activity spectroscopy, in: Handbook of Vibrational Spectroscopy, J.M. Chalmers and P.R. Griffiths, eds, Vol. 1: , Wiley, Chichester, (2002) , pp. 745–758. |
59 | [[59]] W. Hug, Virtual enantiomers as the solution of optical activity’s deterministic offset problem, Appl. Spectrosc. 57: ((2003) ), 1–13. |
60 | [[60]] W. Hug, Measurement of Raman optical activity, in: Comprehensive Chiroptical Spectroscopy, Vol. 1: , N. Berova, P.L. Polavarapu, K. Nakanishi and R.W. Woody, eds, Wiley, Hoboken, NJ, (2012) , pp. 147–177. |
61 | [[61]] W. Hug and G. Hangartner, A novel high-throughput Raman spectrometer for polarization difference measurements, J. Raman Spectrosc. 30: ((1999) ), 841–852. |
62 | [[62]] W. Hug, S. Kint, G.F. Bailey and J.R. Scherer, Raman circular intensity differential spectroscopy. The spectra of (−)-α-pinene and (+)-α-phenylethylamine, J. Am. Chem. Soc. 97: ((1975) ), 5589–5590. |
63 | [[63]] C.R. Jacob, S. Luber and M. Reiher, Calculated Raman optical activity signatures of tryptophan side chains, ChemPhysChem 9: ((2008) ), 2177–2180. |
64 | [[64]] C. Johannessen, J. Kapitán, H. Collet, A. Commeyras, L. Hecht and L.D. Barron, Poly(L-proline) II helix propensities in Poly(L-lysine) dendrigraft generations from vibrational Raman optical activity, Biomacromolecules 10: ((2009) ), 1662–1664. |
65 | [[65]] C. Johannessen, R. Pendrill, G. Widmalm, L. Hecht and L.D. Barron, Glycan structure of a high-mannose glycoprotein from Raman optical activity, Angew. Chem. Int. Ed. 50: ((2011) ), 5349–5351. |
66 | [[66]] J. Kapitán, L.D. Barron and L. Hecht, A novel Raman optical activity instrument operating in the deep ultraviolet spectral region, J. Raman Spectrosc. 4–6: ((2015) ), 392–399. doi:10.1002/jrs.4665. |
67 | [[67]] J. Kapitán, V. Baumruk, V. Kopecký Jr. and P. Bouř, Conformational flexibility of L-alanine zwitterion determines shapes of Raman and Raman optical activity spectral bands, J. Phys. Chem. A 110: ((2006) ), 4689–4696. |
68 | [[68]] J. Kapitán, V. Baumruk, V. Kopecký Jr., R. Pohl and P. Bouř, Proline zwitterion dynamics in solution, glass and crystalline state, J. Am. Chem. Soc. 128: ((2006) ), 13451–13462. |
69 | [[69]] J. Kapitán, C. Johannessen, P. Bouř, L. Hecht and L.D. Barron, Vibrational Raman optical activity of 1-phenylethanol and 1-phenylethylamine: Revisiting old friends, Chirality 21: ((2009) ), E4–E12. |
70 | [[70]] W. Kiefer (ed.), Journal of Raman Spectroscopy 36(4) (2005), 275–375. (Special Issue: Structure and Dynamics of Biomolecules.) |
71 | [[71]] M.N. Kinalwa, E.W. Blanch and A.J. Doig, Accurate determination of protein secondary structure content from Raman and Raman optical activity spectra, Anal. Chem. 82: ((2010) ), 6347–6349. |
72 | [[72]] D.A. Long, The Raman Effect, Wiley, Chichester, (2002) . |
73 | [[73]] S. Luber and M. Reiher, Theoretical Raman optical activity study of the β-domain of rat metallothionein, J. Phys. Chem. B 114: ((2010) ), 1057–1063. |
74 | [[74]] N.A. Macleod, C. Johannessen, L. Hecht, L.D. Barron and J.P. Simons, From the gas phase to aqueous solution: Vibrational spectroscopy, Raman optical activity and conformational structure of carbohydrates, Int. J. Mass Spectrom. 253: ((2006) ), 193–200. |
75 | [[75]] I.H. McColl, E.W. Blanch, A.C. Gill, A.G.O. Rhie, M.A. Ritchie, L. Hecht, K. Nielsen and L.D. Barron, A new perspective on β-sheet structures using vibrational Raman optical activity: From poly(L-lysine) to the prion protein, J. Am. Chem. Soc. 125: ((2003) ), 10019–10026. |
76 | [[76]] I.H. McColl, E.W. Blanch, L. Hecht and L.D. Barron, A study of α-helix hydration in polypeptides, proteins and viruses using vibrational Raman optical activity, J. Am. Chem. Soc. 126: ((2004) ), 8181–8188. |
77 | [[77]] I.H. McColl, E.W. Blanch, L. Hecht, N.R. Kallenbach and L.D. Barron, Vibrational Raman optical activity characterization of poly(L-proline) II helix in alanine oligopeptides, J. Am. Chem. Soc. 126: ((2004) ), 5076–5077. |
78 | [[78]] S.T. Mutter, F. Zielinski, J.R. Cheeseman, C. Johannessen, P.L.A. Popelier and E.W. Blanch, Conformational dynamics of carbohydrates: Raman optical activity of D-glucuronic acid and N-acetyl-D-glucosamine using a combined molecular dynamics and quantum chemical approach, Phys. Chem. Chem. Phys. 17: ((2015) ), 6016–6027. |
79 | [[79]] S.T. Mutter, F. Zielinski, P.L.A. Popelier and E.W. Blanch, Calculations of Raman optical activity spectra for vibrational analysis, Analyst ((2015) ). doi:10.1039/c4an02357a. |
80 | [[80]] L.A. Nafie, Vibrational Optical Activity, Wiley, Chichester, (2011) . |
81 | [[81]] L.A. Nafie and T.B. Freedman, Dual circular polarization Raman optical activity, Chem. Phys. Lett. 154: ((1989) ), 260–266. |
82 | [[82]] R.G. Newton, Scattering Theory of Waves and Particles, McGraw-Hill, New York, (1966) , p. 15. |
83 | [[83]] V. Novák, J. Šebestík and P. Bouř, Theoretical modelling of the surface-enhanced Raman optical activity, J. Chem. Theory Comput. 8: ((2012) ), 1714–1720. |
84 | [[84]] V. Parchaňský, J. Kapitán and P. Bouř, Inspecting chiral molecules by Raman optical activity spectroscopy, RSC Adv. 4: ((2014) ), 57125–57136. |
85 | [[85]] M. Pecul, New applications and challenges for computational ROA spectroscopy, Chirality 21: ((2009) ), E98–E104. |
86 | [[86]] G. Placzek, Rayleigh-Streuung und Raman-Effect, in: Handbuch der Radiologie, E. Marx, ed., Vol. 6: , Part 2, Akademische Verlagsgesellschaft, Leipzig, (1934) , pp. 205–374; English transl.: The Rayleigh and Raman scattering (UCRL-Trans-526(L)) from the US Department of Commerce Clearing House for Federal Scientific and Technical Information. |
87 | [[87]] P.L. Polavarapu, Ab initio vibrational Raman and Raman optical activity spectra, J. Phys. Chem. 94: ((1990) ), 8106–8112. |
88 | [[88]] P.L. Polavarapu, Vibrational Spectra: Principles and Applications with Emphasis on Vibrational Optical Activity, Elsevier, Amsterdam, (1998) . |
89 | [[89]] S.O. Pour, S.E.J. Bell and E.W. Blanch, Use of a hydrogel polymer for reproducible surface enhanced Raman optical activity (SEROA), Chem. Commun. 47: ((2011) ), 4754–4756. |
90 | [[90]] V. Profant, V. Baumruk, X. Li, M. Šafařík and P. Bouř, Tracking of the polyproline folding by density functional computations and Raman optical activity spectra, J. Phys. Chem. B 115: ((2011) ), 15079–15089. |
91 | [[91]] J.M. Rogers, C.T. Wong and J. Clarke, Coupled folding and binding of the disordered protein PUMA does not require particular residual structure, J. Am. Chem. Soc. 136: ((2014) ), 5197–5200. |
92 | [[92]] K. Ruud, Ab initio methods for vibrational circular dichroism and Raman optical activity, in: Comprehensive Chiroptical Spectroscopy, Vol. 1: , N. Berova, P.L. Polavarapu, K. Nakanishi and R.W. Woody, eds, Wiley, Hoboken, NJ, (2012) , pp. 699–727. |
93 | [[93]] K. Ruud and A.J. Thorvaldsen, Theoretical approaches to the calculation of Raman optical activity spectra, Chirality 21: ((2009) ), E54–E67. |
94 | [[94]] Z. Shi, R.W. Woody and N.R. Kallenbach, Is polyproline II a major backbone conformation in unfolded proteins?, Adv. Protein Chem. 62: ((2002) ), 163–240. |
95 | [[95]] G. Siligardi and A.F. Drake, The importance of extended conformations and, in particular, the PII conformation for the molecular recognition of peptides, Biopolymers 37: ((1995) ), 281–292. |
96 | [[96]] C.D. Syme, E.W. Blanch, C. Holt, R. Jakes, M. Goedert, L. Hecht and L.D. Barron, A Raman optical activity study of rheomorphism in caseins, synucleins and tau protein: Implications for fibrillogenic propensity, Eur. J. Biochem. 269: ((2002) ), 148–156. |
97 | [[97]] G. Thiagarajan, E. Widjaja, J.H. Heo, J.K. Cheung, B. Wabuyele, X. Mou and M. Shameem, Use of Raman and Raman optical activity for the structural characterization of a therapeutic monoclonal antibody formulation subjected to heat stress, J. Raman Spectrosc. ((2015) ). doi:10.1002/jrs.4679. |
98 | [[98]] G.J. Thomas Jr., Raman spectroscopy of protein and nucleic acid assemblies, Ann. Rev. Biophys. Biomol. Struct. 28: ((1999) ), 1–27. |
99 | [[99]] P. Tompa, Structure and Function of Intrinsically Disordered Proteins, CRC Press, Boca Raton, (2010) . |
100 | [[100]] H. Xie, S. Vucetic, L.M. Iakoucheva, C.J. Oldfield, A.K. Dunker, V.N. Uversky and Z. Obradovich, Functions of intrinsic disorder, J. Proteome Res. 6: ((2007) ), 1882–1898. |
101 | [[101]] B. Xue, R.W. Williams, C.J. Oldfield, G.K.-M. Goh, A.K. Dunker and V.N. Uversky, Do viral proteins possess unique features? in: Flexible Viruses: Structure and Disorder in Viral Proteins, V.N. Uversky and S. Longhi, eds, Wiley, Hoboken, NJ, (2012) , pp. 1–34. |
102 | [[102]] S. Yamamoto, T. Furukawa, P. Bouř and Y. Ozaki, Solvated states of poly-L-alanine α-helix explored by Raman optical activity, J. Phys. Chem. A 118: ((2014) ), 3655–3662. |
103 | [[103]] S. Yamamoto, J. Kaminský and P. Bouř, Structure and vibrational motion of insulin from Raman optical activity spectra, Anal. Chem. 84: ((2012) ), 2440–2451. |
104 | [[104]] F. Zhu, P. Davies, A.R. Thompsett, S.M. Kelly, G.E. Tranter, L. Hecht, N.W. Isaacs, D.R. Brown and L.D. Barron, Raman optical activity and circular dichroism reveal dramatic differences in the influence of divalent copper and manganese ions on prion protein folding, Biochemistry 47: ((2008) ), 2510–2517. |
105 | [[105]] F. Zhu, N.W. Isaacs, L. Hecht and L.D. Barron, Raman optical activity: A tool for protein structure analysis, Structure 13: ((2005) ), 1409–1419. |
106 | [[106]] F. Zhu, N.W. Isaacs, L. Hecht, G.E. Tranter and L.D. Barron, Raman optical activity of proteins, carbohydrates and glycoproteins, Chirality 18: ((2006) ), 103–115. |
107 | [[107]] F. Zhu, J. Kapitàn, G.E. Tranter, P.D.A. Pudney, N.W. Isaacs, L. Hecht and L.D. Barron, Residual structure in disordered peptides and unfolded proteins from multivariate analysis and ab initio simulation of Raman optical activity data, Proteins 70: ((2008) ), 823–833. |
108 | [[108]] F. Zhu, G.E. Tranter, N.W. Isaacs, L. Hecht and L.D. Barron, Delineation of protein structure classes from multivariate analysis of protein Raman optical activity data, J. Mol. Biol. 363: ((2006) ), 19–26. |
109 | [[109]] G. Zuber and W. Hug, Rarefied basis sets for the calculation of optical tensors. 1. The importance of gradients on hydrogen atoms for the Raman scattering tensor, J. Phys. Chem. A 108: ((2004) ), 2108–2118. |


