
Using a fuzzy comprehensive evaluation method to determine product usability: A proposed theoretical framework
Abstract
BACKGROUND: In order to compare existing usability data to ideal goals or to that for other products, usability practitioners have tried to develop a framework for deriving an integrated metric. However, most current usability methods with this aim rely heavily on human judgment about the various attributes of a product, but often fail to take into account of the inherent uncertainties in these judgments in the evaluation process.
OBJECTIVE: This paper presents a universal method of usability evaluation by combining the analytic hierarchical process (AHP) and the fuzzy evaluation method. By integrating multiple sources of uncertain information during product usability evaluation, the method proposed here aims to derive an index that is structured hierarchically in terms of the three usability components of effectiveness, efficiency, and user satisfaction of a product.
METHODS: With consideration of the theoretical basis of fuzzy evaluation, a two-layer comprehensive evaluation index was first constructed. After the membership functions were determined by an expert panel, the evaluation appraisals were computed by using the fuzzy comprehensive evaluation technique model to characterize fuzzy human judgments. Then with the use of AHP, the weights of usability components were elicited from these experts.
RESULTS AND CONCLUSIONS: Compared to traditional usability evaluation methods, the major strength of the fuzzy method is that it captures the fuzziness and uncertainties in human judgments and provides an integrated framework that combines the vague judgments from multiple stages of a product evaluation process.
1Introduction
Usability has become an increasingly important factor that influences how consumers and designers choose among different systems or products [1–3]. Usability evaluation is a specialized process that has been shown to require expertise from a wide range of knowledge domains [4]. However, according to Hornbæk’s paper on current practice in measuring usability [5], a major weakness of current methods is that there is no principal technique that addresses the vagueness and uncertainties inherent in the various components that contribute to the concept of usability. Indeed, most usability methods rely heavily on human judgment about the various attributes of a product, but often fail to take account of the inherent uncertainties in these judgments in the evaluation process. The main goal of this study was to demonstrate how these uncertainties can be elicited, captured and combined by using a fuzzy method integrated with an analytic hierarchy process (AHP) method.Section 2 provides a brief review of existing usability evaluation techniques such as those conducted using general mathematical methods, questionnaires, the AHP method, and fuzzy approach. In Section 3, the general methodological steps of how to use fuzzy evaluation and AHP method will be described. Section 4, will consider the theoretical framework of the proposed fuzzy usability evaluation technique based on the AHP method. A discussion is provided inSection 5.
2A brief review of existing usability evaluation techniques
As a core term in human factors and ergonomics, usability has been defined by researchers in different ways [4, 6–10]. By focusing on product perception and acceptance, Shackel proposed an operational definition of usability which provided a set of usability criteria, including effectiveness (level of interaction in terms of speed and errors), learnability (level of learning needed to accomplish a task), flexibility (level of adaptation to various tasks) and attitude (level of user satisfaction with a system) [6]. This definition has been generally accepted by the usability community [11]. Another well-accepted definition of usability was offered by Nielsen [4], which described usability as ‘the measure of the quality of the user experience when interacting with something whether a Web site, a traditional software application, or any other device the user can operate in some way or another’ [7]. Nielsen suggested several operational usability dimensions such as learnability, memorability, efficiency, user satisfaction (subjective assessment of how pleasurable it is to use) and error (number of errors, ability to recover from errors, existence of serious errors) [4]. To consolidate the definitions, the International Organization for Standardization (ISO) defined usability as ‘the extent to which a product can be used by specified users to achieve specified goals with effectiveness, efficiency and satisfaction in a specified context of use [8]. However, these various definitions of usability contain concepts that are far from concrete, and they are often highly context dependent in the sense that no single set of measurements can be applied to all products or services. Indeed, many practitioners lament that usability can mean different things to different people, even when it is defined, and it still remains intuitive, uncertain, and ambiguous [5, 6, 12]. Therefore, in the usability community, in order to compare existing usability data to ideal goals or that of other products, practitioners have tried to develop a framework for deriving a single or integrated metric from the various aforementioned metrics with the use of different evaluation techniques [13, 14].
2.1The general weighted additive method
The definition of usability is highly dependent on the measurement method. One of the most direct measurements is the method of user performance which is used widely for evaluating product usability. Practitioners can easily measure the task success rate of users in actually using a product and derive an average accuracy or error rate that reflects product effectiveness [9]. However, different products may require different sets of metrics to measure their effectiveness and it is always difficult to make comparisons between evaluations for different products. A number of attempts have been made to derive a single usability score that combines the different metrics in order to facilitate comparisons. Babiker et al. suggested assigning different weights to a set of metrics such as ease of access, navigation, orientation, and user interaction for evaluating usability of hypertext systems, and then integrating these metrics into a simple weighted additive score [15]. Although they found that the combined metric correlated well to subjective assessment measures, whether the method could be easily generalized or transferred to other systems is questionable, because the weights were based on the specific assessment criteria of a product use. Other methods based on this kind of weighted additive model have been used by various researchers [5, 13, 16]. However, a common problem with this method is that the measurements depend critically on specific products and on the practitioner’s subjective judgment. Also, there is always the problem that it may be too simplistic to assume that a single weight can be assigned to each of the evaluated attributes.
2.2The questionnaire method
In contrast to objective performance measurements, usability evaluation can be made with subjective evaluations [17–19]. In the ergonomics community, several well-known subjective usability questionnaires have been developed based on user personal interactive product experience. These methods include the Post-Study System Usability Questionnaire (PSSUQ) [17, 18], the Software Usability Measurement Inventory (SUMI) [20, 21], and the Questionnaire for User Interaction Satisfaction (QUIS) [22, 23]. The primary advantage of using questionnaires over other usability evaluation methods is that they can be readily applied and have a high benefit to cost ratio. All three questionnaire methods are claimed to have high reliability and validity for usability testing in practice. However, as found in the weighted additive method, these questionnaires suffer from the same problem that it is not clear how multiple metrics (either subjective or objective) derived from the responses can be weighted and combined to provide an overall product usability index.
2.3The analytic hierarchy process (AHP) method
The AHP method was developed by Saaty [24] and has been generally accepted as a robust and flexible multi-criteria decision-making tool for dealing with complex decision problems in various research domains [25–27]. In usability engineering, the AHP method has been used to determine the weights of different components during the evaluation process as well as to conduct synthetic comparative evaluation for multiple products or prototypes [28, 29]. With a structurally hierarchical model, this method requires experts to provide only the rank orders of different metrics of usability, such as the learnability and ease of use, and the corresponding weights for these metrics can then be derived. The AHP is a technique that focuses directly on deriving the appropriate weights based on expert judgments. It is well suited to comparing the relative usability of different alternatives, and thus is a powerful multi-criteria decision-making tool for usability testing purpose. In later sections it will be shown how this method can be coupled with a fuzzy approach to enhance its ability to capture the uncertainties and vagueness of usability perceptions expressed by the experts.
2.4The fuzzy evaluation method
In the discipline of ergonomics there is a good understanding of the role of fuzzy set theory in showing a quantifiable degree of uncertainty in human judgment [26, 30, 31]. The fuzzy evaluation method is based on fuzzy set theory developed by Zadeh [32] for capturing the uncertainties inherent in a system. As discussed above, the processes in usability evaluation inherently involve fuzzy, uncertain, dynamic, and changing information. In the usability engineering field, some early attempts at using the fuzzy evaluation method were made. Cai et al. applied the method to capture the perceived shape and color aesthetics of different products [31]. To compare design alternatives, the imprecise preference structures of the alternatives were modeled by a set of fuzzy preference relations. These relations not only specified whether one attribute was preferred over another attribute, but also how confidently this particular preference order was expressed by the user. For Web page design, Hsiao et al. proposed a Gestalt-like perceptual measure method by combining Gestalt grouping principles and fuzzy entropy [26]. They developed a set of fuzzy relations that captured the layout of graphics, arrangement of texts, and combinations of colors. Both studies showed that the fuzzy evaluation approach can provide a powerful mathematical tool to quantify imprecise information in human judgments.
3The methodological framework
Based on these previous efforts in structuring user experience or usability evaluations, in this paper, a universal method of usability evaluation for products will be proposed. This universal method will involve combining the AHP and fuzzy evaluation methods for synthesizing performance data and subjective response data. The aim for this universal method is to derive an index that is structured hierarchically within the framework of ISO 9241 part 11 [8], which define usability in terms of three major components, viz. effectiveness, efficiency, and user satisfaction. An additional goal is to demonstrate the generality of the fuzzy usability evaluation method by showing that any set of standard usability attributes can be adopted and the same process can be applied to obtain a comprehensive evaluation. The general methodological framework will be described in the next section.
3.1The general fuzzy evaluation model
The general fuzzy evaluation model aims at providing a fuzzy mapping between each of the evaluation factors e.g. effectiveness, efficiency and user satisfaction, to a set of categorical appraisal grades e.g. good, excellent. The idea is to define fuzzy sets for the evaluation factors, such that for a particular a usability rating e.g. a 5 on a 7-point scale, could belong to the both the grades ‘good’ and ‘excellent’. However, the extent to which the usability rating belongs to each grade may vary i.e. different degrees of membership to each grade, depending on the weights given to each evaluation factor and the average ratings given by different raters. In the above example, one may find that a rating of 5 for effectiveness can be mapped to the fuzzy sets ‘fair’, ‘good’, and ‘excellent’ with degrees of membership of 0.2, 0.7, and 0.5 respectively. By assigning membership degree to multiple ‘fuzzy grades’, more of the uncertainties inherent in the rating process can be captured and retained, which will be particularly useful for comparing two products. The formal procedures of the general fuzzy evaluation model can be described by the following steps.
Step 1: Determining the set of evaluation factors
Evaluation factors can be defined according to the objectives of the product evaluation process.A set of n evaluation factors can be represented as a vector U ={ u1, u2, . . . . , un }. For example, one can define U ={ effectiveness, efficiency, user satisfaction} such that different measurements will be conducted to evaluate the product based on these three factors.
Step 2: Determining the set of appraisal grades
The appraisal set can be represented as a vector V ={ v1, v2, . . . . , vm }, in which m represents the number of levels in the appraisal. For example, if m = 5, the appraisal vector can be represented as V ={ very poor, poor, medium, good, excellent }.
Step 3: Setting the fuzzy mapping matrix
The goal of the evaluation process is to provide a mapping from U to V. For a specific factor ui the fuzzy mapping to the appraisal vector V can be represented by the vector Ri ={ ri1, ri2, . . . , rik, . . . , rim }, in which m represents the number of levels in the appraisal (see step 2), and rik represents the fuzzy membership degree of appraisal factor i to grade k.Using the example from step 1 and 2, if R1 ={ 0, 0, 0.3, 0.7, 0 }, then the measurement on the evaluation factor “effectiveness” i.e., u1, on this product has a fuzzy membership of 0.3 in the grade “medium”, and a fuzzy membership of 0.7 in the grade “good”, respectively.
In general, the fuzzy appraisal matrix of all n factors can be derived and represented as a matrix R, such that if there are n factors and m levels of appraisal grades:
(1)
In the above matrix notation for R, each row represents the set of appraisal membership degrees to the corresponding appraisal vector V for each evaluation factor ui in the evaluation vector U.
Step 4: Determining the weight of each evaluation factor
To obtain a comprehensive usability evaluation, the relative importance of each evaluation factor on the overall grading of the product should be quantified. The weight vector can be represented by W, which can be formulated by the AHP method, as described in the next subsection. As above, for n evaluation factors, the weight can be represented by the vector W = (W1, W2, . . . , Wn), in which the sum of all elements equal 1. From the example discussed earlier, if it is determined that W = (0.3, 0.3, 0.4), then the relative weights for effectiveness, efficiency, and user satisfaction will be 0.3, 0.3, and 0.4 respectively.
Step 5: Getting the overall appraisal result
The overall appraisal result can be obtained by taking into the account the relative weights of each evaluation factor, such that a single vector with the same level of appraisal grades m (see step 2) can be represented by:
(2)
Where ‘∘’ is a composition operator,bj could be operated by a number of possible models [33, 34]. The different composition operations will affect how the final appraisal vector B will be changed by different distributions of the weights i.e., in vector W. The choice of composition operators is clearly beyond the scope of this paper (for a comprehensive set of operators and when they should be used see, for example [33, 34]). For the current purpose, we assume that all evaluation factors should be considered, such that no single factor is significantly selected or ignored more than others. We therefore choose to use the composition operator that calculates each element bj of the final appraisal vector by the following formula, which is suitable for evaluations in which all weights of factors must be accommodated:
(3)
3.2Determining the weight vector by AHP
The weight vector W (see step 4 in subsection 3.1) can be determined by consulting expert opinions, by conducting empirical and/or field studies, or by adopting an existing theoretical framework [26, 27].One advantage of the AHP method is that it provides both an elicitation method as well as a strong theoretical framework that allows precise quantitative calculations. The procedures of the AHP method can be illustrated step by step as follows [24, 26, 35].
Step 1 : Structure a hierarchy of the criteria based on the evaluated factors
First, state an overall objective for the problem and list factors that affect the objective. Then structure a hierarchy of criteria for the problem: for each cluster or level in the hierarchy, some factors will be subjected to a corresponding evaluated objective. According to previous suggestions [24], it is desirable to have no more than seven elements in each cluster in each level of the hierarchy.
Step 2 : Construct a pair -wise comparison matrix (n×n)
The major advantage of the AHP method is that, instead of asking experts to directly give a weight for a particular evaluation factor, they will be asked to rate the relative importance of the different factors. Assuming that there are n evaluation factors, the importance intensity of factor i over factor j can be represented by aij. A pair-wise comparison matrix A can therefore be obtained as follows:
(4)
Each aij of the matrix represents the importance intensity of factor i over factor j. The aij value is supposed to be an approximation of the relative importance of i to j. In other words, if Wi and Wj represent the weights assigned to factor i and j respectively, then aij = (Wi/Wj). This can be generalized such that each aij (i, j = 1, 2, . . . , n) is specified as follows:
(1) aij = Wi/Wj > 1, when ai is more important than aj
(2) aij = 1, when i = j
(3) aij = 1 / aij, and aij ≠ 0.
These imply that matrix A should be a positive and a reciprocal matrix, in which each element of the lower-left triangle is the inverse of the corresponding element of upper-right triangle. So one only needs to provide the value judgments in the upper-triangle of the matrix. Saaty proposed a linear scale for assigning comparison values to aij [24], and this has been widely used. Table 1 presents Saaty’s scale of preferences in the pair-wise comparison process. Usually, the numbers of judgments needed in upper-right triangle of the matrix are n(n–1)/2, where n is the size of the matrix.
Step 3 : Calculate the priority vectors of evaluated factors
To calculate the weight vectors of evaluated factors, we used the common method of ANC (average of normalized columns). ANC can be presented as:
(5)
The weight vector can therefore be obtained from matrix A by normalizing the vector in each column (i.e., dividing the elements of each column by the sum of that column) and then averaging over the rows of the resulting matrix.
Step 4 : Check the consistency of the humanjudgments
From Step 3, the numerical weights (W1, W2, . . . . , Wn) of the factors from the numerical judgments matrix A can be obtained. It is important to check that the human judgments are internally consistent. One method is to calculate the consistency ratio (CR), which is a measure of how a given matrix compares to a purely random matrix in terms of their consistency indices. CR can be calculated by:
(6)
where RI is the average random index, which is computed and tabulated as shown in Table 2 [24]. CI is the consistency index, which can be calculated as:
(7)
(8)
If a value of the consistency ratio CR is less than 0.1, the numerical judgments will be considered to be acceptable [24].
4The proposed AHP based fuzzy usability evaluation technique
4.1Two-layer comprehensive evaluation indices
In the usability community, there are many ways to determine an evaluation index. For example, the International Organization for Standardization combined and consolidated several definitions of usability in ISO 9241 [8]. Here, it was decided to adopt the ISO usability framework as the basis for usability evaluation as it contains the set of attributes most commonly used by some practitioners [14, 19]. In it, usability is measured by effectiveness, efficiency and user satisfaction. Specifically, measures of effectiveness relate the goals of the user to the accuracy and completeness with which these goals can be achieved, measures of efficiency relate to the level of effectiveness achieved with regard to the expenditure of resources i.e., task time, and user satisfaction can be measured as the extent to which users are free from discomfort, and as well their attitudes towards the use of the product.
In order to structure a universal usability evaluation index for different systems, the common performance measures of task success and task completion time were selected for measuring effectiveness and efficiency respectively in this study. Task success refers to the measures of the extent to which tasks are solved successfully. For example, it may be a combination of accuracy, errors and completeness, and is defined as observer’s assessment with numerical score ranging from 0 to 1. Task time refers to how long users take to complete assigned tasks with a product. In summative usability testing, user satisfaction questionnaires are often applied as a part of debriefing section after a user test [4]. According to the study of Ryu (2005) [29], the items of Post-Study System Usability Questionnaire (PSSUQ) ([17, 18]) have the highest redundancy percentage (100%) with other sets of questionnaire items. It was developed exclusively for measurement of satisfaction for user testing and so was chosen here for measuring user satisfaction after a test using this universal usability evaluation model. The PSSUQ has a 3-factor structure of System Usefulness, Information Quality, and Interface Quality. Summarizing the considerations here, a hierarchy of evaluated indexes can be structured as shown in Fig. 1. In this hierarchy, the evaluated elements and objectives are presented as a two-layer hierarchy structure of evaluated indexes, and have no more than seven elements in each cluster in each level of the hierarchy [24]. ‘Usability’ in the hierarchy is the overall objective evaluated, and this was considered as the top-layer which was broken down into the second layer consisting of the three factors of effectiveness, efficiency, and usersatisfaction.
4.2Determining the fuzzy member function of evaluation matrix R
When determining the mapping quality for factors, the corresponding measure or logistic value of each factor will be ranked as a grade. Five levels of appraisal grades are presented as V = { very poor, poor, medium, good, excellent} in the present model. Then, generally, an expert panel will be asked to determine the threshold value i.e., v1, v2, v3, v4, v5, and v6, for each grading. By comparing threshold values and specific measured value v, the quality of corresponding factor will be obtained. According to ISO/IEC (1998–2001) [36], a direct membership mapping method should be used for ranking measure value. However, the major disadvantage of this method is that, by converting a continuous value to a single categorical value, important information may be lost. For example, when v is close to the threshold of v3, it is hard to decide whether one should rate v as ‘medium’, or ‘poor’.
In order to address this issue, several geometric mapping functions have been proposed, such as some variations of the triangular or trapezoidal mapping functions. In line with previous studies [37, 38], the semi-trapezoid and trapezoidal distribution are used to construct mapping functions to characterize fuzzy measure values. In this way, the ambiguities and vagueness involved in the process of usability estimations can be retained. If δ is used to represent the subsets of appraisal set V, the fuzzy membership functions could be defined separately as below:
(9)
(10)
(11)
(12)
(13)
In the above equations, c1, c2, c3, c4, and c5 represent the middle values of the intervals (v1, v2), (v2, v3), (v3, v4), (v4, v5), and (v5, v6) respectively. According to Zhou (2004) [38], in the implementation process, the threshold parameters (i.e., the value of v1, v2, v3, v4, v5, and v6) in these membership functions can be determined by an expert panel. In this study, the intervals for task success and satisfaction score can be easily well defined, however the interval for task time is more variable and needs some transformation. To deal with this issue, absolute values of task time are converted using the following formula:
(14)
Where E represents the expectable shortest task time, which will be estimated by the product development team and v is the absolute task time. Therefore v will be a value in the intervals (–∞, 0), [0, 1], or (1, 2). That is to say, v signifies very poor singly and completely for v <0, and signifies excellent singly and completely for 1 < v<2.
After preparatory work, a six-expert panel was used here to determine the thresholds. All experts had more than one year of professional experience in the field of usability engineering, and were introduced to some basic knowledge about how to use the threshold values in the present evaluation model. The threshold values were found to be (0, 0.3, 0.6, 0.8, 0.95, 1) for both task success and task time (for values in intervals [0, 1]), and those for satisfaction were (1, 2, 3.5, 5.5, 6.5, 7). The fuzzy membership functions could then be obtained for task success, task time, and user satisfaction respectively.
For example, if one success measure for a specific task was scored as 0.47, then in line with Equations (9) to (13), the subsets in V could be obtained as:
Therefore, according to Equation (1), the quality of the task success measure can be presented:
(15)
Normalizing,
(16)
In this way, the membership degree of factor i to ranking j can be calculated and hence the fuzzy appraisal matrix R for objectives and sub-objectives to be evaluated in the hierarchy can be obtained.
4.3Quantifying weighting vectors of the two-layer evaluation model
Because only one measure was employed for effectiveness and efficiency separately, we need only determine the weight vectors for user satisfaction and overall usability respectively, as shown in Fig. 1. The same six-expert panel used the above pair-wise comparisons. Firstly, they discussed the situation and arrived at agreed pair-wise comparisons with respect to user satisfaction and overall usability separately; then the weights according to Section 3.2 were calculated. The panel would be required to repeat the first process if the CR > 0.1 [24]. Table 3 presents the matrix of pair-wise comparisons with respect to user satisfaction.
In accordance with Equation (5), first the vector in each column for the matrix of numerical judgments in Table 3 was normalized. The procedure is presented as A’:
(17)
Then after averaging over the rows shown in A’, i.e. adding the elements in each row and dividing this sum by the size of the matrix n, the process of generating the priorities weight can be presented as:
(18)
(19)
(20)
The resulting weight vectors, given to the three factors used to evaluate u ser satisfaction, can then be used to generate eigenvector W = (0.312, 0.198, 0.490).
In order to test whether the resulting eigenvector suggests a consistent numerical judgments matrix in Table 3, the value of CR was computed in accordance with Section 3.2 as follows:
First, the maximum eigenvalue λmax of the matrix in Table 3 was calculated as shown:
(21)
It follows that
(22)
(23)
(24)
Since CR≤0.1, then the numerical judgments in Table 3 are consistent statistically, so the weights of System Usefulness, Information Quality, and Interface Quality were confirmed as 0.312, 0.198, and 0.490 respectively.
In this way, Table 4 presents the pair-wise comparison with respect to overall usability, and we can obtain the weights of effective ness, efficiency and user satisfaction. The CR for the matrix was computed and is shown in Table 4.
5Discussion
Based on fuzzy evaluation theory, a model for evaluating usability of a product or system was proposed in this study. We believed that the fuzzy comprehensive evaluation technique provided an appropriate and promising path for evaluating the overall usability of a product and the technique is in line with the existing framework used in conducting usability evaluations. This technique will be particularly useful for comparing the advantages and disadvantages of different products or different versions in one product’s life cycle.
Compared to existing usability evaluation methods, this fuzzy evaluation model provides advantages over the conventional methods, and can benefit usability evaluation in two major ways: (1) The fuzzy evaluation method is based on fuzzy set theory, and is an attractive means for modeling the uncertainty or lack of precision that arises from human information processing, and are neither random nor stochastic [37, 43]: i.e. usability can be labeled as intuitive, uncertain, or elusive, especially with respect to user satisfaction. In the evaluated model here, trapezoidal fuzzy number was chosen to determine the fuzzy member function for structuring the fuzzy evaluation matrix, and we found that this function was successful in capturing the uncertainties inherent in the usability evaluation. In addition, the weights obtained with the AHP method can then be combined with the fuzzy evaluation method to provide an overall usability assessment of the product. (2) The current method uses a hierarchical evaluation index that allows iterative measurements on multiple dimensions. Usability can be defined in many dimensions and attributes, and there are many metrics that can be used to measure each of these dimensions or attributes. The choice of the appropriate dimensions and measures often depends on specific business objectives and available resources. Although there is no general rule for how measures should be chosen or combined, in the evaluation framework proposed here it was shown how the three most common and important elements i.e., effectiveness, efficiency, and user satisfaction, can be measured and combined in the hierarchical evaluation process.
Although fuzzy evaluation and AHP are commonly used to determine different aspects of products quality, the fuzzy technique proposed here needs to be tested as to how successfully it can be applied in practical cases. More importantly, the advantage of the fuzzy approach proposed in this study over the traditional evaluation methods like averaging methods should be verified. In a sense, the mathematics process in the fuzzy approach may be challenging for practical use, which is why we should try structuring a common evaluation index within the ISO usability framework, as well as weighting the importance for the different factors evaluated. However, usability or user experience can mean different things for different goals in practice, thus the evaluation index along with mapping functions or parameters may need be set again. As mentioned above, this fuzzy evaluation technique is more suitable to integrate both quantitative data and qualitative data for conducting overall usability evaluations. Combining all these considerations, we would suggest applying this evaluation procedure to summative evaluations like benchmarking or comparing product usability. The evaluation index and its metrics tend to be stable in specific usability practice, and thus we can use some software to run all procedures within the fuzzy technical framework. In another study, we will use a summative usability test case to test the application and strength of the general fuzzy usability framework, as well as to illustrate the effectiveness of the proposed evaluation technique [44].
Conflict of interest
The authors have no conflict of interest to report.
Acknowledgments
This research was supported by the National Natural Science Foundation of China (NSFC, 31271100 and 71420107025). The funders had no role in study design, data collection and analysis, decision to publish, or preparation of the manuscript.
Thanks to anonymous reviewers for their very helpful comments and suggestions regarding earlier version of this paper.
References
[1] | Freire LL , Arezes PM , Campos JC . A literature review about usability evaluation methods for e-learning platforms. Work: A Journal of Prevention, Assessment & Rehabilitation (2012) ;41: (Suppl 1):1038–44. |
[2] | Kernot J , Olds T , Lewis LK , Maher C . Usability Testing and Piloting of the Mums Step It Up Program-A Team-Based Social Networking Physical ActivityIntervention for Women with Young Children. PloS One (2014) ;9: (10):e108842. |
[3] | Friesen EL , Theodoros D , Russell TG . Usability-for-one. Work: A Journal of Prevention, Assessment & Rehabilitation (2015) ;52: (1):211–3. |
[4] | Nielsen J . Usability engineering. 1st ed. Morgan Kaufmann: San Francisco; (1993) . |
[5] | Hornbæk K . Current practice in measuring usability: Challenges to usability studies and research. International Journal of Human-Computer Studies (2006) ;64: (2):79–102. |
[6] | Shackel B . Usability–Context, framework, definition, design and evaluation. Interacting with Computers (2009) ;21: (5-6):339–46. |
[7] | Nielsen J . Usability testing. In: Salvendy G , editor.Handbook of Human Factors and Ergonomics. Wiley: New York; (1997) ;1543–68. |
[8] | ISO W. 9241-11. Ergonomic requirements for office work with visual display terminals (VDTs). The International Organization for Standardization (1998) ;45. |
[9] | Barnum CM . Usability Testing and Research. Longman Publications: New York; (2002) . |
[10] | Rubin J , Chisnell D . Handbook of usability testing: How to plan, design and conduct effective tests. John Wiley & Sons; (2008) . |
[11] | Lin HX , Choong YY , Salvendy G . A proposed index of usability: A method for comparing the relative usability of different software systems. Behaviour & Information Technology (1997) ;16: (4-5):267–77. |
[12] | Chan AH , So JC . Task factor usability ratings for different age groups writing Chinese. Ergonomics (2009) ;52: (11):1372–85. |
[13] | Tullis T , Albert B . Measuring the User Experience: Collecting, Analyzing, and Presenting Usability Metrics 2nd ed. Morgan Kaufmann Publisher Inc: San Fransisco; (2013) . |
[14] | Heo J , Ham DH , Park S , Song C , Yoon WC . A framework for evaluating the usability of mobile phones based on multi-level, hierarchical model of usability factors. Interacting with Computers (2009) ;21: (4):263–75. |
[15] | Babiker EM , Fujihara H , Boyle CD . A metric for hypertext usability. In: Proceedings of the 9th annual international conference on Systems documentation. ACM Press: New York; (1991) ;95–104. |
[16] | Sauro J , Kindlund E . A method to standardize usability metrics into a single score. In: Proceedings of the SIGCHI conference on Human factors in computing systems. ACM Press: New York; (2005) ;401–9. |
[17] | Lewis JR . IBM computer usability satisfaction questionnaires: Psychometric evaluation and instructions for use. International Journal of Human-Computer Interaction (1995) ;7: (1):57–78. |
[18] | Lewis JR . Psychometric evaluation of the PSSUQ using data from five years of usability studies. International Journal of Human-Computer Interaction (2002) ;14: (3-4):463–88. |
[19] | Ryu YS . Mobile phone usability questionnaire (mpuq) and automated usability evaluation. InHuman-Computer Interaction. New Trends 2009 Jul 19 (pp. 349-351). Springer Berlin Heidelberg. |
[20] | Kirakowski J , Corbett M . SUMI: The software usability measurement inventory. British Journal of Educational Technology (1993) ;24: (3):210–2. |
[21] | Kirakowski J . The software usability measurement inventory: Background and usage. In: Usability Evaluation in Industry (1996) ;169–78. |
[22] | Chin JP , Diehl VA , Norman KL . Development of an instrument measuring user satisfaction of the human-computer interface. In: Proceedings of the SIGCHI conference on Human factors in computing systems (1988) (pp. 213-218). ACM. |
[23] | Harper BD , Norman KL . Improving user satisfaction: The questionnaire for user interaction satisfaction version 5.5. In: Proceedings of the 1st Annual Mid-Atlantic Human Factors Conference (1993) (pp. 224-228). |
[24] | Saaty TL . The analytic hierarchy process. McGraw Hill: New York. (1980) . |
[25] | Chan AH , Kwok WY , Duffy VG . Using AHP for determining priority in a safety management system. Industrial Management & Data Systems (2004) ;104: (5):430–45. |
[26] | Hsiao SW , Chou JR . A Gestalt-like perceptual measure for home page design using a fuzzy entropy approach. International Journal of Human-Computer Studies (2006) ;64: (2):137–56. |
[27] | Liang Z , Yang K , Sun Y , Yuan J , Zhang H , Zhang Z . Decision support for choice optimal power generation projects: Fuzzy comprehensive evaluation model based on the electricity market. Energy Policy (2006) ;34: (17):3359–64. |
[28] | Mitta DA . An application of the analytic hierarchy process: A rank-ordering of computer interfaces. Human Factors: The Journal of the Human Factors and Ergonomics Society (1993) ;35: (1):141–57. |
[29] | Ryu YS . Development of usability questionnaires for electronic mobile products and decision making methods. Dissertation Source: Dissertation Abstracts International (2005) ;66-05: (B):2763. |
[30] | Karwowski W . Complexity, fuzziness, and ergonomic incompatibility issues in the control of dynamic work environments. Ergonomics (1991) ;34: (6):671–86. |
[31] | Cai H , He W , Zhang D . A semantic style driving method for products’ appearance design. Journal of Materials Processing Technology (2003) ;139: (1):233–6. |
[32] | Zadeh LA . Fuzzy sets. Information and Control (1965) ;8: (3):338–53. |
[33] | Zimmermann HJ . Fuzzy set theory—and its applications. Springer Science & Business Media; (2011) . |
[34] | Lan H , Ding Y , Hong J . Decision support system for rapid prototyping process selection through integration of fuzzy synthetic evaluation and an expert system. International Journal of Production Research (2005) ;43: (1):169–94. |
[35] | Kablan MM . Decision support for energy conservation promotion: An analytic hierarchy process approach. Energy Policy (2004) ;32: (10):1151–8. |
[36] | ISO/IEC. 14598 Part 1 – Part 6: Information Technology – Evaluation of Software Products. International Organization for Standardization. 1998-2001. |
[37] | Liu S , Triantis KP , Sarangi S . Representing qualitative variables and their interactions with fuzzy logic in system dynamics modeling. Systems Research and BehavioralScience (2010) ;28: :245–63. |
[38] | Zhou JH , Wang Z , Yang ZK , Liu X . Research on software quality evaluation based on fuzzy method. Systems Engineering and Electronics (2004) ;26: (7):988–91. |
[39] | Vredenburg K , Isensee S , Righi C . User-Centered Design: An Integrated Approach. Prentice Hall: New Jersey. (2001) . |
[40] | Robins B , Ferrari E , Dautenhahn K , Kronreif G , Prazak-Aram B , Gelderblom GJ , Tanja B , Caprino F , Laudanna E , Marti P . Human-centred design methods: Developing scenarios for robot assisted play informed by user panels and field trials. International Journal of Human-Computer Studies (2010) ;68: (12):873–98. |
[41] | Ying-Feng K , Ling-Show C . Using the fuzzy synthetic decision approach to assess the performance of university teachers in Taiwan. International Journal of Management (2002) ;19: (4):593. |
[42] | Lewis JR . Evaluation of procedures for adjusting problem-discovery rates estimated from small samples. International Journal of Human-Computer Interaction (2001) ;13: (4):445–79. |
[43] | Rong C , Takahashi K , Wang J . Enterprise waste evaluation using the analytic hierarchy process and fuzzy set theory. Production Planning & Control (2003) ;14: (1):90–103. |
[44] | Zhou RG , Chan AHS . Using a fuzzy comprehensive evaluation method to determine product usability: Application to a test case. Work: A Journal of Prevention, Assessment & Rehabilitation (2017) ;56: (1):21–29. |
Figures and Tables
Fig.1
A hierarchy structure of the evaluated indexes for usability measure (SysUse = System Usefulness, InfoQual = Information Quality, IntQual = Interface Quality).
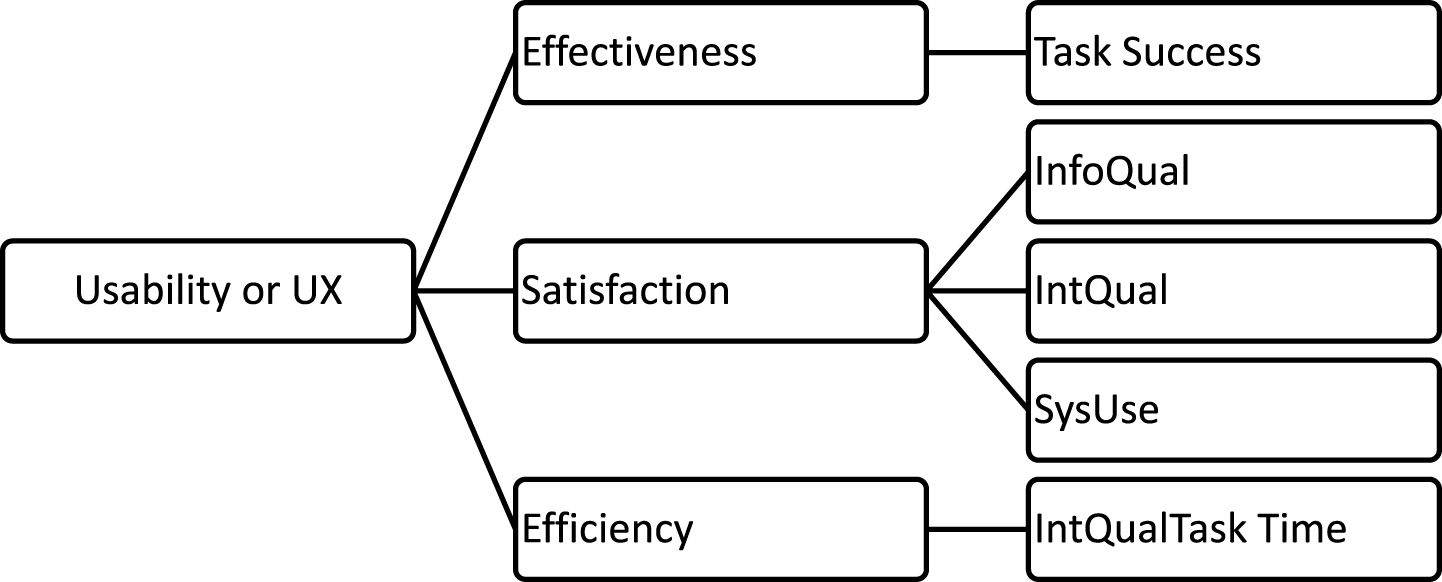
Table 1
Saaty’s lineal scale of preferences in the pair-wise comparison process [24]
| Numerical | Judgments of preferences between factor i and j |
| rating | |
| 1 | factor i is equally important to factor j |
| 3 | factor i is slightly more important than factor j |
| 5 | factor i is clearly more important than j |
| 7 | factor i is strongly more important than factor j |
| 9 | factor i is extremely more important than factor j |
| 2, 4, 6, 8 | Intermediate values |
Table 2
Average random index values according to matrix size [24]
| n | 1 | 2 | 3 | 4 | 5 | 6 | 7 | 8 | 9 | 10 | 11 |
| RI | 0.00 | 0.00 | 0.58 | 0.90 | 1.12 | 1.24 | 1.32 | 1.41 | 1.45 | 1.49 | 1.52 |
Table 3
Pair-wise comparison with respect to user satisfaction
| InfoQual | IntQual | SysUse | Weight | |
| InfoQual | 1 | 2 | 1/2 | 0.312 |
| IntQual | 1/2 | 1 | 1/2 | 0.198 |
| SysUse | 2 | 2 | 1 | 0.490 |
λmax = 3.054, CI = 0.027, CR = 0.046. InfoQual = Information Quality, IntQual = Interface Quality, SysUse = System Usefulness.
Table 4
Pair-wise comparison with respect to overall usability
| Effectiveness | Efficiency | Satisfaction | Weight | |
| Effectiveness | 1 | 3 | 1 | 0.443 |
| Efficiency | 1/3 | 1 | 1/2 | 0.170 |
| Satisfaction | 1 | 2 | 1 | 0.387 |
λmax = 3.018, CI = 0.009, CR = 0.016.

