
Uprising: An examination of sit-stand workstations, mental health and work ability in sedentary office workers, in Western Australia
Abstract
BACKGROUND: Office-based staff spend around three quarters of their work day sitting. People who sit for long periods while at work are at greater risk of adverse health outcomes.
OBJECTIVE: The pilot study aimed to determine the effect of sit-stand workstations on office-based staff sedentary and physical activity behaviors, work ability and self-reported physical and mental health outcomes.
METHODS: A two-group pre-post study design assessed changes in sedentary and physical activity behaviors (time spent sitting, standing and stepping and sit-stand transitions and number of steps taken) work ability and physical and mental health. Physical activity behaviors were measured using activPAL activity monitors and self-reported data on work ability and physical and mental health were collected using an online questionnaire.
RESULTS: Relative to the controls (n=19), the intervention group (n=18) significantly decreased time spent sitting by 100 minutes (p<0.001) and increased standing time by 99 minutes (p<0.001). There was a decrease in self-reported current work ability when compared to lifetime best (p=0.008). There were no significant differences for all other sedentary behavior, other workability outcomes, physical health or mental health outcomes at follow-up.
CONCLUSIONS: The Uprising Study found that sit-stand workstations are an effective strategy to reduce occupational sitting time in office-based workers over a one month period.
1Introduction
The beneficial effects physical activity on health has been well-researched [1]. More recently, researchers have begun to investigate the unique effects that sedentary behaviors, such as sitting, have on health. Occupational sitting is associated with cardiovascular disease, type 2 diabetes, obesity, and poor mental health [2–4]. Office-based staff are at higher risk from the harmful effects of occupational sedentary behavior as they spend around three quarters of their working day sitting [5]. Therefore, reducingthe amount of time spent sitting at work is a public health priority.
One potential strategy to reduce occupational sitting time is using sit-stand workstations. These are height adjustable workstations that allow the user to choose between sitting and standing. They are a feasible way to reduce sedentary behavior in the workplace [5, 6] and align with current recommendations to frequently break up periods of prolonged sitting [7, 8].
Epidemiological evidence has shown an association between prolonged workplace sitting and adverse mental health outcomes [4]. Yet, only two prospective studies investigating this relationship were identified [9, 10]. These studies found that reducing time spent sitting at work resulted in an improvement in mental health outcomes such as mood, tension and calmness [9, 10]. Further studies are required to support these early findings.
There is debate on whether standing enhances or inhibits a person’s ability to undertake their work [11]. A recent systematic review found that activity permissive workstations did not have an effect on work outcomes such as data entry, productivity and presenteeism [12]. However, few studies have assessed the impact of occupational sitting on self-perceived work ability [13].
The aim of the Uprising Study was to determine the effect of sit-stand workstations on office-based staff sedentary behaviors, work ability and self-reported physical and mental health outcomes.
2Methods
2.1Design
The Uprising Study was a two group (control and intervention) pre- and post-pilot study conducted between March and September 2014 with office-based staff located in Perth, Western Australia (Fig. 1). Ethics approval for the Uprising Study was granted by Curtin University’s Human Research Ethics Committee (approval number SPH-37-13).
2.2Intervention
In week one, the intervention and control group undertook their regular work, while wearing an activPAL activity monitor from Monday to Friday during working hours, and completed a logbook of time spent at work (Fig. 1). The research manager provided participants verbal and written instruction on how to use the activity monitor. On the weekend of week one, the intervention group had Ergotron workfit sit-stand workstations fitted to their desk. The workstation enabled the user to choose between sitting and standing postures. Once the workstations were installed, each participant met with a physiotherapist who undertook an ergonomic assessment. The control group did not have workstations fitted and maintained their usual work practices. In week five, the intervention and control group again wore the activPAL activity monitor from Monday to Friday during work hours and completed a log book of time spent at work.
2.3Recruitment and participants
Participants were recruited from four locations across two organizations. The organizations were a non-government organisation and a university. All locations were office-based environments. Participants were recruited via an email sent to all staff working in the study locations.
Participants were required to have: a desk based job, no recent physical injuries or discomfort, aged between 25 to 54 years, and work at least four days a week. The recruitment email explained the study aims and procedures and asked interested staff to contact the research manager. Consent from participants and their managers was obtained. Fifty-two participants were recruited and randomized to either control or intervention group, and underwent baselineassessment (intervention n=26 and control n=26). Ten participants were excluded due to faulty activity monitor data and five participants withdrew (annual leave n=2 and desk uncomfortable n=3). See Fig. 2 for a flow chart of recruitment.
2.4Measures
2.4.1activPAL
Time spent sitting, standing and stepping, number of steps taken and sit-stand transitions were measured using an activPAL activity monitor. A researcher provided instructions to participants on how to use and wear the activPAL. Participants were required to wear the activPAL on the front of the thigh, during working hours in weeks one and five of the study. As the activPAL records continuously, participants were required to fill out a logbook of hours spent at work. The activPAL has been shown to be a reliable and valid measure of sitting, standing and stepping time [14, 15].
The activPAL records data in 15-second intervals, downloaded and managed by ActivPAL3 Research Edition Software Version 7.2.32. Each interval shows time spent sitting, standing and stepping, number of steps taken and sit-stand transitions. ActivPAL data in 15-second intervals was downloaded to Microsoft Excel (2010) where all data outside of self-reported time spent at work was deleted. Data for each day was summed and then totalled for the week and entered into SPSS. To account for variations in time spent at work results were standardized to an eight-hour workday. Data were excluded if there were less than three days recorded in one week.
2.4.2Questionnaire
A link to an online questionnaire (appendix A) comprising validated instruments was emailed to all participants in weeks one and five. The questionnaire included the following.
2.4.2.1 Psychological distress. Mental health outcomes were assessed using the Kessler Psychological Distress Scale-10 (K10) [16]. The K10 questions focus on anxiety and depressive symptoms and it is used to determine the respondent’s level of psychological distress. It has been widely used and shown to be a reliable indicator of psychological distress [17].
The K10 contains ten questions, each with a five level answer scale based on the occurrence of symptoms experienced for each question (1=none of the time and 5=all of the time). Scores vary between a minimum of 10 and a maximum of 50. To interpret the K10 score the method developed by the CRUfAD and GPcare in primary healthcare settings to monitor client psychological distress was used [18].
2.4.2.2 General self-perceived physical and mental health. General self-perceived mental and physical health outcomes were assessed using two questions modified from the SF-8 survey. The SF-8 is a valid and reliable measure of generic health status [19]. Participants rated their physical health and mental health over the previous four weeks. Both questions used a six-point Likert scale (1=very poor and 6=excellent).
2.4.2.3 Work ability. Self-perceived physical and mental health in relation to work was assessed using three questions derived from the Work Ability Index Questionnaire [20], a reliable and valid instrument [21, 22]. Participants were asked to rate their current work ability compared to their lifetime best on a ten- point Likert scale (0=worst and 10=best) and their physical and mental health in relation to work ability on a five-point Likert scale (1=very poor and 5=very good).
2.4.2.4 Perceived benefits of alternating between sitting and standing. Benefits of alternating between sitting and standing postures were assessed at week five. The intervention group was asked “did you get any benefits by alternating between sitting and standing?” They could select one or more options from the following categories, stress; comfort; productivity; focus; happiness; energy; health; and uncertain. These questions were derived from the Take-a-Stand Project [9].
2.4.2.5 Demographics and anthropometric. Demographic questions included gender, age, relationship status, education level, and smoking status. Anthropometric questions included height and weight. This information was used to calculate Body Mass Index (BMI). The cut offs used to create two BMI categories reported in the analyses were: under/healthy weight (BMI<25) and overweight/obese (BMI≥25) [23].
2.5Statistical analysis
Analyses were conducted using SPSS v22 (SPSS Inc., Chicago, Il, USA) with significance set at p<0.05 (two-tailed). Distributions of the continuous variables and categorical variables were assessed. Normally distributed outcomes were reported using mean and standard deviation (SD) and non-normally distributed outcomes were reported using median and interquartile range (IQR). Changes in the outcome variables at baseline and week five were calculated, and compared between intervention and control groups. Analysis was undertaken using independent t-tests for normally distributed data and the Mann-Whitney U for non-normally distributed data.
3Results
3.1Demographics
A final sample of 37 completed the follow-up assessment (intervention n=18 and control n=19) and the participation rate was 37/52 (Fig. 2). Participants were primarily female (n=32), living with someone (n=30), of a healthy weight (n=30) and had completed a post-graduate qualification (n=33). There were no significant differences between the intervention and control group characteristics at baseline (Table 1).
3.2Activpal data
At baseline, both groups combined spent an average of eight hours at work per day. Standardized to an eight hour workday, participants spent an average of 77% of their working day sitting (392 minutes; IQR=79), 18% standing (94 minutes; IQR=74), and 5% stepping (27 minutes; SD=12). The average number of steps taken was 2435 (SD=1026) and number of sit-stand transitions was 26 (SD=10).
There were no significant differences between intervention and control groups for baseline sitting, standing and stepping outcomes. At week five, the intervention group (relative to the control group) had reduced time spent sitting by 99.8 minutes (p<0.001) and increased standing time by 99.4 minutes (p<0.001) (Table 2). At week five, there were no significant differences between groups in time spent stepping, number of steps taken, or number of sit-stand transitions (Table 2).
3.3K10 score, physical health and mental health
For both groups at baseline, the median K10 Score was 15.0 (IQR=4.5), physical health rating 4.7 (SD=0.9), and self-reported mental health rating 4.5 (SD=0.9). There were no significant differences between groups at follow-up for the K10 Score or self-reported physical or mental health ratings (Table 3).
3.4Workability scores
Both groups combined at baseline had a current work ability when compared to lifetime best rating of 9.0 (IQR=1.0), a current work ability in relation to physical demands of work rating of 4.5 (SD=0.6), and a current work ability in relation to mental demands of work rating of 4.0 (SD=0.7). Table 3 shows the changes in work ability outcomes. At five weeks there was a small, but significant decrease in self-reported current work ability when compared to lifetime best (p=0.008). There were no significant differences between groups for other work ability outcomes (Table 3).
3.5Perceived benefits of alternating between sitting and standing
At week five, intervention participants (n=18) reported perceived benefits of alternating between sitting and standing positions. Results show that 61% (n=11) felt more energized, 56% (n=10) felt more comfortable, 40% (n=7) felt happier, 39% (n=7) felt healthier, 33% (n=6) felt more focused, 17% (n=3) felt more productive, 6% (n=1) felt less stressed and 17% (n=3) wereuncertain.
4Discussion
The Uprising study examined the effect of sit-stand workstations on office-based staff sedentary and physical activity behaviors, work ability and self-reported general physical and mental health outcomes over a five-week period. The study sample contained more females (86%) than males (14%); a result of the study locations having a greater proportion of female employees. Participants demographic characteristics and time spent sitting at baseline (392 minutes), were comparable to participants in other office-based studies utilising sit-stand workstations to reduce sedentary behavior [6, 24, 25].
The Uprising study achieved a 100-minute (21% of time spent at work) reduction in sitting time in the intervention group. This reduction may be of clinical relevance, as recent research suggests if a person who sits for more than seven hours a day reduces their time spent sitting by just one hour, they may decrease their risk of all-cause mortality by 5% [26]. The evidence linking occupational sedentary behavior to adverse health impacts is increasing, and workplaces have an obligation to provide staff with a safe working environment [27]. Therefore, they need to consider investing in strategies to reduce the risk of prolonged sitting to protect the health of staff. Activity permissive workstations are one such strategy [27].
The 100-minute reduction in sitting time was similar to other studies undertaken in office-based organizations that resulted in reductions in sitting time of 125 and 143 minutes [5, 6]. When compared to studies that were undertaken at non-health organizations, those that were undertaken at health related organizations had larger reductions in sitting time [10, 24]. This may be because staff at health related organizations have an interest in health and a greater motivation to reduce sedentary behaviors [28]. Therefore, future interventions that aim topromote healthy behaviors in workplaces should utilize strategies to motivate staff to reduce sedentary behavior and promote a culture of health. Furthermore, these interventions need to be undertaken in non-health organizations to determine the effect in the general working population.
This pilot study showed no change in the amount of time participants spent stepping or their number of steps. It is clear from this research, and consistent with similar studies, that a single individual physical environmental modification (sit-stand workstation) is not enough to change stepping behaviors [6, 24, 25]. Previously, three studies have utilized sit-stand workstations as part of a multicomponent intervention to increase the number of steps taken [10, 24, 25]. However, only one resulted in a significant increase in the number of steps taken [10]. This study utilized an incentive scheme for participating in physical activity, which may have influenced the results [10]. As activity permissive workstations gain momentum as a strategy to reduce sedentary behaviors, the importance of other strategies to increase stepping time should not be overlooked. Effects on stepping behaviors are likely to be greater when interventions take a multicomponent approach and include individual (e.g., motivational interviewing), organisational (e.g., incentives to participate in physical activity), cultural norms (e.g., changing from sitting to walking meetings), and environmental (e.g., activity permissive workstations) strategies.
This study did not show an increase in sit-stand transitions. This suggests that while it was effective at reducing total time spent sitting, it was not able to demonstrate an effect on breaking up periods of sitting. A recent meta-analysis recommends long bouts of sitting should be broken up as much as possible; and the amount of time spent in prolonged sitting should be minimized [26]. Experimental evidence suggest that breaking up periods of sitting every 20 to 30 minutes with light activity improves metabolic function [29]. However, there are currently no recommendations on specific timeframes that a person should spend sitting to reduce health risks [26]. Future research should focus on developing specific timeframes for breaking up periods of sitting, in order to promote a clearer public health message.
There were no significant differences in mental or physical health outcomes between groups at follow-up. The participants in this study were all employed, most had completed a university qualification and were married or in a de-facto relationship. The literature suggests that people with these attributes are generally physically and mentally healthier than those who do not [30]. Therefore, the lack of improvement in mental and physical health outcomes in this study may be explained in part by a ceiling effect, as the participants already had high levels of mental and physical health at baseline, and the potential to increase was limited. Alternatively, it may be due, in part, to the short timeframe of the intervention.
Previous studies that reduced workplace sitting have reported improvements in mental health related outcomes including fatigue, tension, calmness, confusion, depression and total mood disturbance [9, 10]. Both these studies used different tools to assess mental health related outcomes, and one was for a longer duration (12 weeks) [10]. Therefore, the difference in effect seen between these studies and the Uprising study may be due to instrument sensitivity or a longer timeframe. The effect of reducing time spent sitting for work on mental health outcomes remains unclear, and further studies to understand the relationship between sedentary behavior at work and mental health outcomes are recommended.
There was a small, but significant increase in the control group on work ability when compared to lifetime best rating. This result should be interpreted carefully, as it likely that factors outside of this study influenced this outcome, such as work demands or life events. The reason for the lack of effect in the intervention group is unclear. However, work ability ratings were already high, again reflecting a potential ceiling effect. In addition, participants reported feeling more focused, productive, and energized, yet this finding was not confirmed through a similar positive effect on work ability ratings.
The strengths of this study were: a randomized design; the use of objective measures to assess changes in activity; and the study findings can be used to inform future studies investigating the relationship between occupational sedentary behavior and mental health outcomes. Limitations of this study included: its short duration; small sample size; unmeasured factors such as work or life stress may have acted as confounders to self-reported work ability and mental and physical health outcomes and; no extended follow-up.
5Conclusion
The Uprising Study found that sit-stand workstations are an effective strategy to reduce occupational sitting time in office-based workers. However, the workstations failed to have an impact on stepping time or number of steps. Future research should consider investigating ways to increase stepping time and number of steps. Multicomponent approaches incorporating individual, cultural, organisational and environmental strategies may be useful in increasing activity levels in the office based work environment. Further studies, over a longer duration that investigate the relationship between occupational sitting and mental health are required. Finally, workplaces need to invest in strategies, such as sit-stand workstations, to protect staff from the adverse health risks of prolonged sitting.
Conflict of interest
The authors have no conflict of interest to report.
Acknowledgments
This study was funded by Healthway (File No: Healthway Promotion Research Agreement 24008). The sit-stand workstations were supplied by Ergotron (www.ergotron.com). The authors would like to thank Ron Lo and Wei-Li Heng from the School of Physiotherapy at Curtin University for providing participants with ergonomic advice and the team from Curtin University Interiors Department for assisting with the installation of the workstations.
Appendices
Appendix A: Questionnaire
Baseline questionnaire administered to both intervention and control groups
This section asks for your views about your physical and mental health over the last four weeks. If you are unsure of how to answer, please give the best answer you can.
Overall, how would you rate your PHYSICAL health during the past 4 weeks?
Excellent
Very good
Good
Fair
Poor
Very poor
Overall, how would you rate your MENTAL health during the past 4 weeks?
Excellent
Very good
Good
Fair
Poor
Very poor
The next three questions will ask about your work ability. Work ability is a term used to describe how you perceive your ability to undertake your work. Your CURRENT work ability compared with your lifetime best. Assume that your work ability at its best has a value of 10 points and that your work ability at its worst has a value of 0 points. How many points would you give your CURRENT work ability? Select the most appropriate number on the scale below.
1
2
3
4
5
6
7
8
9
10
How would you rate your CURRENT work ability in relation to the PHYSICAL demands of your job?
Very poor
Fairly poor
Moderate
Fairly good
Very good
How would you rate your CURRENT work ability in relation to the MENTAL demands of your job?
Very poor
Fairly poor
Moderate
Fairly good
Very good
During the last 30 days, about how often did you feel tired out for no good reason?
None of the time
A little of the time
Some of the time
Most of the time
All of the time
During the last 30 days, about how often did you feel nervous?
None of the time
A little of the time
Some of the time
Most of the time
All of the time
During the last 30 days, about how often did you feel so nervous that nothing could calm you down?
None of the time
A little of the time
Some of the time
Most of the time
All of the time
During the last 30 days, about how often did you feel hopeless?
None of the time
A little of the time
Some of the time
Most of the time
All of the time
During the last 30 days, about how often did you feel restless or fidgety?
None of the time
A little of the time
Some of the time
Most of the time
All of the time
During the last 30 days, about how often did you feel so restless you could not sit still?
None of the time
A little of the time
Some of the time
Most of the time
All of the time
During the last 30 days, about how often did you feel depressed?
None of the time
A little of the time
Some of the time
Most of the time
All of the time
During the last 30 days, about how often did you feel that everything was an effort?
None of the time
A little of the time
Some of the time
Most of the time
All of the time
During the last 30 days, about how often did you feel so sad that nothing could cheer you up?
None of the time
A little of the time
Some of the time
Most of the time
All of the time
During the last 30 days, about how often did you feel worthless?
None of the time
A little of the time
Some of the time
Most of the time
All of the time
What is your age?
What is your gender?
Male
Female
What is your weight? (In kilograms)
What is your height? (In centimetres)
On which floor is your workspace located?
1st
2nd
3rd
4th
Other (Please specify)
What is your level of highest educationalattainment?
Post Graduate Qualifications (eg. Masters, PhD)
Bachelor Level Qualifications
Other Post School Qualifications (eg. VET/TAFE certificate, apprenticeship or diploma)
Completed Year 12 Schooling or equivalent
Completed Year 10 schooling or equivalent
Did not complete Year 10 schooling or equivalent
What is your relationship status?
Married/living with someone
Single/dating someone
What is your smoking status?
Smoker
Exsmoker
Never smoked
Do you have any of the following? (tick all that apply)
Diabetes
Arthritis
Cancer
Stroke
Heart disease
High blood pressure
High cholesterol
Osteoporosis
Other (please specify)
Follow up questionnaire administered to the intervention group
Did you get any benefits by alternating between sitting and standing? (Tick any that apply)
Uncertain
Less stressed
More comfortable
More productive
More focused
Happier
Energised
Healthier
None of the above
Other (please specify)
This section asks for your views about your physical and mental health over the last four weeks. If you are unsure of how to answer, please give the best answer you can.
Overall, how would you rate your PHYSICAL health during the past 4 weeks?
Excellent
Very good
Good
Fair
Poor
Very poor
Overall, how would you rate your MENTAL health during the past 4 weeks?
Excellent
Very good
Good
Fair
Poor
Very poor
The next three questions will ask about your work ability. Work ability is a term used to describe how you perceive your ability to undertake your work. Your CURRENT work ability compared with your lifetime best. Assume that your work ability at its best has a value of 10 points and that your work ability at its worst has a value of 0 points. How many points would you give your CURRENT work ability? Select the most appropriate number on the scale below.
1
2
3
4
5
6
7
8
9
10
How would you rate your CURRENT work ability in relation to the PHYSICAL demands of your job?
Very poor
Fairly poor
Moderate
Fairly good
Very good
How would you rate your CURRENT work ability in relation to the MENTAL
demands of your job?
Very poor
Fairly poor
Moderate
Fairly good
Very good
During the last 30 days, about how often did you feel tired out for no good reason?
None of the time
A little of the time
Some of the time
Most of the time
All of the time
During the last 30 days, about how often did you feel nervous?
None of the time
A little of the time
Some of the time
Most of the time
All of the time
During the last 30 days, about how often did you feel so nervous that nothing could calm you down?
None of the time
A little of the time
Some of the time
Most of the time
All of the time
During the last 30 days, about how often did you feel hopeless?
None of the time
A little of the time
Some of the time
Most of the time
All of the time
During the last 30 days, about how often did you feel restless or fidgety?
None of the time
A little of the time
Some of the time
Most of the time
All of the time
During the last 30 days, about how often did you feel so restless you could not sit still?
None of the time
A little of the time
Some of the time
Most of the time
All of the time
During the last 30 days, about how often did you feel depressed?
None of the time
A little of the time
Some of the time
Most of the time
All of the time
During the last 30 days, about how often did you feel that everything was an effort?
None of the time
A little of the time
Some of the time
Most of the time
All of the time
During the last 30 days, about how often did you feel so sad that nothing could cheer you up?
None of the time
A little of the time
Some of the time
Most of the time
All of the time
During the last 30 days, about how often did you feel worthless?
None of the time
A little of the time
Some of the time
Most of the time
All of the time
Follow up questionnaire administered to the control group
This section asks for your views about your physical and mental health over the last four weeks. If you are unsure of how to answer, please give the best answer you can.
Overall, how would you rate your PHYSICAL health during the past 4 weeks?
Excellent
Very good
Good
Fair
Poor
Very poor
Overall, how would you rate your MENTAL health during the past 4 weeks?
Excellent
Very good
Good
Fair
Poor
Very poor
The next three questions will ask about your work ability. Work ability is a term used to describe how you perceive your ability to undertake your work. Your CURRENT work ability compared with your lifetime best. Assume that your work ability at its best has a value of 10 points and that your work ability at its worst has a value of 0 points. How many points would you give your CURRENT work ability? Select the most appropriate number on the scale below.
1
2
3
4
5
6
7
8
9
10
How would you rate your CURRENT work ability in relation to the PHYSICAL demands of your job?
Very poor
Fairly poor
Moderate
Fairly good
Very good
How would you rate your CURRENT work ability in relation to the MENTAL demands of your job?
Very poor
Fairly poor
Moderate
Fairly good
Very good
During the last 30 days, about how often did you feel tired out for no good reason?
None of the time
A little of the time
Some of the time
Most of the time
All of the time
During the last 30 days, about how often did you feel nervous?
None of the time
A little of the time
Some of the time
Most of the time
All of the time
During the last 30 days, about how often did you feel so nervous that nothing could calm you down?
None of the time
A little of the time
Some of the time
Most of the time
All of the time
During the last 30 days, about how often did you feel hopeless?
None of the time
A little of the time
Some of the time
Most of the time
All of the time
During the last 30 days, about how often did you feel restless or fidgety?
None of the time
A little of the time
Some of the time
Most of the time
All of the time
During the last 30 days, about how often did you feel so restless you could not sit still?
None of the time
A little of the time
Some of the time
Most of the time
All of the time
During the last 30 days, about how often did you feel depressed?
None of the time
A little of the time
Some of the time
Most of the time
All of the time
During the last 30 days, about how often did you feel that everything was an effort?
None of the time
A little of the time
Some of the time
Most of the time
All of the time
During the last 30 days, about how often did you feel so sad that nothing could cheer you up?
None of the time
A little of the time
Some of the time
Most of the time
All of the time
During the last 30 days, about how often did you feel worthless?
None of the time
A little of the time
Some of the time
Most of the time
All of the time
References
[1] | Lee I-M , Shiroma E , Lobelo F , Puska P , Blair S , Katzmarzyk P . Effect of physical inactivity on major non-communicable diseases worldwide: An analysis of burden of disease and life expectancy. Lancet (2012) :380: (9838):219–29. |
[2] | Chau J , van der Ploeg H , Merom D , Chey T , Bauman A . Cross-sectional associations between occupational and leisure-time sitting, physical activity and obesity in working adults. Prev Med (2012) ;54: (3):195–200. |
[3] | Van Uffelen J , Wong J , Chau J , van der Ploeg H , Riphagen I , Gilson N , et al. Occupational sitting and health risks: A systematic review. Am J Prev Med (2010) ;39: (4):379–88. |
[4] | Kilpatrick M , Sanderson K , Blizzard L , Teale B , Venn A . Cross-sectional associations between sitting at work and psychological distress: Reducing sitting time may benefit mental health. Ment Health Phys Act (2013) ;6: (2):103–9. |
[5] | Alkhajah T , Reeves M , Eakin E , Winkler E , Owen N , Healy G . Sit–stand workstations: A pilot intervention to reduce office sitting time. Am J Prev Med (2012) ;43: (3):298–303. |
[6] | Chau JY , Daley M , Srinivasan A , Dunn S , Bauman AE , van der Ploeg HP . Desk-based workers’ perspectives on using sit-stand workstations: A qualitative analysis of the Stand@ Work study. BMC Public Health (2014) ;14: (1):752. |
[7] | Department of Health. Physical Activity and Sedentary Behavior. Canberra (Australia): Australian Government, (2014) . |
[8] | Department of Health. Start active, stay active: A report on physical activity from the four home countries’ Chief Medical Officers. London (England): Department of Health, (2011) . |
[9] | Pronk N , Katz A , Lowry M , Payfer J . Reducing occupational sitting time and improving worker health: The take-a-stand project, 2011. Prev Chronic Dis (2012) (9):1–9. |
[10] | Ellegast R , Weber B , Mahlberg R . Method inventory for assessment of physical activity at VDU workplaces. Work (2012) ;41: :2355–9. |
[11] | Husemann B , Von Mach C , Borsotto D , Zepf K , Scharnbacher J . Comparisons of musculoskeletal complaints and data entry between a sitting and a sit-stand workstation paradigm. Hum Fac Erg Soc (2009) ;51: (3):310–20. |
[12] | Neuhaus M , Eakin E , Straker L , Owen N , Dunstan D , Reid N , et al. Reducing occupational sedentary time: A systematic review and meta-analysis of evidence on activity-permissive workstations. Obes Rev (2014) ;10: :822–38. |
[13] | Radas A , Mackey M , Leaver A , Bouvier An-L , Chau J , Shirley D , et al. Evaluation of ergonomic and education interventions to reduce occupational sitting in office-based university workers: Study protocol for a randomized controlled trial. Trials (2013) ;14: (1):330. |
[14] | Lyden K , Kozey Keadle S , Staudenmayer J , Freedson P . Validity of two wearable monitors to estimate breaks from sedentary time. Med Sci Sports Exerc (2012) ;44: (11):2243–52. |
[15] | Kozey-Keadle S , Libertine A , Lyden K , Staudenmayer J , Freedson P . Validation of wearable monitors for assessing sedentary behavior. Med Sci Sports Exerc (2011) ;43: (8):1561–7. |
[16] | Kessler RC , Andrews G , Colpe LJ , Hiripi E , Mroczek DK , Normand S-L , et al. Short screening scales to monitor population prevalences and trends in non-specific psychological distress. Psychol Med (2002) ;32: (06):959–76. |
[17] | Slade T , Grove R , Burgess P . Kessler psychological distress scale: Normative data from the 2007 Australian national survey of mental health and wellbeing. Aus NZ J Psych (2011) ;45: (4):308–16. |
[18] | Australian Bureau of Statistics. Information Paper: Use of the Kessler Psychological Distress Scale in ABS Health Surveys, Australia, 2007-08 [Internet]: ABS publication 4817.0.55.001; 2012 [cited 2015 Jan 10]. Available from http://www.abs.gov.au/ausstats/[email protected]/mf/4817.0.55.001 |
[19] | Turner-Bowker DM , Bayliss MS , Ware JE , Kosinski M . Usefulness of the SF-8trademark health survey for comparing the impact of migraine and other conditions. Qual Life Res (2003) ;12: (8):1003–12. |
[20] | Tuomi K , Ilmarinen J , Jahkola A , Katajarinne L , Tulkki A . Work Ability Index (WAI). Helsinki (UM) Finnish Institute of Occupational Health, (1998) . |
[21] | Gould R , Ilmarinen J , Järvisalo J , Koskinen S . Dimensions of Work Ability: Results of the Health 2000 Survey [Internet] Helsinki (Finland): Finnish Institute of Occupational Health; 2008 [cited 2015 Jan 20]. Available from http://www.julkari.fi/bitstream/handle/10024/78055/dimensions_of_work_ability_7.pdf |
[22] | De Zwart B , Frings-Dresen M , Van Duivenbooden J . Test–retest reliability of the Work Ability Index questionnaire. Occup Med (2002) ;52: (4):177–81. |
[23] | Australian Institute of Health and Welfare. Body Weight [Internet] 2013 [cited 2015 Jan 16]. Available from: http://www.aihw.gov.au/body-weight/ |
[24] | Neuhaus M , Healy G , Dunstan D , Owen N , Eakin E . Workplace sitting and height-adjustable workstations: A randomized controlled trial. Am J Prev Med (2014) ;46: (1):30–40. |
[25] | Healy G , Eakin E , LaMontagne A , Owen N , Winkler E , Wiesner G , et al. Reducing sitting time in office workers: Short-term efficacy of a multicomponent intervention. Prev Med (2013) ;57: (1):43–8. |
[26] | Chau J , Grunseit A , Chey T , Stamatakis E , Brown W , Matthews C , et al. Daily sitting time and all-cause mortality: A meta-analysis. PLoS One (2013) ;8: (11):e80000. |
[27] | Straker L , Healy GN , Atherton R , Dunstan DW . Excessive occupational sitting is not a “safe system of work”: Time for doctors to get chatting with patients. Med J Aust (2014) ;201: (3):138–40. |
[28] | Gilson N , Burton N , Van Uffelen J , Brown W . Occupational sitting time: Employees’ perceptions of health risks and intervention strategies. Health Promot J Austr (2011) ;22: (1):38–43. |
[29] | Healy G , Dunstan D , Salmon J , Cerin E , Shaw J , Zimmet P , et al. Breaks in Sedentary Time Beneficial associations with metabolic risk. Diabetes Care (2008) ;31: (4):661–6. |
[30] | Braveman P , Egerter S , Williams DR . The social determinants of health: Coming of age. Annu Rev Public Health (2011) ;32: :381–98. |
Figures and Tables
Fig.1
Overview of study procedures.
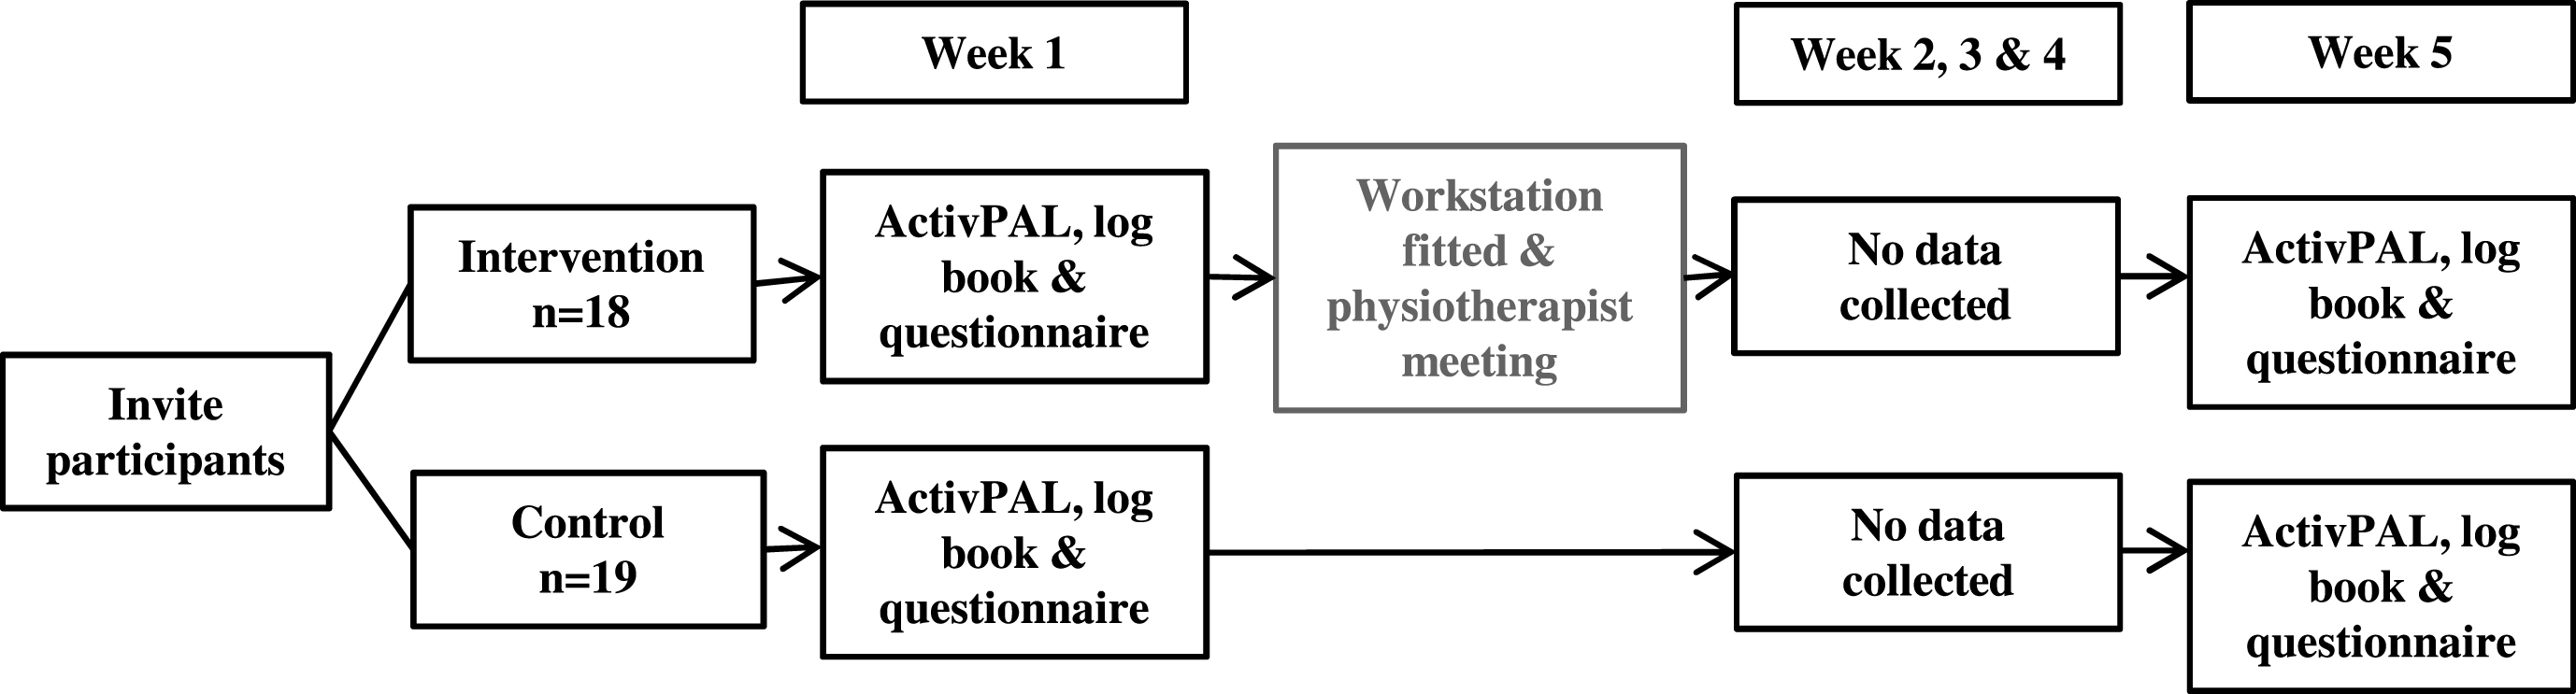
Fig.2
Flowchart of participant recruitment and retention.
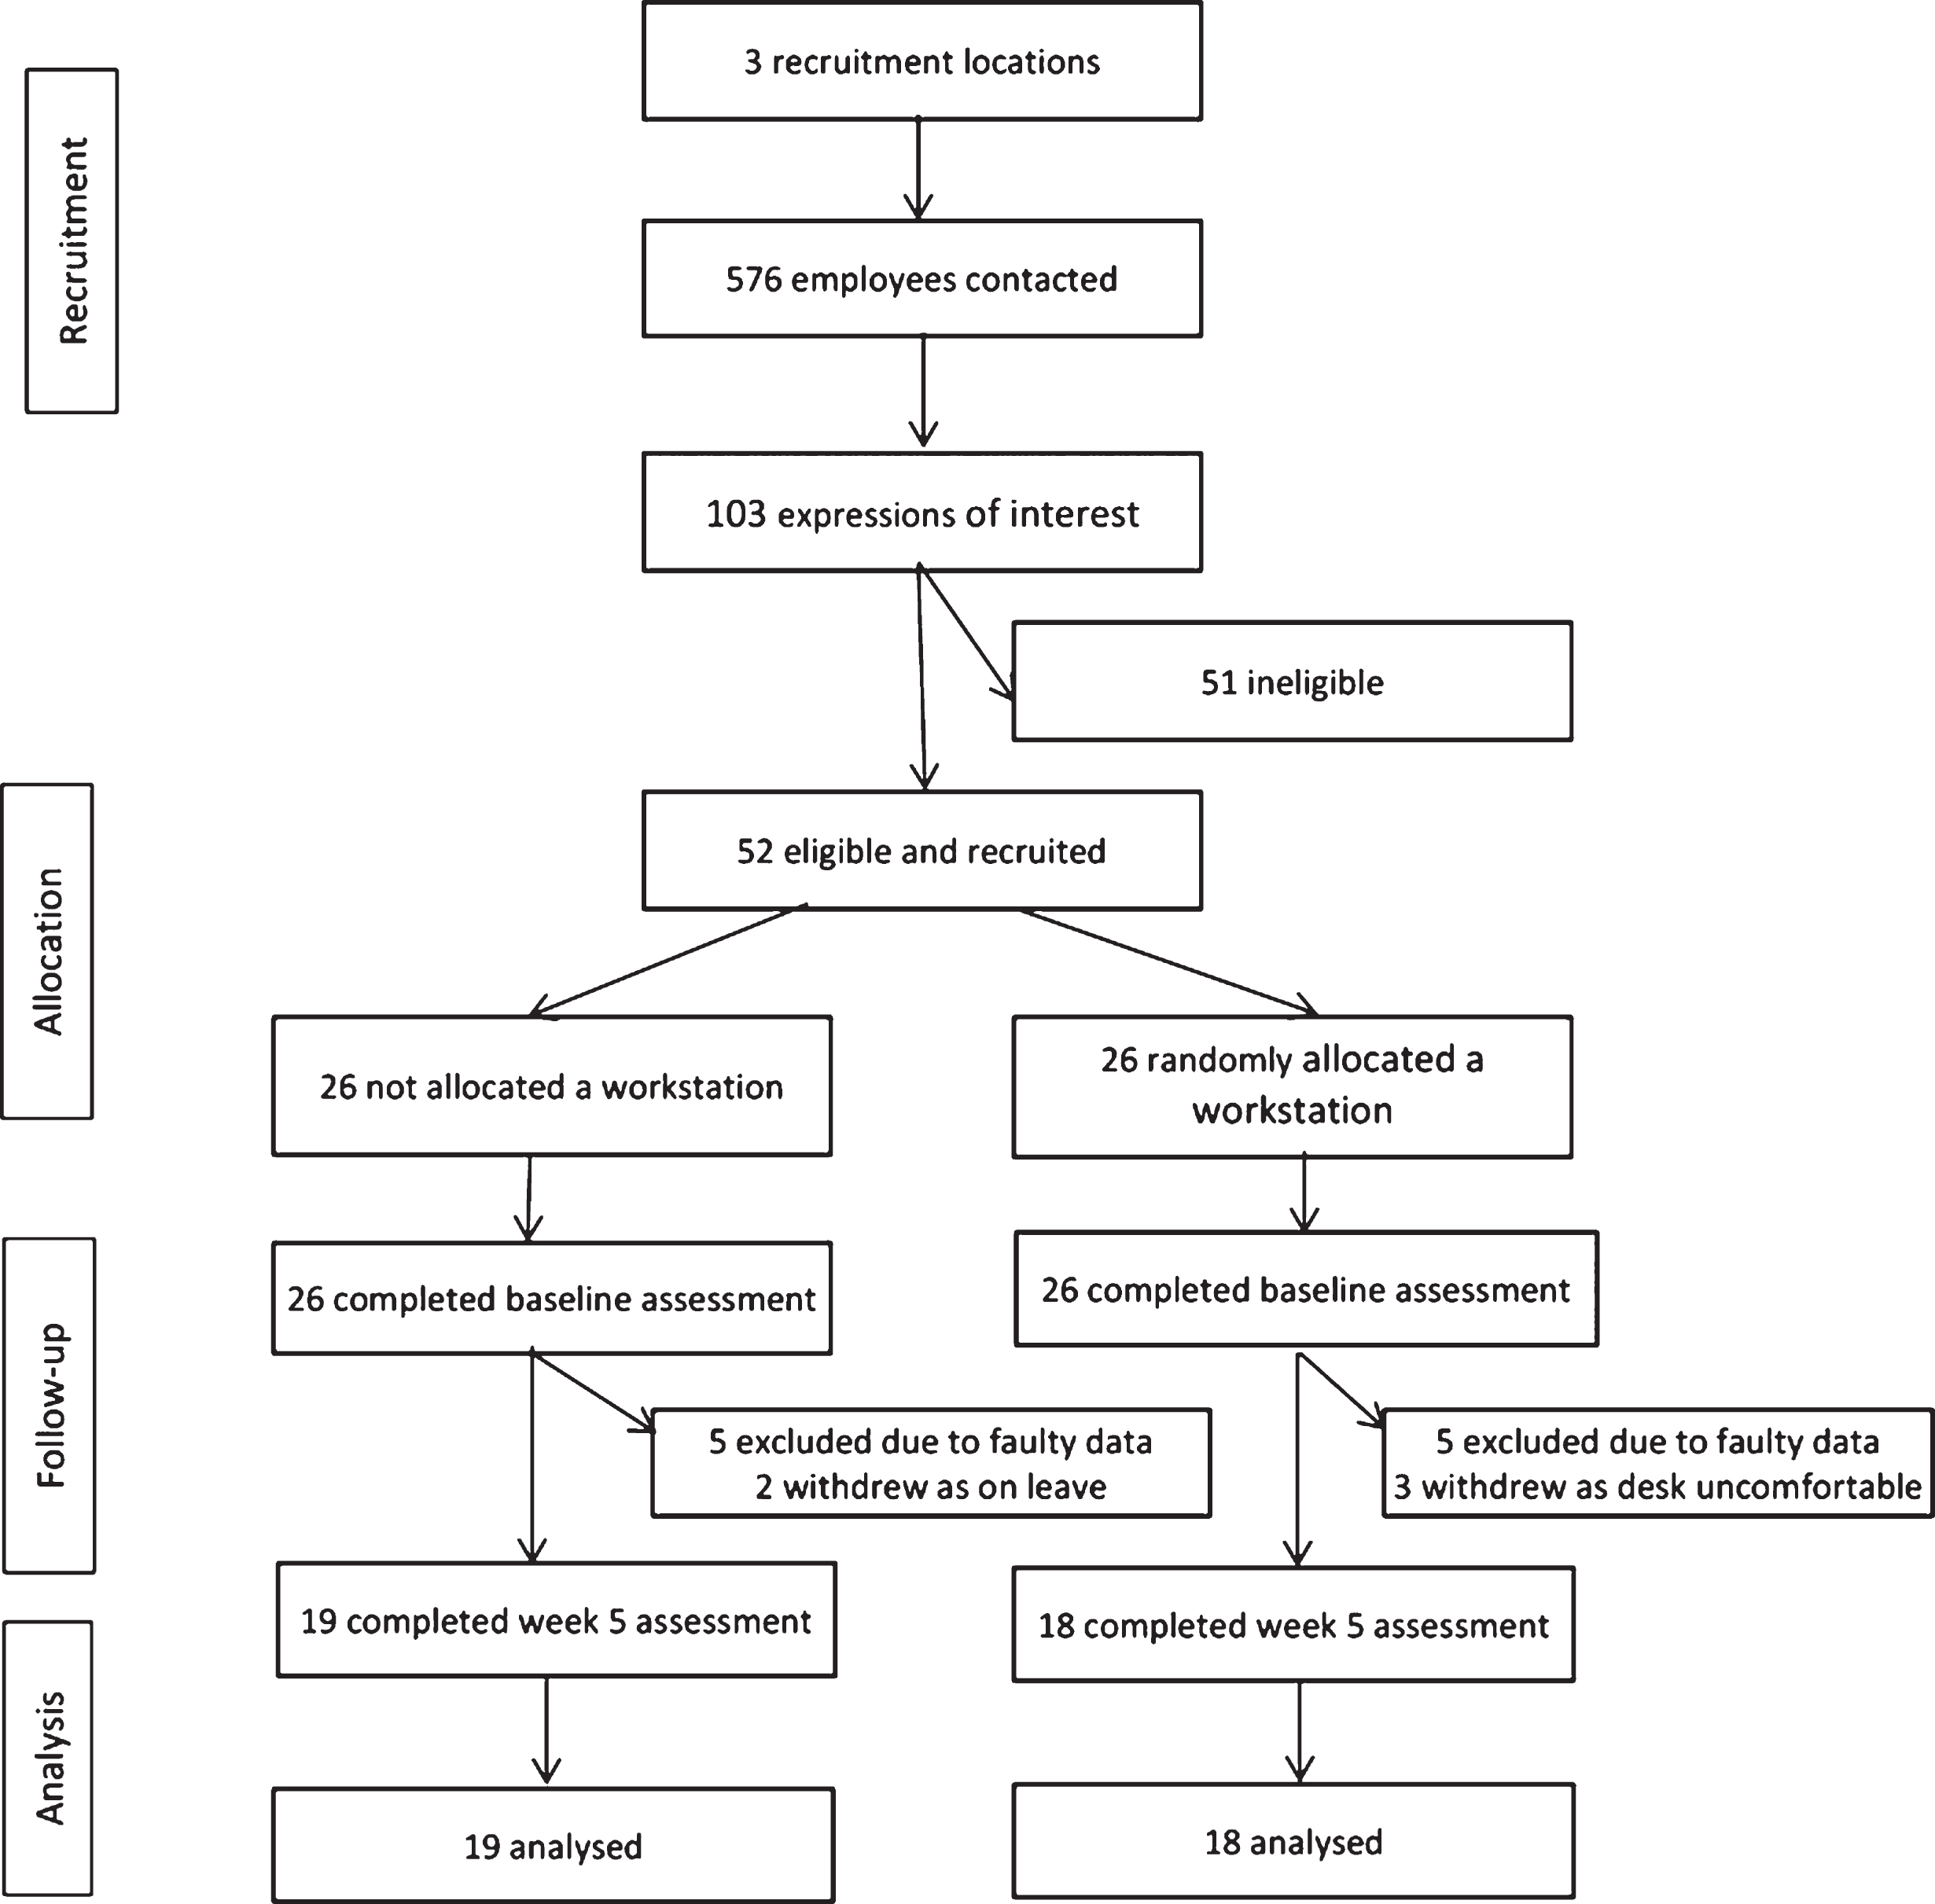
Table 1
Baseline demographic and workplace characteristics of study participants
| Intervention | Control | |
| % (n) | % (n) | |
| (n=18) | (n=19) | |
| Age in years (mean±SD) | 34.8±10.5 | 34.3±8.9 |
| Women | 89 (16) | 84 (16) |
| Married/living with someone | 83 (15) | 79 (15) |
| Body Mass Index (BMI) | ||
| Under/healthy weight (BMI <25) | 78 (14) | 84 (16) |
| Overweight/obese (BMI ≥25) | 22 (4) | 16 (3) |
| Level of Highest educational attainment | ||
| Post graduate (Bachelor, Masters, PhD) | 88 (16) | 89 (17) |
| Other post school qualification | 6 (1) | 11 (2) |
| Completed year 12 schooling or equivalent | 6 (1) | 0 (0) |
| Smoking status | ||
| Ex-smoker | 11 (2) | 16 (3) |
Standard Deviation (SD); number (n); Doctor of Philosophy (PhD)
Table 2
Overall changes between intervention and control group in time spent sitting, standing, sit-stand transitions, stepping time, and steps taken
| Intervention | Control | P value | |
| Sitting time (minutes/8-h workday) | –99.8±65.7 | 1.8±34.7 | <0.001b |
| Standing time (minutes/8-h workday) | 99.4±83.9 | 2.0±10.5 | <0.001b |
| Sit-stand transitions (n/8-h workday) | –4.1±8.9 | 0.8±10.5 | 0.138b |
| Stepping time (minutes/8-h workday) | 2.1 (14.7)a | 2.3 (11.2)a | 0.761c |
| Steps taken (n/8-h workday) | 186.1 (1230.1)a | 194.2 (1066.7)a | 0.715c |
Bold italic typeface indicates P value is significant. amedian and interquartile range. bP value determined by an independent t-test. cP value determined by a Mann-Whitney U test.
Table 3
Overall changes between intervention and control group in self-reported mental and physical health outcomes
| Intervention | Control | P value | |
| K10 | 0.0±3.0 | –0.3±2.1 | 0.710b |
| Mental health: Previous four weeks (SF-8) | 0±1.0 | 0.1±1.0 | 0.597b |
| Physical health: Previous four weeks (SF-8) | 0.0 (1.0)a | 0.0 (0.0)a | 0.761c |
| Current work ability: Compared to lifetime best | 0.0 (1.25)a | 0.0 (1.0)a | 0.008 c |
| Current work ability: Mental demands of work | 0.0 (0.25)a | 0.0 (1.0)a | 0.162c |
| Current work ability: Physical demands of work | 0.0 (0.0)a | 0.0 (0.0)a | 0.720c |
Bold italic typeface indicates P value is significant. amedian and interquartile range reported for skewed variable instead of mean and standard deviation. bP value determined by an independent t-test. cP value determined by a Mann-Whitney U test.

