
The effects of disease-related symptoms on daily function in Wolfram Syndrome
Abstract
OBJECTIVE:
To investigate daily function among individuals with Wolfram Syndrome (WFS) and examine whether any limitations are related to disease-related symptoms.
METHODS:
WFS (n = 31), Type 1 diabetic (T1DM; n = 25), and healthy control (HC; n = 29) participants completed the Pediatric Quality of Life Questionnaire (PEDSQL) Self and Parent Report. PEDSQL domain scores were compared among these groups and between WFS patients with and without specific disease-related symptoms. Relationships between PEDSQL scores and symptom severity as assessed by the Wolfram Unified Rating Scale (WURS) Physical Scale were also examined.
RESULTS:
Across most domains, the WFS group had lower PEDSQL Self and Parent Report scores than the T1DM and HC groups. WFS participants with urinary, sleep, and temperature regulation problems had lower PEDSQL scores than those without. The WURS Physical Scale correlated with Self and Parent Report PEDSQL domains. WFS group Self and Parent Reports correlated with each other.
CONCLUSIONS:
The WFS group reported lower daily function compared to T1DM and HC groups. Within WFS, worse symptom severity and the specific symptoms of sleep, temperature regulation, and urinary problems were associated with poorer daily function. These findings provide rationale for an increased emphasis on identifying, treating and understanding these less well-known symptoms of WFS.
1Introduction
Wolfram syndrome (WFS) [1], is a rare, autosomal recessive neurodegenerative disorder characterized by childhood-onset diabetes mellitus, optic nerve atrophy and vision loss, diabetes insipidus, and hearing impairment. In addition, WFS patients can develop a wide array of complex sensory, motor, psychiatric and neurological issues, including bladder and bowel dysfunction, vestibular deficits, temperature regulation problems, decreased balance, ataxic gait and olfactory deficits [2–4]. Psychiatric symptoms such as anxiety and depression have also been noted in those with WFS, but cognition appears to remain generally intact [5]. Brain imaging reveals significantly lower volume of the brainstem and cerebellum and reduced myelination throughout the brain compared to controls [6, 7].
It is often assumed that the wide range of WFS-related signs and symptoms must negatively affect daily life [e.g. 8, 9]. Daily function, or the ability to perform and participate in important activities and roles (e.g., self-care, schoolwork, friendships), is essential for health and well-being, and functional limitations can lead to reduced quality of life [10]. A better understanding of perceived daily function among individuals with WFS would inform clinical care and treatment development for this population. Current treatments for WFS focus on managing symptoms, but clinical trials of drugs that hope to stop or slow symptom progression are in the planning stages. The FDA states that Patient Reported Outcomes (PROs) can be useful tools in labeling claims about a patient’s signs, symptoms, or an aspect of function directly related to disease status from the patient’s perspective [11]. Thus, information on the relative impact of the various WFS-related symptoms on patient-reported daily function could guide clinical trial design and potentially influence the development of new treatments that address issues most relevant to patients and their families. Only one study has explicitly addressed daily function among WFS patients. Ribiere and colleagues [12] conducted a phone interview about urinary symptoms in 22 WFS patients (11 males, 11 females; mean age 24.5) and found that 55 percent reported that urinary symptoms negatively impacted their quality of life. This study did not include a control group, direct measurement of urinary function, or evaluation of any other symptoms. Given the wide range and severity of symptoms that can occur in WFS, it is clear that more investigation is needed to determine whether, how, and to what extent these symptoms impact daily life.
The purpose of this study was to investigate perceived daily function among individuals with WFS and determine how any limitations are related to current symptoms. We measured self and parent-reported daily function in a cohort of children, adolescents, and young adults with WFS and age- and gender-matched individuals with and without type 1 diabetes mellitus (T1DM). WFS patients had all of their symptoms fully characterized in our Washington University (WU) WFS Research Clinic. These data were used to determine whether groups differed in daily function and within WFS, to explore whether specific symptoms are associated with lower daily function.
2Methods
This study was approved by the Human Research Protection Office at WU. All participants gave written informed consent before testing. For children under age 18, parents/guardians provided written consent and children assented to testing.
2.1Participants
WFS patients were a part of a longitudinal natural history study involving annual data collection at the WU WFS Research Clinic. For enrollment in the Research Clinic, patients had to be age 30 or younger and have genetically confirmed WFS (mutations of the WFS1 gene). The data reported in this paper are from each participant’s first year in the Research Clinic, which could have occurred between 2010 and 2016. Other analyses and subsets of the research clinic data have been reported elsewhere [4–6].
The comparison groups consisted of individuals with type 1 diabetes (T1DM) and non-diabetic healthy controls (HC). The T1DM group was recruited through the WU Pediatric Diabetes Clinic. T1DM participants were clinically diagnosed with T1DM based on disease presentation, physical exam, medical history, and family history. HC participants were recruited through the community or were siblings of participants in the T1DM group. Exclusion criteria included self-reported psychiatric or neurological diagnoses, the use of psychoactive medications, contraindication to magnetic resonance imaging (MRI) (data not shown here), and <36 week gestation with respirator use or other complications.
2.2Procedure
Individuals with WFS completed a comprehensive battery of assessments (e.g., vision, hearing, endocrinologic function, cognition, MRI) and questionnaires over the course of three days at the Research Clinic. The T1DM and HC participants completed an abbreviated battery of assessments and questionnaires in one testing session. Details of the measures used in this analysis are presented below.
2.3Measures
2.3.1Pediatric quality of life inventory (PEDSQL)
All participants and their parents completed the PEDSQL 4.0 Generic Core Scales, a reliable and valid 23-item questionnaire for children, teens and young adults that assesses function over the last month in four dimensions (Physical, Emotional, Social, School/Work) [13]. Items within each dimension are transformed to a scale of 0–100 and averaged to produce scale scores. Items from the Emotional, Social, and School/Work Functioning scales can be averaged to yield a Psychosocial Health score, and all items can be averaged to yield a Total Score. Higher scores indicate better perceived function.
WFS participants with diabetes mellitus and T1DM participants also completed the 28-item self-report Diabetes Module of the PEDSQL [14], which consists of four dimensions: Diabetes (symptoms), Treatment I (treatment barriers), Treatment II (treatment adherence), Worry and Communication. Parents of the WFS and T1DM participants completed the parent report PEDSQL Diabetes Module.
2.3.2Wolfram syndrome specific measures
A pediatric neurologist completed a neurologic exam and the Wolfram Unified Rating Scale (WURS) Physical scale for each WFS participant during the Research Clinic. The WURS Physical scale assesses severity of a variety of symptoms associated with WFS (e.g., vision, hearing, motor, urological, neurological, and, temperature regulation) and has good inter-rater reliability and validity [15]. The WURS Physical scale has a maximum score of 134, with higher scores indicating more severe symptoms. Optic atrophy is determined by ophthalmology exam. Best corrected visual acuity was measured by Snellen optotype [16]. Pure tone testing (250 to 8,000 Hz) was conducted by a trained audiologist via insert earphones with a Madsen Orbiter 922 audiometer calibrated to American National Standards Institute [17]. Smell was assessed by the University of Pennsylvania Olfaction Test [18]. Presence of sleep problems was determined through self-report during the neurological exam.
2.4Analyses
Study data were collected and managed using REDCap electronic data capture tools hosted at WU [19] and analyzed with IBM SPSS, version 23 [20]. Descriptive statistics were calculated. Group comparisons of PEDSQL scores were made among the study groups (WFS, T1DM, HC) using one-way ANOVA controlling for race and socioeconomic status (SES; calculated using Barratt Simplified Measure of Social Status [21]). Within the WFS group, comparisons of PEDSQL scores between those with and without each WFS-related symptom were made using Mann-Whitney U tests. Relationships between assessments were calculated with Pearson correlations.
3Results
3.1Participant characteristics
Demographic and clinical characteristics of the sample are in Table 1. Groups were evenly matched on age and gender, but the racial distribution and SES of the WFS group were significantly different from those of the T1DM and the HC groups. These factors were included as covariates in group comparisons.
Table 1
Demographic and clinical characteristics of the sample
| WFS | T1DM | HC | |
| n | 31 | 25 | 29 |
| Gender: m(f) | 12 (19) | 10 (15) | 15 (14) |
| Age range (years) | 5.1–25.8 | 7.6–26.2 | 5.9–26.0 |
| M (SD) | 13.8 (5.5) | 13.6 (4.6) | 13.8 (5.4) |
| Race/ethnicity (n)* | |||
| Caucasian | 24 | 23 | 22 |
| Hispanic | 7 | 1 | 2 |
| African American | 0 | 0 | 2 |
| Other | 0 | 1 | 3 |
| SES (M (SD))*∧ | 41.03 (12.74) | 47.32 (9.01) | 50.39 (10.70) |
| Presence of: | |||
| Optic Atrophy | 94% | ||
| Diabetes Mellitus | 88% | ||
| Diabetes Insipidus | 67% | ||
| Hearing Loss | 64% | ||
| Urinary Problems | 49% | ||
| Temperature Regulation | 49% | ||
| Sleep Problems | 36% | ||
| Bowel Problems | 21% | ||
| WURS Physical (M (SD)) | 8.74 (6.18) |
*p < 0.05. ∧WFS n = 29, T1DM n = 20, HC n = 23. SES = Socioeconomic Status, as determined by Barratt Simplified Measure of Social Status (score range 8–66). WURS = Wolfram Unified Rating Scale.
3.2Comparisons of PEDSQL scores across WFS, T1DM and HC groups
Group Parent and Self Report PEDSQL scores are presented in Fig. 1. For the Parent Report (Panel B) Physical Health, Psychosocial Health, School/Work Functioning, and Total scores were different across all groups, F(2, 76) ≥4.80, p≤0.02, such that the WFS group was lower than the TIDM group and HC group (p≤0.002), which were equivalent (p≥0.07). Social Functioning scores in the WFS and T1DM groups were lower than the HC group, F(76) >4.81, p < 0.02, but equivalent to each other (p = 0.79). Emotional Functioning scores were different across groups, F(2, 76) = 11.40, p < 0.001, such that the WFS and T1DM groups were significantly lower than the HC group (p≤0.02), and there was a trend-level difference between the WFS and T1DM groups (WFS was lower; p = 0.057).
Fig.1
Between Group Means of the PEDSQL Parent (Panel A) and Self (Panel B) Report. The Total Score is comprised of the Physical and Psychosocial domains; Emotional, Social, and School/ Work functioning make up the Psychosocial domain. *different from the other groups.
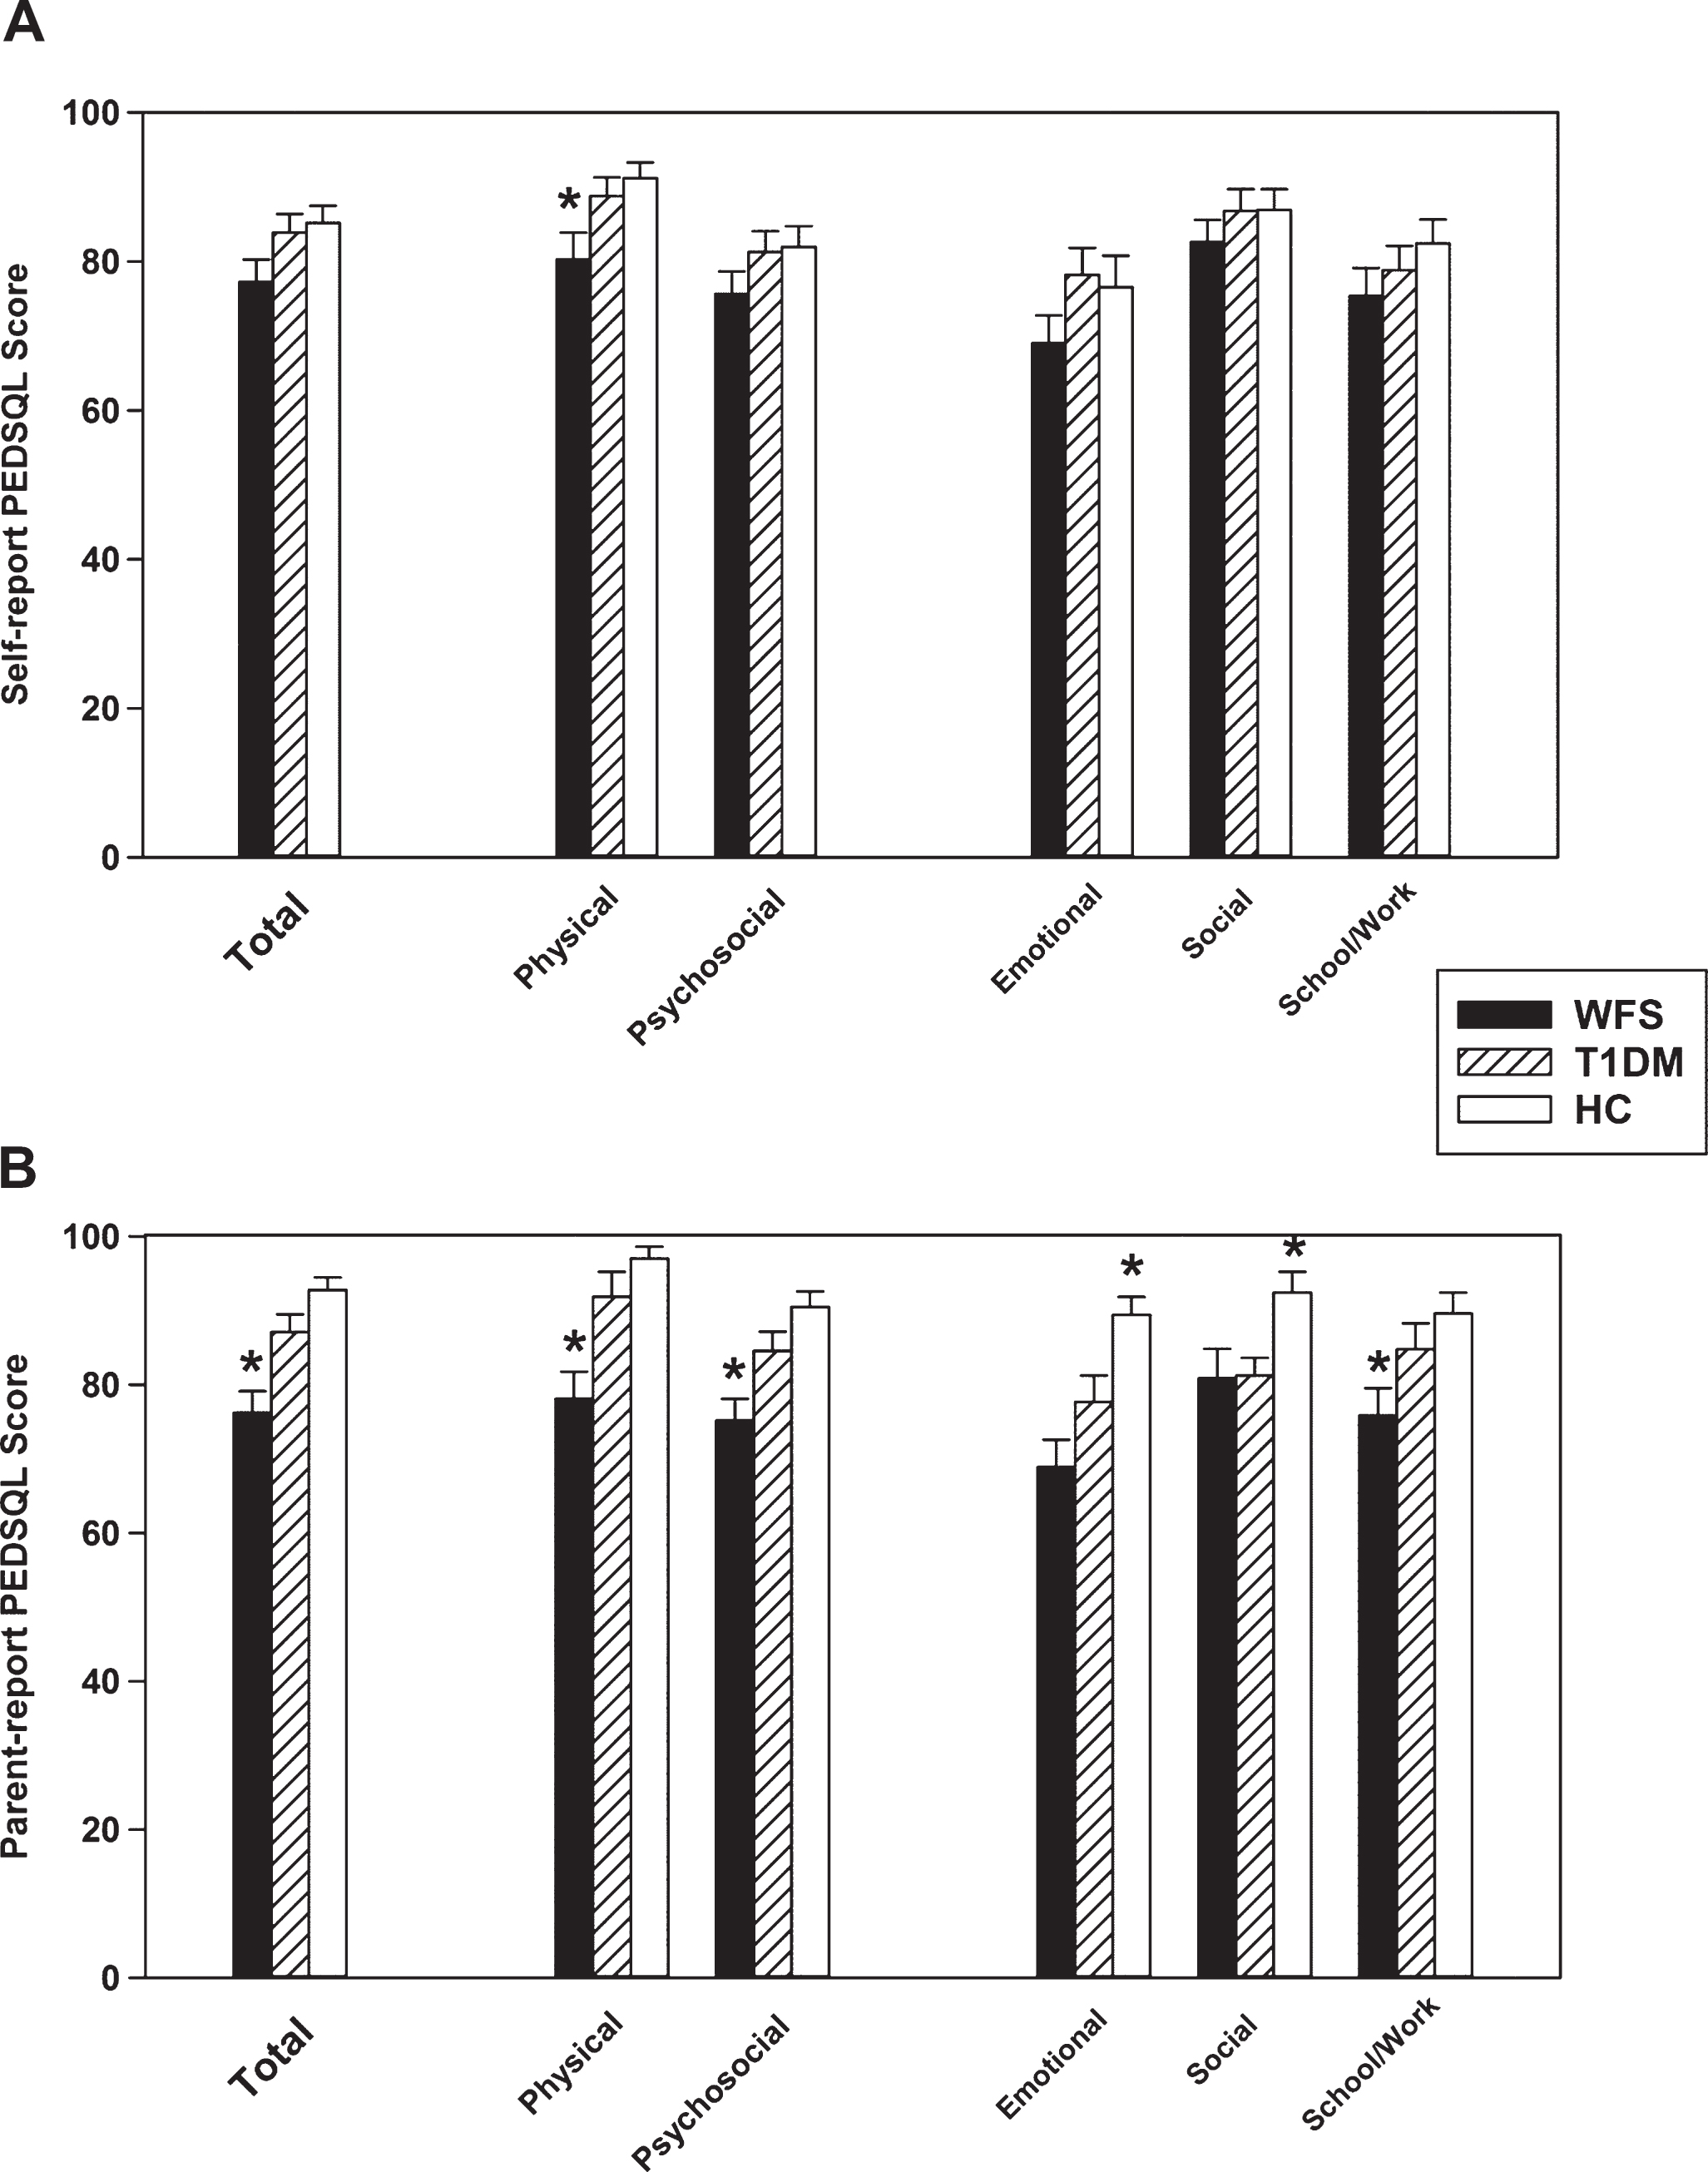
For the Self Report (Panel A), there were significant group differences in Physical Health, F(84) = 4.80, p = 0.01, such that the WFS group was lower than the T1DM and HC groups (p≤0.03), which were equivalent (p > 0.54). There were no group differences in Psychosocial Health, Emotional Functioning, Social Functioning, School/Work Functioning, or Total score, F(84) ≤2.83, p≥0.08.
There were no differences between the WFS and T1DM groups’ PEDSQL Diabetes Module domain scores for Parent or Self Report (p≥0.15).
To further investigate the potential role of SES in our group effects, we re-analyzed the data without the two WFS participants who were low outliers on SES. Our results remained unchanged, suggesting that SES does not explain the lower PEDSQL scores in the WFS group.
3.3Relationship of PEDSQL and WFS-related symptoms
Within the WFS group, PEDSQL scores were compared between participants with and without key symptoms such as vision loss, urinary problems, bowel problems, diabetes insipidus, hearing loss, sleep problems, and temperature regulation problems (see Table 1). Diabetes Mellitus was not analyzed because almost all WFS participants had it. Results of the comparisons of PEDSQL scores across symptom groups are in Table 2. Overall, urinary problems, sleep problems, and temperature regulation problems had the most impact on reported daily function. Parent and Self Report Social Functioning was worse for WFS participants with urinary problems compared to those without (Parent Social: with mean = 76.18, SD = 16.91, without mean = 86.43, SD = 21.88; Self Social: with mean = 76.12, SD = 15.54, without mean = 86.79, SD = 20.81). Parent Report Physical Functioning, Psychosocial Health, Emotional Functioning and Total Score were worse for WFS participants with sleep problems compared to those without (Physical: with mean = 67.33, SD = 18.82, without mean = 83.93, SD = 16.87; Psychosocial: with mean = 66.82, SD = 15.94, without mean = 79.75, SD = 11.95; Emotional: with mean = 61.00, SD = 16.80, without mean = 72.86, SD = 20.35; Total: with mean = 67.00, SD = 16.08, without mean = 81.24, SD = 11.60). Parent report School Functioning and Psychosocial Health were worse for WFS participants with temperature regulation problems compared to those without (Social: with mean = 76.07, SD = 23.22, without mean = 84.71, SD = 15.86; Psychosocial: with mean = 68.10, SD = 14.03, without mean = 80.98, SD = 12.76). We divided participants with optic atrophy into “Mild/ Moderate” visual impairment (LOGMAR <0.6) and “Severe” visual impairment (LOGMAR >0.6) groups; there were no significant differences in PEDSQL scores between these groups, but there was a trend level difference in the Parent Report Emotional Functioning, such that those WFS participants with more severe visual impairment had lower scores. In addition, there were no differences in PEDSQL scores for those with or without bowel problems, hearing loss, or a diagnosis of diabetes insipidus.
Table 2
Comparison (Mann Whitney U) of PEDSQL scores in those with and without WFS-related symptoms
| Physical Health | Psychosocial Health | Emotional Functioning | Social Functioning | School/Work Functioning | Total | |||||||||||||||||||
| Parent | Self | Parent | Self | Parent | Self | Parent | Self | Parent | Self | Parent | Self | |||||||||||||
| U | p | U | p | U | p | U | p | U | p | U | p | U | p | U | p | U | p | U | p | U | p | U | p | |
| Vision Loss | 50.5 | 0.09 | 62.5 | 0.75 | 47.5 | 0.22 | 66.5 | 0.32 | 34.0 | 0.05∧ | 58.0 | 0.34 | 68.0 | 0.72 | 54.0 | 0.24 | 44.5 | 0.13 | 68.0 | 0.65 | 38.0 | 0.07 | 42.0 | 0.39 |
| (Mild vs Severe) | ||||||||||||||||||||||||
| Urinary Problems | 86.5 | 0.68 | 57.5 | 0.44 | 66.5 | 0.20 | 38.5 | 0.17 | 67.5 | 0.23 | 54.0 | 0.54 | 42.5 | 0.02 | 33.0 | 0.04 | 81.0 | 0.76 | 47.5 | 0.23 | 77.5 | 0.49 | 46.5 | 0.37 |
| (Presence vs. Absence) | ||||||||||||||||||||||||
| Bowel Problems | 69.5 | 0.80 | 38.0 | 0.31 | 64.0 | 0.90 | 45.5 | 0.51 | 58.0 | 0.50 | 56.5 | 0.57 | 52.5 | 0.41 | 34.0 | .017 | 68.0 | 0.66 | 46.5 | 0.71 | 67.0 | 1.00 | 42.5 | 0.44 |
| (Presence vs. Absence) | ||||||||||||||||||||||||
| Diabetes Insipidus | 71.0 | 0.54 | 62.0 | 0.95 | 72.0 | 0.54 | 70.0 | 0.46 | 61.5 | 0.34 | 62.5 | 1.00 | 72.5 | 0.49 | 68.5 | 0.49 | 72.5 | 0.78 | 69.5 | 0.51 | 66.5 | 0.37 | 71.0 | 0.44 |
| (Presence vs. Absence) | ||||||||||||||||||||||||
| Hearing Loss | 41.5 | 0.12 | 59.5 | 0.58 | 50.5 | 0.14 | 50.5 | 0.26 | 62.5 | 0.24 | 48.0 | 0.12 | 49.0 | 0.15 | 53.0 | 0.27 | 61.5 | 0.51 | 67.0 | 0.76 | 43.5 | 0.10 | 56.0 | 0.47 |
| (Presence vs. Absence) | ||||||||||||||||||||||||
| Sleep Problems | 38.5 | 0.01 | 73.0 | 0.81 | 39.5 | 0.02 | 46.0 | 0.18 | 36.5 | 0.01 | 44.5 | 0.13 | 72.0 | 0.61 | 46.0 | 0.26 | 52.0 | 0.08 | 62.5 | 0.49 | 34.5 | 0.01 | 54.0 | 0.34 |
| (Presence vs. Absence) | ||||||||||||||||||||||||
| Temperature | 69.5 | 0.46 | 45.5 | 0.09 | 38.5 | 0.01 | 57.0 | 0.14 | 53.0 | 0.02 | 76.5 | 0.42 | 67.5 | 0.29 | 63.5 | 0.29 | 41.5 | 0.02 | 47.0 | 0.07 | 56.5 | 0.12 | 54.0 | 0.13 |
| Regulation | ||||||||||||||||||||||||
| (Presence vs. Absence) | ||||||||||||||||||||||||
Significant comparisons (p < 0.05) are indicated in bold italicized text. ∧Trend level significance reached, p = 0.054.
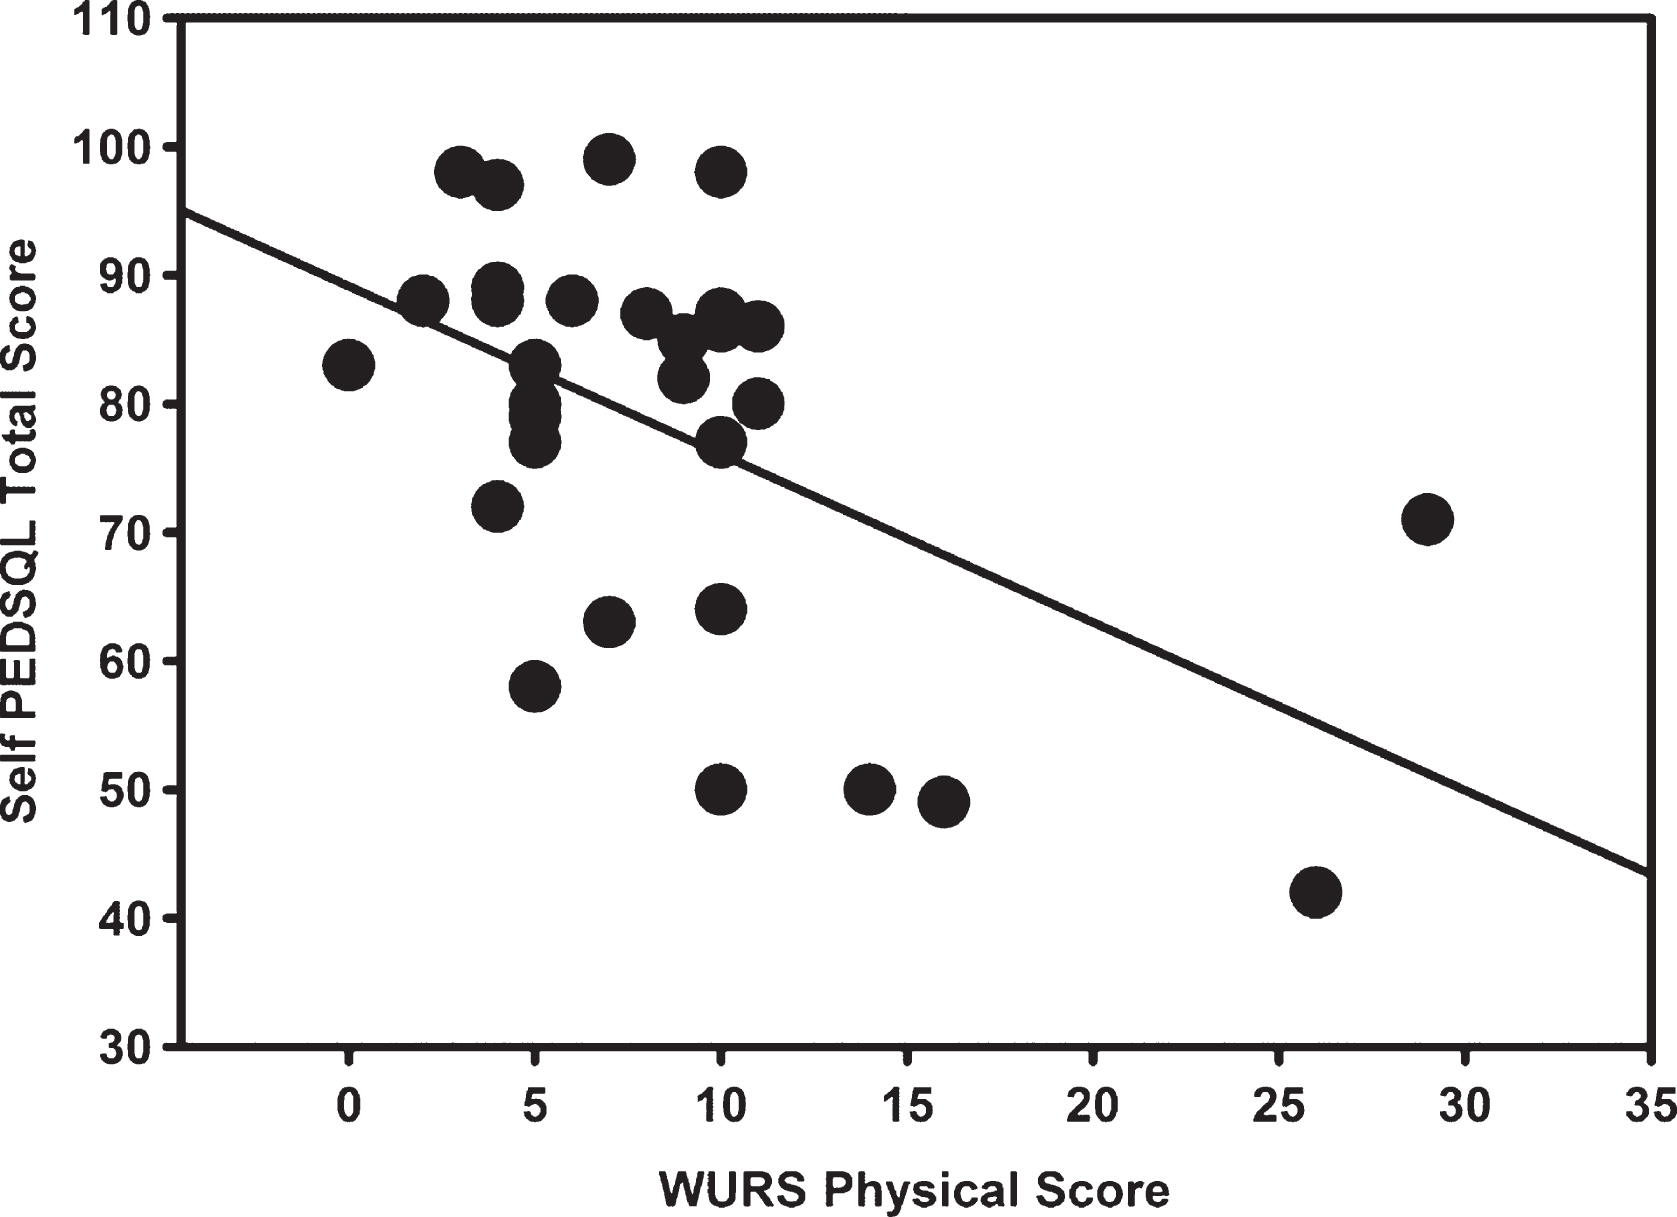
Relationships between severity of WFS-related symptoms and the PEDSQL were examined. In general, overall symptom severity was associated with poorer perceived functioning in most domains. Specifically, the WURS Physical Scale correlated with Parent Report Physical Health, Emotional Functioning, Psychosocial Health, and Total PEDSQL Score (r≤–0.58, p≤0.03) and with Self Report Physical Health, Emotional Functioning, Social Functioning, School/Work Functioning, Psychosocial Health, and Total Score (r≤–0.43, p≤0.02) (Fig. 2). Notably, two participants were statistical outliers on the WURS Physical Scale (scores >2 SDs from the mean) due to the extreme severity of their symptoms. When these participants’ data were removed, the Self Report Emotional Functioning, Social Functioning, School Functioning, Psychosocial Health and Total Score correlations remained significant (r≤–0.41, p≤0.03), but the Parent Report and Self Report Physical Health correlations no longer reached the threshold for significance (p≥0.22). There were no significant correlations between the individual measures of olfaction, visual acuity, and hearing and the PEDSQL scores (r≤–0.42, p≥0.07).
Fig.2
Relationship between the Pediatric Quality of Life (PEDSQL) Self Report Total Score and the Wolfram Unified Rating Scale (WURS) Physical Scale (r = –0.470, p = 0.009). When the two WURS outliers are removed, the relationship remains significant (r = –0.459, p = 0.014).
3.4Relationship of PEDSQL self and parent report within groups
The most significant group differences in PEDSQL scores were in the Parent report, so we further investigated the relationship between the Parent and Self Report PEDSQL (Table 3). The WFS group’s Parent Report and Self Report Physical Health, Psychosocial Health, Emotional Functioning, School Function, Social Function, and Total scores were correlated with each other. In addition, paired samples t-tests revealed no significant differences between Parent and Self Reports for any of the PEDSQL domains (p≥0.51). In contrast, the T1DM and HC group showed no significant correlations between the Self and Parent Reports. Further, within the HC group, the Parent and Self Report, PEDSQL Physical Functioning, Emotional Functioning, Psychosocial Health and Total Scores were significantly different from each other, but Social Functioning and School Functioning were not different from each other. In the T1DM group, the Parent and Self Report Social Functioning and School Functioning were significantly different from each other, but were not different in the other PEDSQLdomains.
Table 3
Relationship (Pearson’s r) of PEDSQL self and parent report within groups
| WFS | T1DM | HC | ||||
| r | p | r | p | r | P | |
| Physical Health | 0.56 | < 0.01 | –0.16 | 0.46 | 0.24 | 0.23 |
| Psychosocial Health | 0.69 | < 0.01 | 0.05 | 0.80 | –0.22 | 0.29 |
| Emotional Functioning | 0.38 | < 0.05 | –0.24 | 0.29 | –0.15 | 0.46 |
| Social Functioning | 0.61 | < 0.01 | 0.35 | 0.12 | 0.01 | 0.97 |
| School/ Work Functioning | 0.58 | < 0.01 | 0.23 | 0.29 | –0.07 | 0.73 |
| Total | 0.70 | < 0.01 | –0.10 | 0.64 | –0.13 | 0.53 |
Significant correlations (p < 0.05) are in bold italicized text.
4Discussion
This study assessed perceived daily function in WFS in order to understand which symptoms are perceived as most problematic for patients and their families. Participants with WFS and their parents reported lower daily function across most domains of the PEDSQL compared to T1DM or non-diabetic controls. Within the WFS group, poorer reported daily function was associated with worse overall symptoms severity. Within the range of WFS symptoms, the presence of sleep, temperature regulation, and urinary problems were most closely associated with poorer daily function. Surprisingly, the severity of more common symptoms of WFS (vision and hearing loss) did not predict overall quality of life. These findings provide new insight into the specific aspects of WFS that are most problematic for patients in their daily life and provide rationale for an increased emphasis on identifying, treating and understanding these less well-known symptoms of WFS.
Parents can offer an important perspective into their child’s illness with proxy reports [22, 23]. Interestingly, within the WFS, but not the T1DM or healthy control groups, parent- and self-reported PEDSQL scores were well-correlated. Within WFS, parents reported lower functioning across many domains for patients than the patients themselves, but both parents and patients reported the lowest function in the domain of Physical Health. Given that parents of WFS patients are often highly involved with many aspects of day-to-day care, it is likely that they have more insight to their child’s level of function, compared to the parents of well-controlled T1DM and HC groups. In addition, a greater range of scores was seen in the WFS group compared to control groups, providing a better statistical ability to detect correlations [24].
WFS patients have a chronic, complicated and progressive disease, yet overall have a surprisingly resilient level of function. Although in general WFS have PEDSQL scores lower than the norms for a healthy sample, they report similar or higher scores than children with chronic relatively mild health conditions such as asthma, ADHD, depression, or diabetes (Chronic Health Condition Norms, [25]). In addition, they report higher scores than children with severe muscle-related disorders [26–28], and Hunter syndrome (characterized by stunted growth, skeletal irregularities, joint stiffness, and aggressive behavior, [29]). However, our WFS sample had similar scores to children with Moyamoya disease (characterized by loss of neurological function, stroke, seizures, and headaches, [30]), children with visual impairments due to hereditary retinal disorders [31], and children with congenital cataracts [32]. Thus, although WFS does have broad effects on daily function like other neurological and visual impairments, it may not impact perceived function as much as other, equally severe conditions that greatly affect mobility.
Within WFS, overall symptom severity was associated with poorer perceived daily function. Given the variability in symptoms across patients, we also examined whether the presence or severity of specific symptoms of WFS influenced reports of daily function. We found that the two most common symptoms in WFS, diabetes and vision loss, were not related to the lower daily function reported in WFS. For example, both WFS and T1DM groups had similar and relatively high Diabetes Module scores compared to normative data [25]. However, we did find that several less well-understood symptoms in WFS, namely sleep, temperature regulation and urinary problems were associated with lower daily function. These symptoms tend to get less attention in the WFS literature and are difficult to measure and treat. Given their importance for daily function in both patients’ and parents’ views, these symptoms may require more attention in both the monitoring, symptom management and treatment development for WFS. Notably, our patients have a range of ages, disease severity, rate of progression and complexity of symptoms. It is possible that symptoms may be more or less relevant to daily function over the course of the disease. Further longitudinal investigation into the natural history of WFS in a larger sample with more severe symptoms would be warranted to better understand how the different symptoms could affect daily functionin WFS.
There are several issues that may limit the interpretation of our findings. First, this study had a small sample size; however, this is not uncommon in studies of ultra-rare diseases, particularly those that directly assess symptoms, rather than rely on surveys for symptom characterization. Second, due to relative difficulty in qualifying some less concrete symptoms (e.g. sleep problems), we used categorical measures of specific WFS-related symptoms, leaving us unable to comment on the impact of the severity of these symptoms on daily function. A larger longitudinal sample with greater variability in disease severity and more quantitative symptom assessment would be necessary to definitively determine these relationships. Further, our HC and T1DM groups’ PEDSQL scores were higher than the normative data from healthy and chronic health condition samples, respectively. Although our analyses indicate that their high SES did not play a role, other unmeasured characteristics of these groups could have inflated their PEDSQL scores and contributed to the group differences we observed. Finally, although our data revealed a clear pattern of reduced daily function in WFS and increased WFS symptom severity, we do run the risk of type 1 error in our exploratory post-hocanalyses.
To our knowledge, this is the first study to explicitly investigate the effects of specific symptoms of WFS on daily function. We found that WFS has broad negative effects on perceived daily function and that increased overall symptom severity and urinary, sleep and temperature regulation problems contribute the most to reduced daily function in WFS. These results provide insight into how we can improve the medical and psychological care of those with WFS. Understanding parent- and self-perceived daily function in WFS is critical to developing targeted treatments that address symptoms and domains of functioning that are important to patients and their families. Continued investigation of these issues in WFS at our site and across international research centers using standardized clinical assessments will allow us make stronger conclusions about daily function in WFS, ultimately promoting patient-centric care and treatment development.
Conflict of interest
The authors declare that they have no conflict of interest.
Acknowledgments
This work was supported by the NICHD (HD070855; Hershey, PI) and supported by CTSA (UL1 RR024992) and Diabetes Research Center (DK 020579), the Jack and J.T. Snow Foundation, American Diabetes Association (Permutt/Urano), the George Decker and Julio V. Santiago Pediatric Diabetes Research Fund.
We thank the Washington University Wolfram Syndrome Research Group (Appendix I) for their contributions over the years.
Appendices
Appendix I: Washington University Wolfram Syndrome Research Group
P. Austin, MD (Surgery)
B. Beato, BA (Psychiatry)
E. Bihun, MA (Psychiatry)
A. Bischoff, BA (Psychiatry)
G. Earhart, PhD (Physical Therapy)
S. Eisenstein, PhD (Psychiatry)
J. Hoekel, DO (Ophthalmology)
R. Karzon, PhD (Audiology & Comm. Sciences)
A. Licis, MD (Neurology)
H. Lugar, MA (Psychiatry)
L. Manwaring, MS (Pediatrics)
A.R. Paciorkowski, MD (Neurology, URMC)
Y. Pepino de Gruev, PhD (Medicine)
A. Permutt, MD (Medicine) (Deceased)
K. Pickett, PhD (Physical Therapy, U Wisconsin)
A. Reiersen, MD (Psychiatry)
J. Rutlin, BS (Psychiatry)
J. Shimony, MD, PhD (Radiology)
L. Tychsen, MD (Ophthalmology)
F. Urano MD, PhD (Medicine) – International Wolfram Registry Director
A. Viehoever, MD (Neurology - UCSF)
J. Wasson, MS (Medicine) (Deceased)
N. H. White MD, CDE (Pediatrics)
References
[1] | Wolfram D. , Diabetes mellitus and simple optic atrophy among siblings: Report of 4 cases, Mayo Clin Proc 9: ((1938) ), 728–733. |
[2] | Barrett T.G. , Bundey S.E. and Macleod A.F. , Neurodegeneration and diabetes: UK nationwide study of Wolfram (DIDMOAD) syndrome, Lancet 346: (8988) ((1995) ), 1458–1463. |
[3] | Pickett K.A. , Duncan R.P. , Hoekel J. , Marshall B. , Hershey T. and Earhart G.M. , Early presentation of gait impairment in Wolfram Syndrome, Orphanet J Rare Dis 7: ((2012) ), 92. doi: 1750-1172-7-92 [pii];10.1186/1750-1172-7-92 [doi]. |
[4] | Marshall B.A. , Permutt M.A. , Paciorkowski A.R. , Hoekel J. , Karzon R. and Wasson J. , et al., Phenotypic characteristics of early Wolfram syndrome, Orphanet J Rare Dis 8: ((2013) ), 64. doi: 1750-1172-8-64 [pii];10.1186/1750-1172-8-64[doi]. |
[5] | Bischoff A.N. , Reiersen A.M. , Buttlaire A. , Al-Lozi A. , Doty T. and Marshall B.A. , et al., Selective cognitive and psychiatric manifestations in Wolfram Syndrome, Orphanet J Rare Dis 10: (1) ((2015) ), 66. doi: 10.1186/s13023-015-0282-1[doi];10.1186/s13023-015-0282-1 [pii]. |
[6] | Hershey T. , Lugar H.M. , Shimony J.S. , Rutlin J. , Koller J.M. and Perantie D.C. , et al., Early brain vulnerability in Wolfram syndrome, PLoS One 7: (7) ((2012) ), e40604. doi: 10.1371/journal.pone.0040604 [doi];PONE-D-12-07466 [pii] |
[7] | Lugar H.M. , Koller J.M. , Rutlin J. , Marshall B.A. , Kanekura K. and Urano F. , et al., Neuroimaging evidence of deficient axon myelination in Wolfram syndrome, Sci Rep 6: ((2016) ), 21167. doi: 10.1038/srep21167 |
[8] | Ganie M.A. and Bhat D. , Current Developments in Wolfram Syndrome, Journal of Pediatric Endocrinology & Metabolism 22: (1) ((2009) ), 3–10. |
[9] | Urano F. , Wolfram syndrome: Diagnosis, management, and treatment, Current Diabetes Reports 16: (1), ((2016) ), 6. |
[10] | Law M. , Participation in the occupations of everyday life, American Journal of Occupational Therapy 56: (6) ((2002) ), 640–649. |
[11] | Guidance for Industry Patient-Reported Outcome Measure: Use in Medical Product Development to Support Labeling Claims ((2009) ). In C. U.S Department of Health and Human Services; Food and Drug Administration; CDER, CDRH (Ed.). Silver Spring, Maryland. |
[12] | Ribiere C. , Kabore F.A. , Chaussenot A. , Paquis-Flucklinger V. , Lenne-Aurier K. and Gaillet S. , et al., Bladder-sphincter disorders associated with the Wolfram syndrome, Progres En Urologie 23: (8) ((2013) ), 519–523. doi: 10.1016/j.purol.2013.03.020 |
[13] | Varni J.W. , Seid M. and Rode C.A. , The PedsQL: Measurement model for the pediatric quality of life inventory, Med Care 37: (2) ((1999) ), 126–139. |
[14] | Varni J.W. , Burwinkle T.M. , Jacobs J.R. , Gottschalk M. , Kaufman F. and Jones K.L. , The PedsQL in type 1 and type 2 diabetes: Reliability and validity of the pediatric quality of life inventory generic core scales and type 1 diabetes module, Diabetes Care 26: (3) ((2003) ), 631–637. |
[15] | Nguyen C. , Foster E.R. , Paciorkowski A.R. , Viehoever A. , Considine C. and Bondurant A. , et al., Reliability and validity of the Wolfram Unified Rating Scale (WURS), Orphanet J Rare Dis 7: ((2012) ), 89. doi: 1750-1172-7-89 [pii];10.1186/1750-1172-7-89 [doi]. |
[16] | Snellen H. , Probebuchstaben zur Bestimmung der Sehschärfe. Utrecht: van de Weijer PW , (1862) . |
[17] | Guidelines for manual pure-tone threshold audiometry, ASHA 20: (4) ((1978) ), 297–301. |
[18] | Doty R.L. , Bromley S.M. and Stern M.B. , Olfactory testing as an aid in the diagnosis of Parkinson’s disease: Development of optimal discrimination criteria, Neurodegeneration 4: (1) ((1995) ), 93–97. |
[19] | Harris P.A. , Taylor R. , Thielke R. , Payne J. , Gonzalez N. and Conde J.G. , Research electronic data capture (REDCap)-A metadata-driven methodology and workflow process for providing translational research informatics support, Journal of Biomedical Informatics 42: (2) ((2009) ), 377–381. doi: 10.1016/j.jbi.2008.08.010 |
[20] | SPSS, IBM SPSS Statistics for Windows. (v23). Armonk, NY: IBM Corp, (2015) . |
[21] | Barrat W. , About the Barratt Simplified Measures of Social Status (BSMSS), (2005) . |
[22] | McGee H.M. , Quality of life: Assessment issues for children with chronic illness and their families, Assessment of Quality of Life in Childhood Asthma ((1994) )83–92. |
[23] | Eiser C. and Morse R. , The measurement of quality of life in children: Past and future perspectives, Journal of Developmental and Behavioral Pediatrics 22: (4) ((2001) ), 248–256. |
[24] | Bland J.M. and Altman D.G. , Correlation in restricted ranges of data, Bmj-British Medical Journal 342: ((2011) ), d556. |
[25] | Varni J.W. , Burwinkle T.M. , Seid M. and Skarr D. , The PedsQL 4.0 as a pediatric population health measure: Feasibility, reliability, and validity, Ambul Pediatr 3: (6) ((2003) ), 329–341. |
[26] | Klug C. , Schreiber-Katz O. , Thiele S. , Schorling E. , Zowe J. and Reilich P. , et al., Disease burden of spinal muscular atrophy in Germany, Orphanet Journal of Rare Diseases 11: ((2006) ), 58. |
[27] | Eggink H. , Kuiper A. , Peall K.J. , Contarino M.F. , Bosch A.M. and Post B. , et al., Rare inborn errors of metabolism with movement disorders: A case study to evaluate the impact upon quality of life and adaptive functioning, Orphanet Journal of Rare Diseases 9: ((2014) ), 177. |
[28] | Landfeldt E. , Lindgren P. , Bell C.F. , Guglieri M. , Straub V. and Lochmuller H. , et al., Health-related quality of life in patients with Duchenne muscular dystrophy: A multinational, cross-sectional study, Dev Med Child Neurol 58: (5) ((2016) ), 508–515. doi: 10.1111/dmcn.12938 |
[29] | Needham M. , Packman W. , Quinn N. , Rappoport M. , Aoki C. and Bostrom A. , et al., Health-related quality of life in patients with MPS II, Journal of Genetic Counseling 24: (4) ((2015) ), 635–644. doi: 10.1007/s10897-014-9791-7 |
[30] | Ball A.J. , Steinberg G.K. and Elbers J. , Quality of life in pediatric moyamoya disease, Pediatric Neurology 63: ((2016) ), 60–65. doi: 10.1016/j.pediatrneurol.2016.06.012 |
[31] | Hamblion E.L. , Moore A.T. and Rahi J.S. , The health-related quality of life of children with hereditary retinal disorders and the psychosocial impact on their families, Investigative Ophthalmology & Visual Science 52: (11) ((2011) ), 7981–7986. doi: 10.1167/iovs.11-7890 |
[32] | Chak M. , Rahi J.S. and Grp B. , The health-related quality of life of children with congenital cataract: Findings of the British Congenital Cataract Study, British Journal of Ophthalmology 91: (7) ((2007) ), 922–926. doi: 10.1136/bjo.2006.109603 |

