
Effects of different degrees of insulin resistance on endothelial function in obese adults undergoing alternate day fasting
Abstract
BACKGROUND: Obesity can have deleterious effects on insulin sensitivity leading to endothelial dysfunction. Whether alternate day fasting (ADF) can ameliorate insulin sensitivity in a way that improves endothelial function remains unknown.
OBJECTIVE: This study examined the impact of ADF on endothelium dependent flow mediated dilation (FMD) in obese subjects with different degrees of insulin resistance.
METHODS: Obese non-diabetic adults (n = 54) participated in an 8-week ADF protocol (25% energy intake “fast day”, alternated with ad libitum intake “feast day”). Subjects were divided into tertiles according to degree of insulin resistance based on HOMA-IR (Homeostatic model assessment-Insulin resistance): tertile 1 (0.8–2.4), tertile 2 (2.5–3.6), tertile 3 (3.7–12.4).
RESULTS: Body weight decreased (P < 0.001) by 4% in each tertile. Fat mass, lean mass, and visceral fat mass also decreased (P < 0.001) similarly in each tertile. After 8 weeks of ADF, FMD and adiponectin differed (P < 0.05) between tertile 1 (3±0%; 26±23%) versus tertile 3 (–3±0%; –13±10%). Changes in leptin did not differ between tertiles (tertile 1: –23±7%; tertile 2: –20±7%; tertile 3: –9±7%). Fasting glucose did not change in any tertile. Fasting insulin and HOMA-IR differed (P < 0.05) between tertile 1 (10±11%; 11±11%) versus tertile 3 (–27±8%; –30±9%). Plasma lipids, blood pressure and heart rate did not change in any tertile.
CONCLUSION: Our data suggest that ADF may be effective for decreasing insulin resistance in insulin resistant subjects, but these changes have no effect on endothelial function.
1Introduction
Obesity is associated with increased production of inflammatory cytokines, which can promote the development of insulin resistance [1, 2]. Insulin resistance and compensatory hyperinsulinemia in non-diabetic, normoglycemic individuals may lead to endothelial dysfunction [3, 4]. While the underlying mechanisms are still unknown, insulin acts in the activation of the phosphatidylinositol 3-kinase pathway, which regulates nitric oxide (NO) expression in endothelial cells [5]. As such, insulin resistance can lead to the dysfunction of this pathway, which can in turn worsen endothelial function, marked by reduced vasodilation to an increased blood flow (endothelium-dependent flow-mediated dilation; FMD) [5]. It should also be noted that insulin has a simultaneous vasoconstrictive effect via MAP kinase and the production of endothelin-1 [6].
Alternate day fasting (ADF) is a novel diet therapy that has been shown to decrease body weight, insulin resistance, and increase FMD in non-diabetic obese patients [7–10]. ADF involves a “fast day” where individuals consume 25% of energy needs (approximately 500 calories), alternated with a “feast day” where subjects are permitted to consume food ad libitum. Previous reports indicate that 8–12 weeks of ADF decreases body weight by 4–7%, reduces insulin resistance by 30–40%, and increases FMD by 2–5% from baseline [7–10]. Recent findings also suggest that individuals with greater degrees of insulin resistance experience more pronounced improvements in insulin sensitivity with ADF [10]. What has yet to be determined, however, is how these improvements in insulin sensitivity by ADF impact endothelial function. Accordingly, this study tested the impact of 8 weeks of ADF on insulin resistance and endothelial function among non-diabetic obese adults with different degrees of insulin resistance.
2Methods
2.1Subject selection
As described previously [11], obese free-living adults were recruited from the Chicago area by flyers placed around the University of Illinois campus. Key inclusion criteria were as follows: male, female, obese (BMI between 30 and 39.9 kg/m2), age 25 to 65 y, non-diabetic (self-reported), no history of cardiovascular disease, non-smokers, pre-menopausal or post-menopausal, not pregnant or trying to become pregnant, not shift workers, physical activity level at < 3 h/week at 2.5 to 4.0 metabolic equivalents (METs) for 3 months prior to the study, weight stable for 3 months prior to the study (<4 kg weight loss or gain), and not taking any medications that would affect study outcomes. A total of n = 159 subjects were screened, and n = 74 subjects were enrolled in the study. The experimental protocol was approved by the Office for the Protection of Research Subjects at the University of Illinois at Chicago. All participants gave their written informed consent to participate in the trial.
2.2Diet intervention
An 8-week clinical feeding trial was employed to test the study objectives. All subjects consumed 25% of baseline energy needs on the fast day (24 h), and ate ad libitum on each alternating feast day (24 h). Baseline energy needs were calculated for each subject using the Mifflin equation [12]. Fast/feast days began at midnight each day. Fast day protocol: Subjects were provided with meals on each fast day based on a 3-day rotating menu, and all meals were prepared in the metabolic kitchen of the Human Nutrition Research Unit at the University of Illinois at Chicago. The macronutrient distribution of the provided fast day meals was as follows: ∼24% kcal as fat, ∼16% kcal as protein, and ∼60% kcal as carbohydrates [11]. Subjects were encouraged to drink plenty of water. Zero-calorie beverages, such as black coffee, tea and diet soda, were the only beverages permitted for consumption on the fast day. Participants visited the research center on a weekly basis to pick up their fast day meals for the week. Feast day protocol: On the feast days, subjects were permitted to consume food ad libitum, with no restrictions on types or quantities of foods consumed.
2.3Diet adherence, energy intake, and physical activity maintenance
Compliance with the fast day kcal goal was assessed using daily food checklists and food logs. Subjects were considered “non-adherent” to the fast day kcal goal if the log indicated that the subject ate extra food items totalling > 75 kcal/d. Subjects were considered “adherent” to the fast day kcal goal if their extra food consumption did not exceed 75 kcal/d. Adherence data was assessed each week as: % Adherence to kcal goal = (# fast days adherent / # of fast days in the week) × 100. Subjects were asked to maintain their physical activity level throughout the trial. Energy intake was assessed by a 7-d food record at baseline and post-treatment. Subjects were provided with the diaries and asked to record food items in as much detail as possible. Food records were analyzed using the food analysis program, Nutritionist Pro (version 2.1.13, Axxya Systems). To monitor alterations in activity level, subject wore a validated accelerometer [13] (Sense Wear Mini, Bodymedia, Pittsburg, PA) on their upper arm for 7 d (23 h/d) at baseline and post-treatment.
2.4Body weight and body composition
Body weight was measured using a balance beam scale (HealthOMeter, Boca Raton, FL) at the Human Nutrition Research Unit each week. Weight was measured to the nearest 0.25 kg in a hospital gown and without shoes. BMI was assessed as kg/m2. Lean mass, fat mass, and visceral fat mass were quantified by dual x-ray absorptiometry in the fasted state (DXA; iDXA, General Electric Inc) [14].
2.5Brachial artery measurements of flow mediated dilation (FMD)
Brachial artery FMD was assessed at baseline and week 8 in the fasted state. Ultrasound imaging of the brachial artery (MicroMaxx, Sonosite, Seattle, WA) was performed in a longitudinal plane at a site 1–3 cm proximal to the antecubital fossa, with the arm abducted approximately 80° from the body and the forearm supinated. All ultrasounds were performed by KKH. The ultrasound probe (11 MHz) was positioned to visualize the anterior and posterior lumen-intima interfaces to measure diameter or central flow velocity (pulsed Doppler). After recording baseline images, a blood pressure cuff on the forearm was inflated to 200 mm Hg for 5 min. To quantify FMD, 10 seconds of images were captured at a rate of 10 images/second. This was done continuously for up to 3 minutes. The peak diameter was used to calculate FMD during the 3 minute period. Images were analyzed during the first 30 seconds, during the 1st minute, during the second minute after cuff release. Images were digitally recorded using Brachial Imager (Medical Imaging, Iowa City, IA) and analyzed [15]. The investigator performing the analyses was blinded to subject treatment assignment. Percent FMD was calculated using the averaged minimum mean brachial artery diameter at baseline compared to the largest mean values obtained after release of the forearm occlusion. Blood pressure and heart rate were measured at baseline and week 8 in triplicate using a digital automatic blood pressure/heart rate monitor (Omron HEM 705 LP, Kyoto, Japan) with the subject in a seated position after a 10-min rest.
2.6Metabolic disease risk parameters
Twelve-hour fasting blood samples were collected between 6.00 am and 9.00 am at baseline and post-treatment. Subjects avoided exercise, alcohol, and coffee for 24 h before each blood sample collection. Blood was centrifuged for 10 min at 520×g at 4°C to separate plasma from red blood cells and was stored at –80°C until analyzed. Plasma total cholesterol, direct LDL cholesterol, HDL-cholesterol, and triglyceride concentrations were measured in duplicate using enzymatic kits (Biovision Inc., Moutainview, CA). Fasting glucose concentrations were quantified with a hexokinase reagent kit (Abbott, South Pasadena, CA). Fasting insulin was assessed as total immunoreactive insulin (Coat-A-Count Insulin, Los Angeles, CA). Insulin resistance (IR) was calculated using the HOMA (Homeostasis Model Assessment) method: [HOMA-IR = Fasting insulin (μlU/ml)×Fasting glucose (mg/dL) / 405]. [16] Adiponectin and leptin concentrations were quantified by ELISA (R&D Systems, Minneapolis, MN).
2.7Statistics
Subjects were divided into three groups (tertiles) based on level of insulin resistance, determined by HOMA-IR at baseline. Subjects with HOMA-IR values of 0.8–2.4 were assigned to tertile 1 (n = 18), from 2.5–3.6 to tertile 2 (n = 18), and from 3.7–12.4 to tertile 3 (n = 18). Based on the literature, subjects with HOMA-IR values > 2.73 were considered insulin resistant [17, 18]. We calculated that n = 17 subjects per group would provide 80% power to detect a significant difference of 5% in FMD change score between tertile 1 and tertile 3 at week 8, using a two-tailed independent-samples t-tests with α= 0.05.
Results are presented as means±standard error of the mean (SEM). Distributions were normal for all variables at baseline. Mixed model ANOVA with tertiles (tertile 1, 2 and 3), and time (baseline and week 8) as a within-subject factor, was used to assess the effects of degree of insulin resistance on changes in dependent variables between the tertiles over time. Where there was a significant main effect but no interaction, post hoc comparisons were performed with Bonferroni’s adjustment for multiple comparisons to determine differences between group means. ANCOVA was performed with fat mass and lean mass as covariates. P-values were considered significant at P < 0.05. Data were analyzed by SPSS software (Mac v.21, SPSS Inc., Chicago, IL).
3Results
3.1Baseline characteristics and dropouts
Of the 74 subjects who commenced the study, 54 completed the entire protocol (i.e. providedcomplete HOMA-IR and FMD measurements at week 8). Dropouts were primarily due to scheduling conflicts (n = 2), personal reasons (n = 4), dislike of the ADF diet (n = 6), and unspecified reasons (n = 8). Baseline characteristics of the subjects in each tertile of insulin resistance are displayed in Table 1. There were no differences between groups for age, sex, body weight, BMI, body composition, or brachial artery diameter at baseline. Fasting glucose, insulin, and HOMA-IR differed between groups, with tertile 3 exhibiting the highest values and tertile 1 exhibiting the lowest values for each of thesevariables.
3.2Dietary adherence, energy intake, and physical activity
Subjects were highly adherent to the ADF protocol over 8 weeks. Subjects in tertile 1, 2, and 3 met their energy goal on 92±2%, 90±3%, and 92±2% of fast days, respectively. Mean energy intake over 7-days at the beginning and end of the trial is reported in Table 2. Energy intake did not change significantly from baseline to post-treatment in any tertile. There were no differences between tertiles for percent change in energy intake from the beginning to the end of the trial. Activity level remained stable in each tertile during the trial (tertile 1 baseline: 5589±940 steps/d, week 8:6075±803 steps/d; tertile 2 baseline: 6040±635 steps/d, week 8:6496±553 steps/d; tertile 3 baseline: 6309±923 steps/d, week 8:5779±713steps/d).
3.3Body weight and body composition
Changes in body weight and body composition after 8 weeks of ADF are displayed in Table 2. Body weight decreased (P < 0.001) over time in all tertiles, but there were no differences between tertiles for changes in body weight. The range of weight loss was as follows: tertile 1 (0.2–6.6 kg), tertile 2 (0.3–9.5 kg), and tertile 3 (0.3–7.4 kg). No subjects gained weight during the trial. Fat mass, lean mass and visceral fat mass decreased (P < 0.001) over time in each tertile. There were no differences between tertiles for changes in fat mass, lean mass or visceral fat mass.
3.4Flow mediated dilation (FMD), adiponectin and leptin
Changes in FMD, adiponectin and leptin after 8 weeks of ADF are shown in Fig. 1. FMD change score in tertile 1 (3±0%) was significantly different (P < 0.05) from tertile 3 (–3±0%). Adiponectin concentrations increased (P < 0.05) from baseline to week 8 by 26±23% in tertile 1 (baseline: 4277±827 ng/ml; week 8:5420±846 ng/ml), with no change in tertile 2 (baseline: 3986±732 ng/ml; week 8:4185±740 ng/ml) or tertile 3 (baseline: 4049±518 ng/ml; week 8:3497±528 ng/ml). Adiponectin percent change in tertile 1 was significantly different (P < 0.05) from tertile 3. Leptin concentrations decreased (P < 0.05) from baseline to week 8 by 23±7% in tertile 1 (baseline: 51±6 ng/ml; week 8:39±5 ng/ml) and 20±7% in tertile 2 (baseline: 60±6 ng/ml; week 8:48±7 ng/ml), with no change in tertile 3 (baseline: 61±7 ng/ml; week 8:55±6 ng/ml). Percent change in leptin did not differ between tertiles. FMD was positively correlated to adiponectin concentrations (r = 0.29, P = 0.048). The ANCOVA analysis (with fat mass and lean mass as a covariates) revealed no significant differences between tertiles for FMD, adiponectin or leptin.
3.5Metabolic disease risk factors
Changes in metabolic disease risk factors are displayed in Table 3. Plasma lipids, blood pressure, heart rate and fasting glucose concentrations did not differ over time or between tertiles. Percent change in fasting insulin in tertile 1 was significantly different (P < 0.05) from tertile 3. HOMA-IR percent change in tertile 1 was significantly different (P < 0.05) from tertile 3. FMD was not related to fasting glucose, insulin or HOMA-IR. The ANCOVA analysis (with fat mass and lean mass as a covariates) revealed no significant differences between tertiles for any metabolic disease risk parameter.
4Discussion
Findings from this study suggest that ADF may be effective for decreasing insulin resistance in severely insulin resistant subjects, but these changes do not result in improvements in endothelialfunction.
Only a handful of previous studies have examined the relationship between insulin resistant status and endothelial function [19, 20]. In a cross-sectional study by Galvao et al. [19], obese non-diabetic subjects were divided into tertiles according to level of insulin resistance determined by HOMA-IR [19]. Results revealed a negative correlation between HOMA-IR scores and FMD [19]. Specifically, subjects in the lowest tertile of HOMA-IR (mean 0.9) exhibited the highest FMD (+18%), while subjects in the highest tertile of HOMA-IR (mean 2.1) demonstrated the lowest FMD (9%) [19]. Raitakari et al. [20] performed a 6-week study to examine the effects of weight loss on glucose-lowering and endothelial function in overweight non-diabetic adults. After 6 weeks of a very low calorie diet (550 kcal/d), subjects lost 12% of body weight, and decreased fasting glucose by 9% and insulin by 43% [20]. FMD increased from 6% to 9%, and HOMA-IR decreased from 2.7 to 1.4, from baseline to post-treatment [20]. Raitakari et al. [20] also noted a negative association between FMD and change in blood glucose concentrations when subjects were subdivided into tertiles. For instance, subjects with the greatest decrease in fasting glucose (–18%) portrayed the most pronounced increase in FMD (+5%), while subjects with minor increases in glucose (+2%) exhibited no change in FMD [20]. Thus, previous findings [19, 20] suggest that as HOMA-IR and glucose decreases, FMD tends to increase. This relationship was not observed in the present trial. In our study, the subjects who experienced the greatest decreases in HOMA-IR (tertile 3) saw a decrease in FMD after 8 weeks of ADF. However, it should be noted that subjects in tertile 3 were still insulin resistant post-treatment (HOMA-IR: 3.8). Indeed, the only group to observe increases in FMD was tertile 1, who were not insulin resistant at baseline or post-treatment. Thus, it can be speculated that FMD may only improve with weight loss when subjects achieve HOMA-IR values below the 2.73 threshold for insulin resistance [18].
Interestingly, subjects in tertile 1 demonstrated improvements in FMD despite showing no change in blood pressure over the course of the trial. Improvements in FMD are generally accompanied by decreases in blood pressure [21]. Thus, it is plausible that the increases in FMD noted in tertile 1 may have been more pronounced if this group had also experienced a reduction in blood pressure.
We also examined how changes in adiponectin were related to FMD. We show here that insulin sensitive subjects (tertile 1) experienced increases in adiponectin and FMD after 8 weeks of ADF. On the other hand, insulin-resistant subjects (tertiles 2 and 3) saw no improvement in adiponectin or FMD. Although the mechanism by which adiponectin may improve FMD remains uncertain, it is likely that modulations in NO may be involved [22, 23]. NO is released from the endothelium, and acts as a powerful vasodilator that is important in regulating vascular tone. Plasma adiponectin can stimulate the phosporylation of endothelial nitric oxide synthase (eNOS), thereby increasing NO-dependent endothelial vasodilation [22, 23]. In view of this mechanism, increased plasma adiponectin in tertile 1 may have contributed to the enhanced endothelial function noted in this group.
Leptin concentrations decreased by 23% in tertile 1 and 20% in tertile 2, with no change in tertile 3, despite similar weight loss between groups. Leptin concentrations were not significantly different between tertiles. Reductions in leptin were not related to changes in FMD in any tertile. Leptin may play a role in mediating FMD by modulating the production of NO [24]. Previous findings suggest that leptin blunts the production of NO, through the stimulation of reactive oxygen species that scavenge NO and impair eNOS function [24]. Since leptin decreased in tertile 1 and 2, it can be assumed that there would be less leptin in the circulation to inhibit NO. Consequently, this would lead to higher production of NO, resulting in enhanced endothelium-dependent vasodilation. It remains uncertain why these decreases in leptin were not related to increases in FMD in tertile 1 and 2. However, it is possible that greater decreases in leptin (>50%) may be required before improvements in FMD are noted [25].
This study has several limitations. First, this trial did not implement a no-intervention control group. Thus, it is difficult to discern whether the changes in insulin resistance or FMD were truly the result of the intervention, and not other factors. Without a control group, it is also possible that these changes in tertile 1 and 3 were due to an effect of regression to the mean. This should be considered when interpreting the present findings. Second, this study may have not been powered adequately to identify significant differences between tertiles for secondary outcome measures, such as lean mass. Third, the generalizability of our findings may be limited since our sample was composed mostly of middle-aged women. Fourth, the weight loss observed in the present study was quite modest. Fifth, the trial duration (8-weeks) was short. It is likely that longer trial durations (16–24 weeks) may have yielded greater weight loss and more pronounced improvements in HOMA-IR and FMD in each of the groups.
In summary, this study shows that ADF may be effective for reducing HOMA-IR in patients who are severely insulin resistant. These improvements in insulin sensitivity, however, may not have any impact on endothelial function. These findings should be interpreted with caution however, since this study did not include a control group, and these changes may be the result of regression toward the mean.
Funding source
Department of Kinesiology and Nutrition, University of Illinois, Chicago.
Conflict of interest
Krista Varady is the author of the book “The Every Other Day Diet” published by the Hachette Book Group. The other authors have no competing interests to disclose.
Acknowledgments
KKH designed the experiment, ran the clinical trial, analyzed the data, and wrote the manuscript. SB assisted with the conduction of the clinical trial and performed the laboratory analyses. SAP helped with the data analysis and the preparation of the manuscript. KAV assisted with the design of the experiment, data analyses and the preparation of the manuscript.
References
[1] | Abranches MV , Oliveira FC , Conceicao LL , Peluzio MD . Obesity and diabetes: The link between adipose tissue dysfunction and glucose homeostasis. Nutrition Research Reviews. (2015) ;28: :121–32. |
[2] | Erikci Ertunc M , Hotamisligil GS . Lipid signaling and lipotoxicity in metabolic inflammation: Indications for metabolic disease pathogenesis and treatment. Journal of LipidResearch. (2016) [Epub ahead of print]. |
[3] | Arcaro G , Cretti A , Balzano S , Lechi A , Muggeo M , Bonora E , Bonadonna RC . Insulin causes endothelial dysfunction in humans: Sites and mechanisms. Circulation. (2002) ;105: :576–82. |
[4] | Steinberg HO , Chaker H , Leaming R , Johnson A , Brechtel G , Baron AD . Obesity/insulin resistance is associated with endothelial dysfunction. Implications for the syndrome of insulin resistance. The Journal of Clinical Investigation. (1996) ;97: :2601–10. |
[5] | Kuboki K , Jiang ZY , Takahara N , Ha SW , Igarashi M , Yamauchi T , Feener EP , Herbert TP , Rhodes CJ , King GL . Regulation of endothelial constitutive nitric oxide synthase gene expression in endothelial cells and in vivo: A specific vascular action of insulin. Circulation. (2000) ;101: :676–81. |
[6] | Karaca U , Schram MT , Houben AJ , Muris DM , Stehouwer CD . Microvascular dysfunction as a link between obesity, insulin resistance and hypertension. Diabetes Research and Clinical Practice. (2014) ;103: :382–87. |
[7] | Klempel MC , Kroeger CM , Norkeviciute E , Goslawski M , Phillips SA , Varady KA . Benefit of a low-fat over high-fat diet on vascular health during alternate day fasting. Nutrition & Diabetes. (2013) ;3: :e71. |
[8] | Bhutani SKM , Kroeger CM , Trepanowski JF , Phillips SA NE , Varady KA . Alternate day fasting with or without exercise: Effects on endothelial function and adipokines in obese humans. E-SPEN Journal. (2013) ;2: :1–5. |
[9] | Varady KA , Bhutani S , Church EC , Klempel MC . Short-term modified alternate-day fasting: A novel dietary strategy for weight loss and cardioprotection in obese adults. The American Journal of Clinical Nutrition. (2009) ;90: :1138–43. |
[10] | Trepanowski JF KC , Barnosky A , Klempel MC , Bhutani S , Hoddy KK , Freels S , Rood J , Ravussin E , Varady KA . Alternate day fasting for weight loss, weight maintenance, and cardio-protection: A one-year randomized controlled trial. JAMA, submitted (2016) . |
[11] | Hoddy KK , Kroeger CM , Trepanowski JF , Barnosky A , Bhutani S , Varady KA . Meal timing during alternate day fasting: Impact on body weight and cardiovascular disease risk in obese adults. Obesity. (2014) ;22: :2524–31. |
[12] | Mifflin MD , St Jeor ST , Hill LA , Scott BJ , Daugherty SA , Koh YO . A new predictive equation for resting energy expenditure in healthy individuals. The American Journal of Clinical Nutrition. (1990) ;51: :241–47. |
[13] | Calabro MA , Lee JM , Saint-Maurice PF , Yoo H , Welk GJ . Validity of physical activity monitors for assessing lower intensity activity in adults. The international Journal of Behavioral Nutrition and Physical Activity. (2014) ;11: :119. |
[14] | Ergun DL , Rothney MP , Oates MK , Xia Y , Wacker WK , Binkley NC . Visceral adipose tissue quantification using Lunar Prodigy. Journal of clinical densitometry: The official journal of the International Society for Clinical Densitometry. (2013) ;16: :75–8. |
[15] | Phillips SA , Das E , Wang J , Pritchard K , Gutterman DD . Resistance and aerobic exercise protects against acute endothelial impairment induced by a single exposure to hypertension during exertion. Journal of Applied Physiology. (2011) ;110: :1013–20. |
[16] | Wallace TM , Levy JC , Matthews DR . Use and abuse of HOMA modeling. Diabetes Care. (2004) ;27: :1487–95. |
[17] | Gayoso-Diz P , Otero-Gonzalez A , Rodriguez-Alvarez MX , Gude F , Garcia F , De Francisco A , Quintela AG . Insulin resistance (HOMA-IR) cut-off values and the metabolic syndrome in a general adult population: Effect of gender and age: EPIRCE cross-sectional study. BMC Endocrine Disorders. (2013) ;13: :47. |
[18] | Sumner AE , Cowie CC . Ethnic differences in the ability of triglyceride levels to identify insulin resistance. Atherosclerosis. (2008) ;196: :696–703. |
[19] | Galvao R , Plavnik FL , Ribeiro FF , Ajzen SA , Christofalo DM , Kohlmann O Jr . Effects of different degrees of insulin sensitivity on endothelial function in obese patients. Arquivos Brasileiros De Cardiologia. (2012) ;98: :45–51. |
[20] | Raitakari M , Ilvonen T , Ahotupa M , Lehtimaki T , Harmoinen A , Suominen P , Elo J , Hartiala J , Raitakari OT . Weight reduction with very-low-caloric diet and endothelial function in overweight adults: Role of plasma glucose. Arteriosclerosis, Thrombosis, and Vascular Biology. (2004) ;24: :124–28. |
[21] | Dharmashankar K , Widlansky ME . Vascular endothelial function and hypertension: Insights and directions. Current Hypertension Reports. (2010) ;12: :448–55. |
[22] | Chen H , Montagnani M , Funahashi T , Shimomura I , Quon MJ . Adiponectin stimulates production of nitric oxide in vascular endothelial cells. The Journal of Biological Chemistry. (2003) ;278: :45021–26. |
[23] | Rojas E , Rodriguez-Molina D , Bolli P , Israili ZH , Faria J , Fidilio E , Bermudez V , Velasco M . The role of adiponectin in endothelial dysfunction and hypertension. Current Hypertension Reports. (2014) ;16: :463. |
[24] | Korda M , Kubant R , Patton S , Malinski T . Leptin-induced endothelial dysfunction in obesity. American Journal of Physiology Heart and Circulatory Physiology. (2008) ;295: :H1514–1521. |
[25] | Varady KA , Bhutani S , Klempel MC , Phillips SA . Improvements in vascular health by a low-fat diet, but not a high-fat diet, are mediated by changes in adipocyte biology. Nutrition Journal. (2011) ;10: :8. |
Figures and Tables
Fig.1
Flow mediated dilation, adiponectin, and leptin after 8 weeks of ADF by tertile of insulin resistance. Values reportedas mean±SEM. Tertile 1 (n = 18) HOMA-IR range 0.8–2.4, Tertile 2 (n = 18) HOMA-IR range 2.5–3.6, Tertile 3 (n = 18) HOMA-IR range 3.7–12.4. A. Change in FMD differed (P < 0.05) between tertile 1 and 3. B. Change in adiponectin differed (P < 0.05) between tertile 1 and 3. C. Change in leptin did not differ between tertiles.
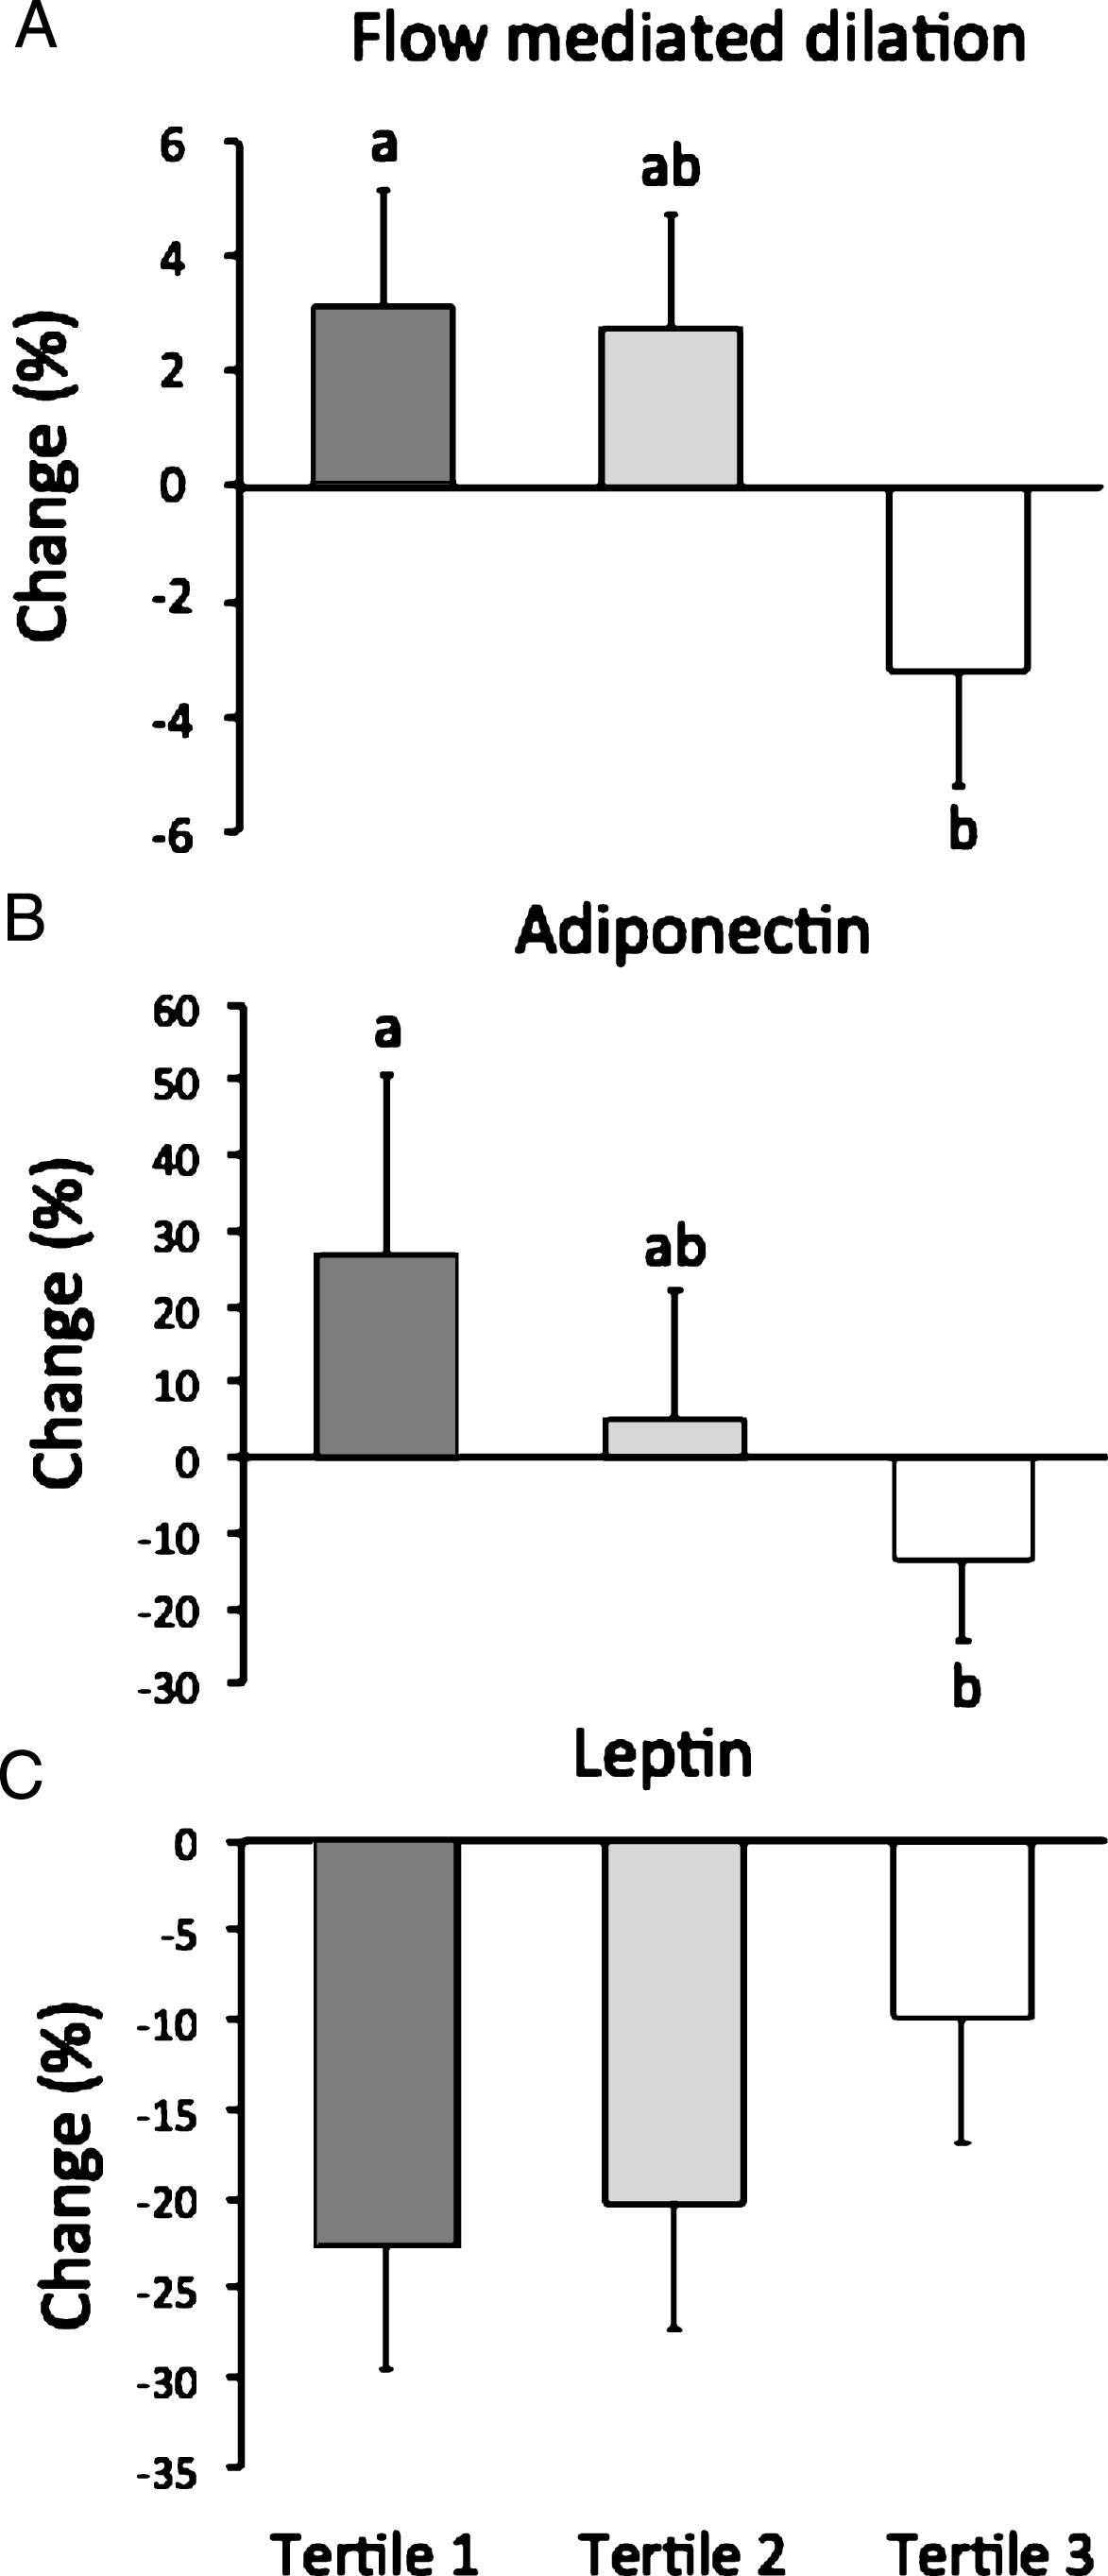
Table 1
Subject baseline characteristics by tertile of insulin resistance
| Tertile 1 | Tertile 2 | Tertile 3 | P-value | |
| n | 18 | 18 | 18 | |
| Age (y) | 47±3 | 46±2 | 47±2 | 0.88 |
| Sex (F/M) | 15/3 | 15/3 | 17/1 | 0.73 |
| Body weight (kg) | 92±3 | 94±3 | 94±2 | 0.86 |
| Height (cm) | 164±2 | 165±2 | 165±2 | 0.79 |
| Body mass index (kg/m2) | 34±1 | 34±1 | 34±1 | 0.99 |
| Lean mass (kg) | 48±2 | 49±2 | 48±2 | 0.90 |
| Fat mass (kg) | 40±2 | 42±2 | 42±2 | 0.72 |
| Visceral fat mass (kg) | 1.1±0.1 | 1.4±0.2 | 1.2±0.1 | 0.39 |
| Glucose (mg/l) | 92±1a | 101±3b | 104±3c | 0.01 |
| Insulin (uIU/ml) | 8±1a | 12±1b | 21±2c | <0.01 |
| HOMA-IR | 1.8±0.1a | 2.9±0.1b | 5.4±0.5c | <0.01 |
| Brachial artery diameter (cm) | 3.84±0.17 | 3.97±0.23 | 3.60±0.20 | 0.34 |
Values reported as mean±SEM. F: Female, M: Male. P-value between groups at baseline: One-way ANOVA. Means not sharing a common superscript letter are significantly different (Tukey post-hoc test).
Table 2
Body weight, body composition and energy intake after 8 weeks of ADF by tertile of insulin resistance
| Week 1 | Week 8 | P-tertile1 | P-time1 | P tertile | % Change | P-change2 | |
| ×time1 | |||||||
| Body weight (kg) | |||||||
| Tertile 1 | 92±3 | 88±3 | 0.86 | <0.001 | 0.99 | –4±1 | 0.79 |
| Tertile 2 | 94±3 | 90±3 | –4±1 | ||||
| Tertile 3 | 94±2 | 90±2 | –4±1 | ||||
| Fat mass (kg) | |||||||
| Tertile 1 | 40±2 | 38±2 | 0.71 | <0.001 | 0.91 | –6±1 | 0.51 |
| Tertile 2 | 42±2 | 40±2 | –6±1 | ||||
| Tertile 3 | 42±2 | 40±2 | –5±1 | ||||
| Lean mass (kg) | |||||||
| Tertile 1 | 48±2 | 47±2 | 0.98 | <0.001 | 0.45 | –2±1 | 0.46 |
| Tertile 2 | 49±2 | 47±2 | –3±1 | ||||
| Tertile 3 | 48±2 | 47±2 | –3±1 | ||||
| Visceral fat mass (kg) | |||||||
| Tertile 1 | 1.1±0.1 | 1.0±0.1 | 0.44 | <0.001 | 0.77 | –10±3 | 0.38 |
| Tertile 2 | 1.4±0.2 | 1.3±0.2 | –8±3 | ||||
| Tertile 3 | 1.2±0.1 | 1.1±0.1 | –10±2 | ||||
| Energy intake (kcal) | |||||||
| Tertile 1 | 1712±133 | 1549±106 | 0.97 | 0.17 | 0.76 | –10±9 | 0.16 |
| Tertile 2 | 1831±99 | 1712±162 | –6±8 | ||||
| Tertile 3 | 1827±111 | 1598±153 | –13±8 |
Values reported as mean±SEM. BP: Blood pressure, HOMA-IR: Homeostatic model assessment-Insulin resistance. Tertile 1 (n = 18) HOMA-IR range 0.8–2.4, Tertile 2 (n = 18) HOMA-IR range 2.5–3.6, Tertile 3 (n = 18) HOMA-IR range 3.7–12.4. 1Mixed-model ANOVA examining tertile, time, and the tertile-time interaction. 2One-way ANOVA examining differences between tertiles for percent change.
Table 3
Metabolic disease risk factors after 8 weeks of ADF by tertile of insulin resistance
| Week 1 | Week 8 | P-tertile1 | P-time1 | P tertile | % Change | P-change2 | |
| ×time1 | |||||||
| Glucose (mg/l) | |||||||
| Tertile 1 | 92±1 | 95±2 | 0.59 | 0.17 | 0.09 | 3±1 | 0.56 |
| Tertile 2 | 101±3 | 97±2 | –4±3 | ||||
| Tertile 3 | 104±3 | 99±3 | –4±2 | ||||
| Insulin (uIU/ml) | |||||||
| Tertile 1 | 8±1 | 09±1 | <0.001 | 0.01 | 0.01 | 10±11a | 0.03 |
| Tertile 2 | 12±1 | 10±1 | –8±8ab | ||||
| Tertile 3 | 21±2 | 16±2 | –27±8b | ||||
| HOMA-IR | |||||||
| Tertile 1 | 1.8±0.1 | 02.0±0.3 | <0.001 | 0.01 | 0.01 | 11±11a | 0.02 |
| Tertile 2 | 2.9±0.1 | 02.6±0.3 | .–9±10ab | ||||
| Tertile 3 | 5.4±0.5 | 03.8±0.5 | –30±9b | ||||
| Total Cholesterol (mg/dl) | |||||||
| Tertile 1 | 188±7 | 184±9 | 0.91 | 0.34 | 0.75 | –2±2 | 0.67 |
| Tertile 2 | 184±11 | 184±7 | 0±7 | ||||
| Tertile 3 | 190±10 | 187±9 | –2±1 | ||||
| LDL Cholesterol (mg/dl) | |||||||
| Tertile 1 | 111±7 | 110±9 | 0.83 | 0.84 | 0.96 | 0±4 | 0.85 |
| Tertile 2 | 114±8 | 114±8 | 0±4 | ||||
| Tertile 3 | 118±8 | 117±8 | –1±1 | ||||
| HDL Cholesterol (mg/dl) | |||||||
| Tertile 1 | 59±4 | 57±3 | 0.28 | 0.32 | 0.60 | –3±3 | 0.67 |
| Tertile 2 | 53±3 | 53±2 | 0±4 | ||||
| Tertile 3 | 53±3 | 51±3 | –3±3 | ||||
| Triglycerides (mg/dl) | |||||||
| Tertile 1 | 93±11 | 087±14 | 0.77 | 0.14 | 0.94 | –6±6 | 0.40 |
| Tertile 2 | 103±14 | 097±13 | –6±6 | ||||
| Tertile 3 | 100±8 | 97±8 | –4±5 | ||||
| Systolic BP (mm Hg) | |||||||
| Tertile 1 | 118±4 | 118±4 | 0.32 | 0.26 | 0.59 | 0±3 | 0.69 |
| Tertile 2 | 114±3 | 117±2 | 2±2 | ||||
| Tertile 3 | 118±3 | 123±4 | 4±5 | ||||
| Diastolic BP (mm Hg) | |||||||
| Tertile 1 | 78±2 | 79±2 | 0.41 | 0.27 | 0.91 | 1±3 | 0.72 |
| Tertile 2 | 79±2 | 80±2 | 2±2 | ||||
| Tertile 3 | 80±2 | 83±2 | 3±3 | ||||
| Heart rate (bpm) | |||||||
| Tertile 1 | 71±2 | 69±2 | 0.57 | 0.15 | 0.87 | –3±3 | 0.77 |
| Tertile 2 | 70±3 | 66±3 | –5±3 | ||||
| Tertile 3 | 73±2 | 70±2 | –3±3 |
Values reported as mean±SEM. BP: Blood pressure, HOMA-IR: Homeostatic model assessment-Insulin resistance. Tertile 1 (n = 18) HOMA-IR range 0.8–2.4, Tertile 2 (n = 18) HOMA-IR range 2.5–3.6, Tertile 3 (n = 18) HOMA-IR range 3.7–12.4. 1Mixed-model ANOVA examining tertile, time, and the tertile-time interaction.2One-way ANOVA examining differences between tertiles for percent change. Means not sharing a common superscript letter are significantly different (Tukey post-hoc test).

