
Long-term calorie restriction in humans is not associated with indices of delayed immunologic aging: A descriptive study
Abstract
BACKGROUND: Delayed immunologic aging is purported to be a major mechanism through which calorie restriction (CR) exerts its anti-aging effects in non-human species. However, in non-obese humans, the effect of CR on the immune system has been understudied relative to its effects on the cardiometabolic system.
OBJECTIVE: To examine whether CR is associated with delayed immunologic aging in non-obese humans.
METHODS: We tested whether long-term CR practitioners (average 10.03 years of CR) evidenced decreased expression of T cell immunosenescence markers and longer immune cell telomeres compared to gender-, race/ethnicity-, age-, and education-matched “healthy” Body Mass Index (BMI) and “overweight”/“obese” BMI groups.
RESULTS: Long-term human CR practitioners had lower BMI (p < 0.001) and fasting glucose (p < 0.001), as expected. They showed similar frequencies of pre-senescent cells (CD8+CD28– T cells and CD57 and PD-1 expressing T cells) to the comparison groups. Even after adjusting for covariates, including cytomegalovirus status, we observed shorter peripheral blood mononuclear cell telomeres in the CR group (p = 0.012) and no difference in granulocyte telomeres between groups (p = 0.42).
CONCLUSIONS: We observed no clear evidence that CR as it is currently practiced in humans delays immune aging related to telomere length or T cell immunosenescent markers
1Introduction
Many lifestyle interventions use calorie restriction (CR), defined as a reduction in caloric intake without malnutrition, as a key tool to improve health. Indeed, CR appears to beneficially affect physiology and biomarkers related to cardiometabolic health, even in non-obese populations. A prime example of the cardiometabolic benefits of CR is the Comprehensive Assessment of Long-term Effects of Reducing Intake of Energy (CALERIE) study trials, involving 25% calorie reduction over 6 months to 2 years [1–5].
CR is also well-known to extend lifespan in multiple non-human species [6, 7]. Despite the fact that delayed immune system aging is thought to be a major pathway through which this happens [8], the effects of CR on the immune system are less studied than the cardiometabolic system in non-obese humans. Our goal was to assess the immunosenescence profile of a sample of long-term calorie restrictors to test whether CR is associated with decreased immunosenescence and longer telomeres in participants without excess adiposity. Existing evidence for delayed immune system aging are predominantly in model organisms with conflicting results [9]. In the mouse model, one study observed that CR enhances adaptive immunity during a viral challenge [10], whereas other studies have found impaired immunity [11, 12]. In non-human primates, studies have found no enhancement of peripheral blood mononuclear cell (PBMC) response to stimulation in CR versus normally-fed controls [13, 14], whereas another study observed an overall markedly delayed T cell senescence [15].
As adherence to long-term CR is one of its main challenges [16], we recruited participants through two international CR organizations (CR Society International and the CR Way) who all demonstrated successful long-term CR. This sample afforded a unique opportunity to test for changes in the immune system. Much like the larger human CR literature, others using a similar approach to ours have predominantly focused on cardiometabolic health rather than immune aging [17–19]. One study [20] did examine whether long-term CR had lower levels of insulin-like growth factor 1 (IGF-1), a factor implicated in cell-mediated anti-tumor immunity [21] and many types of cancer risk [22], but found no differences compared to Western-diet controls.
In the context of a 2-year randomized controlled trial of 25% CR, the CALERIE-2 study examined multiple immune-related outcomes [3, 23, 24]. They observed lower levels of CRP and TNFα and slightly fewer white blood cells, lymphocytes, and monocytes in the CR group relative to ad-libitum eating controls, but no differences in vaccine response. As some have called into question whether a 25% CR for 2 years is sufficient to elicit processes activated in the rodent models [25], our first goal was to examine a sample averaging a longer period of restriction –10 years.
Our second goal was to augment the few prior studies of immune phenotype in non-obese human CR by expanding the scope of the immune measures [24, 26, 27]. We conducted immunophenotyping to examine percentages of naïve and senescent T cells, hypothesizing that CR would have significantly greater percentages of CD28+CD57– and CD28+CD57–PD–1– T cells compared to normal weight and overweight/obese groups. We also examined telomere length, considered to serve as a marker of cumulative biological aging [28–32], in PBMCs as well as granulocytes, and the reverse transcriptase enzyme telomerase [33] in PBMCs. To our knowledge, the study presented here is the first to examine telomere length in humans with CR, and further, to examine telomere length specifically within these two main immunologic compartments. We hypothesized that the CR group would have longer PBMC (primary outcome) and granulocyte telomere length and greater expression of telomerase.
2Materials and methods
Subject selection. The Committee on Human Research of the University of California, San Francisco (UCSF) approved all procedures and all participants provided written informed consent. CR participants were recruited from the CR Society International, followers of the CR Way, and by referral from participants. Inclusion criteria and indicators for CR were reporting calorie restriction without malnutrition for a minimum of two years, BMI <24.99, and fasting glucose <80 mg/dL. When possible, the President of the CR Way Longevity Center and Vice President for Research of the CR Society International or the Chairman of the Board of The CR Society International and Treasurer and Vice President of the CR Way Longevity Center confirmed each participant’s self-reported duration of and adherence to calorie restriction. They did so by reviewing their history of correspondence with the participants in question. Nursing staff verified BMI on-site. Calorie restriction was verified via four weekly random fasting glucose tests (<80 mg/dL) with Bayer glucometers.
Because individuals who have the ability to restrict their eating behavior for long periods may be phenotypically different from the average population, we matched the groups on self-reported age, race/ethnicity, gender, and educational attainment. Matched participants were recruited from the local area once the CR group was completed and their information on these matching variables obtained. Additionally, we recruited siblings of CR participants to attempt to control for genetic and environmental factors. Sample size was dictated by the maximum number of participants we were able to recruit in a predetermined data collection period of one year.
Procedures. To avoid potential confounding effects of physical activity and nutritional supplements, all participants went through a four-week washout period leading up to the on-site visit. During the washout period, we asked participants to refrain from vigorous exercise and from taking any supplements not prescribed by a physician. All participants were non-smokers, and all were not pregnant.
Participants traveled to the UCSF Clinical and Translational Science Institute Clinical Research Center (CCRC). To minimize confounds due to sleeping in an unfamiliar setting, participants spent two acclimation nights in the CCRC before the blood draw. To minimize confounds due to jetlag and diurnal activity patterns, participants woke up, ate meals, and slept according to their usual schedules in their home time zone. A subset (n = 26) of local participants (n = 38) completed the study on an outpatient basis. The CCRC metabolic kitchen served tailored calorie-restricted meals to the calorie restriction group. The comparison groups received standard meals.
Venous blood was collected immediately upon waking, after participants had fasted for a minimum of 8 hours. PBMCs were isolated by gradient density centrifugation by use of Ficoll-Paque (GE Healthcare, Piscataway, NJ, USA). Granulocytes were isolated from the red blood cell pellets after Ficoll separation by Ammonium-Chloride-Potassium solution. Genomic DNA was isolated from whole blood, PBMC and granulocytes using QIAamp DNA mini kit (QIAGEN).
Immunophenotyping was performed on cryopreserved PBMCs. The cells were plated in a 96-well v-bottom plate and stained with the following fluorescently-conjugated monoclonal antibodies from BD Biosciences unless otherwise noted: Brilliant Violet 605-conjugated anti-CD8 (SK1) and Brilliant Violet 711-conjugated anti-CD3 (UCHT1), Allophycocyanin (APC)-eFluor780-conjugated anti-CD28 (CD28.2) (eBioscience), Alexa Fluor® 647-conjugated anti-CD57 (HCD57), PE-conjugated anti-CD38 (HB7), Brilliant Violet 421-conjugated anti-PD-1 (EH12.1) and FITC-conjugated anti-HLA-DR (L243). LIVE/DEAD® Fixable Aqua Dead Cell Stain Kit (Invitrogen) was added into all stains to exclude non-viable cells. Staining was performed at 4°C for 30 minutes, then washed once with FACS buffer (Phosphate-buffered saline containing 0.5% bovine serum albumin and 1 mM Ethylenediaminetetraacetic Acid). Cells were then fixed in 0.5% formaldehyde and data was acquired on a BD LSR II Flow cytometer (BD Biosciences), with ≥200,000 lymphocytes collected for each sample. CPT beads (BD Bioscience) were used for instrument set up for each run and Rainbow beads (Spherotec) standardized instrument settings between runs. Aliquots of a control specimen were thawed with every run and assessed in triplicate to confirm run-to-run reproducibility. Fluorescence Minus One (FMO) controls were also prepared on control samples for each run, to check that gates were set consistently between runs. Data was compensated and analyzed in FlowJo V9 (TreeStar). CD3+CD8+ T cells were defined after standard lymphocyte, singlet and dead cell exclusion gates were applied to the data. FMO controls were used to define positive gates for expression of CD28, CD38, CD57, HLA-DR and PD-1 on CD3+CD8+ T cell populations.
The telomere length measurement assay was adapted from the published original method by Cawthon and colleagues [27, 34]. Tubes containing 26, 8.75, 2.9, 0.97, 0.324 and 0.108 ng of a reference DNA (from Hela cancer cells) were included in each PCR run so that the quantity of targeted templates in each research sample could be determined relative to the reference DNA sample by the standard curve method. The same reference DNA was used for all PCR runs.
Telomerase activity was measured in PBMCs by the Telomerase Repeat Amplification Protocol (TRAP) with a commercial assay (TRAPeze, Telomerase Detection Kit, Upstate/CHEMICON, Temecula, CA) using procedures described previously [35]. Two concentrations corresponding to 5,000 and 10,000 cells were assayed for each sample in order to ensure that the assay was in linear range. The assay reaction was performed in accordance with the TRAPeze kit manufacturer’s instructions, and radioactive products fractionated by 8% polyacrylamide–8 M urea sequencing gel electrophoresis. Telomerase activity is expressed as the equivalent of number of 293T cells per 10,000 PBMCs, and activity was quantified using the ImageQuant 5.2 software (GE Healthcare) as described previously [35]. Telomerase values were non-normally distributed and corrected via a natural log transformation.
Fasting serum samples were assayed by ELISA for qualitative detection of cytomegalovirus (CMV) IgG antibodies by the University of California, Los Angeles, Clinical Immunology Research Laboratories.
Analyses. The key outcome measure was PBMC telomere length. Statistical analyses consisted of ANCOVA models comparing the three groups (CR vs. normal weight vs. overweight/obese) all controlling for chronological age, and additionally covarying potential confounding variables when they were statistically significantly related to each respective outcome measure. These potential covariates consisted of self-reported gender and race/ethnicity, as well as CMV serological status due to its known effects on immunosenescence [36].
3Results
Descriptive statistics of key study variables are summarized in Table 1. For the overall sample of 71 participants, the mean age was 55.01 years (SD = 14.53, range = 21–84), 54 were male, race/ethnicity was 88.6% white and 11.4% East Asian/Asian-American, and highest level of educational attainment was as follows: 6.7% high school, 6.7% some college, 20% bachelor’s degree, 20% master’s degree, and 46.7% doctoral degree. The CR group (n = 30) had been restricting their caloric intake without malnutrition for an average of 10.03 years (SD = 6.84, range = 3–33). By design, the CR group had lower BMI than both the normal weight (n = 16; 5 siblings of CR participants) and overweight/obese (n = 25; 8 obese; 1 sibling of CR participant) groups, F(2, 68) = 106.62, p < 0.001. As expected, the CR group had lower average fasting glucose levels F(2, 61) = 11.58, p < 0.001. Forty-seven percent of the sample was CMV seropositive with no significant differences between groups, F(2, 66) = 0.08,p = 0.92.
Table 1
Descriptive statistics of study variables
| Calorie Restriction | Normal Weight | Overweight/Obese | |
| (N = 30) | (N = 16; 5 CR siblings) | (N = 25; 1 CR sibling) | |
| Age | 54.64 (15.38) [25–84] | 49.33 (12.49) [21–67] | 58.84 (13.98) [23–80] |
| Sex | |||
| Male | 22 (75.9%) | 10 (66.7%) | 22 (88.0%) |
| Female | 7 (24.1%) | 5 (33.3%) | 3 (12.0%) |
| Ethnicity/Race | |||
| White | 26 (89.7%) | 13 (86.7%) | 24 (96.0%) |
| Asian | 3 (10.3%) | 2 (13.3%) | 1 (4.0%) |
| Highest degree | |||
| High school | 2 (6.9%) | 0 (0%) | 1 (5.3%) |
| Some college | 2 (6.9%) | 1 (7.1%) | 3 (15.8%) |
| Bachelor’s | 5 (17.2%) | 6 (40.0%) | 2 (10.5%) |
| Master’s | 6 (20.7%) | 5 (33.3%) | 2 (10.5%) |
| Doctoral | 14 (48.3%) | 2 (13.3%) | 11 (44%) |
| Body Mass Index | 19.07 (1.84) [15.37–22.55]a | 23.27 (1.78) [18.87–24.96]b | 29.03 (3.38) [25.10–35.92]c |
| Fasting glucose (mg/dL) | 79.69 (9.32) [64–110]a | 90.21 (10.18) [74–110]b | 94.97 (13.36) [73–130]b |
| Years of CR | 10.03 (6.84) [3–33] | ||
| CMV seropositive | 13 (46.4%) | 7 (50%) | 13 (52%) |
| Telomere T/S ratio | |||
| PBMC | 0.96 (0.18) [0.65–1.39]a | 1.06 (0.15) [0.78–1.31] | 1.06 (0.23) [0.66–1.50]b |
| Granulocyte | 1.22 (0.21) [.087–1.83] | 1.20 (0.23) [0.89–1.66] | 1.14 (0.22) [0.85–1.75] |
| Telomerase1 | 5.15 (7.60) [2.00–30.27] | 4.00 (2.66) [0.70–10.58] | 5.49 (5.44) [1.21–33.69] |
Note: Mean (Standard Deviation) [Minimum-Maximum] except for Sex, Ethnicity/Race, Education, and CMV status, where N (%). Differing superscripts refer to statistically significant differences between groups with p < 0.05, two-tailed. 1Telomerase was non-normally distributed and therefore values reflect Median (Interquartile Range)[Minimum-Maximum]. Telomere and telomerase analyses control for chronological age.
For all measures of immune activation and immunosenescence in CD4+ T cells, no statistically significant differences were observed between the three groups (data not shown). Table 2 displays results for CD8+ T cells, where a statistically significant group difference emerged in activated CD8+ T cells defined as CD38+HLA-DR+ cells, F(2, 64) = 3.28, p = 0.045, wherein the overweight/obese group had a lower percentage of activated CD8+ T cells than both the CR and normal weight groups. Additionally, the normal weight group had a higher percentage of CD8+CD28– (i.e. memory) T cells than the overweight/obese group, F(2, 64) = 3.16, p = 0.045.
Table 2
Group differences in frequencies of CD8+ T cell activation and maturation phenotypes
| Phenotype | Calorie Restriction | Normal BMI | Overweight/Obese BMI | F | p | Covariates |
| 8+28– | 44.66 (19.45) [14.50–77.10] | 45.87 (10.23) [30.80–62.80]a | 40.60 (16.91) [17.90–76.30]b | 3.16 | 0.049 | age CMV |
| 8+38+ | 47.75 (12.48) [22.40–72.10] | 46.99 (16.41) [24.70–73.30] | 42.91 (13.62) [20.80–73.20] | 0.54 | 0.587 | age |
| 8+57+ | 29.32 (17.98) [3.75–61.00] | 25.25 (12.83) [1.54–45.00] | 24.59 (15.66) [5.55–69.60] | 2.45 | 0.095 | age CMV |
| 8+DR+ | 22.01 (17.61) [4.94–77.60] | 24.48 (14.59) [2.79–52.80] | 18.92 (8.51) [3.18–41.80] | 2.16 | 0.124 | age ethnicity CMV |
| 8+PD1+ | 33.06 (13.01) [12.60–62.20] | 27.08 (11.62) [8.66–49.50] | 32.35 (11.40) [17.20–51.10] | 0.85 | 0.431 | age CMV |
| 8+38+DR+ | 11.09 (8.75) [2.38–42.10]a | 11.34 (6.24) [1.73–25.00]a | 7.86 (4.11) [1.07–16.30]b | 3.28 | 0.045 | age ethnicity CMV |
| 8+28+57–* | 28.21 (17.76) [2.98–59.50] | 24.60 (12.62) [1.27–43.10] | 23.57 (15.19) [5.15–66.40] | 2.48 | 0.092 | age CMV |
| 8+28+57–PD1–* | 34.93 (15.42) [11.80–62.80] | 37.76 (13.04) [20.50–62.40] | 38.92 (13.26) [13.10–61.20] | 2.36 | 0.103 | age CMV |
| 8+28–57+PD1+38+DR+ | 20.70 (15.16) [2.97–60.20] | 22.77 (13.93) [6.72–49.10] | 15.14 (10.17) [2.37–49.50] | 1.91 | 0.157 | age CMV |
| 8+28–57+PD1+DR+ | 35.03 (22.86) [5.45–93.90] | 40.29 (19.64) [10.20–67.30] | 29.77 (17.64) [6.20–75.50] | 1.26 | 0.29 | age ethnicity CMV |
| 8+28-57–PD1+DR+ | 34.69 (21.75) [7.51–89.40] | 42.62 (20.84) [9.00–76.60] | 32.77 (15.14) [7.42–68.40] | 1.54 | 0.223 | age ethnicity CMV |
| 8+28–57+PD1-DR+ | 35.86 (22.17) [3.30–94.10] | 42.30 (20.65) [8.16–75.50] | 28.99 (15.54) [4.70–71.10] | 1.98 | 0.148 | age ethnicity |
Note: Mean (Standard Deviation) [Minimum-Maximum]. Differing superscripts refer to statistically significant differences between groups with p < 0.05, two-tailed. The F value represents the omnibus test of group differences. All covariates other than age are significantly related to the dependent variable at p < 0.05. *We hypothesized greater percentages of these phenotypes in the CR group.
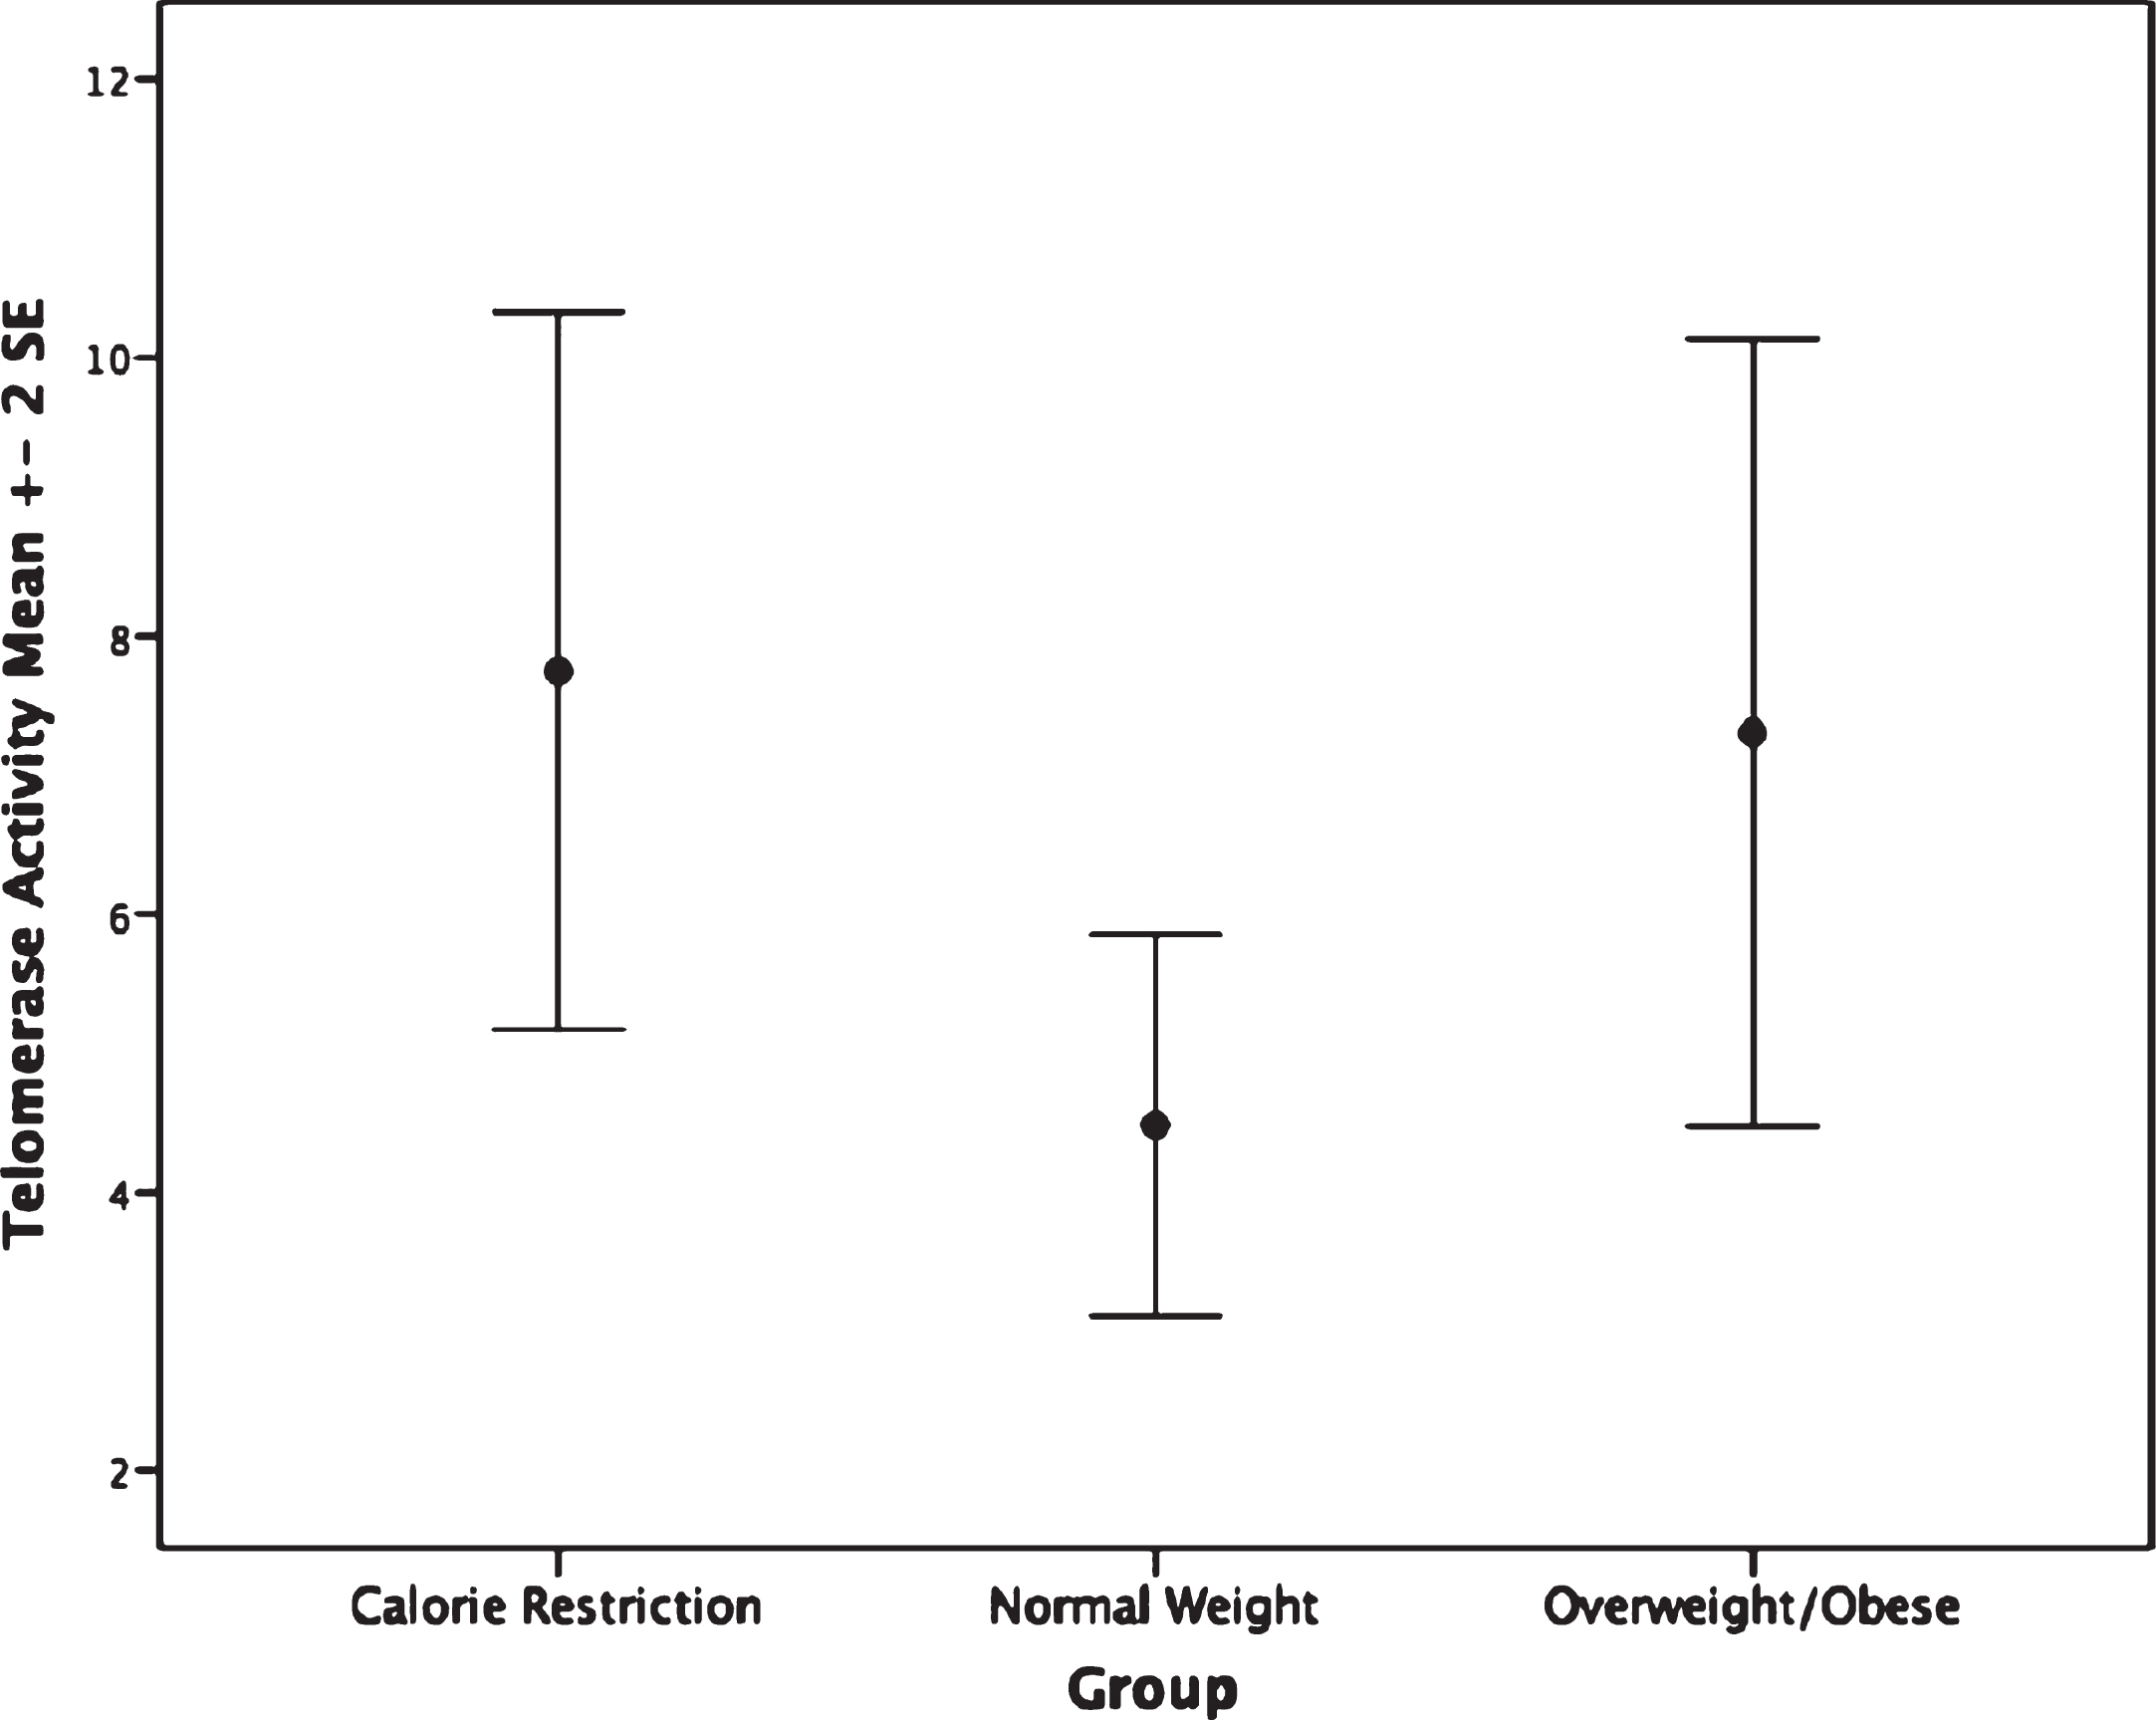
The CR group had shorter PBMC telomere length (F(2,62) = 4.75, p = 0.012) than the overweight/obese group (mean difference: –0.14, p = 0.009, or 233.32 base pairs; Fig. 1). Furthermore, no significant difference in granulocyte telomere length (F(2,54) = 0.89, p = 0.42) was observed between the CR and the normal weight or overweight/obese groups (Fig. 1). No statistically significant differences in telomerase activity, F(2,65) = 1.48, p = 0.236 were observed within PBMC or granulocytes between CR and normal weight and overweight/obese persons(Fig. 2).
Fig.1
Telomere length by group. Top: Peripheral blood mononuclear cell telomere length. ANCOVA analyses indicate the calorie restriction group has significantly shorter telomere length compared to the other groups; p = 0.012. Bottom: Granulocyte telomere length by group. Groups are not significantly different; p = 0.43.
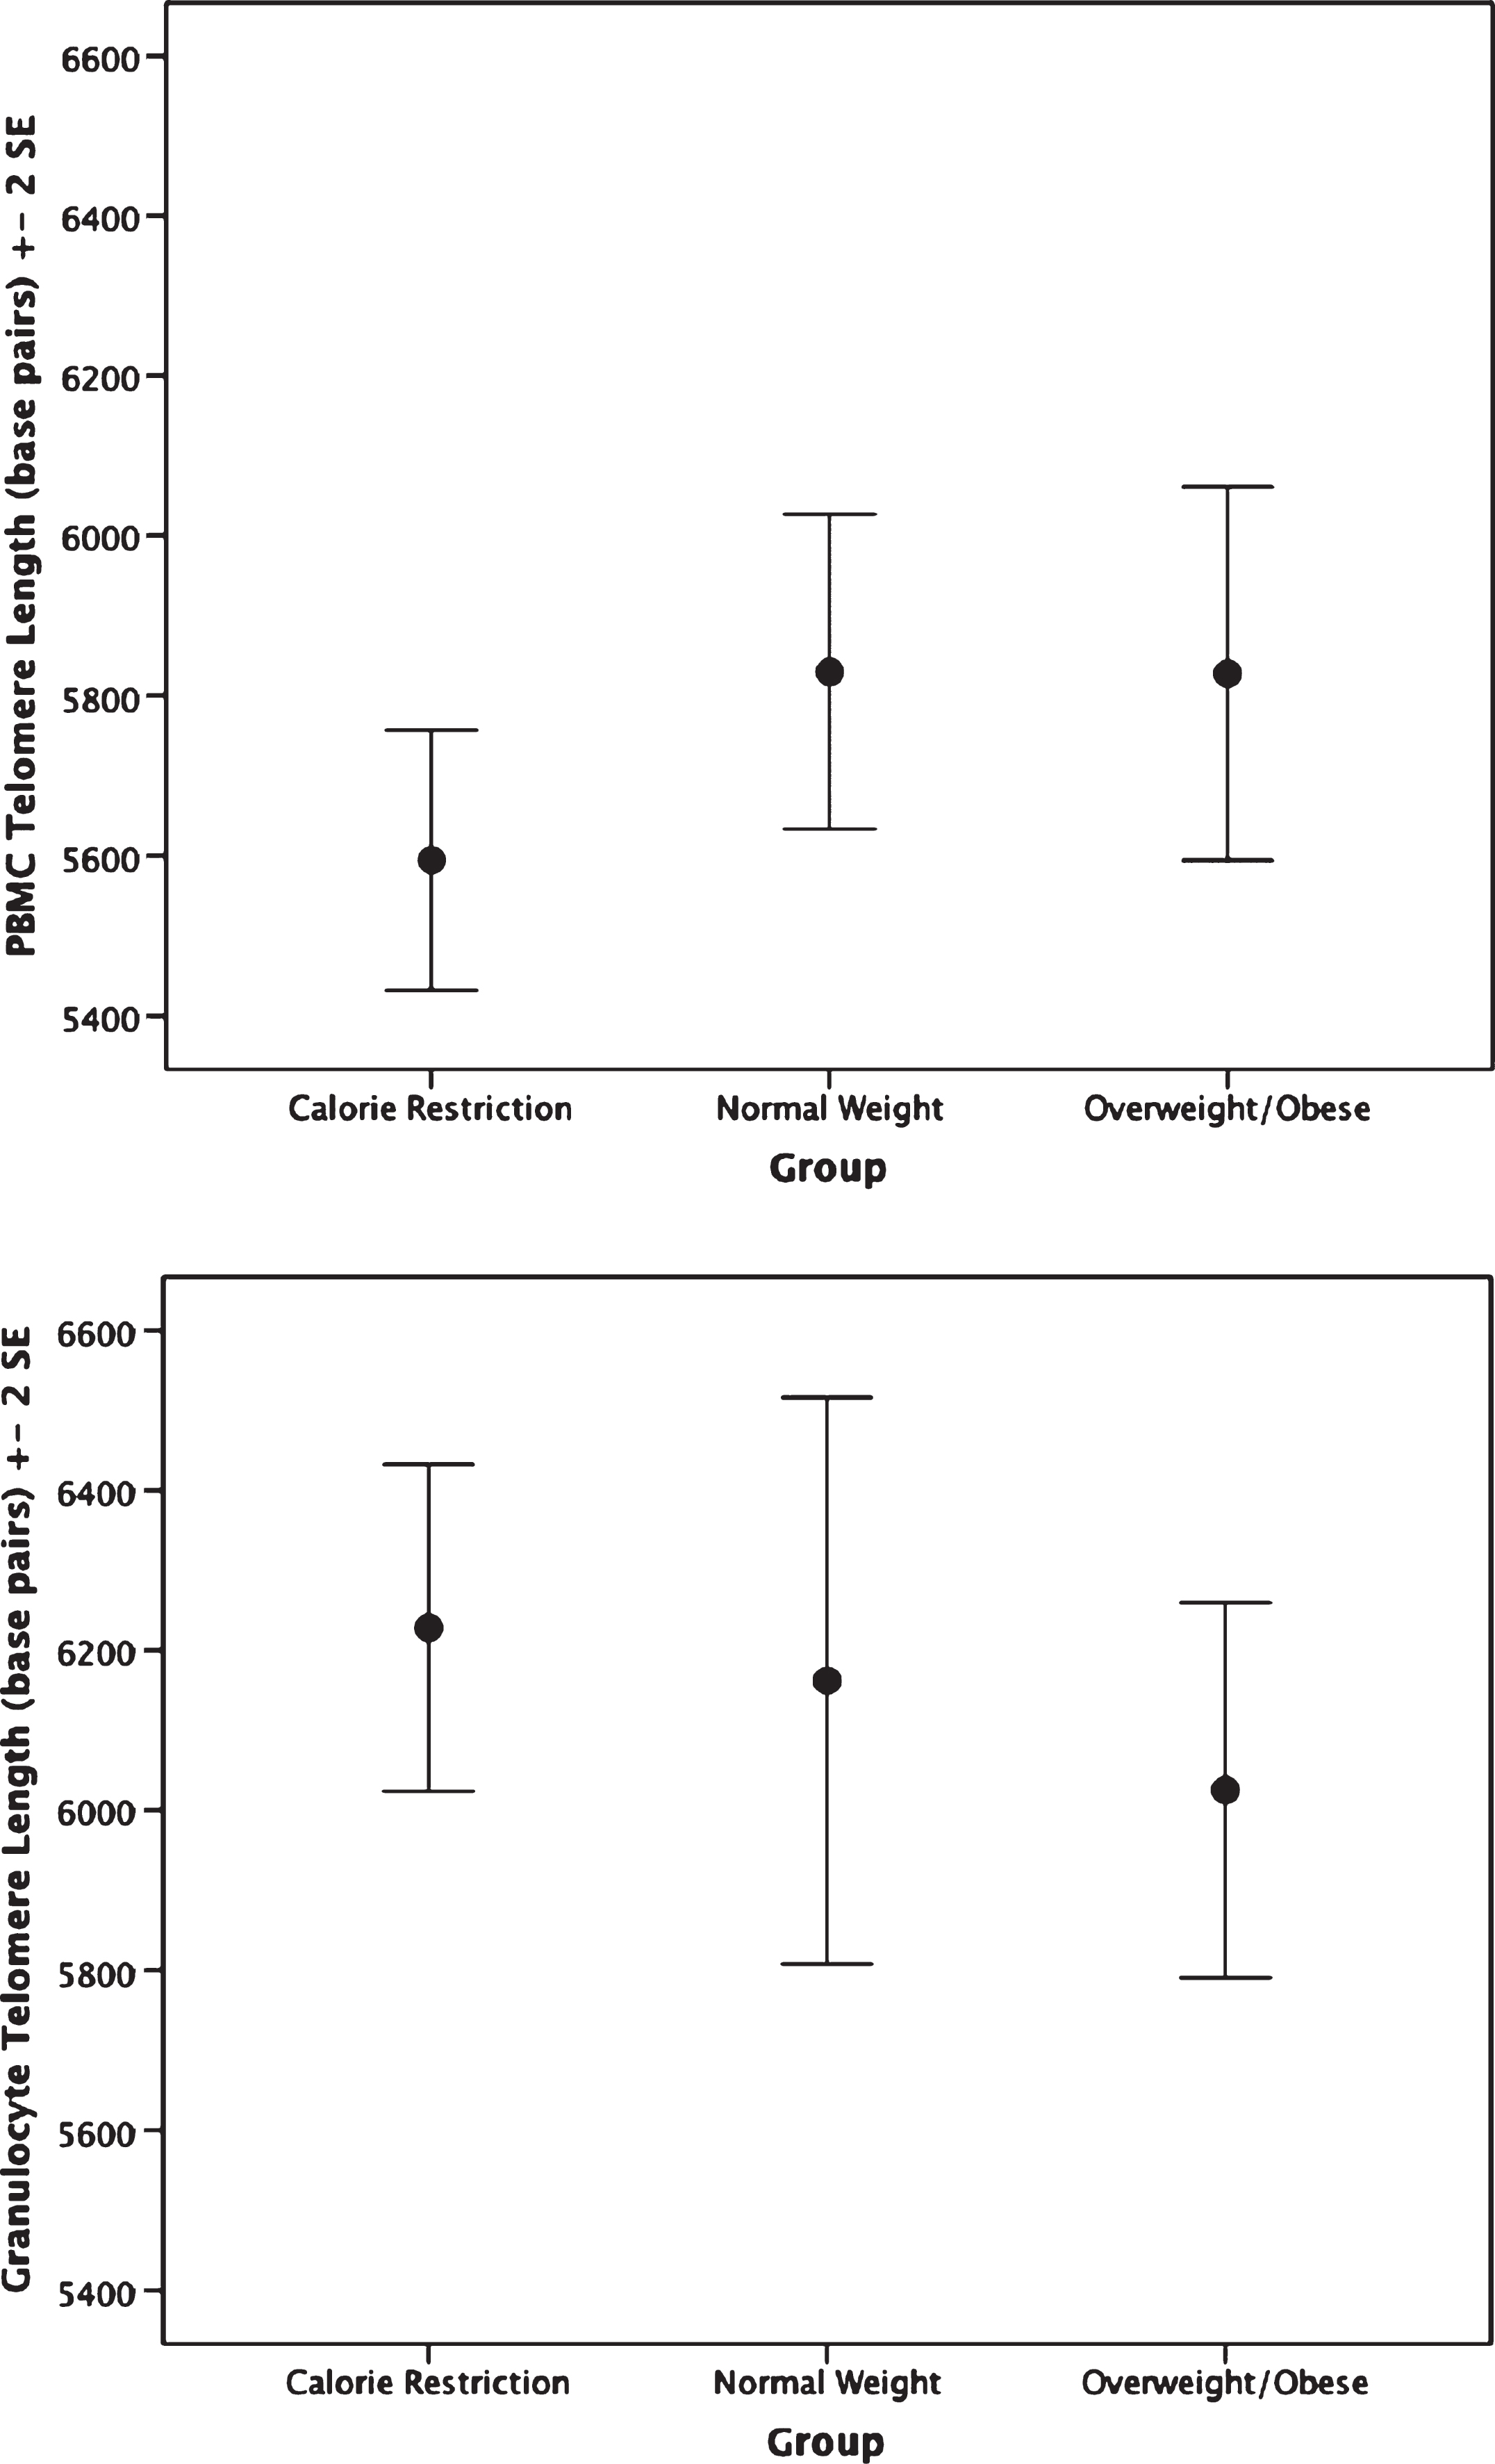
Fig.2
Telomerase activity by group. Groups are not significantly different, p = 0.23.
4Discussion
In the largest study to date of long-term human calorie restrictors averaging over a decade of calorie restriction, we set out to examine whether CR is associated with enhanced immunosenescent and cellular aging profiles of T cells. Although research has observed beneficial effects of CR on the cardiometabolic system in non-obese populations [4, 5], or beneficial effects of CR on cancer risk in populations with excessive weight [37], we did not observe these benefits in this context. As delayed immunologic aging is purported to be a main mechanism of CR’s lifespan-extending effects, we expected to see a strong and consistent pattern of lower senescent and higher naïve cell percentages as well as longer telomere length in the CR group compared to the normal weight and overweight/obese groups. In contrast, we observed very few differences between the three groups in markers of immunosenescence, and the CR group had shorter PBMC telomere length than the comparison groups. In fact, the telomere length in the CR group was significantly shorter when compared to the obese group.
It is unclear why we observed differences in PBMCs and not granulocytes, but it is important to examine them separately as PBMC and granulocyte populations have different roles in immune function, and reflect different immune responses. PBMC telomere length is affected by both history of infections (which cause more replicative turnover) as well as the biochemical environment of the blood [38]. Due to their rapid turnover, granulocyte telomere length is thought to more directly represent the common myeloid progenitor stem cell compartment,[38, 39]. Thus, it is possible that the short lived granulocytes may have less variance in turnover, between people, and may be less influenced by environmental exposures, like dietary factors, in the blood. PBMC telomere length may be more influenced by biochemical and lifestyle factors.
We do not know why CR was associated with shorter PBMC telomere length, but we can offer speculation. Given the pattern of findings here, one possibility is that the CR diet as practiced left those individuals more vulnerable to infection, despite that CMV seropositive status was no different between the groups. CMV exposure typically occurs during early childhood, such as during daycare [40], and therefore was likely acquired before CR started. However, there could be differences in how well people are suppressing reactivation of the CMV virus, which we did not measure and would require CMV viral load analyses as well as specific immune responses such as IgG concentrations or CMV-specific T cell responses.
There may be differences in the immune cell populations that require greater subset measurement to observe than we undertook here. T cells make up 60% of the PBMCs [41], and so differences in T cell telomere length could have a large influence on PBMC telomere length. The difference in PBMC telomere length could potentially be due to a skewing in major memory T cell subsets (i.e. effector vs central memory) in the CR group due either to increased subclinical infections in this group or how their immune system maintains latent viral infections such as herpes viruses (e.g. CMV, Epstein Barr Virus). This however would have required more complex phenotyping to detect.
These overall null findings add to a sparse, but already mixed, literature in animal and non-human primate species. In mice, CR led to fewer senescent intestinal crypt enterocytes and liver hepatocytes and better telomere maintenance in these cells [42]. However, in primates, CR did not lead to changes in telomere length in leukocytes or other tissues [43].
In the context of mixed evidence of the relationship between CR and immune aging in model organisms such as mice and macaques, it perhaps is not surprising that such a relationship would be difficult to observe in human CR. Compared to model organisms, humans eat an extremely variable diet. This means human CR can be practiced in infinitely variable ways with similarly low caloric intake but different macro and micronutrient content, eating patterns, and consistency. Most humans find it difficult to adhere to intense long-term CR [6, 7, 16], and indeed, our research has demonstrated that this group of long-term CR practitioners have a distinct psychosocial profile that suggests a predisposition to the ability to sustain long-term CR [44]. Moreover, CR can put individuals at risk for malnutrition [6, 16], calling into question whether CR should be pursued as an intervention for immune system aging for non-obese humans. However, our results should be interpreted with caution in light of conflicting findings from Meydani and colleagues, who found beneficial effects on circulating inflammatory markers in the context of a randomized trial of CR [24].
This study had the following limitations: Although this is the largest study of long-term CR practitioners, and they had been calorically restricting on average over a decade, it is possible that the effect of CR on immune system aging is too small to be detected by this sample size. Our primary analysis had an observed power value of 0.77, but nonetheless our study is not ideally powered. Furthermore, only T cell maturation and activation profiles were assessed, so it remains unknown whether CR practitioners exhibit differences in other immune cell subsets (e.g. B cells, monocytes or NK cells) or in the ability of innate and adaptive immune cells to respond to appropriate stimuli by cytokine production or proliferation. However, one strength of this study is that we examined PBMC and granulocyte telomere length separately, which allays concerns that our telomere length variable was an artifact of cell distribution. We also examined CMV status, to rule out the confounding effect of CMV infection on immunosenescence and telomere length. To our knowledge, this is the first study to examine human CR in relation to PBMC and granulocyte telomere length.
Instead of a strong pattern indicating beneficial effects of human CR on T cell immune activation and immunosenescence, we observed no clear evidence that CR may delay immune aging compared to normal BMI and overweight/obese matched individuals. In fact, the few results emerging from our study suggested potentially negative effects of CR, particularly in the context of PBMC telomere length. Delayed immune aging, therefore, must be further studied before it is put forth as a major mechanism of CR’s lifespan-extending effects, at least as it is most faithfully practiced in non-obese humans.
Acknowledgments
Funding for this project was provided to AJT by the Robert Wood Johnson Foundation Health and Society Scholars Program, the Appleby Foundation, the RWJF/UCSF Health Disparities Working Group, and the UC Berkeley Population Center. The flow cytometry was made possible with help from the University of California San Francisco-Gladstone Institute of Virology & Immunology Center for AIDS Research (CFAR), an NIH-funded program (P30 AI027763). This project was also supported by the National Center for Research Resources and the National Center for Advancing Translational Sciences, National Institutes of Health, through UCSF-CTSI Grant Number UL1 RR024131. The contents of this paper are solely the responsibility of the authors and do not necessarily represent the official views of theNIH. The authors gratefully acknowledge invaluable support from Paul McGlothin, President of The CR Way Longevity Center and Vice President for Research of the CR Society Intl. and Meredith Averill, Chairman of the Board of The CR Society Intl. and Treasurer and V.P. of The CR Way Longevity Center. We also gratefully acknowledge the guidance of Elizabeth Blackburn, Cynthia Kenyon, and Anne Brunet. Finally, we are extremely grateful for the participants for providing their time, energy, and dedication to the study.
References
[1] | Rickman AD , Williamson DA , Martin CK , Gilhooly CH , Stein RI , Bales CW , Roberts S , Das SK . The CALERIE Study: Design and methods of an innovative 25% caloric restriction intervention. Contemp Clin Trials. (2011) ;32: (6):874–81. |
[2] | Redman LM , Heilbronn LK , Martin CK , Alfonso A , Smith SR , Ravussin E , Pennington CALERIE Team. Effect of calorie restriction with or without exercise on body composition and fat distribution. J Clin Endocrinol Metab [Internet]. (2007) ;92: (3):865–72. Available from: http://www.ncbi.nlm.nih.gov/pubmed/17200169%5Cnhttp://www.pubmedcentral.nih.gov/articlerender.fcgi?artid=PMC2692618 |
[3] | Ravussin E , Redman LM , Rochon J , Das SK , Fontana L , Kraus WE , Romashkan S , Williamson DA , Meydani SN , Villareal DT , Smith SR , Stein RI , Scott TM , Stewart TM , Saltzman E , Klein S , Bhapkar M , Martin CK , Gilhooly CH , Holloszy JO , Hadley EC , Roberts SB . A 2-year randomized controlled trial of human caloric restriction: Feasibility and effects on predictors of health span and longevity. J Gerontol A Biol Sci Med Sci [Internet]. Oxford University Press; (2015) [cited 2016 Sep 26];70: (9):1097–104. Available from: http://www.ncbi.nlm.nih.gov/pubmed/26187233 |
[4] | Fontana L , Villareal DT , Weiss EP , Racette SB , Steger-May K , Klein S , Holloszy JO . Calorie restriction or exercise: Effects on coronary heart disease risk factors. A randomized, controlled trial. Am J Physiol Endocrinol Metab [Internet]. (2007) ;293: (1):E197–202. Available from: http://www.ncbi.nlm.nih.gov/entrez/query.fcgi?cmd=Retrieve&db=PubMed&dopt=Citation&list_uids=17389710 |
[5] | Lefevre M , Redman LM , Heilbronn LK , Smith JV , Martin CK , Rood JC , Greenway FL , Williamson DA , Smith SR , Ravussin E . Caloric restriction alone and with exercise improves CVD risk in healthy non-obese individuals. Atherosclerosis. (2009) ;203: (1):206–13. |
[6] | Fontana L , Partridge L , Longo VD . Extending healthy life span–from yeast to humans. Science (80-). 2010/04/17. (2010) ;328: (5976):321–6. |
[7] | Most J , Tosti V , Redman LM , Fontana L . Calorie restriction in humans: An update. Ageing Res Rev. (2016) . |
[8] | Yu BP . Aging and oxidative stress: Modulation by dietary restriction. Free Radical Biology and Medicine. (1996) . pp. 651–68. |
[9] | Ritz BW , Gardner EM . Malnutrition and energy restriction differentially affect viral immunity. J Nutr. (2006) ;136: (5):1141–4. |
[10] | Effros RB , Walford RL , Weindruch R , Mitcheltree C . Influences of dietary restriction on immunity to influenza in aged mice. J Gerontol [Internet]. (1991) ;46: (4):B142–7. Available from: http://www.ncbi.nlm.nih.gov/pubmed/2071828 |
[11] | Goldberg EL , Romero-Aleshire MJ , Renkema KR , Ventevogel MS , Chew WM , Uhrlaub JL , Smithey MJ , Limesand KH , Sempowski GD , Brooks HL , Nikolich-Žugich J . Lifespan-extending caloric restriction or mTOR inhibition impair adaptive immunity of old mice by distinct mechanisms. Aging Cell. (2015) ;14: (1):130–8. |
[12] | Gardner EM . Caloric restriction decreases survival of aged mice in response to primary influenza infection. J Gerontol A Biol Sci Med Sci. (2005) ;60: (6):688–94. |
[13] | Roecker EB , Kemnitz JW , Ershler WB , Weindruch R . Reduced immune responses in rhesus monkeys subjected to dietary restriction. J Gerontol A Biol Sci Med Sci [Internet]. (1996) ;51: (4):B276–9. Available from: http://www.ncbi.nlm.nih.gov/pubmed/8680992 |
[14] | Weindruch R , Lane MA , Ingram DK , Ershler WB , Roth GS . Dietary restriction in rhesus monkeys: Lymphopenia and reduced mitogen-induced proliferation in peripheral blood mononuclear cells. Aging (Milano) [Internet]. (1997) ;9: (4):304–8. Available from: http://www.ncbi.nlm.nih.gov/entrez/query.fcgi?cmd=Retrieve&db=PubMed&dopt=Citation&list_uids=9359942 |
[15] | Messaoudi I , Warner J , Fischer M , Park B , Hill B , Mattison J , Lane MA , Roth GS , Ingram DK , Picker LJ , Douek DC , Mori M , Nikolich-Zugich J . Delay of T cell senescence by caloric restriction in aged long-lived nonhuman primates. Proc Natl Acad Sci U S A [Internet]. (2006) ;103: (51):8–53. Available from: http://www.pubmedcentral.nih.gov/articlerender.fcgi?artid=1748246&tool=pmcentrez&rendertype=abstract |
[16] | Roth LW , Polotsky AJ . Can we live longer by eating less? A review of caloric restriction and longevity. Maturitas. (2012) . pp. 315–9. |
[17] | Fontana L , Meyer TE , Klein S , Holloszy JO . Long term calorie restriction is highly effective in reducing the risk for atherosclerosis in humans. PNAS. (2004) ;101: (17):6659–63. |
[18] | Meyer TE , Kovács SJ , Ehsani AA , Klein S , Holloszy JO , Fontana L . Long-term caloric restriction ameliorates the decline in diastolic function in humans. J Am Coll Cardiol. (2006) ;47: (2):398–402. |
[19] | Stein PK , Soare A , Meyer TE , Cangemi R , Holloszy JO , Fontana L . Caloric restriction may reverse age-related autonomic decline in humans. Aging Cell. (2012) ;11: (4):644–50. |
[20] | Fontana L , Weiss EP , Villareal DT , Klein S , Holloszy JO . Long-term effects of calorie or protein restriction on serum IGF-1 and IGFBP-3 concentration in humans. Aging Cell. (2008) ;7: (5):681–7. |
[21] | Huang C-T , Chang M-C , Chen Y-L , Chen T-C , Chen C-A , Cheng W-F . Insulin-like growth factors inhibit dendritic cell-mediated anti-tumor immunity through regulating ERK1/2 phosphorylation and p38 dephosphorylation. Cancer Lett. (2015) ;359: (1):117–26. |
[22] | Clayton PE , Banerjee I , Murray PG , Renehan AG . Growth hormone, the insulin-like growth factor axis, insulin and cancer risk. Nat Rev Endocrinol [Internet]. (2011) ;7: (1):11–24. Available from: http://dx.doi.org/10.1038/nrendo.2010.171 |
[23] | Meydani S , Das S , Piper C , Lewis M , Dixit V , Gupta A , Villareal D , Klein S , Bhapkar M , Huang M , Fuss P , Roberts SB , Holloszy JO , Fontana L . Effects of prolonged calorie restriction on inflammation and immune function: A randomized controlled trial in non-obese humans (40.4). FASEB J [Internet]. (2014) ;28: (1). Available from: http://www.fasebj.org/content/28/1_Supplement/40.4.short |
[24] | Meydani SN , Das SK , Pieper CF , Lewis MR , Klein S , Dixit VD , Gupta AK , Villareal DT , Bhapkar M , Huang M , Fuss PJ , Roberts SB , Holloszy JO , Fontana L . Long-term moderate calorie restriction inhibits inflammation without impairing cell-mediated immunity. A randomized controlled trial in non-obese humans. Aging (Albany NY) [Internet]. Impact Journals, LLC; (2016) [cited 2016 Nov 17];8: (7):1416–31. Available from: http://www.ncbi.nlm.nih.gov/pubmed/27410480 |
[25] | Cava E , Fontana L . Will calorie restriction work in humans? Aging (Albany NY). (2013) ;5: (7):507–14. |
[26] | Linton PJ , Dorshkind K . Age-related changes in lymphocyte development and function. Nat Immunol. (2004) ;5: (2):133–9. |
[27] | Lin J , Epel E , Cheon J , Kroenke C , Sinclair E , Bigos M , Wolkowitz O , Mellon S , Blackburn E . Analyses and comparisons of telomerase activity and telomere length in human T and B cells: Insights for epidemiology of telomere maintenance. J Immunol Methods. (2010) ;352: (1-2):71–80. |
[28] | López-Otín C , Blasco MA , Partridge L , Serrano M , Kroemer G . The hallmarks of aging. Cell. (2013) . |
[29] | Blackburn EH . Telomere states and cell fates. Nature [Internet]. (2000) ;408: (0028-0836 (Print)):53–6. Available from: http://dx.doi.org/10.1038/35040500 |
[30] | Watson JD . Origin of concatemeric T7 DNA. Nat New Biol. (1972) ;239: (94):197–201. |
[31] | Cawthon RM , Smith KR , O’Brien E , Sivatchenko A , Kerber RA . Association between telomere length in blood and mortality in people aged 60 years or older. Lancet. (2003) ;361: (9355):393–5. |
[32] | Bakaysa SL , Mucci LA , Slagboom PE , Boomsma DI , Mcclearn GE , Johansson B , Pedersen NL . Telomere length predicts survival independent of genetic influences. Aging Cell. (2007) ;6: (6):769–74. |
[33] | Greider CW , Blackburn EH . Identification of a specific telomere terminal transferase activity in tetrahymena extracts. Cell. (1985) ;43: (2 PART 1):405–13. |
[34] | Cawthon RM . Telomere measurement by quantitative PCR. Nucleic Acids Res [Internet]. (2002) ;30: (10):e47. Available from: http://www.ncbi.nlm.nih.gov/pubmed/19129229 |
[35] | Epel ES , Lin J , Dhabhar FS , Wolkowitz OM , Puterman E , Karan L , Blackburn EH . Dynamics of telomerase activity in response to acute psychological stress. Brain Behav Immun. (2010) ;24: (4):531–9. |
[36] | Pawelec G , Derhovanessian E , Larbi A , Strindhall J , Wikby A . Cytomegalovirus and human immunosenescence. Reviews in Medical Virology. (2009) . pp. 47–56. |
[37] | Longo VD , Fontana L . Calorie restriction and cancer prevention: Metabolic and molecular mechanisms. Trends Pharmacol Sci. (2010) ;31: (2):89–98. |
[38] | Kimura M , Gazitt Y , Cao X , Zhao X , Lansdorp PM , Aviv A . Synchrony of telomere length among hematopoietic cells. Exp Hematol. (2010) ;38: (10):854–9. |
[39] | Shepherd BE , Guttorp P , Lansdorp PM , Abkowitz JL . Estimating human hematopoietic stem cell kinetics using granulocyte telomere lengths. Exp Hematol. (2004) ;32: (11):1040–50. |
[40] | Staras SAS , Flanders WD , Dollard SC , Pass RF , McGowan JE , Cannon MJ . Cytomegalovirus seroprevalence and childhood sources of infection: A population-based study among pre-adolescents in the United States. J Clin Virol. (2008) ;43: (3):266–71. |
[41] | Corkum CP , Ings DP , Burgess C , Karwowska S , Kroll W , Michalak TI . Immune cell subsets and their gene expression profiles from human PBMC isolated by Vacutainer Cell Preparation Tube (CPTTM) and standard density gradient. BMC Immunol [Internet]. BioMed Central. (2015) [cited 2017 Jan 26];16: :48. Available from: http://www.ncbi.nlm.nih.gov/pubmed/26307036 |
[42] | Wang C , Maddick M , Miwa S , Jurk D , Czapiewski R , Saretzki G , Langie SAS , Godschalk RWL , Cameron K , von Zglinicki T . Adult-onset, short-term dietary restriction reduces cell senescence in mice. Aging (Albany NY). (2010) ;2: (9):555–66. |
[43] | Smith DL , Mattison JA , Desmond RA , Gardner JP , Kimura M , Roth GS , Ingram DK , Allison DB , Aviv A . Telomere dynamics in rhesus monkeys: No apparent effect of caloric restriction. Journals Gerontol – Ser A Biol Sci Med Sci. (2011) ;66 A: (11):1163–8. |
[44] | Incollingo Belsky AC , Epel ES , Tomiyama AJ . Clues to maintaining calorie restriction? Psychosocial profiles of successful long-term restrictors. Appetite. (2014) ;79: :106–12. |

