
Association of Circulating Tumor DNA (ctDNA) Detection in Metastatic Renal Cell Carcinoma (mRCC) with Tumor Burden
Abstract
Background: In a series of 224 patients with advanced renal cell carcinoma (RCC), we have previously reported circulating tumor DNA (ctDNA) detection in 79% of patients. Clinical factors associated with detection are unknown.
Methods: Data was obtained from patients with radiographically confirmed stage IV RCC who received ctDNA profiling as a part of routine clinical care using a CLIA-certified platform evaluating 73 genes. Detailed clinical annotation was performed, including assessment of International Metastatic Renal Cell Carcinoma Database Consortium (IMDC) risk score, previous and current treatments and calculation of tumor burden using scan data most proximal to ctDNA assessment. Tumor burden was equated to the sum of longest diameter (SLD) of all measurable lesions.
Results: Thirty-four patients were assessed (18 male and 16 female) with a median age of 62 (range, 34–84). Twenty-six patients, 4 patients and 4 patients had clear cell, sarcomatoid and papillary histologies, respectively. IMDC risk was good, intermediate and poor in 14, 19 and 1 patient, respectively. ctDNA was detected in 18 patients (53%) with a median of 2 genomic alterations (GAs) per patient. No associations were found between IMDC risk, histology or treatment type and presence/absence of ctDNA. However, patients with detectable ctDNA had a higher SLD compared to patients with no detectable ctDNA (8.81 vs 4.49 cm; P = 0.04). Furthermore, when evaluated as a continuous variable, number of GAs was correlated with SLD (P = 0.01).
Conclusions: With the caveat of a limited sample size, it appears that SLD (a surrogate for tumor burden) is higher in mRCC patients with detectable ctDNA. Confirmation of these findings in larger series is ongoing and may suggest a capability for ctDNA to either complement or supplant radiographic assessment.
INTRODUCTION
Multiple targeted therapies have been approved for metastatic renal cell carcinoma (mRCC), exploiting targets such as vascular endothelial growth factor (VEGF), mammalian target of rapamycin (mTOR) and programmed death-1 (PD-1) [1]. When contrasted with outcomes achieved in the cytokine era (i.e., when interferon and interleukin-2 [IL-2] were mainstays of therapy), median survival has improved from approximately 12 months to 30 months [2–4]. Ironically, despite multiple available targeted agents, treatments are not applied in a personalized fashion.
The Cancer Genome Atlas (TCGA) investigators have reported alterations that occur frequently in clear cell RCC [5]. Key findings include widespread DNA hypomethylation associated with mutation of SETD2 and recurrent alterations along the PI3K/Akt pathway. Presumably, these findings could be used to devise genomically-driven strategies for treating advanced disease. However, TCGA data is based primarily on pre-treatment, operated patients with localized disease, and it is unclear whether results can be generalized to patients with advanced RCC, especially those whose tumors have likely evolved after multiple lines of treatment pressure.
We recently reported outcomes from 224 patients with advanced RCC who received circulating tumor DNA (ctDNA) profiling as a part of routine clinical care [6]. Our data indicates key distinctions from TCGA data, such as a lower rate of VHL alteration (32% versus 53%), and a higher rate of TP53 alteration (30% versus 2%). While these differences could potentially reflect variations in the assay, the advanced stage and heavily treated nature of patients assessed in our study could also be a key factor. Notably, ctDNA was detected in most patients (79%), but there was a small proportion of patients in whom no alterations were detected. For this small minority (21%), it is unclear whether this represents a true lack of genomic alterations or if certain clinicopathologic characteristics could drive this finding. For example, treatments which stabilize tumor growth and cell turnover may exhibit decreased DNA shedding, rendering ctDNA undetectable [7–9]. Herein, we investigate the correlation between ctDNA detection and clinicopathologic characteristics in patients with mRCC treated at a single institution.
MATERIAL AND METHODS
Through an IRB approved protocol, we retrospectively accessed clinicopathologic data from patients with mRCC who received ctDNA profiling in the course of routine clinical care at a single institution. ctDNA was assessed through a CLIA-certified, College of American Pathology-accredited comprehensive plasma assay. Technical specifications of this assay have been previously published [10]. Briefly, a total of two 10 mL aliquots of blood were collected per patient. Approximately 5–30 ng of cell free DNA were extracted and exposed to capture probes for 73 cancer-related genes. Complete exon coverage was performed for 18 genes, and critical regions of exons were covered in the remainder. The enriched digital sequence libraries were analyzed using the HiSeq2500 Sequencing System (Illumina). The apparatus achieves an average coverage depth of 15,000x.
Patient data was retrospectively collected and included age, gender, prior and current therapies, histology and tumor burden from radiographic test most proximal to blood draw. Radiographic tests considered for the study included computerized tomography (CT)-based imaging. Tumor burden was calculated based on the sum of the longest diameters (SLD) using RECIST 1.1 criteria. Sufficient data was also collected for computation of the International mRCC Database Consortium (IMDC) risk score [11]. Treatment-related data was also collected, including therapeutic class (e.g., VEGF or mTOR inhibitor) and sequence of therapies.
Statistical analysis
Consider SLD a continuous variable, the student’s t-test was used to compare mean SLD in patients who had ctDNA detected versus those who did not. The Pearson correlation coefficient was determined for the association between the number of mutations occurring in individual patients and SLD. The Fisher exact test was used to determine whether detection of ctDNA varied based on the presence or absence of RECIST response to the systemic regimen used most proximal to the ctDNA test. For this purpose, responders were considered those with a complete response (CR) or partial response (PR) to therapy, while non-responders were considered patients who had stable disease (SD) or progressive disease (PD).
RESULTS
Patient characteristics
A total of 34 patients had ctDNA assessment as part of routine clinical care from March 2015 to April 2017. The majority of patients were male (n = 18) with a median age of 62 years (range, 34–84). Clear cell renal cell carcinoma was the predominant histologic subtype (n = 26), followed by sarcomatoid and papillary (n = 4 for each). IMDC risk group was good for 14 patients, intermediate for 19 and poor for 1 patient. The majority of patients were treated with VEGF-directed therapy (n = 17); an additional 5 patients received VEGF-directed therapy in combination with either immunotherapy (IO; n = 4) or mTOR inhibitor (n = 1). A total of 7 patients were on monotherapy with IO, and 5 patients were not on systemic therapy. The distribution of patients with and without detectable ctDNA is noted in Table 1.
Table 1
Patients’ characteristics (n = 34)
| ctDNA | ctDNA | |
| Detected | Detected | |
| Gender | ||
| Male | 13 | 10 |
| Female | 5 | 6 |
| Age (median) | 66 | 57 |
| Histology | ||
| Clear cell | 14 | 12 |
| Papillary | 2 | 2 |
| Sarcomatoid | 2 | 2 |
| IMDC risk group | ||
| Good risk | 7 | 7 |
| Intermediate risk | 10 | 9 |
| Poor risk | 1 | 0 |
| Median prior therapies (range) | 2 (0–5) | 1 (0–5) |
| Current therapy | ||
| VEGF-directed | 10 | 7 |
| IO | 2 | 5 |
| VEGF + mTOR | 1 | 0 |
| VEGF + IO | 3 | 1 |
| None | 2 | 3 |
ctDNA detection and Genomic Alterations (GAs)
Amongst the patients in the current cohort, 18 patients (53%) had ctDNA detected, with a median of 2 GAs per patient. In the overall cohort, 41 GAs were detected. The most frequent GAs found were in TP53 (n = 7) and VHL (n = 5), as shown in Fig. 1. The sites of mutation in these genes are displayed in Fig. 2. Other GAs found in at least 2 patients were EGFR, MET, HNF1A, ARID1A, ERBB2, PTEN, APC, NF1 and BRAF. Of note, all patients included in this analysis only had one ctDNA test performed. Of the 41 alterations found, 32 consisted of point mutations and 9 of insertions/deletions.
Fig.1
Most frequent genomic alterations (GAs) observed in the current cohort.
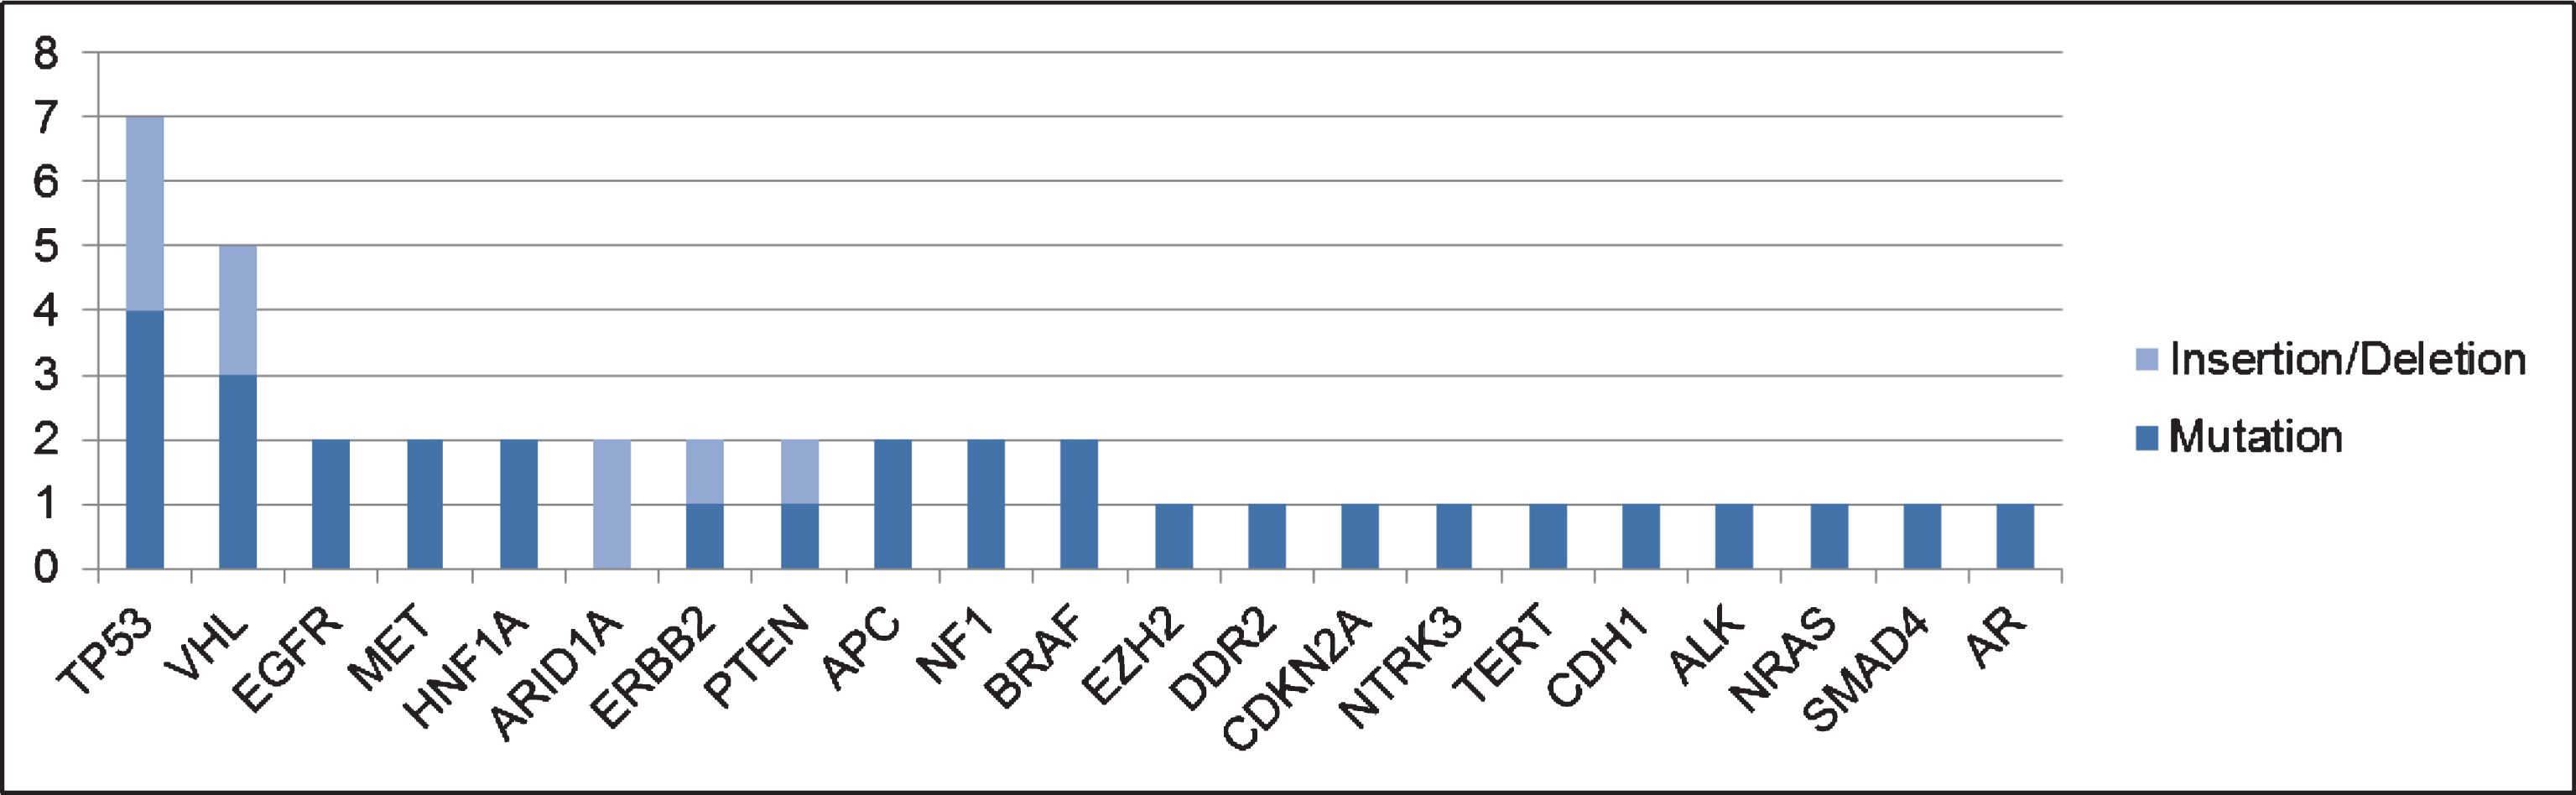
Fig.2
Localization of GAs for the most frequent altered genes in the current dataset (TP53 and VHL [b]) using cBioPortal MutationMapper.
![Localization of GAs for the most frequent altered genes in the current dataset (TP53 and VHL [b]) using cBioPortal MutationMapper.](https://content.iospress.com:443/media/kca/2017/1-1/kca-1-1-kca170007/kca-1-kca170007-g002.jpg)
Correlation of tumor burden with ctDNA findings
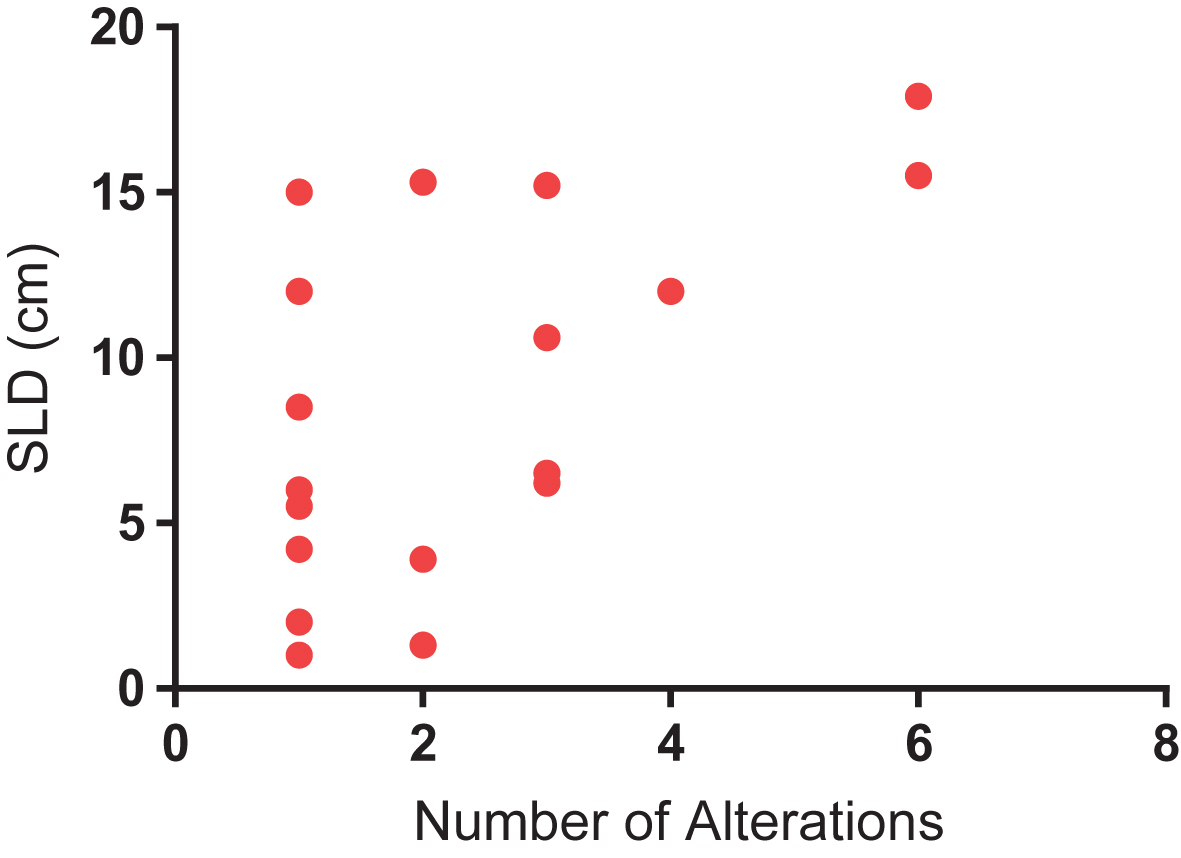
Median and mean SLD for the overall cohort was 5.05 cm and 6.67 cm, respectively. A significant difference was identified in SLD amongst patients with and without detectable ctDNA (Fig. 3). Specifically, patients with detectable ctDNA had a higher SLD compared to patients with no detectable ctDNA (8.81 vs 4.49 cm; P = 0.04). We further assessed the correlation between number of alterations and SLD. As shown in Fig. 4, a significant correlation was found on this analysis (R-squared = 0.34; P = 0.01).
Fig.3
Difference in sum of the longest dimension (SLD) of tumor in patients with detectable and non-detectable ctDNA. Mean SLD in was 8.81 cm in patients with detectable ctDNA, as compared to 4.49 in patients with non-detectable ctDNA (P = 0.04 by unpaired t-test).
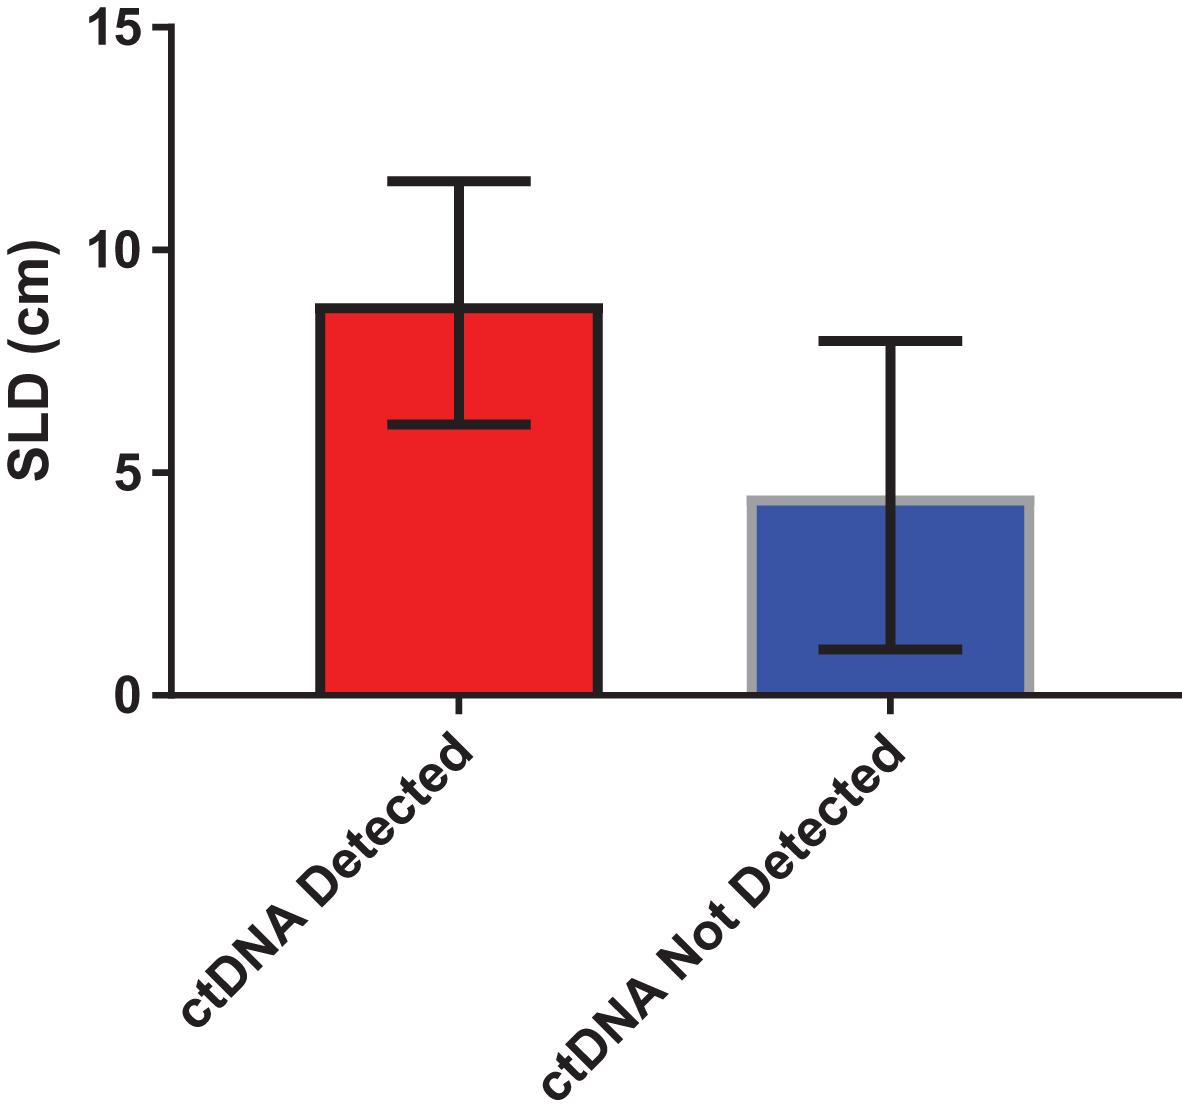
Fig.4
Correlation between number of alterations and sum of longest dimension (SLD) of tumor, a surrogate for tumor burden (R-squared = 0.34; P = 0.01).
Correlation of response with ctDNA findings
We also evaluated the relationship between detectable ctDNA and response to therapy most proximal to the ctDNA test. Of those with non-detectable ctDNA, the majority of patients (n = 9) were responding to current treatment, while 3 patients were non-responders and 4 patients were not assessable for response. Of those with detectable ctDNA, 9 patients were responders, 7 patients were non-responders and 2 patients were not assessable for response. No significant association between response to current therapy and detection of ctDNA was observed (P = 0.43).
DISCUSSION
Currently, the most common clinical application of ctDNA is for the detection of targetable GAs, i.e. as a predictive diagnostic. In the setting of lung cancer, for instance, ctDNA assessment for T790M mutations is routinely used for detection of resistance to EGFR-directed therapies [12, 13]. In mRCC, we presume the current application of ctDNA in clinical practice is to identify novel targetable GAs that could be used to guide application of approved therapies or to facilitate entry into clinical trials. To our knowledge, the current series reflects the first correlation of ctDNA and tumor burden (estimated by SLD) in patients with mRCC. Our results could therefore imply a role for ctDNA as a surrogate for radiographic data.
ctDNA assessment has numerous advantages over tissue biopsies, including the ability to capture intratumoral heterogeneity and allow for repeated assessments of genomic profile [14–17]. Furthermore, ctDNA obviates the need for an invasive procedure and the costs and potential complications associated with it. There are multiple investigations ongoing to determine the role of ctDNA as a means of initially diagnosing cancer or detecting recurrence [18, 19]. In the context of metastatic disease, the value of ctDNA may extend to its ability to assess response and obviate the need for radiographic imaging. Some studies, for instance, have shown that early variations in ctDNA levels may be an early predictor of response to treatment and precede radiographic changes by several months [20–23]. The correlation between ctDNA presence and elevated radiographic tumor burden we observed suggests that the relationship between response and ctDNA detection warrants further study. Although we could not identify such as association, we admittedly had limited data to explore this phenomenon.
Notably, the rate of ctDNA detection in our population was only 53%, considerably lower than in a recently reported comprehensive experience using the same platform [6]. In that study, including 224 patients with mRCC, approximately 79% of patients had ctDNA detected. In this single institution experience, it is challenging to ascertain whether lower tumor burden or timing of ctDNA assessment (e.g., before or after therapeutic response) resulted in this lower detection rate. Nonetheless, the even distribution of patients with and without ctDNA detected afforded a unique opportunity to explore correlations between clinical factors and detection.
Limitations of our study include the small sample size, making it challenging to infer whether certain patient characteristics (e.g., histology, IMDC risk group, etc.) had an impact on ctDNA detection. Furthermore, the retrospective nature of our study, including a wide variety of treatments and without standardized timing for ctDNA collection and imaging, potentially affects our ability to assess certain clinical variables, such as radiographic tumor burden, RECIST response and their relationship with ctDNA detection. Additionally, limited time of follow-up and the absence of serial samples also preclude the ability to determine if, on an intra-patient basis, variations in tumor burden correlate with variations in ctDNA detection and prognosis. Serial sampling would be a powerful tool to truly explore the value of ctDNA as a surrogate for radiographic response.
In summary, we identify a relationship between radiographic tumor burden and the detection of ctDNA in mRCC. Acknowledging our small sample size, it would be critical to explore this phenomenon in larger series. To this end, we are working to expand this single institution series to include multiple partners and validate our initial findings. In this project, we will further explore the relationship between response and ctDNA detection as well. Beyond supplying data pertaining to specific GAs that can guide therapy, ctDNA assessment holds the potential to either complement or supplant radiographic assessment.
REFERENCES
[1] | Choueiri TK , Motzer RJ . Systemic therapy for metastatic renal-cell carcinoma. New England Journal of Medicine (2017) ;376: :354–66. |
[2] | Motzer RJ , Bacik J , Murphy BA , Russo P , Mazumdar M . Interferon-alfa as a comparative treatment for clinical trials of new therapies against advanced renal cell carcinoma. J Clin Oncol (2002) ;20: :289–96. |
[3] | Motzer RJ , et al. Nivolumab versus everolimus in advanced renal-cell carcinoma. New England Journal of Medicine (2015) . doi:10.1056/NEJMoa1510665 |
[4] | Motzer RJ , et al. Efficacy of everolimus in advanced renal cell carcinoma: A double-blind, randomised, placebo-controlled phase III trial. Lancet (2008) ;372: :449–56. |
[5] | Comprehensive molecular characterization of clear cell renal cell carcinoma. Nature (2013) ;499: :43–9. |
[6] | Pal SK , et al. Evolution of circulating tumor DNA profile from first-line to subsequent therapy in metastatic renal cell carcinoma. Eur Urol (2017) . doi:10.1016/j.eururo.2017.03.046 |
[7] | Holdenrieder S , et al. Circulating nucleosomes predict the response to chemotherapy in patients with advanced non-small cell lung cancer. Clin Cancer Res (2004) ;10: :5981–7. |
[8] | Vallee A , et al. Rapid clearance of circulating tumor DNA during treatment with AZD9291 of a lung cancer patient presenting the resistance EGFR T790M mutation. Lung Cancer (2016) ;91: :73–4. |
[9] | Marchetti A , et al. Early prediction of response to tyrosine kinase inhibitors by quantification of EGFR mutations in plasma of NSCLC patients. J Thorac Oncol (2015) ;10: :1437–43. |
[10] | Lanman RB , et al. Analytical and clinical validation of a digital sequencing panel for quantitative, highly accurate evaluation of cell-free circulating tumor DNA. PLoS One (2015) ;10: :e0140712. |
[11] | Heng DY , et al. Prognostic factors for overall survival in patients with metastatic renal cell carcinoma treated with vascular endothelial growth factor-targeted agents: Results from a large, multicenter study. J Clin Oncol (2009) ;27: :5794–9. |
[12] | Mok TS , et al. Osimertinib or platinum-pemetrexed in EGFR T790M-positive lung cancer. N Engl J Med (2017) ;376: :629–40. |
[13] | Piotrowska Z , et al. Plasma T790M result alters treatment options in a previously T790 wild-type EGFR-mutant lung cancer. Journal of Thoracic Oncologye 11: :95–7. |
[14] | Chan KC , et al. Cancer genome scanning in plasma: Detection of tumor-associated copy number aberrations, single-nucleotide variants, and tumoral heterogeneity by massively parallel sequencing. Clinical Chemistry (2013) ;59: :211–24. |
[15] | De Mattos-Arruda L , et al. Capturing intra-tumor genetic heterogeneity by de novo mutation profiling of circulating cell-free tumor DNA: A proof-of-principle. Ann Oncol (2014) ;25: :1729–35. |
[16] | Jahr S , et al. DNA fragments in the blood plasma of cancer patients: Quantitations and evidence for their origin from apoptotic and necrotic cells. Cancer Res (2001) ;61: :1659–65. |
[17] | Stroun M , Lyautey J , Lederrey C , Olson-Sand A , Anker P . About the possible origin and mechanism of circulating DNA apoptosis and active DNA release. Clinica chimica acta; International Journal of Clinical Chemistry (2001) ;313: :139–42. |
[18] | Sozzi G , et al. Quantification of free circulating DNA as a diagnostic marker in lung cancer. J Clin Oncol (2003) ;21: :3902–8. |
[19] | Kim K , et al. Circulating cell-free DNA as a promising biomarker in patients with gastric cancer: Diagnostic validity and significant reduction of cfDNA after surgical resection. Annals of Surgical Treatment and Research (2014) ;86: :136–42. |
[20] | Misale S , et al. Emergence of KRAS mutations and acquired resistance to anti-EGFR therapy in colorectal cancer. Nature (2012) ;486: :532–6. |
[21] | Cabel L , et al. Circulating tumor DNA changes for early monitoring of anti-PD1 immunotherapy: A proof-of-concept study. Ann Oncol (2017) . doi: 10.1093/annonc/mdx212 |
[22] | Dawson SJ , et al. Analysis of circulating tumor DNA to monitor metastatic breast cancer. N Engl J Med (2013) ;368: :1199–209. |
[23] | Schreuer M , et al. Quantitative assessment of BRAF V600 mutant circulating cell-free tumor DNA as a tool for therapeutic monitoring in metastatic melanoma patients treated with BRAF/MEK inhibitors. Journal of Translational Medicine (2016) ;14: :95. |

