
Immigration trends’ impacts on state vocational rehabilitation agency minority application rates: An empirical forecast model demonstration study
Abstract
BACKGROUND: Incessant migration trends of persons of color to the United States warrant the identification of promising forecast models to help state vocational rehabilitation agencies (SVRAs), policy makers, researchers, and advocates inform strategic plans, policy formulation, and research agenda development.
OBJECTIVE: This study demonstrated and assessed the efficacy of two different multivariate empirical forecast models’ (i.e., Vector Autoregressive [VAR] model and Multivariable Grey Model [MGM]) ability to accurately predict immigration (Blacks [e.g., Kenya, Nigeria, South Africa, Cameroon], American Indians or Alaskan Natives [e.g., Canada, Mexico], Asians [e.g., China, India, Vietnam, Korea, Japan], Native Hawaiian or other Pacific Islanders [e.g., the Philippines], and Latinos [e.g., Mexico, El Salvador, Guatemala, Cuba, Dominican Republic] trends’ impact on new unduplicated application rates among minorities.
METHOD: Nine years of Rehabilitation Services Administration (RSA)-911 case record data (fiscal year [FY] 2006 thru 2014) on SVRA applications and U.S. Census Bureau American Community Survey 1-year estimates (calendar year 2006 thru 2014) on foreign born persons were entered into the VAR model and MGM to test their predictive performance.
RESULTS: The MGM was demonstrated to be superior to the VAR model in predictive accuracy. The MGM three-year forecast projected an upward curve trend trajectory in the percentage of new Black or African American, American Indian or Alaskan Natives, Asians, and Latino SVRA applicants for FYs 2015 thru 2017.
CONCLUSION: The MGM can be considered for use by SVRAs as a promising tool to help them respond appropriately to the needs of new immigrants and other minority group members.
1Background
Gigantic migration trends among racially and ethnically diverse individuals (Blacks [e.g., Kenya, Nigeria, South Africa, Cameroon], American Indians or Alaskan Natives [e.g., Mexico], Asians [e.g., China, India, Vietnam, Korea, Japan], Native Hawaiian or other Pacific Islanders [e.g., the Philippines], and Latinos [e.g., Mexico, El Salvador, Guatemala, Cuba, Dominican Republic]) from economically and/or politically underdeveloped nations to countries that offer economic opportunity and political asylum continue to reshape the world’s population. Consequently, nearly every country around the globe has experienced a substantial refashioning of its demographic landscape (Pérez-Armendáriz, 2014; Perez & Hirschman, 2009; Uhlenberg, 2013). The United States (U.S.) is no exception to this phenomenon having experienced an exponentially high incidence of new immigrants from diverse corners of the world during two distinct periods: (a) the initial immigration wave that began in the middle of the nineteenth century and culminated in 1900 with almost nine million legal immigrants, and (b) the second wave that started 1950 and has not come to an end (Chojnicki, Docquier, & Ragot, 2011).
The nation’s rapidly changing demography and increasing levels of diversity represent an incitement that has sparked active contemporary legislative debate within the context of current immigration policy (Cross et al., 2015; Ewing, 2010; Ewing, 2012). U.S. immigration policy represents a contemporary hot button issue as policymakers contemplate labor market demands and border security concerns. These alarms center on the estimated 9 million undocumented immigrants who are in many cases the parents and family members of citizen-children with disabilities. As the trend of migration to the U.S. continues to advance, the issue of citizenship and understanding the conditions of naturalization becomes increasingly significant (Cross et al., 2015). While immigrants who become U.S. citizens are granted all of the rights that are conferred to native U.S. citizens, legal permanent residents are granted the legal right to remain in the country permanently and work with a renewable green card as proof of lawful status in the country (Stock, 2012). On the contrary, undocumented immigrants continue to live in the “shadows” having no residency rights and oftentimes relegated to menial agricultural-based and other labor intensive lines of employment (i.e., manufacturing and services) requiring repetitive and rapid body movements and fraught with safety concerns often resulting in a disability (Liu & Painter, 2012; Schulz et al., 2013).
Migration to the U.S. has been attributed to individuals’ pursuit of employment opportunities, meaningful wages and an improved quality of life (Bennett, Scornaiencki, Brzozowski, Denis, & Magalhaes, 2012; Kelly, 2010). However, these uncertain migration patterns raise immediate questions regarding the American economy and varied constituencies that are tied to the socio-economic landscape. State vocational rehabilitation agencies (SVRAs), constituent entities, are principle stakeholders that may be heavily impacted by new and emerging racial and ethnic immigration trends. Whether SVRAs have the ability and capacity to deliver services to new minority U.S. citizens, adult legal permanent residents, and citizen-children with disabilities (i.e., school-to-work transition services) is a question that demands immediate attention (Cross et al., 2015).
Potential challenges within SVRA context include cultural and linguistic concerns, health care service access barriers, community participation limitations (i.e., employment, independent living), and the deportation of undocumented family members. For example, Cross et al. (2015) raised the issue that pronounced linguistic and cultural barriers, particularly in communication, may create resistance to services on behalf of the consumers as well as practitioners. More subtle, though not any less prominent, are issues such as little knowledge of rehabilitation services and benefits, cultural mistrust of rehabilitation practitioners and potential employers, low expectations of job placement and little knowledge of and lack of accessibility to technology. The issue of deportation has also been forcefully ventured. For instance, the deportation of mixed-status adult family (i.e., families with citizens and undocumented members) members of citizen-children eligible for SVRA sponsored school-to-work transition services such as parents, grandparents, uncles, aunts, sisters, and brothers erode networks crucial to their success in obtaining and maintaining employment andcareers.
By their very nature, unceasing immigration patterns raise concerns about the capacity of the 80 SVRAs across the nation to effectively respond to this growing crisis (Cross et al., 2015). Consequently, there exist a need for promising forecast methods and applications that can be used by SVRAs, policy makers, researchers, and advocates to inform strategic planning, policy formulation, and research program development for improved rehabilitation experiences. To date, however, relatively few studies have forecasted minority SVRA application rate trends, and so these agencies have had little information available to strategically plan for a rapid and effective response to minority immigrants’ and U.S. born minorities’ needs.
2Purpose of the study
Although Section 21 of the 1998 Rehabilitation Act Amendments (Public Law 93–112) spawned a plethora of research examining rehabilitation experiences along racial and ethnic lines, scant attention has been paid to understanding SVRA and minority immigrant intersection phenomena. More specific, little information is available on the potential impacts of immigration trends on SVRA application rates. Consequently, there is a need to demonstrate the efficacy of forecast models that can be considered for accurately predicting these trends impacts’ on SVRA systems. These trends call for the development of a three-year forecast model to help SVRAs, policy makers, and researchers inform their strategic plans, policy formulation, and future research agendas. The purpose of this study was to demonstrate and assess the efficacy of select multivariate empirical forecast models’ (i.e., Vector Autoregressive [VAR] model and Multivariable Grey Model [MGM]) ability to accurately predict immigration trends’ impact on SVRA new application rates among minorities. The following research questions wereaddressed:
1) Which forecast model (i.e., VAR model versus MGM) demonstrates the highest level of accuracy in predicting new SVRA application rate trends?
2) What is the three-year (FYs 2015 to 2017) forecast of the impacts of racial and ethnic immigration trends on SVRA minority application rates?
3Methods
3.1Sources of data
Nine years of national Rehabilitation Services Administration (RSA)-911 case record data (FY 2006 to FY 2014 [October 1, 2005 thru September 30, 2014]) on SVRA applicants and U.S. Census Bureau American Community Survey (ACS) 1-year estimates (Calendar Year 2006–2014 [January thru December]) on the foreign born populations were entered into the VAR model and MGM to develop a three-year forecast of new SVRA application rate trends. The subsequent section provides a brief description of each data source.
3.1.1RSA-911 data
The RSA-911 database contains two distinct variables for race and ethnicity as defined in the most recent Reporting Manual for the Case Service Report. Mutually exclusive race categories were created in this study to include: “Black or African American”, “American Indian or Alaska Native”, “Asian”, “Native Hawaiian or Other Pacific Islander”, “White”, and “Other” where individuals identified themselves as multiracial or their case contained a missing value. The ethnicity-Hispanic or Latino variable was coded either yes (i.e., Latino/Hispanic) or no (i.e., not Hispanic/Latino). Individuals who identified as Latino may belong to any racial group. The “Date of Application” variable, which includes the year, month, and date that the SVRA received a completed and signed application form from the applicant, was used exclusively to eradicate data duplication and select case records included in the analysis. That is, only unduplicated case records representing individuals who applied for services in the same or “current” FY of the database were included for analysis. For example, if a case record for FY 2011 data indicated that the individual applied for services in FY 2009, that record was excluded from analysis. A detailed account of case record data on application frequencies and percentages broken out by race and ethnicity across the time series are presented in Table 1. The PROC DATA and PROC FREQ procedures in SAS version 9.4 were used to calculate these statistics. (SAS Institute, 2014).
3.1.2U.S. census bureau data
The ACS data source is a cross sectional survey that draws a new sample of individuals each calendar year and implements a large scale general survey designed to make estimates on various characteristic levels, e.g. race and ethnicity (Reamer, 2010). We obtained ACS 1-year estimates on the foreign born population’s select characteristics (i.e., race and ethnicity) for calendar years 2006 thru 2014 data through the following website ink: http://factfinder.census.gov/faces/nav/jsf/pages/community_facts.xhtml. These data include frequencies and percentages on race and ethnicity, as well as other demographics such as age and educational attainment. For race, the ACS estimates provide 5 response categories plus the “some other race” and “two or more races” groupings. We collapsed the “some other race” and “two or more race” categories in the ACS data source to build the “other” level. Data from the race variable levels for “Black or African American”, “American Indian or Alaska Native”, “Asian”, “Native Hawaiian or other Pacific Islander”, “White” and “Other” categories were used in these analyses. The Hispanic or Latino origin variable has two categories; a “Hispanic or Latino” (of any race) level and a “White alone, not Hispanic or Latino” level. We used the “Hispanic or Latino” variable in a separate analysis. A detailed account of frequencies and percentages on foreign-born individuals broken out by race and ethnicity across the time series can be seen in Table 1.
3.2Forecasting models and data analysis
The selection of an appropriate model(s) is paramount for demonstrating methods that accurately predict and forecast the output. Although researchers have developed quantitative forecasting methods recently, no existing model is perfect in its prediction accuracy in all circumstances or conditions. The VAR model in economics was introduced as an alternative to traditional large-scale macroeconometric models (Sims, 1980). One advantage of the model is that it provides a systematic way to capture rich dynamics in multivariate time series, and the approach has become increasingly popular in recent decades (Lütkepohl, 2009, 2011). The VAR model is an approximation to larger structural systems and has shown optimal performance with extended time series historical data (Dekimpe & Hanssens, 2000). One limitation of the VAR model is that it has to be estimated to low order systems. That is, the effects of omitted variables are placed in the residuals, which may lead to major distortions in the impulse responses (Armstrong, 2001).
The Grey system theory was developed originally in 1985 (Julong, 1985). The model’s focal point is uncertain systems forecasting where small amounts of data, discrete data and incomplete information (e.g. intervals, probability distributions, fuzzy sets, and imprecise probability distributions) are difficult for probability and fuzzy mathematics to handle (Li et al., 2007; Shen et al., 2013). The Grey Model (GM) is based on the grey system theory and has been widely applied in economics and financial areas (Kayacan, Ulutas, & Kaynak, 2010; Li et al., 2007; L. Liu, Wang, Liu, & Li, 2014), public health and biostatistics (Feng & Zhang, 2012; Jin et al., 2008; Shen et al., 2013), engineering (Kang & Zhao, 2012) as well as other specialties.
The Multivariable Grey Model (MGM) (1, n) represents an expansion and complements the grey system model. The MGM has been shown to possess a higher level of predictive performance than the GM (Jun, Jianming, & Yingjun, 1997). The model is designed to work with systems where available information is insufficient to characterize the system, and where a complex relationship between response variables and the main influencing factors exists. The benefits of the MGM is that it has higher demonstrative accuracy prediction than traditional multivariate forecasting models (Jun et al., 1997; Pao, Fu, & Tseng, 2012).
In this article, nine years of data from two different sources (i.e., RSA-911 and ACS) were entered into these two different empirical forecast models (i.e., VAR and MGM [1, 2]) to test their predictive accuracy using Absolute Mean Percentage Error (AMPE) as the criterion. A final predictive model was selected based on smallest AMPE to develop the three-year forecast of SVRA application rate trends. Figure 1 shows the research paradigm for the forecast model demonstration and assessment.
The algorithms utilized to reduce the data in the VAR model and MGM (1, 2) follow.
Model 1: Vector Autoregressive (VAR) model
The VAR model was used to analyze the dynamic effects of the ACS data on the foreign born population and SVRA application rates in the RSA-911 databases. The basic modeling procedures are presented below.
Step 1. Obtaining original series. Let Xt = (x1t, x2t, . . . , xnt) ′ denote a (n×1) vector of time series variables. In this case, n = 2 and t = 8.
Step 2: VAR Model. The basic p-lag vector autoregressive (VAR (p)) model has the form
where Πi are (n×n) coefficient matrices and ɛt is an (n×1) unobservable zero mean white noise vector process (serially uncorrelated or independent) with time invariant covariance matrix ∑. For example, the simple VAR (1) model equation has the following form(1)
orStep 3: Estimation in R. The function VAR in the package vars was used to predict and forecast the time series sequences.
Model 2: Multivariable Grey Model
MGM procedures were employed to develop a three-year forecast of SVRA application rate trends across racial and ethnic populations using nine years (FY 2006–2014) of RSA-911 data and ACS data denoted as
Step1: Obtaining original series. A non-negative sequence of raw data X(0) with n samples was expressed as:
where i = 1, 2, ⋯ J and J was the variable.Step 2: Pre-processing of the original raw data.
1 a) Accumulating Generation Operator (AGO). A new sequence
(2)
where,
2 b) The Mean operation. The generated mean sequence of Z(1) was defined as:
(3)
3 where,
(4)
Step 3: MGM (1, J) Model equation. The MGM (1, J) model was constructed by establishing a J variable first order differential equation for
(5)
Step 4: We took the inverse AGO (IAGO) to find the predicted values of the primitive sequence by using the IAGO:
4 The parameter A and B was estimated by the least square method:
whereand
(6)
Therefore, the fitted and predicted vector sequence
3.2.1Error analysis and validation
In order to evaluate the prediction accuracy of the VAR model and MGM (1, 2), the Absolute Mean Percentage Error (AMPE) criterion was used to estimate model performances and reliability. AMPE is a general accepted percentage measure of prediction accuracy. This indicator was calculated as:
Table 2 shows the AMPE of the two forecasting models across race and ethnicity. The model with the smallest mean AMPE was selected as the best forecasting model.
3.3Simulation results
As can be drawn from the results presented in Table 2, the MGM’s level of predictive accuracy was much higher than the VAR model’s level (i.e., smaller results translate to higher predictive accuracy). The mean AMPE was enhanced from 3.25% for the VAR to 2.75% for the MGM.
The results point out that the MGM was superior in regard to predictive accuracy levels when compared to the VAR model. The MGM (1, 2) results demonstrate that the model can reflect the relationship of restriction and stimulation between the number of new unduplicated applicants and the foreign born population across racial and ethnicity variables. As shown in the Table 3, the MGM projected three-year (i.e., FYs 2015, 2016, and 2017) total frequencies for new applicants included 133,043, 123,920 and 108,713 individuals, respectively. Compared to the FY 2014 baseline total unduplicated application frequency (N = 135,319), FYs 2015 to 2017 projections represent a 1.68%, 8.42%, and 19.02% decrease in new applicants overall. In comparison to this same baseline, the number of new Black or African American applicants were projected to decrease by 2.52%, 2.61% and 5.51% during FY 2015, FY 2016 and FY 2017 respectively; new Native Hawaiian or Other Pacific Islander applicants were projected to decrease by 5.64%, 16.70% and 30.35%; and new White applicants were projected to decrease by 1.69%, 6.78%, and 13.70% for that same time series. The model projected an increase in the number of new American Indian or Alaska Native applicants by 1.44% in FY 2015 and a decrease of 1.20% and 3.80% in FY 2015 and FY 2016, respectively, when compared to FY 2014 baseline results. Remarkably, the numbers of new Asian applicants were projected to increase by 4.42%, 7.09%, and 12.20% across the same time series when compared to FY 2014 baseline results. Within this comparative context, the model also strikingly projected that the number of new Latino applicants would decrease by 1.82%, 5.7% and 10.47% during FY 2015 to FY 2017, respectively.
Figure 2 shows the frequency curves of new SVRA service applicants for the two models from FY 2006 to FY 2014 and the three-year forecast projections (FY 2015 to FY 2017) for each racial and ethnic target group. Several conclusions can be drawn from these results. First, they indicate that the MGM’s (1, 2) predictive value was more closely aligned to the actual number of new applicants than the VAR model generated number confirming that the former model was more accurate than the VAR model. Second, the MGM’s (1, 2) curve showed a striking three-year projected upward trend trajectory for the number of new Asian applicants, while such curve trends for Black or African American, Native Hawaiian or Other Pacific Islander, White, and Latino applicants decreased. Third, the curve projects that the number of new Native American applicants will slightly increase in FY 2015 and then decrease during the two subsequent fiscal years. Last, the total number of new applicants for SVRA services were projected to decrease over the three-year forecast time series.
Figure 3 shows the percentage curves of new applicants for each model across nine years (i.e., FY 2006 to FY 2014) for each racial and ethnic target cohort. These results project an increase in the percent of new Black or African American, American Indian or Alaska Native, Asian, and Latino applicants for FYs 2015 to 2017. On the contrary, however, projections indicate that the percentage of applications from Whites and Native Hawaiian or Other Pacific Islander will decrease.
4Discussion
This study sought to address the following two research questions: (1) Which forecast model(i.e., VAR model versus MGM) demonstrates the highest level of accuracy in predicting new SVRA application rates?, and (2) What is the three-year (FY 2015 to 2017) forecast of the impacts of racial and ethnic immigration trends on SVRA minority application rates? In regard to research question #1, the findings indicated that the MGM was superior to the VAR model in regard to predictive performance. Consequently, the MGM has promise for use among SVRA leaders, policy makers, and researchers as an accurate forecasting tool to generate predictions that could inform their strategic plan development, policy formulation, and future research program development. Forecasting models are commonly used in business and economics, meteorology and environmental sciences, such as hydrology. For example in business, conceiving a means to predict stock market returns has been a well anticipated goal of some financial practitioners as such forecasting have hefty impacts on the overall stock firms performance and profits. To this end, Van Gysen, Huang, and Kruger (2013) conducted a comprehensive comparison of the predictive accuracy of linear and non-linear models when forecasting financial returns, using a number of macroeconomic variables on the Johannesburg Stock Exchange. In meteorological context, Fu, Lee, Wang, Wang, and Vitart (2013) assessed the prediction skill of the boreal summer intraseasonal oscillation (BSISO) in four state-of-the-art forecasting models for the annual Asian summer monsoon, an occurrence which holds both meteorological and hydrological implications. Although such forecasting models have been confirmed as useful in the aforementioned areas, the literature is void of any such approaches for predicting SVRA application rate trends among minorities. Additional multiple demonstration trials that build upon these results, nonetheless, are needed to either confirm or refute the MGMs’ veracity in curve fitting performance.
In addressing research question #2, the results indicate two remarkable projections. First, the number Asian applicants, when compared to the FY 2014 baseline frequency, are projected to increase by 4.42%, 7.09%, and 12.20% for FYs 2015 to FY 2017, respectively. This projection represents a whopping 23% compound percent change (+) in applications (i.e., from FY 2014 to FY 2017). This finding can be perhaps explained by the substantial number of foreign born Asians residing in the U.S. As reflected in Table 1, over the past ten years, with the exception of calendar year 2009, Asians have represented almost one-quarter of all foreign persons in the U.S. These immigration trends are undeniable, and their impacts on such projections call for SVRAs to pay particular attention to this target population. The finding may have several service and policy implications for SVRAs serving foreign born and U.S. born Asians (e.g., China, India, Vietnam, Korea, Japan) who embrace exotic cultural traditions of their parents, grandparents, and extended family members.
Second, the findings suggest an upward curvetrend trajectory in the percentage of new Black or African American, American Indian or Alaskan Natives, Asians, and Latino applicants for FYs 2015 thru 2017. While the curves suggest that the three-year projected percentages of Blacks or African Americans, American Indians or Alaska Natives, Asians, and Latinos applying for services are anticipated to wax, the percentages for White and Native Hawaiian or Other Pacific Islander applicants are projected to wane. Although the overall number ofBlack or African American and Latino applicants were projected to decrease for FYs 2015 to 2017 and American Indian or Alaska Native applicants were projected to decrease for FYs 2016 and 2017 when compared to FY 2014 baseline frequencies, the curves indicate these target groups’ percentage of the overall applicant pool will show an increase over the three-year projection period. This finding can be attributed to the fact that the total number of projected applicants will decline more rapidly than the number of new African Americans or Blacks, Latino, or American Indian or Alaska Native applicants.
The bridge between culture and disability is intricate. As such, providing culturally sensitive care to minority immigrants with disabilities can be arduous because of language barriers and differences in values and beliefs (Bal & Perzigian, 2013; Lindsay, Tétrault, Desmaris, King, & Piérart, 2014). Most research on culturally sensitive care and services emphasize ethnic-minority groups as a whole, very little is known about immigrants. Differences between immigrant families and practitioners can significantly impact successful outcomes. Therefore, practitioners should be aware that immigrant families may have conflicting views about disability, establishing the need and having access to various health and rehabilitation related services (Lindsay et al., 2014). Because most practitioners are trained from a western perspective and lack training in working with families from diverse backgrounds, SVRAs should be prepared to develop strategies that allow their personnel to work effectively in circumstances that may require additional cross-cultural competencies.
A second point for practitioners to consider while working with individuals from these diverse immigrant groups (i.e., Blacks, American Indian or Alaska Natives, Asians, and Latinos) is being able to understand the complexities of immigrants’ family dynamics. In the U.S. immigrant families are increasingly composed of members of varying legal status or mixed-status families (Zayas & Bradlee, 2014). Approximately 4.5 million of the 5.5 million children of undocumented parents are U.S. citizens. Because of the nature of this demography, it is no longer possible to enforce immigration laws without directly affecting millions of U.S. citizens (Zayas & Bradlee, 2014). Deportation is an issue of critical concern. In light of removal strategies, increasing arrests and detention of undocumented immigrants, tremendous hardship is placed on citizen-children of undocumented immigrants. For example, a Latino high-school student with a disability receiving SVRA sponsored school-to-work transition services whose undocumented mother is deported is likely to experience many adjustment challenges that could result in the failure to place and maintain employment. In essence, the government may be creating two classes of vulnerable citizen-children with disabilities: exiles (those children who go with their parents to another country, often one they do not know) and orphans (those children whose parents leave them in the U.S. in the care of others, sometimes in the child welfare system). Government policies and procedures relating to immigration laws may force undocumented immigrant parents to face awfully distressing choices (Zayas & Bradlee, 2014).
While the above scenario may seem far-reaching as a possible consideration for SVRA professionals in practice, the root of such a buildup has been pronounced as a regular national headline as of late; that being, deportation. More than 400,000 undocumented immigrants were deported in 2012 alone, many the parents of citizen-children with disabilities, according to data from the U.S. Department of Homeland Security [DHS] (Zayas & Bradlee, 2014). This issue is relevant to SVRAs in several ways: (1) the issue of deportation may bring to light the need to address and confirm permanent residency status of foreign-born prospects for vocational rehabilitation services; (2) uncommon counseling and guidance services may be requested by immigrant consumers dealing with family members who have been deported; and (3) cultural and linguistic issues continue to impact ethnic-minority groups, an attempt to understand their dynamics from a non-western perspective within the context of disability may pose significant challenges for immigrant consumers and SVRA practitioners.
What is apparent is the uncompromising realization that this modern demographic landscape dynamized by the increase of ethnic-minority groups in the U.S., particularly new U.S. Citizens and legalized permanent residents with disabilities, has been followed by notice of the need to provide protracted services to them (Bennett et al., 2012; Cross et al., 2015; Leahy et al., 2014; Markides & Rote, 2014). SVRAs will need to prepare to contend with related phenomena in the face of unemployment and underemployment difficulties that persons with disabilities currently encounter (Leahy et al., 2014).
While it is deemed beneficial and desirable for rehabilitation counselors to be familiar with a finite knowledge about the cultural norms of every minority consumer (i.e., immigrant and U.S. born) that he/she serves, the 38th Institute on Rehabilitation Issues (IRI) Prime Study Group encourages them to adopt the more pragmatic cultural humility approach (IRI, 2015). In the cultural humility approach, “the goal is not to master a finite body of knowledge but to simultaneously look inward to examine one’s own conscious and unconscious biases, to reach outward to build relationships with individuals and communities, and to see the client as the expert” (Tervalon & Murray-Garcia, 1998, p. 117). As the percentage of African American or Black, American Indian or Alaska Native, Asian, and Latino applicants increases, so will the demand for counselors who can embrace the cultural humility model in an effort to assist consumers to integrate into the competitive labor market. To this end, there will be a need for new policy initiatives and strategies that will assist SVRAs’ rapid response to projected trends for this target population. For example, new strategic plans that encourage staff and leadership trainings on the cultural humility approach could be beneficial. Such trainings could be carried out by Technical Assistance and Continuing Education centers located in RSA regions with heavy minority populations and significant immigration trends.
5Limitations
This study has three inherent limitations. First, the findings are limited in that they do not specifically forecast the number of new immigrants from racial and ethnic minorities who are projected to apply for SVRA sponsored services. Instead, the findings included minority immigrants as well as U.S. born minorities. The RSA-911 database does not capture or include information in case records as to whether an applicant is an immigrant, and so we cannot ascertain or project numbers specific to immigration status. RSA should consider adding a variable to the case service report inclusive of immigration status information. Second, due to the quantitative nature of the research, no information pertaining to the types of service and policy implications needed in response to the projections is available. Consequently, there is a need to ascertain the perspectives of SVRA personnel and other immigration experts as to the potential implications and responses to this growing crisis. In doing so, the following research questions should be addressed: (a) What is the priority of importance for impacts of emerging and new U.S. citizen and permanent residency population trends on SVRAs’ capacity to serve immigrants with disabilities from traditionally underserved racial and ethnic populations? (b) What is the priority of significance for strategies that could be implemented by SVRAs to address micro and macro level impacts of emerging and new immigration trends on service capacity to new U.S. citizens and legal permanent residents from racial and ethnic populations?, and (c) What are the strategies used by states that are successfully meeting the needs of new immigrants and other traditionally underserved racial and ethnic populations?
Third, information contained in the RSA-911 database is not immune to personnel error. Consequently, the database may include erroneous information. The database, nonetheless, is historically accepted as a viable data source for addressing service and policy questions that need to be answered. As a broad generalization, these conclusions may be helpful to national policymakers and state VR agency leaders interested in improving the rehabilitation experiences of minorities.
6Conclusion
This study assessed the predictive accuracy of select forecast models in regard to the impacts of immigration trends on SVRA application rates. The MGM was demonstrated to be superior to the VAR model. The MGM three-year forecast projected an upward curve trend trajectory in the percentage of new Black or African American, American Indian or Alaskan Natives, Asians, and Latino applicants for FYs 2015 thru 2017. These findings suggest that the MGM represents a promising forecast approach that could assist SVRAs in responding rapidly and appropriately to potential immigration trends impacts. Moreover, projected application percentage curve trends suggest that SVRAs should prepare and plan to serve individuals with disabilities from these minority groups. However, there remains a need for additional demonstration trials to either confirm or refute the MGM’s efficacy in prediction accuracy in comparison to other multivariate forecast models.
Conflict of interest
The authors have no conflict of interest to report.
Acknowledgments
The contents of this article were developed under a grant from the National Institute on Disability, Independent Living, and Rehabilitation Research (NIDILRR grant number 90RT5024-01-00). NIDILRR is a Center within the Administration for Community Living (ACL), Department of Health and Human Services (HHS). The contents of this article do not necessarily represent the policy of NIDILRR, ACL, HHS, and one should not assume endorsement by the federal government.
References
1 | Armstrong J. S. ((2001) ). Principles of forecasting: A handbook for researchers and practitioners (Vol. 30 %@ 0306476304): Springer Science & Business Media. |
2 | Bal A. , & Perzigian A. B. ((2013) ). Evidence-based Interventions for Immigrant Students Experiencing Behavioral and Academic Problems: A Systematic Review of the Literature. Education and Treatment of Children, 36: (4), 5–28. |
3 | Bennett K. M. , Scornaiencki J. M. , Brzozowski J. , Denis S. , & Magalhaes L. ((2012) ). Immigration and its impact on daily occupations: A scoping review. Occupational Therapy International, 19: (4), 185–203. |
4 | Chojnicki X. , Docquier F. , & Ragot L. ((2011) ). Should the US have locked heaven’s door? Journal of Population Economics, 24: (1), 317–359. |
5 | Cross K. E. , Moore C. L. , Manyibe E. O. , Aref F. , Washington A. L. , Umadjela A. , ... Cyprian D. ((2015) ). New Immigrating Racial and Ethnic Populations and Trends Impacts on State Vocational Rehabilitation Agencies. Journal of Applied Rehabilitation Counseling, 46: (2), 20. |
6 | Dekimpe M. G. , & Hanssens D. M. ((2000) ). Time-series models in marketing: Past, present and future. International Journal of Research in Marketing, 17: (2-3), 183–193. doi: http://dx.doi.org/10.1016/S0167-8116(00)00014-8 |
7 | Ewing W. A. ((2010) ). The many facets of effective immigration reform. Society, 47: (2), 110–117. |
8 | Ewing W. A. ((2012) ). Opportunity and exclusion: A brief history of U.S. immigration policy. Immigration Policy Center. |
9 | Feng X. , & Zhang S. ((2012) ). Measles Trends Dynamic Forecasting Model Based on Grey System Theory. Management Science and Engineering, 6: (4), 71–74. doi: http://dx.doi.org/10.3968%2Fj.mse.1913035X20120604.ZRXZ2 |
10 | Fu X. , Lee J.-Y. , Wang B. , Wang W. , & Vitart F. ((2013) ). Intraseasonal Forecasting of the Asian Summer Monsoon in Four Operational and Research Models*. Journal of Climate, 26: (12), 4186–4203. |
11 | Jin R. , Qiu H. , Zhou X. , Huang P. , Wang Z. , & Wei J. ((2008) ). Forecasting Incidence of Intestinal Infectious Diseases in Mainland China with ARIMA Model and GM (1, 1) Model. Fudan University Journal of Medical Sciences, 5: , 010. |
12 | Julong D. ((1985) ). Grey control system. Printing House of Central China University of Science and Technology, Hubei. |
13 | Jun Z. , Jianming S. , & Yingjun F. ((1997) ). The grey model MGM (1, n) and its application. Systems Engineering-Theory & Practice, 5: , 109–113. |
14 | Kang J. , & Zhao H. ((2012) ). Application of improved grey model in long-term load forecasting of power engineering. Systems Engineering Procedia, 3: , 85–91. doi: 10.1016/j.sepro.2011.11.012 |
15 | Kayacan E. , Ulutas B. , & Kaynak O. ((2010) ). Grey system theory-based models in time series prediction. Expert Systems with Applications, 37: (2), 1784–1789. doi: http://dx.doi.org/10.1016/j.eswa.2009.07.064 |
16 | Kelly C. S. ((2010) ). The Influence of a Change in Immigration Law on US Marriage Rates. Eastern Economic Journal, 36: (4), 500–522. |
17 | Leahy M. J. , Chan F. , Lui J. , Rosenthal D. , Tansey T. , Wehman P. , ... Del Valle R. ((2014) ). An analysis of evidence-based best practices in the public vocational rehabilitation program: Gaps, future directions, and recommended steps to move forward. Journal of Vocational Rehabilitation, 41: (2). |
18 | Li G. , Yamaguchi D. , Mizutani K. , & Nagai M. ((2007) ). New proposal and accuracy evaluation of grey prediction GM. IEICE Transactions On Fundamentals Of Electronics Communications And Computer Sciences E Series A, 90: (6), 1188. |
19 | Lindsay S. , Tétrault S. , Desmaris C. , King G. , & Piérart G. ((2014) ). Social workers as cultural brokers in providing culturally sensitive care to immigrant families raising a child with a physical disability. Health & Social Work, hlu009. |
20 | Liu C. Y. , & Painter G. ((2012) ). Immigrant settlement and employment suburbanisation in the US: Is there a spatial mismatch? Urban Studies, 49: (5), 979–1002. |
21 | Liu L. , Wang Q. , Liu M. , & Li L. ((2014) ). An Intelligence Optimized Rolling Grey Forecasting Model Fitting to Small Economic Dataset. Abstract and Applied Analysis, 2014: , 10. doi: 10.1155/2014/641514 |
22 | Lütkepohl H. ((2009) ). Econometric analysis with vector autoregressive models. Handbook of Computational Econometrics, 281–319. |
23 | Lütkepohl H. ((2011) ), Vector autoregressive models: Springer. |
24 | Markides K. S. , & Rote S. ((2014) ). Aging, Minority Status, and Disability. Generations, 38: (4), 19. |
25 | Pao H.-T. , Fu H.-C. , & Tseng C.-L. ((2012) ). Forecasting of CO2 emissions, energy consumption and economic growth in China using an improved grey model. Energy, 40: (1), 400–409. |
26 | Pérez-Armendáriz C. ((2014) ). Cross-border discussions and political behavior in migrant-sending countries. Studies in Comparative International Development, 49: (1), 67–88. |
27 | Perez A. D. , & Hirschman C. ((2009) ). The changing racial and ethnic composition of the US population: Emerging American identities. Population and Development Review, 35: (1), 1–51. |
28 | Reamer A. D. ((2010) ). Surveying for Dollars: The Role of the American Community Survey in the Geographic Distribution of Federal Funds. Brookings Institution. |
29 | SAS Institute. (2014). Base SAS 9.4 Procedures Guide: Statistical Procedures: SAS Institute. |
30 | Schulz M. R. , Grzywacz J. G. , Chen H. , Mora D. C. , Arcury T. A. , Marín A. J. , ... Quandt S. A. ((2013) ). Upper body musculoskeletal symptoms of Latino poultry processing workers and a comparison group of Latino manual workers. American Journal of Industrial Medicine, 56: (2), 197–205. |
31 | Shen X. , Ou L. , Chen X. , Zhang X. , & Tan X. ((2013) ). The application of the grey disaster model to forecast epidemic peaks of typhoid and paratyphoid fever in China. PLOS ONE, 8: (4), e60601. |
32 | Sims C. A. ((1980) ). Macroeconomics and reality. Econometrica: Journal of the Econometric Society, 1–48. |
33 | Stock M. D. ((2012) ). Is Birthright Citizenship Good for America? Cato Journal, 32: (1). |
34 | Tervalon M. , & Murray-Garcia J. ((1998) ). Cultural humility versus cultural competence: A critical distinction in defining physician training outcomes in multicultural education. Journal of Health Care for the Poor and Underserved, 9: (2), 117–125. |
35 | Thirty-eight Institute on Rehabilitaion Issues. ((2015) ). A monograph from the 38th Institute on Rehabilitation Issues to address underserved populations, including individuals who are deaf-blind. Hot Springs, AR: University of Arkansas CURRENTS. |
36 | Uhlenberg P. ((2013) ). Demography is not destiny: The challenges and opportunities of global population aging. Generations, 37: (1), 12–18. |
37 | Van Gysen M. , Huang C.-S. , & Kruger R. ((2013) ). The Performance Of Linear Versus Non-Linear Models In Forecasting Returns On The Johannesburg Stock Exchange. International Business & Economics Research Journal (IBER), 12: (8), 985–994. |
38 | Zayas L. H. , & Bradlee M. H. ((2014) ). Exiling children, creating orphans: When immigration policies hurt citizens. Social work, swu004. |
Figures and Tables
Fig.1
Research paradigm for forecast modeling.
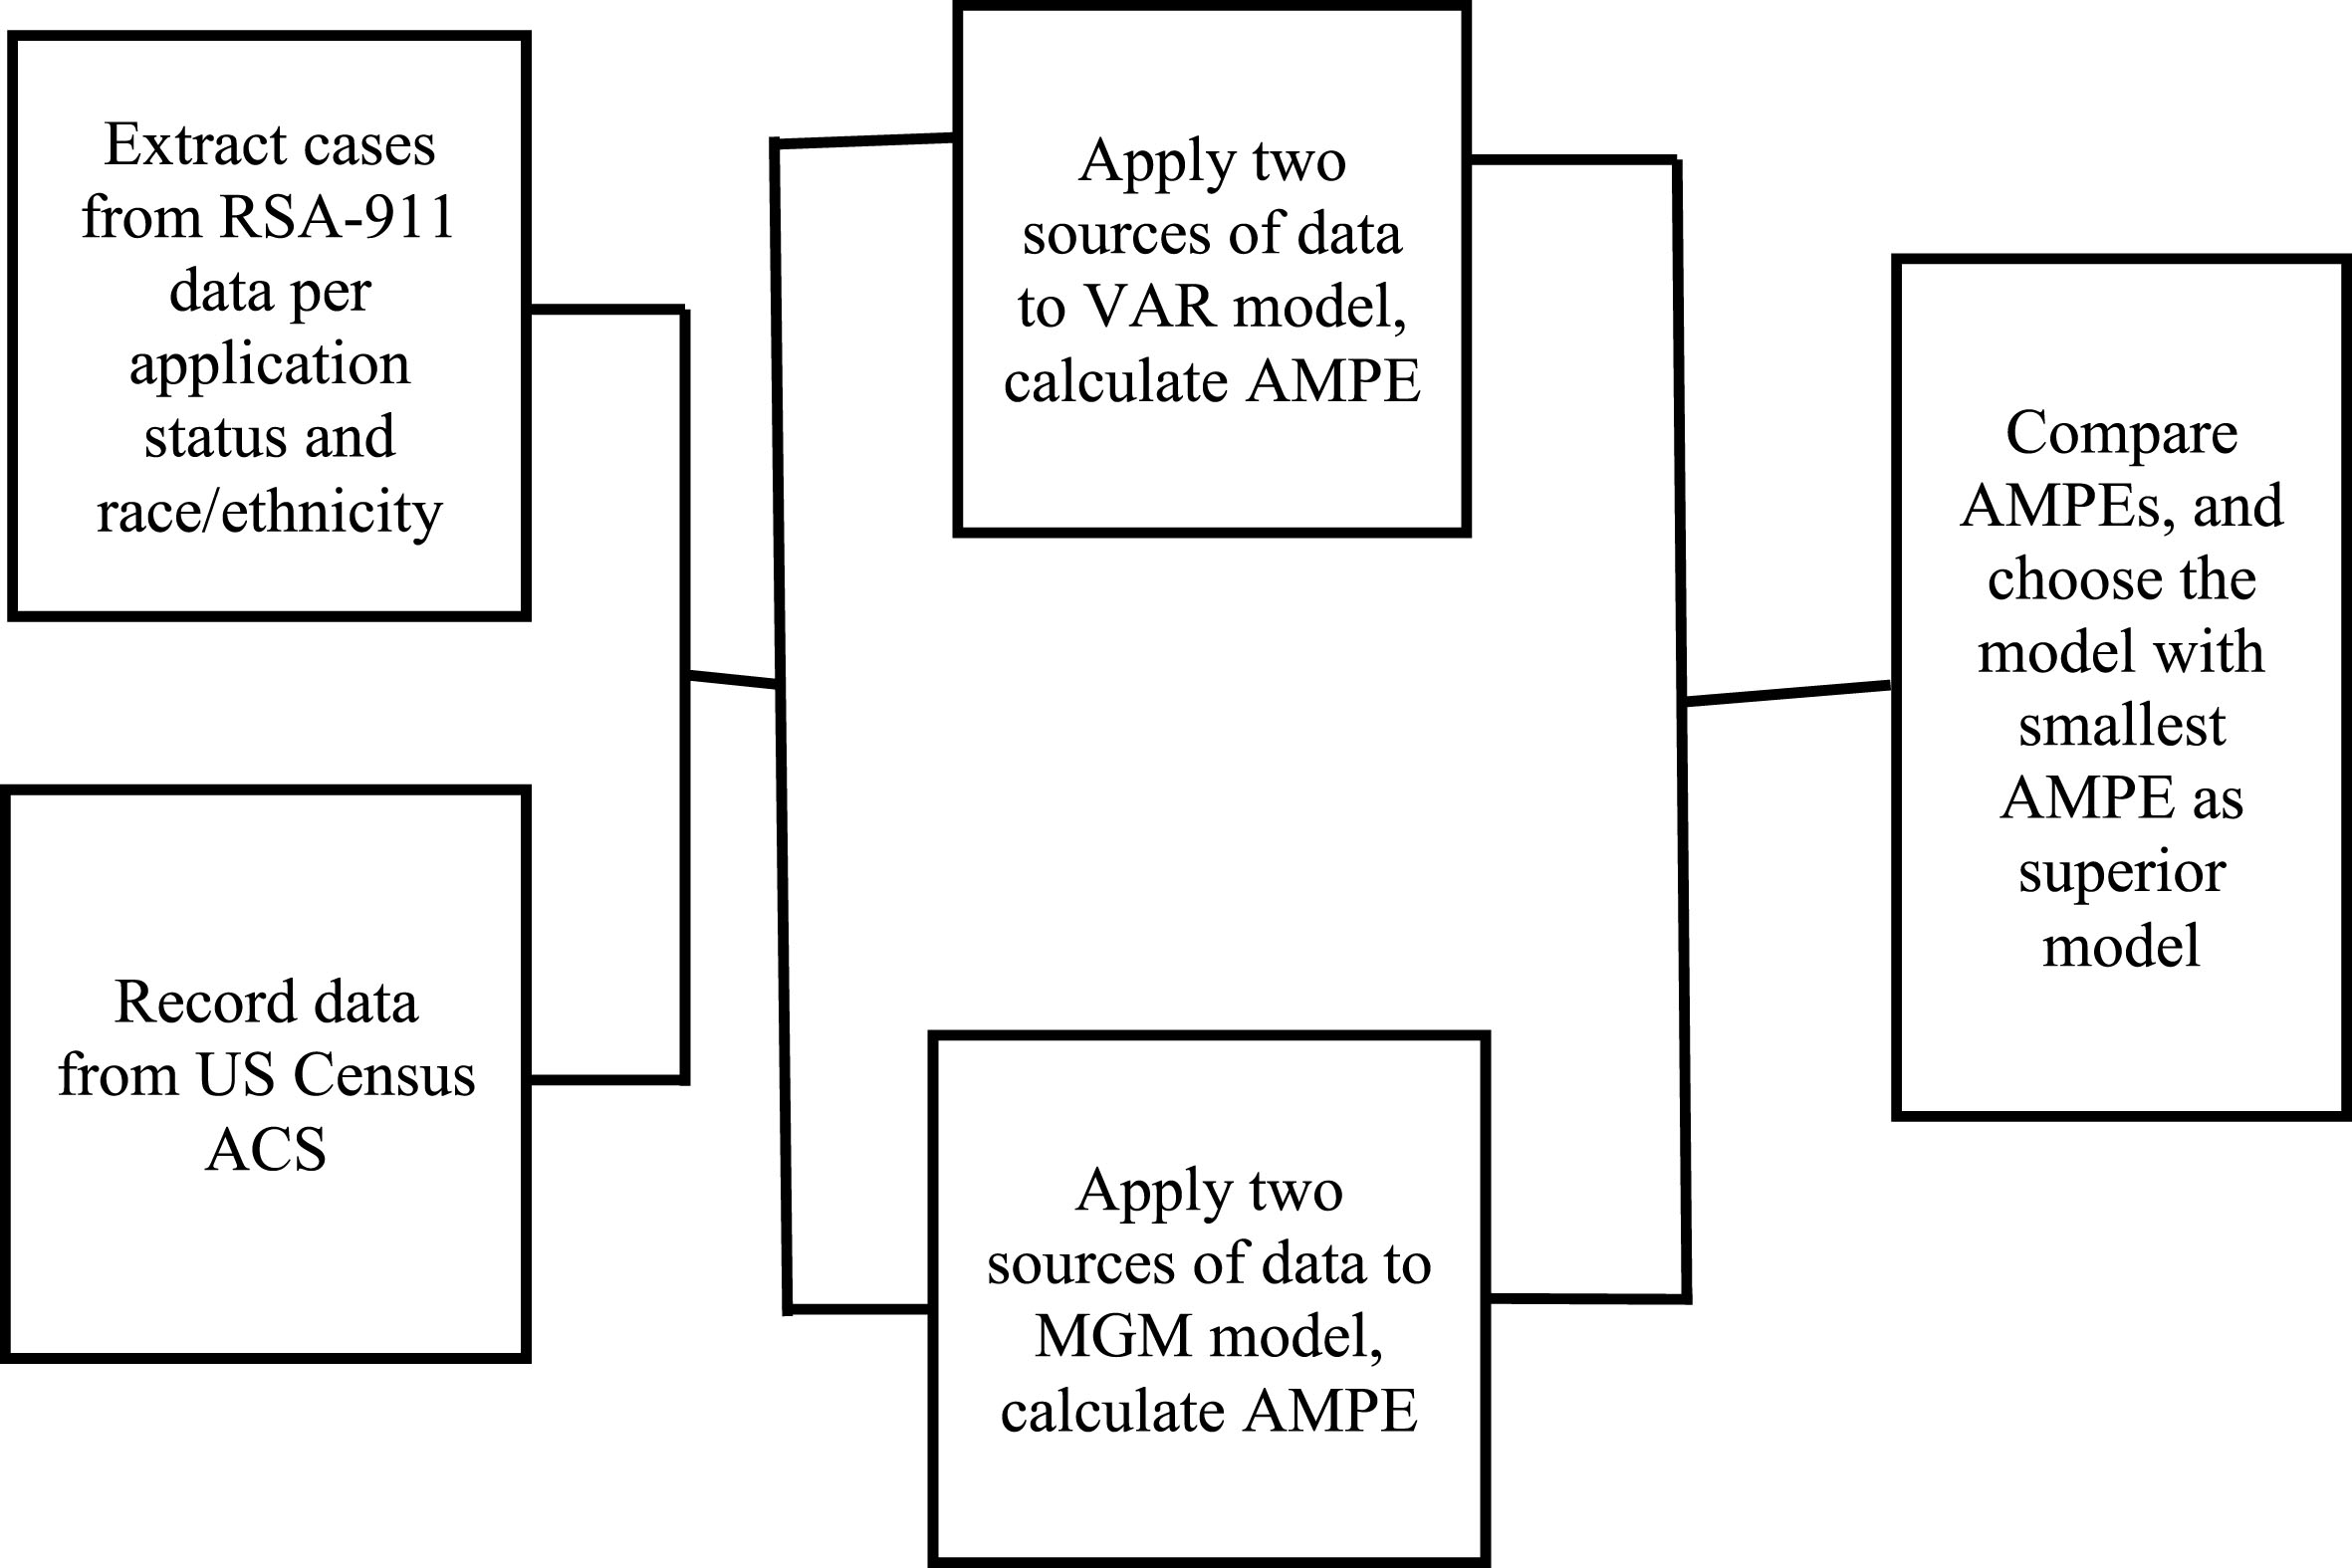
Fig.2
Forecast for number of new applicants by different models for FYs 2015–2017.
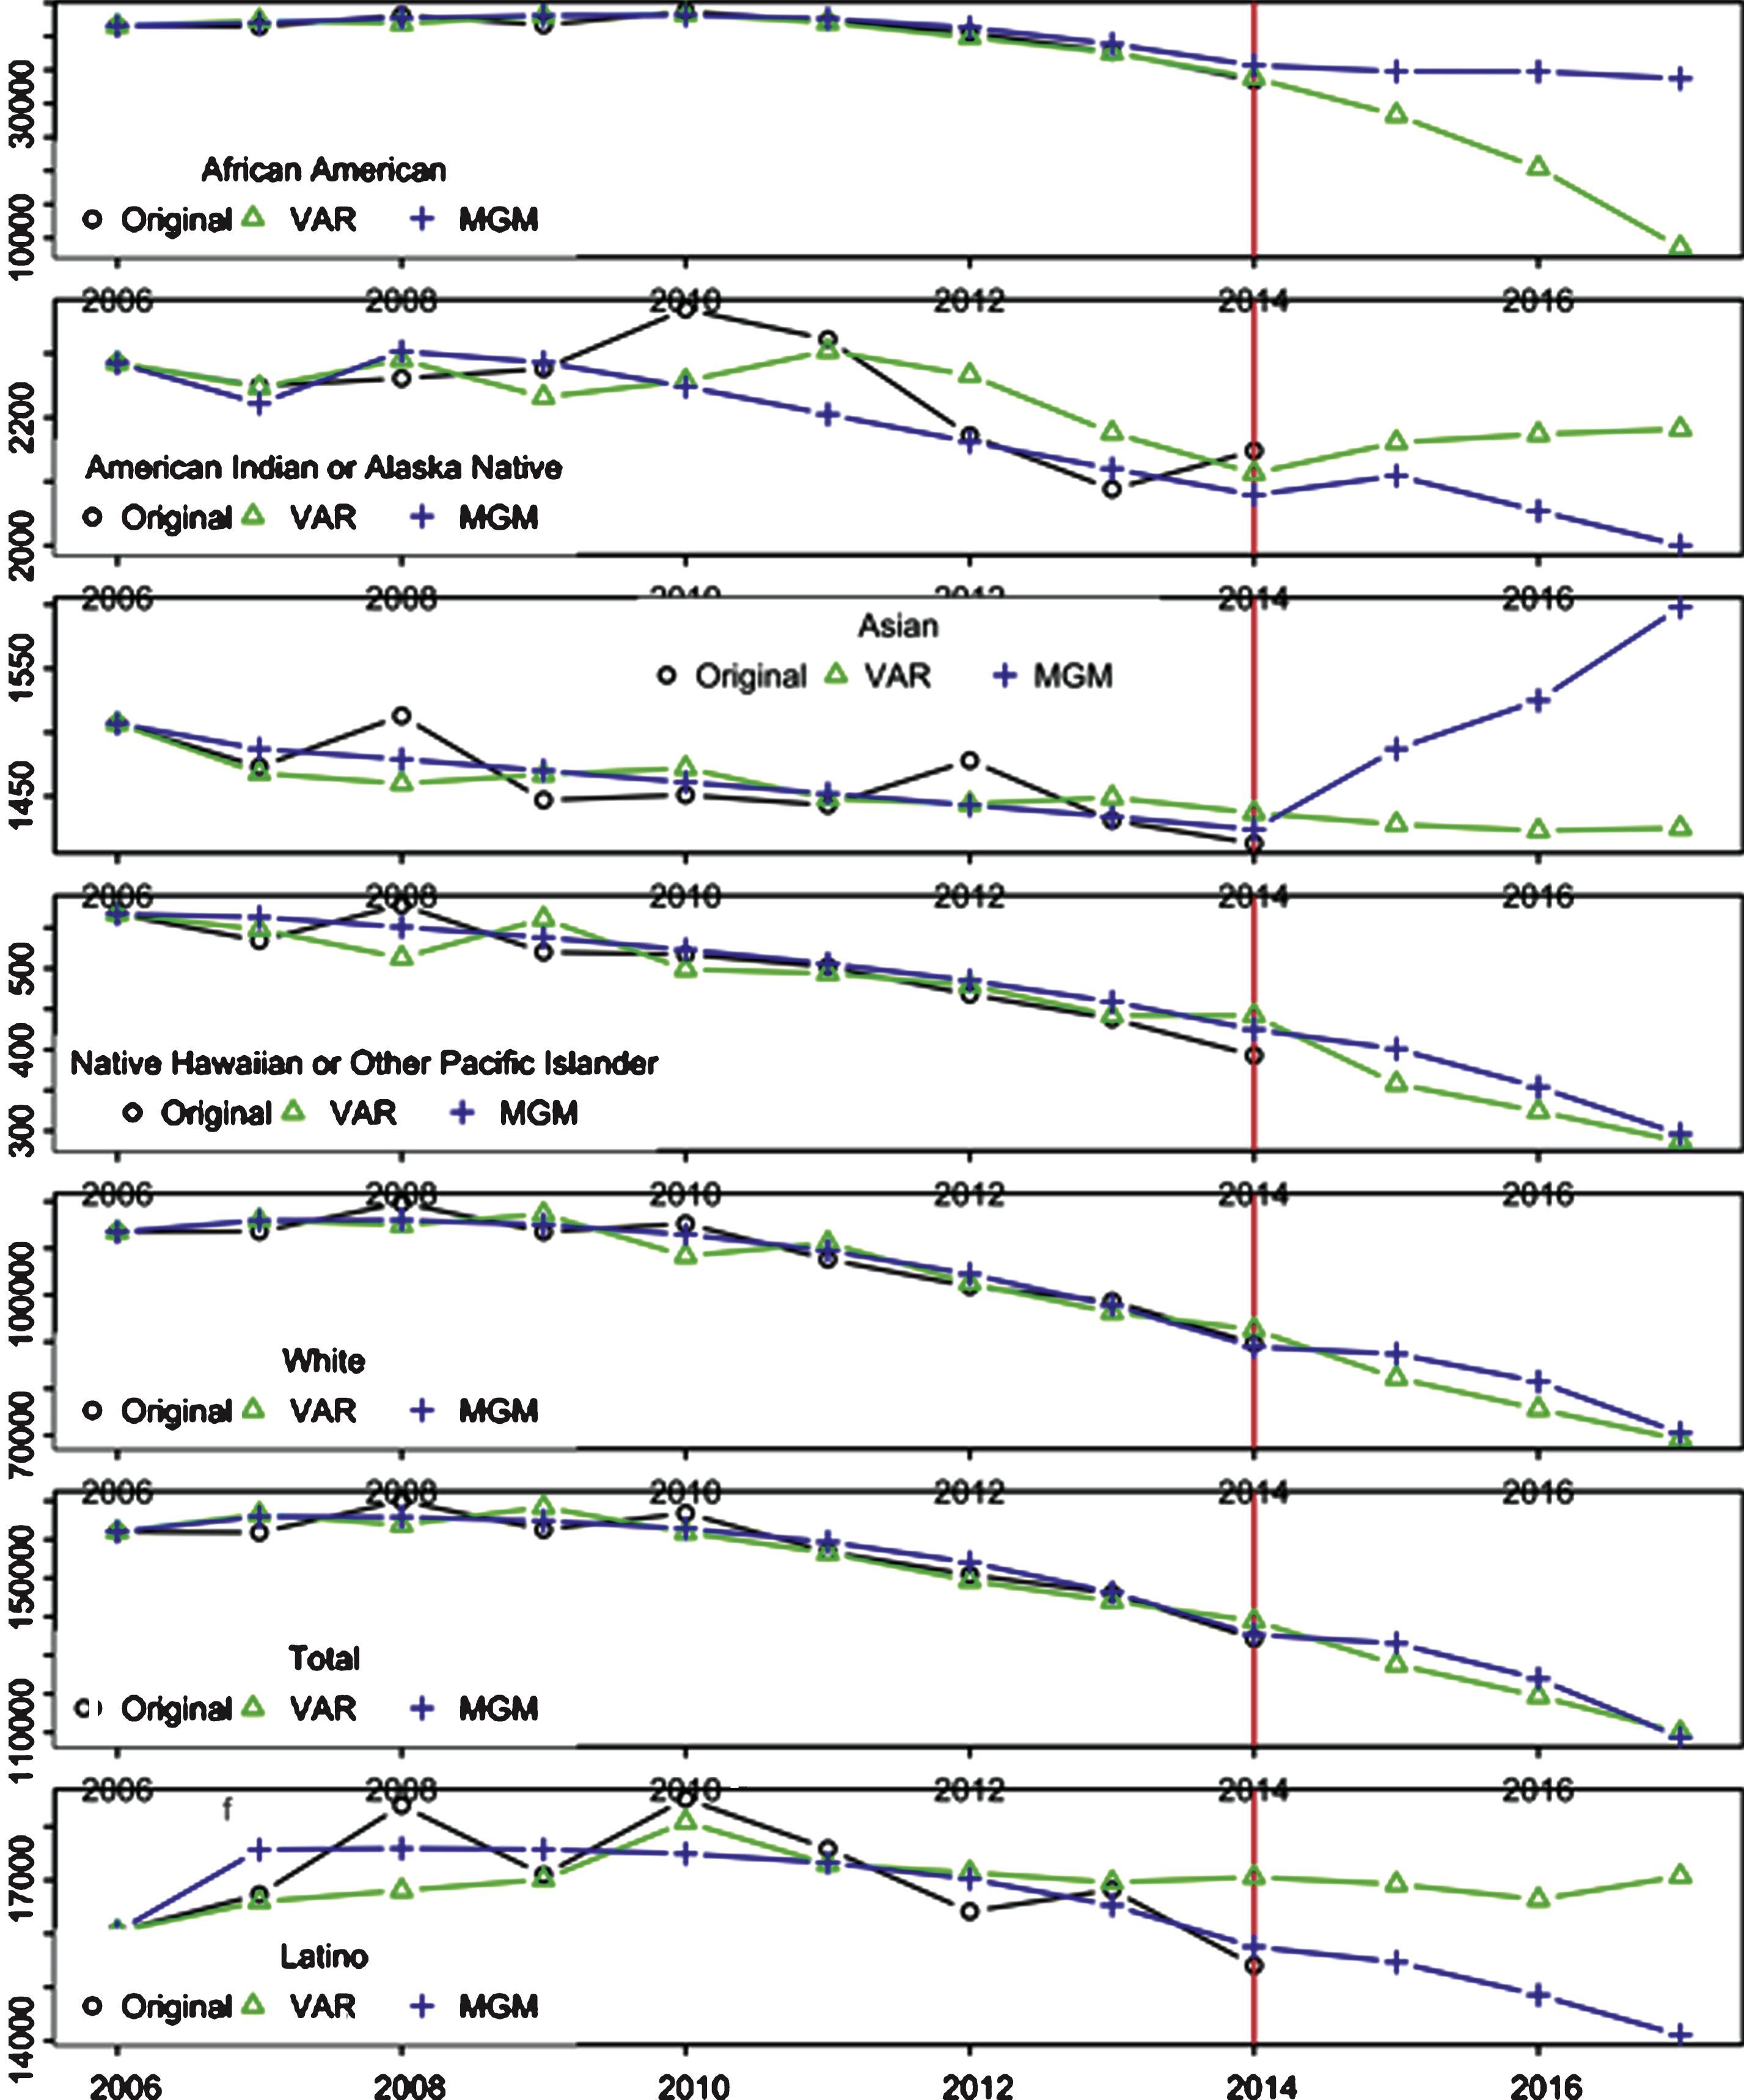
Fig.3
Forecast for percent of new applicants by different models for FYs 2015–2017.
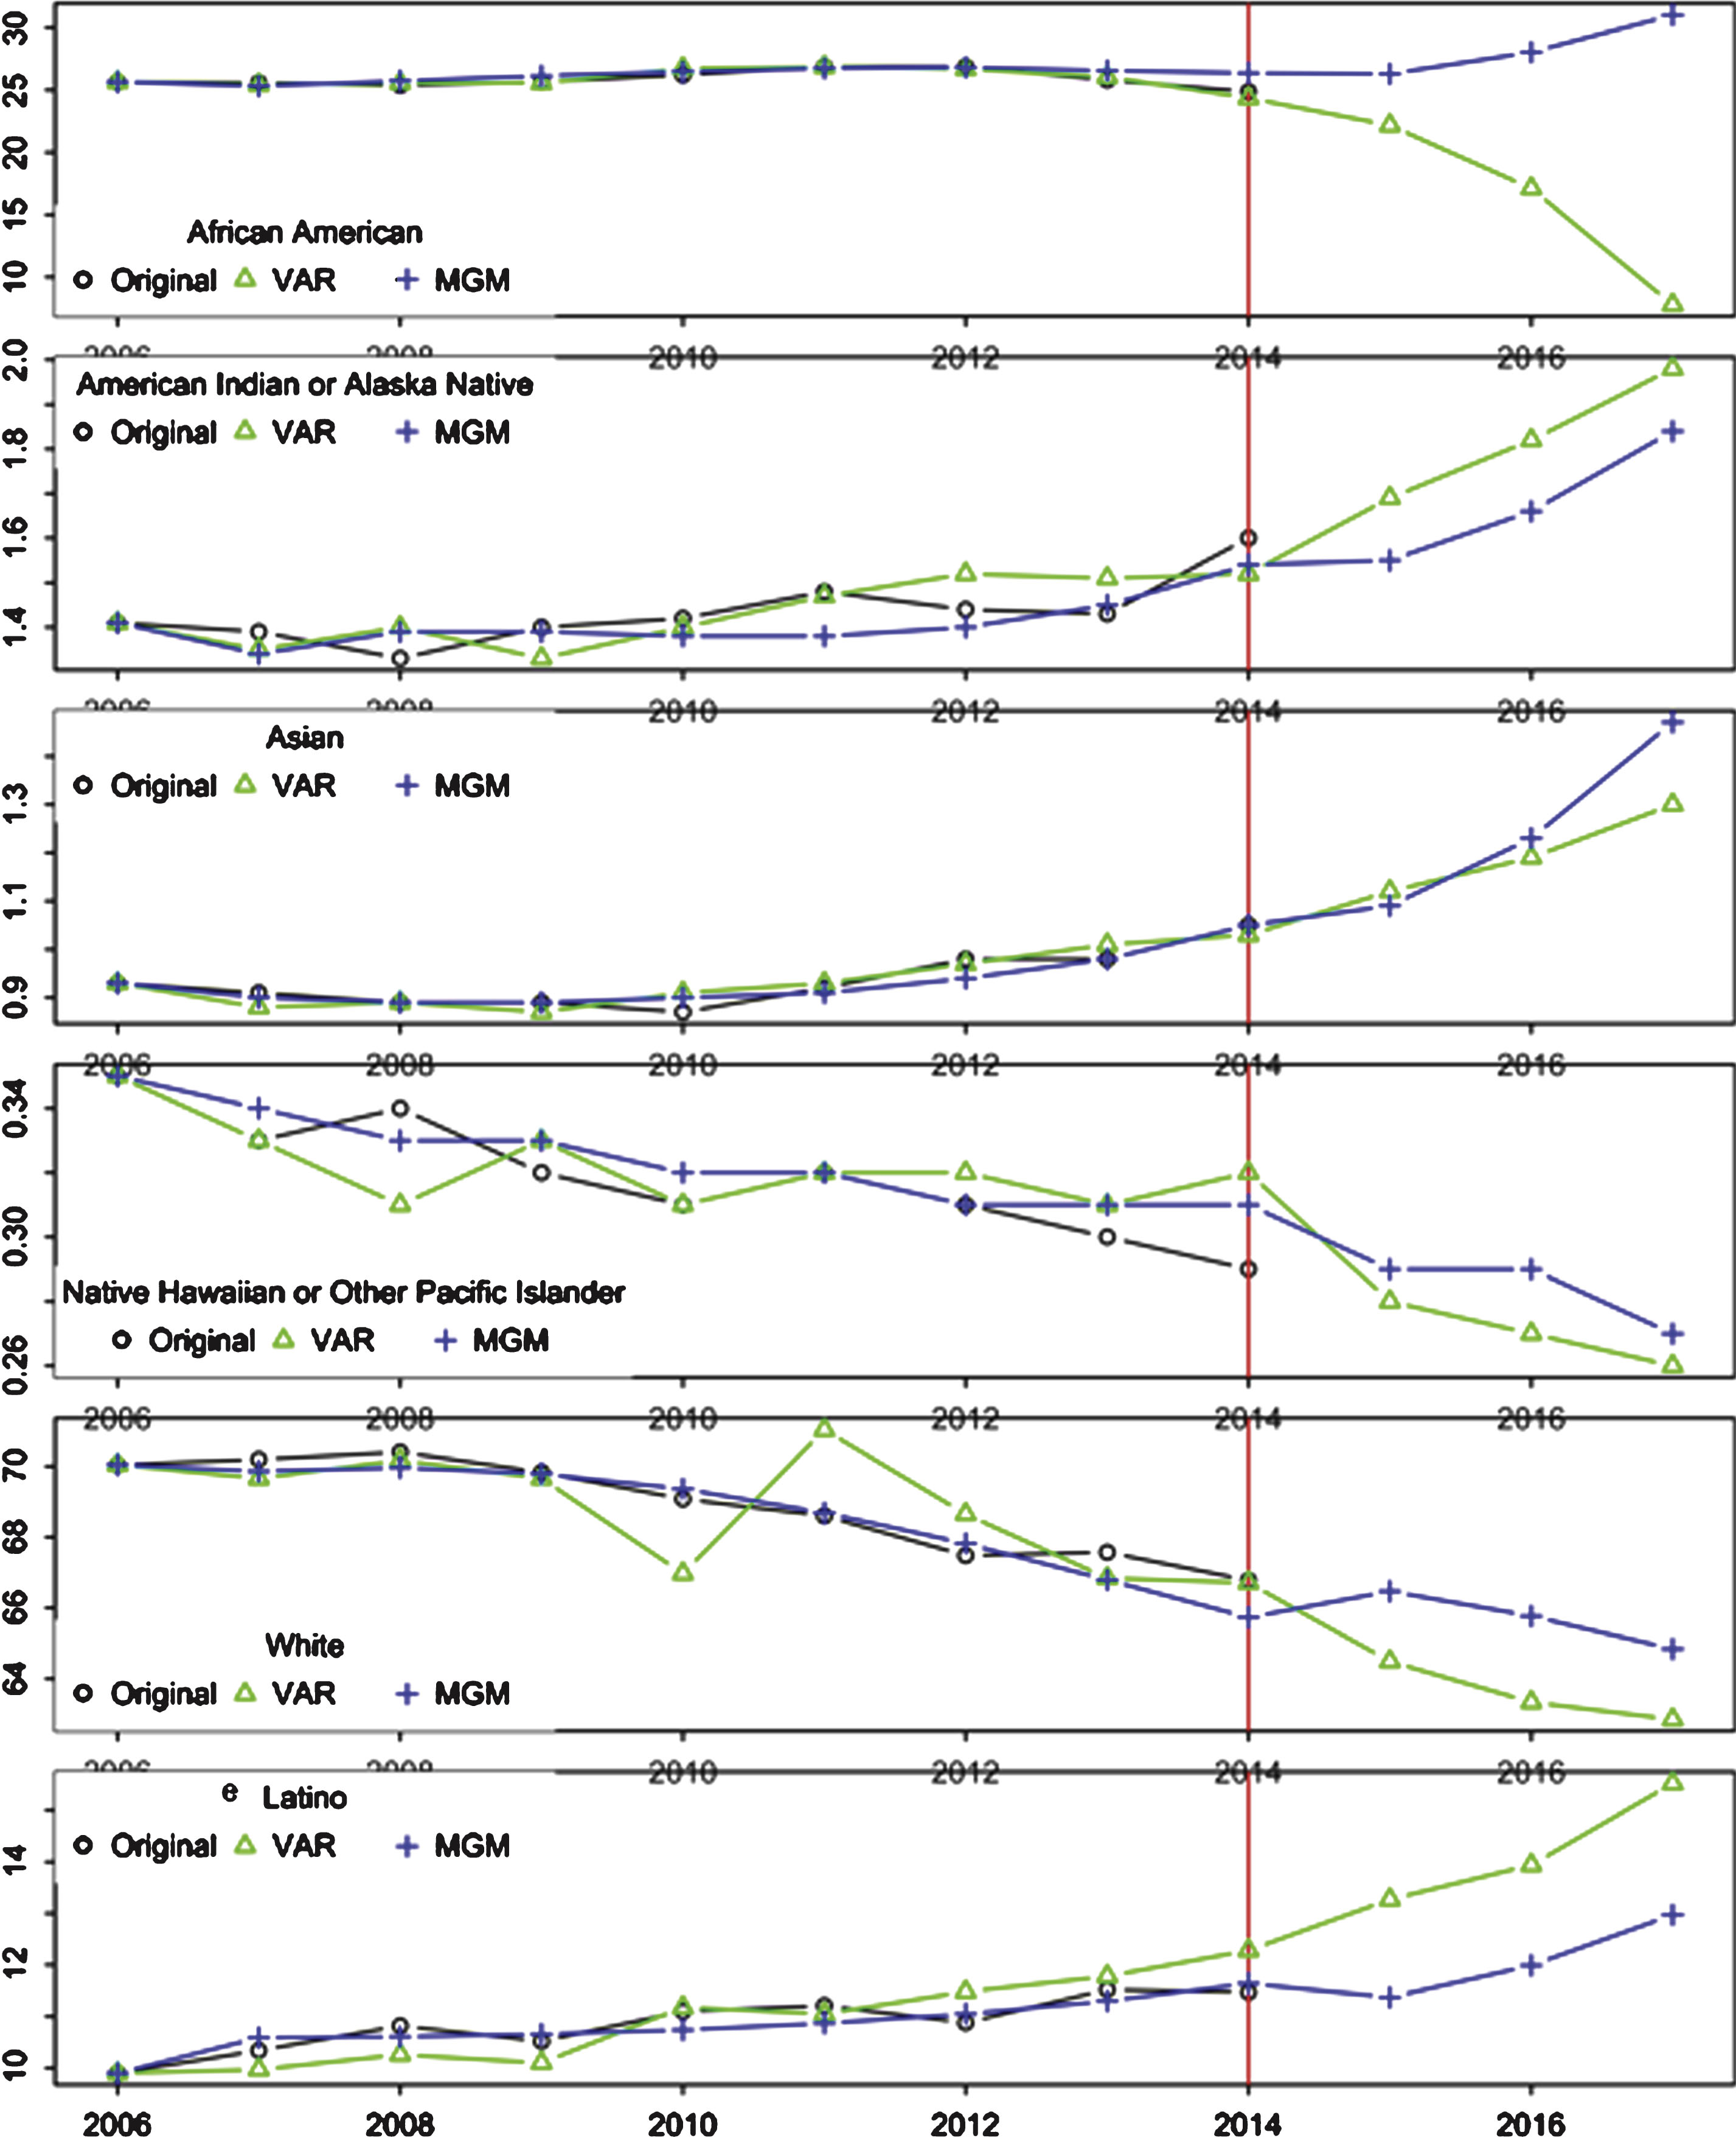
Table 1
The frequency and percent of new unduplicated SVRA applicants and foreign born individuals in the U.S. by race/ethnicity and fiscal year
| Year | Time | RSA | Foreign Born Population | ||
| series |
| % |
| % | |
| African American or Black | |||||
| 2006 | 1 | 41560 | 25.65 | 2928728 | 7.8 |
| 2007 | 2 | 41426 | 25.60 | 2968656 | 7.8 |
| 2008 | 3 | 43148 | 25.38 | 3074836 | 8.1 |
| 2009 | 4 | 41695 | 25.65 | 2811758 | 7.3 |
| 2010 | 5 | 43726 | 26.21 | 3316336 | 8.3 |
| 2011 | 6 | 42181 | 26.89 | 3391740 | 8.4 |
| 2012 | 7 | 40553 | 26.88 | 3470096 | 8.5 |
| 2013 | 8 | 37669 | 25.80 | 3555934 | 8.6 |
| 2014 | 9 | 33400 | 24.88 | 3679386 | 8.7 |
| American Indian or Alaska Native | |||||
| 2006 | 1 | 2285 | 1.41 | 150191 | 0.4 |
| 2007 | 2 | 2249 | 1.39 | 494776 | 1.3 |
| 2008 | 3 | 2261 | 1.33 | 151844 | 0.4 |
| 2009 | 4 | 2276 | 1.40 | 231103 | 0.6 |
| 2010 | 5 | 2369 | 1.42 | 159823 | 0.4 |
| 2011 | 6 | 2322 | 1.48 | 121134 | 0.3 |
| 2012 | 7 | 2172 | 1.44 | 163299 | 0.4 |
| 2013 | 8 | 2088 | 1.43 | 124044 | 0.3 |
| 2014 | 9 | 2148 | 1.6 | 169167 | 0.4 |
| Asian | |||||
| 2006 | 1 | 1507 | 0.93 | 8786183 | 23.4 |
| 2007 | 2 | 1473 | 0.91 | 8905968 | 23.4 |
| 2008 | 3 | 1513 | 0.89 | 8996742 | 23.7 |
| 2009 | 4 | 1447 | 0.89 | 6971619 | 18.1 |
| 2010 | 5 | 1451 | 0.87 | 9789184 | 24.5 |
| 2011 | 6 | 1443 | 0.92 | 10013709 | 24.8 |
| 2012 | 7 | 1478 | 0.98 | 10328638 | 25.3 |
| 2013 | 8 | 1431 | 0.98 | 10585105 | 25.6 |
| 2014 | 9 | 1413 | 1.05 | 11080450 | 26.2 |
| Native Hawaiian or Other Pacific Islander | |||||
| 2006 | 1 | 567 | 0.35 | 75096 | 0.2 |
| 2007 | 2 | 534 | 0.33 | 114179 | 0.3 |
| 2008 | 3 | 578 | 0.34 | 113883 | 0.3 |
| 2009 | 4 | 520 | 0.32 | 115552 | 0.3 |
| 2010 | 5 | 517 | 0.31 | 79912 | 0.2 |
| 2011 | 6 | 502 | 0.32 | 121134 | 0.3 |
| 2012 | 7 | 468 | 0.31 | 122474 | 0.3 |
| 2013 | 8 | 438 | 0.30 | 124044 | 0.3 |
| 2014 | 9 | 393 | 0.29 | 126875 | 0.3 |
| White | |||||
| 2006 | 1 | 113485 | 70.04 | 17009148 | 45.3 |
| 2007 | 2 | 113583 | 70.19 | 17393280 | 45.7 |
| 2008 | 3 | 119686 | 70.40 | 18562897 | 48.9 |
| 2009 | 4 | 113510 | 69.83 | 19489720 | 50.6 |
| 2010 | 5 | 115245 | 69.08 | 19138854 | 47.9 |
| 2011 | 6 | 107610 | 68.60 | 19502506 | 48.3 |
| 2012 | 7 | 101804 | 67.48 | 19677485 | 48.2 |
| 2013 | 8 | 98654 | 67.57 | 19847072 | 48.0 |
| 2014 | 9 | 89047 | 66.33 | 20088602 | 47.5 |
| Other | |||||
| 2006 | 1 | 2609 | 1.61 | 8560896 | 22.8 |
| 2007 | 2 | 2557 | 1.58 | 8525371 | 22.4 |
| 2008 | 3 | 2822 | 1.66 | 7022773 | 18.5 |
| 2009 | 4 | 3088 | 1.90 | 8974516 | 23.3 |
| 2010 | 5 | 3503 | 2.10 | 7431789 | 18.6 |
| 2011 | 6 | 2808 | 1.79 | 7268015 | 18.0 |
| 2012 | 7 | 4375 | 2.90 | 7144315 | 17.5 |
| Total | |||||
| 2013 | 8 | 5723 | 3.92 | 7111867 | 17.2 |
| 2014 | 9 | 7855 | 5.85 | 7189605 | 17.0 |
| 2006 | 1 | 162029 | 100 | 37547789 | 100 |
| 2007 | 2 | 161822 | 100 | 38059694 | 100 |
| 2008 | 3 | 170008 | 100 | 37960935 | 100 |
| 2009 | 4 | 162552 | 100 | 38517234 | 100 |
| 2010 | 5 | 166829 | 100 | 39955854 | 100 |
| 2011 | 6 | 156866 | 100 | 40377860 | 100 |
| 2012 | 7 | 150866 | 100 | 40824658 | 100 |
| 2013 | 8 | 146003 | 100 | 41348066 | 100 |
| 2014 | 9 | 134256 | 100 | 42291794 | 100 |
| Hispanic or Latino | |||||
| 2006 | 1 | 16041 | 9.90 | 17722556 | 47.2 |
| 2007 | 2 | 16732 | 10.34 | 18078355 | 47.5 |
| 2008 | 3 | 18395 | 10.82 | 17803679 | 46.9 |
| 2009 | 4 | 17100 | 10.52 | 22725168 | 59.0 |
| 2010 | 5 | 18518 | 11.10 | 18819207 | 47.1 |
| 2011 | 6 | 17585 | 11.21 | 18816083 | 46.6 |
| 2012 | 7 | 16414 | 10.88 | 18860992 | 46.2 |
| 2013 | 8 | 16820 | 11.52 | 18978762 | 45.9 |
| 2014 | 9 | 15404 | 11.47 | 19327350 | 45.7 |
Table 2
The models’ predictive accuracy performance- Absolute Mean Percentage Error (AMPE)
| RACE / Ethnicity | VAR | MGM(1, 2) |
| African American/Black | 1.87 | 2.88 |
| AI/AN | 2.71 | 2.69 |
| Asian | 1.51 | 1.24 |
| NH/OPI | 6.08 | 4.58 |
| White | 3.60 | 2.09 |
| Total | 2.75 | 1.94 |
| Latino | 4.27 | 3.84 |
| Mean | 3.25 | 2.75 |
Note: AI/AN = American Indian or Alaska Native, NH/OPI =Native Hawaiian or Other Pacific Islander.
Table 3
The predictive (2006–2014) and forecast model (2015–2017) for the number of new applications by race and ethnicity and time series
| Year | Time series | RSA | VAR | MGM |
| African American or Black | ||||
| 2006 | 1 | 41560 | 41560 | 41560 |
| 2007 | 2 | 41426 | 42333 | 42016 |
| 2008 | 3 | 43148 | 41914 | 42681 |
| 2009 | 4 | 41695 | 43054 | 43094 |
| 2010 | 5 | 43726 | 43279 | 43134 |
| 2011 | 6 | 42181 | 42028 | 42625 |
| 2012 | 7 | 40553 | 39837 | 41318 |
| 2013 | 8 | 37669 | 37535 | 38858 |
| 2014 | 9 | 33400 | 33820 | 35682 |
| 2015 (F) | 10 | 28290 (–16.35%) | 34782 (–2.52%) | |
| 2016 (F) | 11 | 20420 (–39.62%) | 34752 (–2.61%) | |
| 2017 (F) | 12 | 8557 (–74.70%) | 33716 (–5.51%) | |
| American Indian or Alaska Native | ||||
| 2006 | 1 | 2285 | 2285 | 2285 |
| 2007 | 2 | 2249 | 2247 | 2222 |
| 2008 | 3 | 2261 | 2290 | 2303 |
| 2009 | 4 | 2276 | 2232 | 2286 |
| 2010 | 5 | 2369 | 2257 | 2248 |
| 2011 | 6 | 2322 | 2304 | 2205 |
| 2012 | 7 | 2172 | 2266 | 2162 |
| 2013 | 8 | 2088 | 2176 | 2120 |
| 2014 | 9 | 2148 | 2113 | 2079 |
| 2015 (F) | 10 | 2161 (2.27%) | 2109 (1.44%) | |
| 2016 (F) | 11 | 2174 (2.89%) | 2054 (–1.20%) | |
| 2017 (F) | 12 | 2182 (3.27%) | 2000 (–3.80%) | |
| Asian | ||||
| 2006 | 1 | 1507 | 1507 | 1507 |
| 2007 | 2 | 1473 | 1468 | 1487 |
| 2008 | 3 | 1513 | 1460 | 1479 |
| 2009 | 4 | 1447 | 1467 | 1470 |
| 2010 | 5 | 1451 | 1472 | 1461 |
| 2011 | 6 | 1443 | 1448 | 1452 |
| 2012 | 7 | 1478 | 1444 | 1443 |
| 2013 | 8 | 1431 | 1449 | 1434 |
| 2014 | 9 | 1413 | 1437 | 1424 |
| 2015 (F) | 10 | 1428 (–0.63%) | 1487 (4.42%) | |
| 2016 (F) | 11 | 1423 (–0.97%) | 1525 (7.09%) | |
| 2017 (F) | 12 | 1425 (–0.83%) | 1598 (12.20%) | |
| Native Hawaiian or Other Pacific Islander | ||||
| 2006 | 1 | 567 | 567 | 567 |
| 2007 | 2 | 534 | 548 | 563 |
| 2008 | 3 | 578 | 513 | 551 |
| 2009 | 4 | 520 | 561 | 538 |
| 2010 | 5 | 517 | 499 | 523 |
| 2011 | 6 | 502 | 494 | 506 |
| 2012 | 7 | 468 | 479 | 485 |
| 2013 | 8 | 438 | 442 | 459 |
| 2014 | 9 | 393 | 442 | 425 |
| 2015 (F) | 10 | 358(–19.00%) | 401(–5.65%) | |
| 2016 (F) | 11 | 324(–26.70%) | 354(–16.70%) | |
| 2017 (F) | 12 | 287(–35.06%) | 296(–30.35%) | |
| White | ||||
| 2006 | 1 | 113485 | 113485 | 113485 |
| 2007 | 2 | 113583 | 116023 | 115941 |
| 2008 | 3 | 119686 | 114928 | 116001 |
| 2009 | 4 | 113510 | 117304 | 115055 |
| 2010 | 5 | 115245 | 108353 | 112941 |
| 2011 | 6 | 107610 | 111149 | 109481 |
| 2012 | 7 | 101804 | 102508 | 104476 |
| 2013 | 8 | 98654 | 96253 | 97709 |
| 2014 | 9 | 89654 | 92628 | 88940 |
| 2015 (F) | 10 | 82283 (–11.17%) | 87430 (–1.69%) | |
| 2016 (F) | 11 | 75626 (–18.35%) | 81502 (–6.78%) | |
| 2017 (F) | 12 | 69130 (–25.36%) | 70494 (–13.5%) | |
| Total | ||||
| 2006 | 1 | 162029 | 162029 | 162029 |
| 2007 | 2 | 161822 | 166548 | 165956 |
| 2008 | 3 | 170008 | 163795 | 165816 |
| 2009 | 4 | 162552 | 168401 | 164861 |
| 2010 | 5 | 166829 | 161792 | 162828 |
| 2011 | 6 | 156866 | 156485 | 159376 |
| 2012 | 7 | 150866 | 149317 | 154059 |
| 2013 | 8 | 146003 | 144003 | 146294 |
| 2014 | 9 | 134256 | 138862 | 135319 |
| 2015 (F) | 10 | 127583 (–8.12%) | 133043 (–1.68%) | |
| 2016 (F) | 11 | 119400 (–5.71%) | 123920 (–8.42%) | |
| 2017 (F) | 12 | 110000 (–10.47%) | 108713 (–19.02%) | |
| Latino / Hispanic | ||||
| 2006 | 1 | 16041 | 16041 | 16041 |
| 2007 | 2 | 16732 | 16598 | 17569 |
| 2008 | 3 | 18395 | 16807 | 17592 |
| 2009 | 4 | 17100 | 17012 | 17574 |
| 2010 | 5 | 18518 | 18087 | 17494 |
| 2011 | 6 | 17585 | 17299 | 17325 |
| 2012 | 7 | 16414 | 17143 | 17024 |
| 2013 | 8 | 16820 | 16959 | 16530 |
| 2014 | 9 | 15404 | 17058 | 15754 |
| 2015 (F) | 10 | 16924 (–0.79%) | 15468 (–1.82%) | |
| 2016 (F) | 11 | 16639 (–2.45%) | 14855 (–5.71%) | |
| 2017 (F) | 12 | 17073 (0.09%) | 14104 (–10.47%) |

