
Heterogeneity and team performance: Evaluating the effect of cultural diversity in the world’s top soccer league
Abstract
This paper uses data from the UEFA Champions League (2003–2012) to study the impact of diversity on team performance. Results indicate that more heterogeneous teams outperform less diverse sides; a one-standard deviation increase in cultural diversity (measured by linguistic distance) can double a team’s goal differential over the course of the tournament. One threat to our conclusions is that certain teams have greater resources to search the world for talent. We address this issue by controlling for players’ transfer values, quality ratings, and exploiting exogenous variation in diversity generated by differences in the non-European player quotas of national soccer leagues.
1Introduction
Questions regarding the costs and benefits of diversity for organizational performance not only affect the management of teams in sports but also broader debates over immigration, university admissions, and business hiring decisions. Almost all interlocutors recognize the benefits of diverse talents, perspectives, and experiences; particularly in activities and areas that require creative problem solving among groups. Nevertheless, there are legitimate questions about the costs that can arise when teams must negotiate multiple language and cultural road-blocks. Previous work on the subject has generated starkly different conclusions, primarily due to difficulties in identifying common metrics of performance, resolving omitted variable bias posed by hard to measure properties such as talent and entrepreneurship, and an inability to resolve bias caused by diverse workers selecting into more successful organizations.
Soccer is a sport where players depend on each other to perform a collective task. In addition, modern professional soccer exhibits a high degree of labor market internationalization. As such, the existence of several studies that examine the effect of diversity on team performance focusing on the sport is not surprising (Andresen and Altmann, 2006; Brandes et al., 2009; Franck and Nuesch, 2010; Haas and Nuesch, 2012). The empirical evidence gathered by these investigations, however, is also characterized by conflicting and/or mixed results.1 The inconclusiveness of these findings raises the question: does diversity affect soccer teams’ performance? Unfortunately, we cannot tell, because existing studies have (1) ignored contextual covariates; (2) failed to account for self-selection effects; and (3) focused exclusively on the German league, one of the most diverse leagues in Europe, limiting variation and compromising their external validity.
In this paper, we resolve these problems by examining how teams from the “Big Five” European soccer leagues (England, France, Germany, Italy, and Spain) fared in the Union of European Football Associations (UEFA) Champions League tournament between 2003 and 2012. The tournament is an annual competition that crowns the very best team in Europe from the top three or four teams in each UEFA’s member leagues. Operationalizing the outcome variable in this context is clear cut, as every team is trying to score as many goals and win as many games as possible. Many confounders, which dog other analyses, are addressed by the structure of competition. Teams field the exact number of players, literally on the same playing field, and abide by common underlying rules provided centrally by the F é d é ration Internationale de Football Association (FIFA), the sport’s international governing body. We thus take advantage of the entrance of these international players, all operating under a common institutional environment and incentive structure, to study the impact of group diversity on performance.
Critical to our research design, these teams are comprised of players from fifty countries, but vary greatly in how important diversity is to team composition. In addition, to reach the tournament, each team must place in the top three or four positions of its domestic league, surviving a winnowing process that leaves only the most prestigious, wealthiest, and talented teams in the world. To impose even more selectivity, we limit our analysis to only those teams that emerged from the Big Five leagues in Europe, the most popular and lucrative soccer operations.
The winnowing process mitigates threats of unobserved heterogeneity and reverse causality. We are only studying diversity among the richest and well-known clubs in the world, all of which operate extensive global scouting programs.2 The same goes for available talent. At the onset of the 2012 tournament, according to the European Club Elo Rating system (Schiefler, 2014), the sixteen teams in our dataset were all ranked among the top thirty clubs in the world, including nine of the top ten. The median team in our dataset includes four of the Guardian top 100 players in the world (Sedghi, 2013). Under these conditions, there is less worry that diversity simply results from attracting the top talent in the world, or that more diverse teams find it easier to recruit globally. In short, the UEFA Champion’s League places similarly, excellent teams in head-to-head battles for goals and wins. It is therefore a contained environment where we can best separate the positive benefits of diversity from talent.
Even within the UEFA tournament, however, there is still variance in team payroll and prestige. Therefore, a potential threat to our research is that richer teams may have the resources to seek talent from virtually every nation in the world. As a result, they may end up with a highly heterogeneous team (even if managers are not explicitly interested in enhancing the team’s diversity).3 If this were the case, then diversity would be merely a function of team wealth rather than a separate factor in team performance.
To ensure that our analysis is not at risk of this omitted variable bias, we control for players’ transfer values as well as for the talent of the teams’ lineups. We also test the robustness of our results to endogeneity between diversity and transfer values. In particular, we estimate a structural equation model where we exploit exogenous variation in diversity given by the wide differences in non-European player quotas applied by the “Big Five” national soccer leagues.
Our results indicate that more heterogeneous teams outperform less diverse sides. All else equal, we find that during the group stage of the UEFA Champions League, a one-standard deviation increase in the average team’ cultural diversity (measured by linguistic distance) may double the team’s net goal differential. And, for those teams that advance to the competition’s finals, a one standard deviation increase in diversity is associated with an additional 1.71 to 3.5 net goals over the tournament. Because a large number of games are decided by a single goal, by turning a tie to a win (or, a loss to a tie), the addition of culturally inherent skills could certainly mean the difference between a team advancing in the tournament and heading home early.
The remainder of this paper is organized as follows. In Section 1, we discuss the relationship between diversity and team performance. In Section 2, we introduce the data used in this study. In Section 3, we present our main empirical findings, while in Section 4 we introduce a structural equation model where we exploit exogenous variation in diversity and team value. A final section concludes.
2Diversity and team performance
Social scientists have increasingly acknowledged the effects of diversity on team performance stressing different dimensions of heterogeneity including differences in skills and abilities, in ethnolinguistic and religious backgrounds, as well as national, cultural, and genetic-based diversity.4 Indeed, analyzing the effect of diversity on team production has been a major research topic both in social psychology (Steiner, 1972) and in the fields of labor and personnel economics (Kremer, 1993; Lazear, 1999; Earley and Mosakowski, 2000; Prat, 2002; Brandes et al.,2009).
Critically for our paper, an important strand of this literature focuses on differences in skills and abilities. For example, Hong and Page (2001) and Hamilton et al. (2003) argue that heterogeneous teams are more productive, with average ability held constant. Diversity in skills and abilities allows teams to draw on different sources of information and enables creative problem solving. Therefore, a heterogeneous team of workers with different levels of skills can outperform a homogeneous team of high-skilled workers from similar backgrounds (Page, 2007).5
Team members may also differ in the way they interpret problems and use their abilities to solve them. As such, another strand of the literature emphasizes differences in backgrounds, experiences, and heuristics as important sources of teams’ heterogeneity. Lazear (1999) examines the costs and benefits associated with cultural diversity among team members. On the one hand, a team may benefit from the introduction of additional (culturally inherent) skills within its members. On the other hand, combining members with different backgrounds may hamper the team’s cooperation and collaboration. In addition to “language barriers,” costs may also be associated with differences in general perceptions among team members, such as a different value system and/or norms (Williams and O’Reilly 1998; Lazear, 1999).6 The benefits and costs associated with membership heterogeneity imply that, from the point of view of productivity maximization, teams face the possibility of a trade-off regarding the optimal degree of diversity (Lazear, 1999). A number of studies on organizational performance have examined the trade-off associated with cultural mixing (Williams and O’Reilly 1998; Richard et al., 2002).
As we noted above, the empirical evidence for diversity is extremely mixed. Some studies claim that homogenous teams are more productive (O’Reilly and Flatt, 1989; Ancona and Caldwell, 1992); while others find that heterogeneous groups, especially when there is much uncertainty and the stakes are high, do better (Mello and Ruckes, 2006; Gruenfeld et al., 1996; Hamilton et al., 2003).7
What is becoming clear from this is that the specific impact of diversity on performance may vary across contexts (Watson et al., 1993). In particular, the influence of diversity on team performance depends on the nature of the underlying task. For example, if developing innovations is the goal, a heterogeneous team may outperform a homogeneous one. Alternatively, if agreeing, getting along, and fitting well together are essential to fulfilling the task, a more homogeneous team will likely be more successful.
Micro-foundations for the relationship between individual heterogeneity and productivity are best established by Prat (2002), who demonstrates that workforce homogeneity is determined by the type of interaction between a team’s members. Activities in which a good fit between various units is the first concern (for example, bike manufacturing where its different parts have to be assembled), should have a homogeneous workforce in order to maximize coordination. In contrast, activities where problems are identified, but team members must find creative ways to solve them (i.e. research and design projects) should have a more heterogeneous workforce in order to maximize the chance of developing successful innovations (Prat, 2002).8
2.1The performance of multi-national soccer teams
Unlike teams in other professional sports, European soccer teams, are truly global. In 1995, the “Bosman ruling” enabled European soccer teams to acquire talent from virtually every nation in the world, and removed restrictions on internal migration on players within Europe.9 As such, managers can effectively alter their team’s performance by choosing players from a broader talent pool. Indeed, as Anderson and Sally (2013) note, one of the things that characterizes teams in these elite leagues is that great players play with other great players. Or, as they put it: “Zidanes play with Zidanes” (Anderson and Sally, 2013 : 213).
More important is that the effect of group diversity on performance depends on the type of team member interaction. In this respect, soccer teams are characterized by a high degree of interdependent worker productivity. So, even teams that are composed of equally talented players may accrue additional benefits when their members differ in the way they interpret problems and use their skills to solve them. The variation in problem-solving abilities likely stems from players’ exposure to different training methods and styles of play. As Brandes et al. (2009) note, country of origin captures in soccer more attributes (e.g., nation-specific traits) about a player than just his nationality. Styles of play (e.g. attacking versus counterattacking), defensive tactics (e.g. man-to-man, pure zone, or zone with a sweeper), strategies for set pieces (free kicks/corner kicks), and even the organization of players on the field differ remarkably across countries. Therefore, when a player schooled in particular countries’ soccer style travels abroad to play for another professional team, he takes this culturally specific contentwith him.
Perhaps the most famous example of this spread of cultural knowledge was the importing of Total Football into European Soccer in the 1970s, which altered the traditional focus on nominal positions (Winner, 2012). In a Total Football framework, each player on the team is capable of handling the ball, and players switch positions fluidly, as game play demands it. For instance, defenders may venture forward, as midfielders or even strikers drop back to replace them. Players move in and out of open spaces, and the ball moves rapidly through multiple series of short passes until opportunities can be found for attack when the team presses forward (Drejer, 2001). The strategy was proactive and aggressive as opposed to the prevailing counter-attacking play used in Europe at the time. The archetype of this counterattack was the Italian style known as Catenaccio (“the padlock”), which focused on a strong defense that held their positions, and a counterpunching style, where balls recovered on defense were pushed up rapidly (often with long passes) to two attackers (strikers), positioned high up the field (Winner, 2012).10
Total Football spread to F.C. Barcelona in Spain after Ajax products Michels and star player Johan Cruyff moved to the team in 1971 and 1973 respectively. The style proved successful, leading to four La Liga victories under their joint tenure and a European Cup victory in 1979 (Lechner, 2007). An evolutionary branch of Total Football lives on today in Barcelona (and other La Liga teams) in what is called the “tiki-taka,” which resembles its predecessors but more emphasis on passing, working the ball through small channels opened up by player movement, and maintaining possession until opportunities can be found for quick strikes (Berrone, 2011; Frias, 2015). Furthermore, Bayern Munich increased their possession and changed their passing patterns, consistent with a tiki-taka style, in 2014 after hiring Barcelona’s former coach, Pep Guardiola.
As these examples demonstrate, when players move from team to team they take these skills with them, transferring the new technology to their fellow players. Even after styles became well known and popular, a diverse labor force is still necessary to install it. Adopting Total Football, for instance, required fundamentally changing the composition of players on the field. Each player had to be capable of handling the ball and be nimble at moving around the field into open space. Teams that had relied on bruising defenders capable of clearing the ball out, but not dribbling or short passing, had to fundamentally rethink their labor force, hiring defenders schooled in a Total Football framework (Frias, 2015). In addition, when a new players’ adopted team decides not to implement the technology he is familiar with immediately, they can still benefit from adding diversity, because they can learn strategies for defending or countering it.
The benefits of diversity notwithstanding, there are obviously costs associated with hiring players from multiple countries. For example, a multi-national soccer team can lead to increasing communication errors in the pitch. In addition, as Kahane et al. (2013) note, players’ cultural and political differences may impose considerable integration costs on the team both on and off the pitch. Take, for example, Sir Alex Ferguson’s negative feelings toward Argentine players. In his autobiography, Manchester United’s former coach admits that he found working with Argentine players quite difficult. Describing his communication difficulties with them, he states “. . . the ones I managed didn’t try particularly hard to speak English. With Verón it was just, ‘Mister’. . . ” (Ferguson, 2013).11
The critical question of course, is to establish the sign of complementarity between actions in soccer. In Prat (2002)’s terms, a team would be better off if its players commit correlated rather than uncorrelated errors, only if their decisions are strategic complements. The “offside trap” tactic is a case in point. It requires that all defenders display high levels of discipline in moving up together in a relatively straight line to interrupt the opposition’s offense. No defender can guarantee the offside trap’s success alone, but each one of them can individually trigger its failure (Franck and Nuesch 2010).
Planned coordination, however, is quite rare in soccer, occurring primarily on off-side traps and set pieces (pre-programmed plays off of corner kicks or free kicks). Everything else is fluid and requires adjustments. Indeed, success in soccer is often determined by movements to create space on the pitch that take place away from the ball, as well as by unpredictable actions rather than by excessive synchronization.12
According to Anderson and Salley (2013), field play accounts for the vast majority of scores in soccer, as opposed to the more structured components of the game. Even more systematically, Lucey et al. (2015) estimate the likelihood of a team scoring using strategic features from an entire season of player and ball tracking data taken from a professional soccer league. The analysis is based on the spatiotemporal patterns of the ten-second window of play before a shot for nearly 10,000 shots. Their findings indicate that in addition to the game phase (i.e. corner, free-kick, open-play, counter attack etc.), strategic features, such as speed of play and interaction with surrounding attacking teammates, affect the likelihood of a team scoring a goal.
Moreover, as Prat (2002) notes, when the decisions of the members of a team mutually offset one another, then, the more one of them searches in a direction, the more the other members should search in other directions. The importance of creatively using the field, finding angles for passes, and identifying weaknesses in the rival team’s defense cannot be understated. That these playing aspects are so valued suggests that workforce heterogeneity should be preferable in soccer, overpowering its costs.
Given the advantages provided by professional soccer for the analysis of diversity and group performance, the existence of several studies that focus on the sport is not surprising. The empirical evidence gathered by these investigations, however, is characterized by conflicting and/or inconclusive findings.
Andresen and Altmann (2006) discover a positive influence of age and race diversity on a team’s sporting success in the Bundesliga (Germany). Also with data from the Bundesliga between 2001 and 2006, Brandes et al. (2009) examine the relationship between team composition and relative success (measured by its league rank at the end of a season). They do not find that national diversity among team members significantly influences a team’s performance. Increasing the number of different nationalities within the defensive block, however, has a negative effect on a team’s success. Using data from the same league during seven consecutive seasons (1999/00 until 2005/06), Haas and Nuesch (2012) find that, holding unobserved seasonal team heterogeneity constant, multinational soccer teams perform worse than teams with less ethnic diversity. Finally, relying on a large series of individual performance statistics for all players appearing in the Bundesliga between 2001 and 2007 provided by the Opta Sports Data Company, Franck and Nuesch (2010) find that both average talent and talent disparity significantly increase team performance.13
The inconclusiveness of these findings raises the question: does diversity affect soccer teams’ performance? Unfortunately, three research difficulties complicate the answers to this question (1) omission of contextual confounders s; (2) severe self-selection effects; and (3) disproportionate emphasis on the German league, one of the most diverse leagues in Europe, limiting variation and compromising their external validity.
While some teams are very heterogeneous, incorporating players from multiple different nationalities, other teams have a majority of domestic players. This variation, however, is unlikely to be random. For example, richer teams face fewer restrictions than poorer ones when engaging a foreign star player (Kuper and Szymanski 2010). A team’s quality is another factor that can influence its composition. Because there is a competitive market for their services, one must consider the possibility that the most talented professional soccer players may only seek to join the most prestigious, and most successful teams in Europe. Dismissing such factors introduces an omitted variable problem that would bias any attempt at measurement that does not account for themexplicitly.
3Data and estimation
We collected information about every player on every team from the Big Five national European soccer leagues (England, France, Germany, Italy, Spain) that competed in the UEFA Champions League between 2003 and 2013 (3,483 observations). We exclude from our sample those teams that did not make it to the group stage.14
The data were obtained from the web-based collaborative database Football-Lineups (2014). This source provides information regarding the nationality of each player in our sample. We treat teams as the unit of analysis by aggregating the player-level data. In each season, teams have a single observation of their tournament performance in a given year. As we are looking at ten years worth of data, in total, our sample contains 168 observations of 41 unique teams.
3.1Dependent variable – (output) team performance during season.
Because most soccer games are very low-scoring and close (Anderson 2010a), focusing on winning percentage can be too blunt. Indeed, the difference between win, loss, or draw may have been caused by one astounding play or minor error that is the soccer equivalent of a coin-flip. Drawing precise statistical lessons from such data can thus be dangerous. To allow for more precision, we employ the goal differential (goals scored minus goals conceded) as our main variable, using information obtained from the Football-Lineups website.
Following the group stage, sixteen teams enter the Champions League’s knockout phase. As such, the teams in our sample do not all play the same number of games. To account for this, we calculate the average goal differential per game played in a given year for each team. This measure offers a more fine-grained analysis of team performance even in games where they lost. In basketball, analysis has demonstrated that point differential can be approximated by a normal distribution and outperforms win-loss records in predicting playoff success (Hollinger, 2002; Stern and Mock, 1998).
A possible concern with this measure is that some teams may rack up a large goal differential in the initial stages of the competition but do not perform nearly as well in subsequent rounds, when the competition becomes more challenging To address this concern, we also consider other output measures, including average points obtained and winning percentage, in some of the specifications presented below.
3.2Independent variable – cultural diversity
Finding the correct measure to capture diversity is not a trivial exercise. There are significant costs and benefits to each choice. We sought a measure that could appropriately capture the benefits of diverse cultural attributes, but also the negative role that diversity can play in team cohesion. For instance, high levels of diversity might impede communication, making it difficult to convey strategies and other information on the field. Similarly, players from widely different cultures might struggle to integrate, creating conflict that may also undermine team productivity.
To appropriately operationalize both the positive and negative aspects of diversity in a single measure, we needed to capture not only the amount of players from different cultures, but also the scale of their differences. In addition, we are interested in the overall team composition rather than in individual players’ attributes. So, for instance, a team from Spain might more easily integrate two Spanish-speaking players from Central America, despite the different cultural origins. Alternatively, a player from France may not find the cultural differences of his teammates in the German Bundesliga as foreign as a player from Sub-Saharan Africa. Simply put, cultural conflicts that might tear apart the fabric of the team would be less likely. Consequently, our measure of diversity has to be more nuanced than simply share of foreign players (which could be all Spanish speakers) or country of origin (which might not adequately capture the cultural distances between teammates). Using those two measures would over-emphasize the positive elements of diversity without adequately reflecting its costs, leading to biased results.15
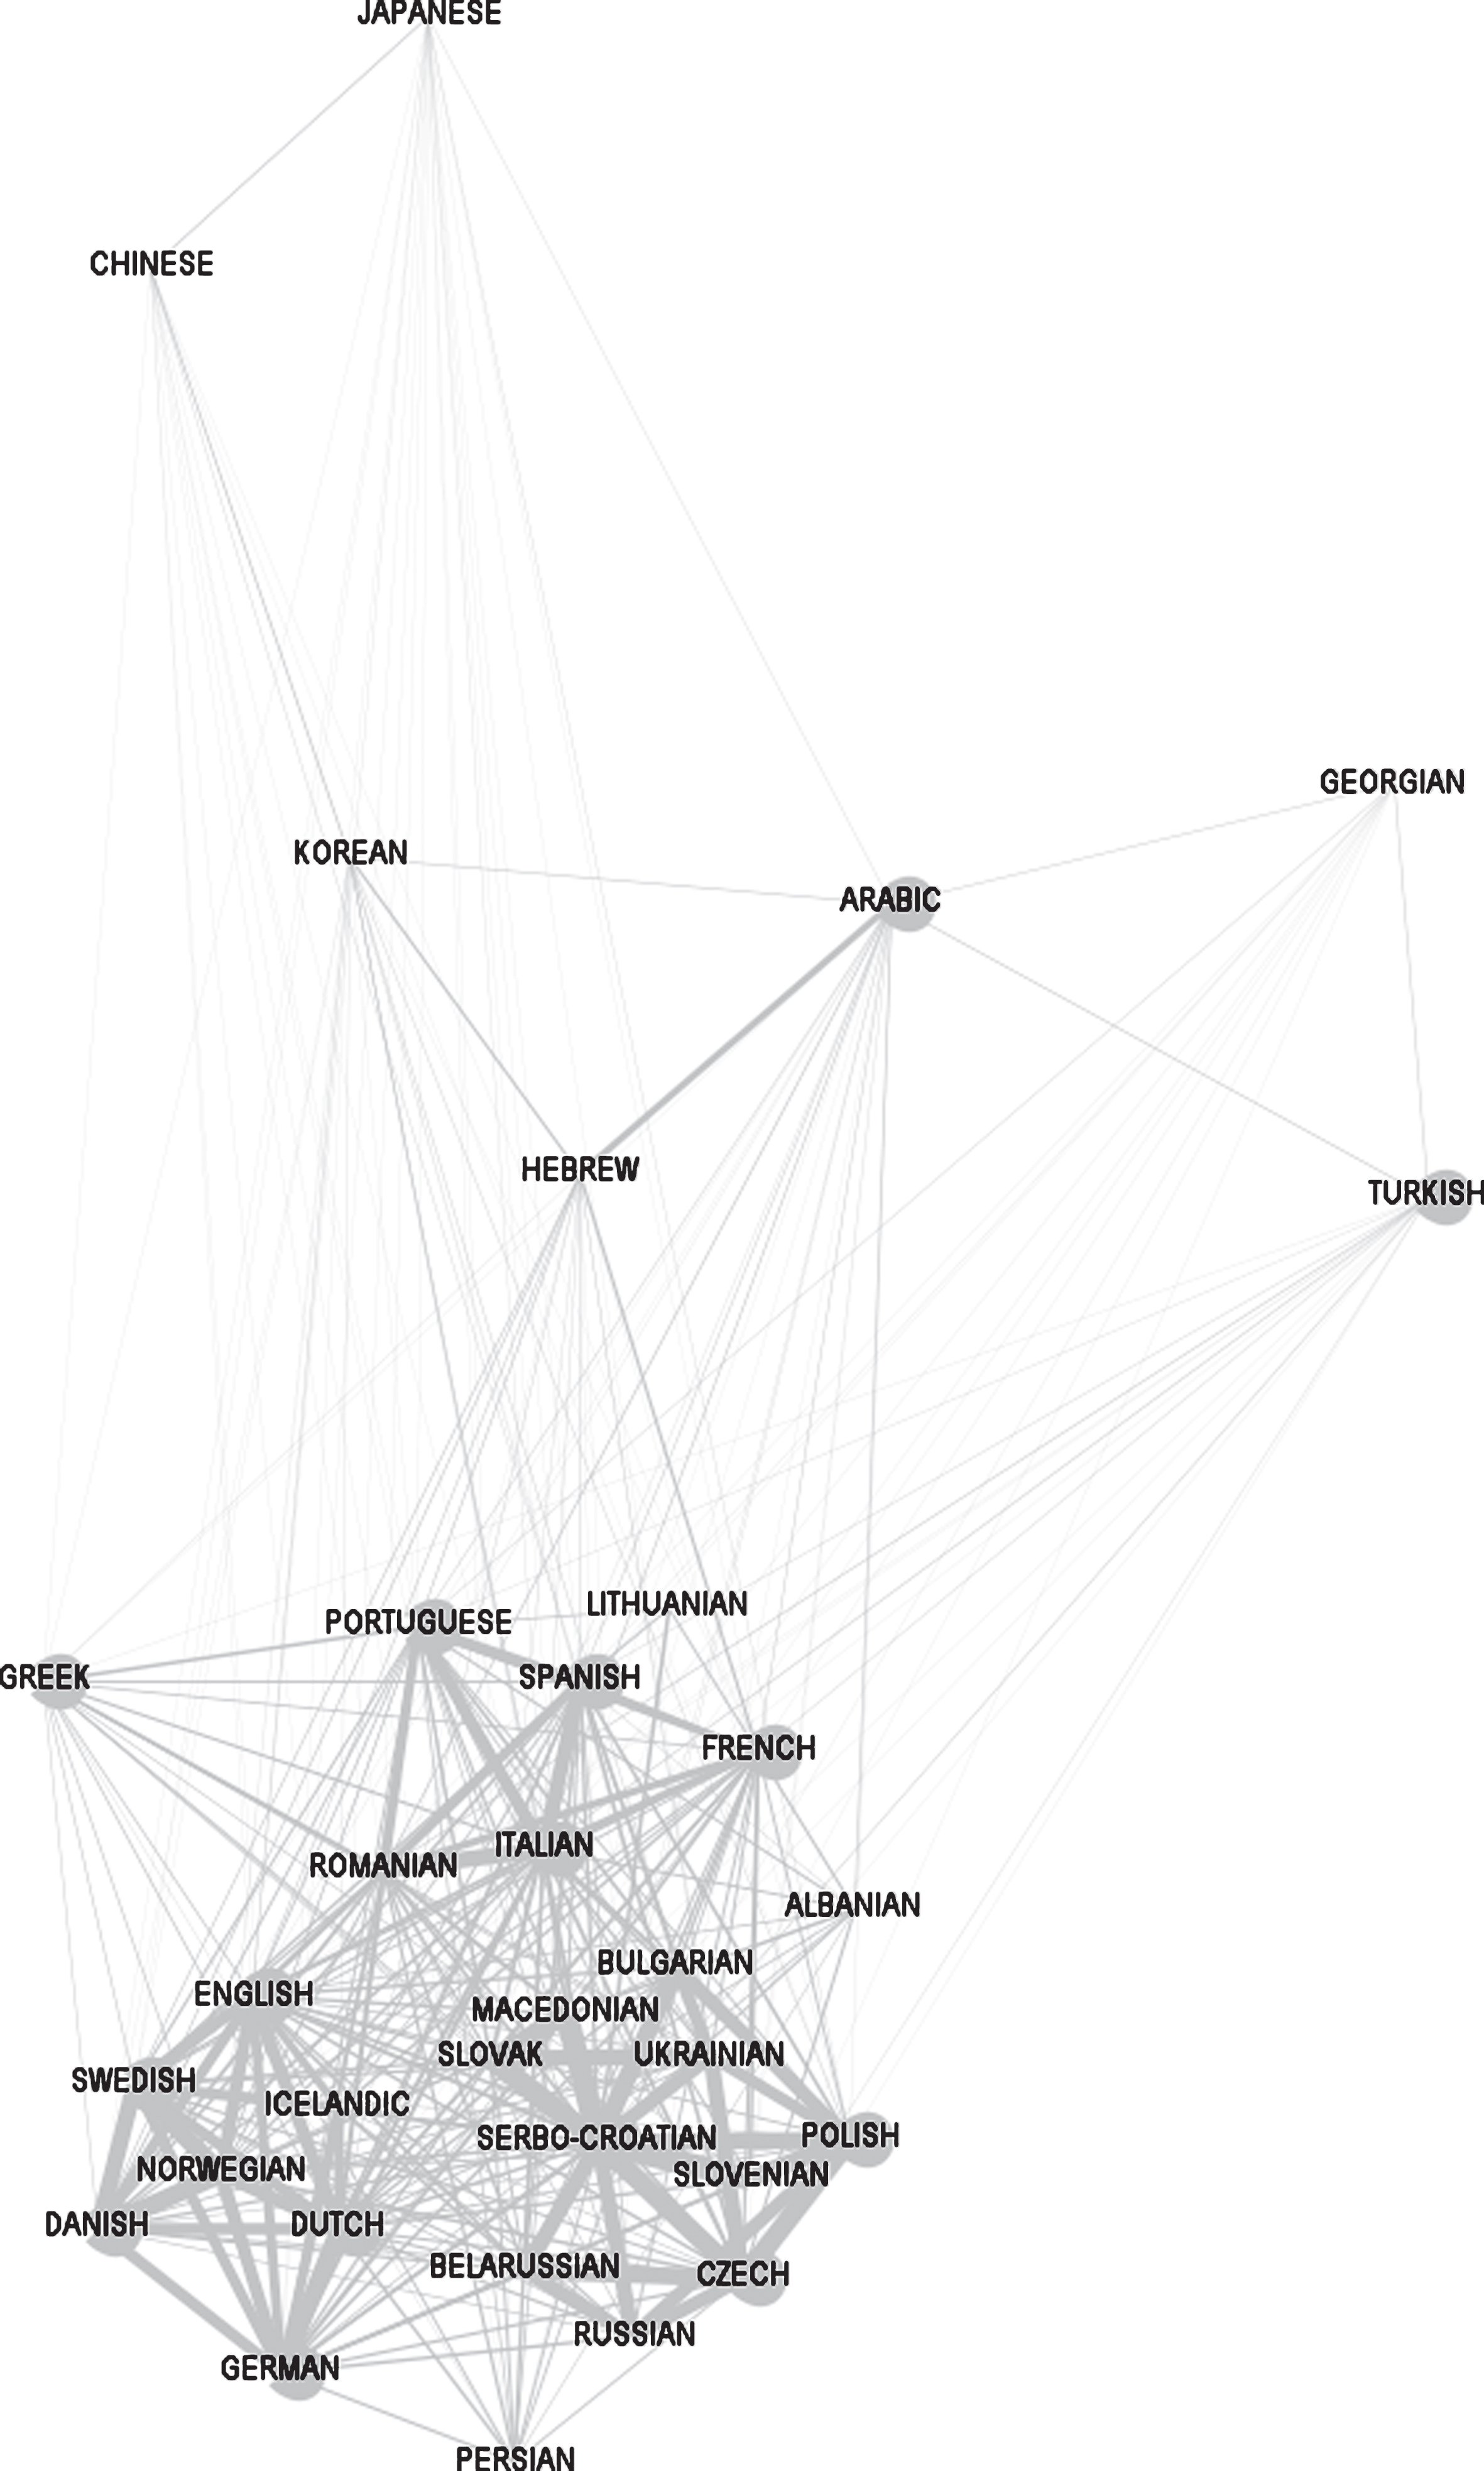
To resolve these problems, we employ “linguistic distance” as our core measure of team heterogeneity. In a method detailed in Bakker et al. (2009), the Automated Similarity Judgment Program (ASJP) calculates the similarity of languages on scale of 0–100 using a set of commonly used words in each language. The program produces a single score for every pair of languages. Under the assumption that each player’s native language is the native language of their home country, we merge the score generated by ASJP to every teammate pair combination on each team. Teammate S from Spain paired with teammate B from Brazil receives a low language distance score. Teammate S paired with teammate R from Russia receives a high language distance score. By averaging across every teammate pair on a team, we create an average language distance score for each team, which represents linguistic diversity on the team. Figure 1 details the construction of the index by showing the distance of each language represented in our dataset and its distance from every other language. Very similar languages receive the thickest lines, corresponding to zero on the ASJP scale. The most distant languages receive a score of 100 and the very thinnest lines.
Fig.1
Illustration of the Linguistic Distance variable for every language represented in the 3,832 players-years included in our data. The thickness of line represents the linguistic distance between two national languages, measured by the number of cognates identified by the Automated Similar Judgment Program (ASJP, Bakker et al. 2009). Very similar languages receive the thickest lines, corresponding to zero on the ASJP scale. The most distance languages receive a score of 100 and the very thinnest lines.
Besides the obvious aspect of ease of communication, this measure captures the broader notion that some skills and knowledge sets are culturally specific. As such, it is an indicator of a team’s cultural diversity. Nevertheless, unlike alternatives, it fairly captures the dangers of integrating cultures that are widely distant from one another together. For robustness, we also consider additional dimensions of heterogeneity including differences in national backgrounds, as well as personality, and genetic-based diversity in specifications presented below.
Figure 2 illustrates how the measure is calculated for each team, using the least (Deportivo La Coruna in 2004) and most diverse (F.C. Wolfsburg 2009) teams in our sample. Each node contains one player on the team. The thicker the line, the closer the languages are on the linguistic distance scale (0–100). For instance, Josue and Grafite both speak Portuguese for VFL Wolsburg, meaning zero distance and the thickest line in the graph. Similar languages are lumped together, creating a gray shaded are when teams have multiple speakers of the same language. Averaging these widths creates our dependent variable. Notice that Deportivo is comprised predominantly of Spanish players, which the team brings up through its farm system, while Wolfsburg relies on a wide array of imported players. Relevant to our theory, the 2008-2009 season proved to be Wolfsburg’s finest ever, as it won the Bundesliga and qualified for the Champions’ League for the first time in its history. The historic team was captained by Josue, a Brazilian, with Grafite, a fellow Brazilian, and Edin Dzeko, a Bosnian, scoring 54 or the team’s 80 goals, and Zvjezdan Misimović, a German-born Bosnian (coded as German in our data), providing 20 assists.
Fig.2
Distance between players for the lowest and highest linguistic distance in our sample of 168 team-years. Each node contains one player on the team. The thicker the line the closer the languages are on the linguistic distance scale (0–100). For instance, Josue and Grafite both speak Portuguese for VFL Wolsburg, meaning zero distance and the thickest line in the graph. Similar languages are lumped together, creating a gray shaded are when teams have multiple speakers of the same language.
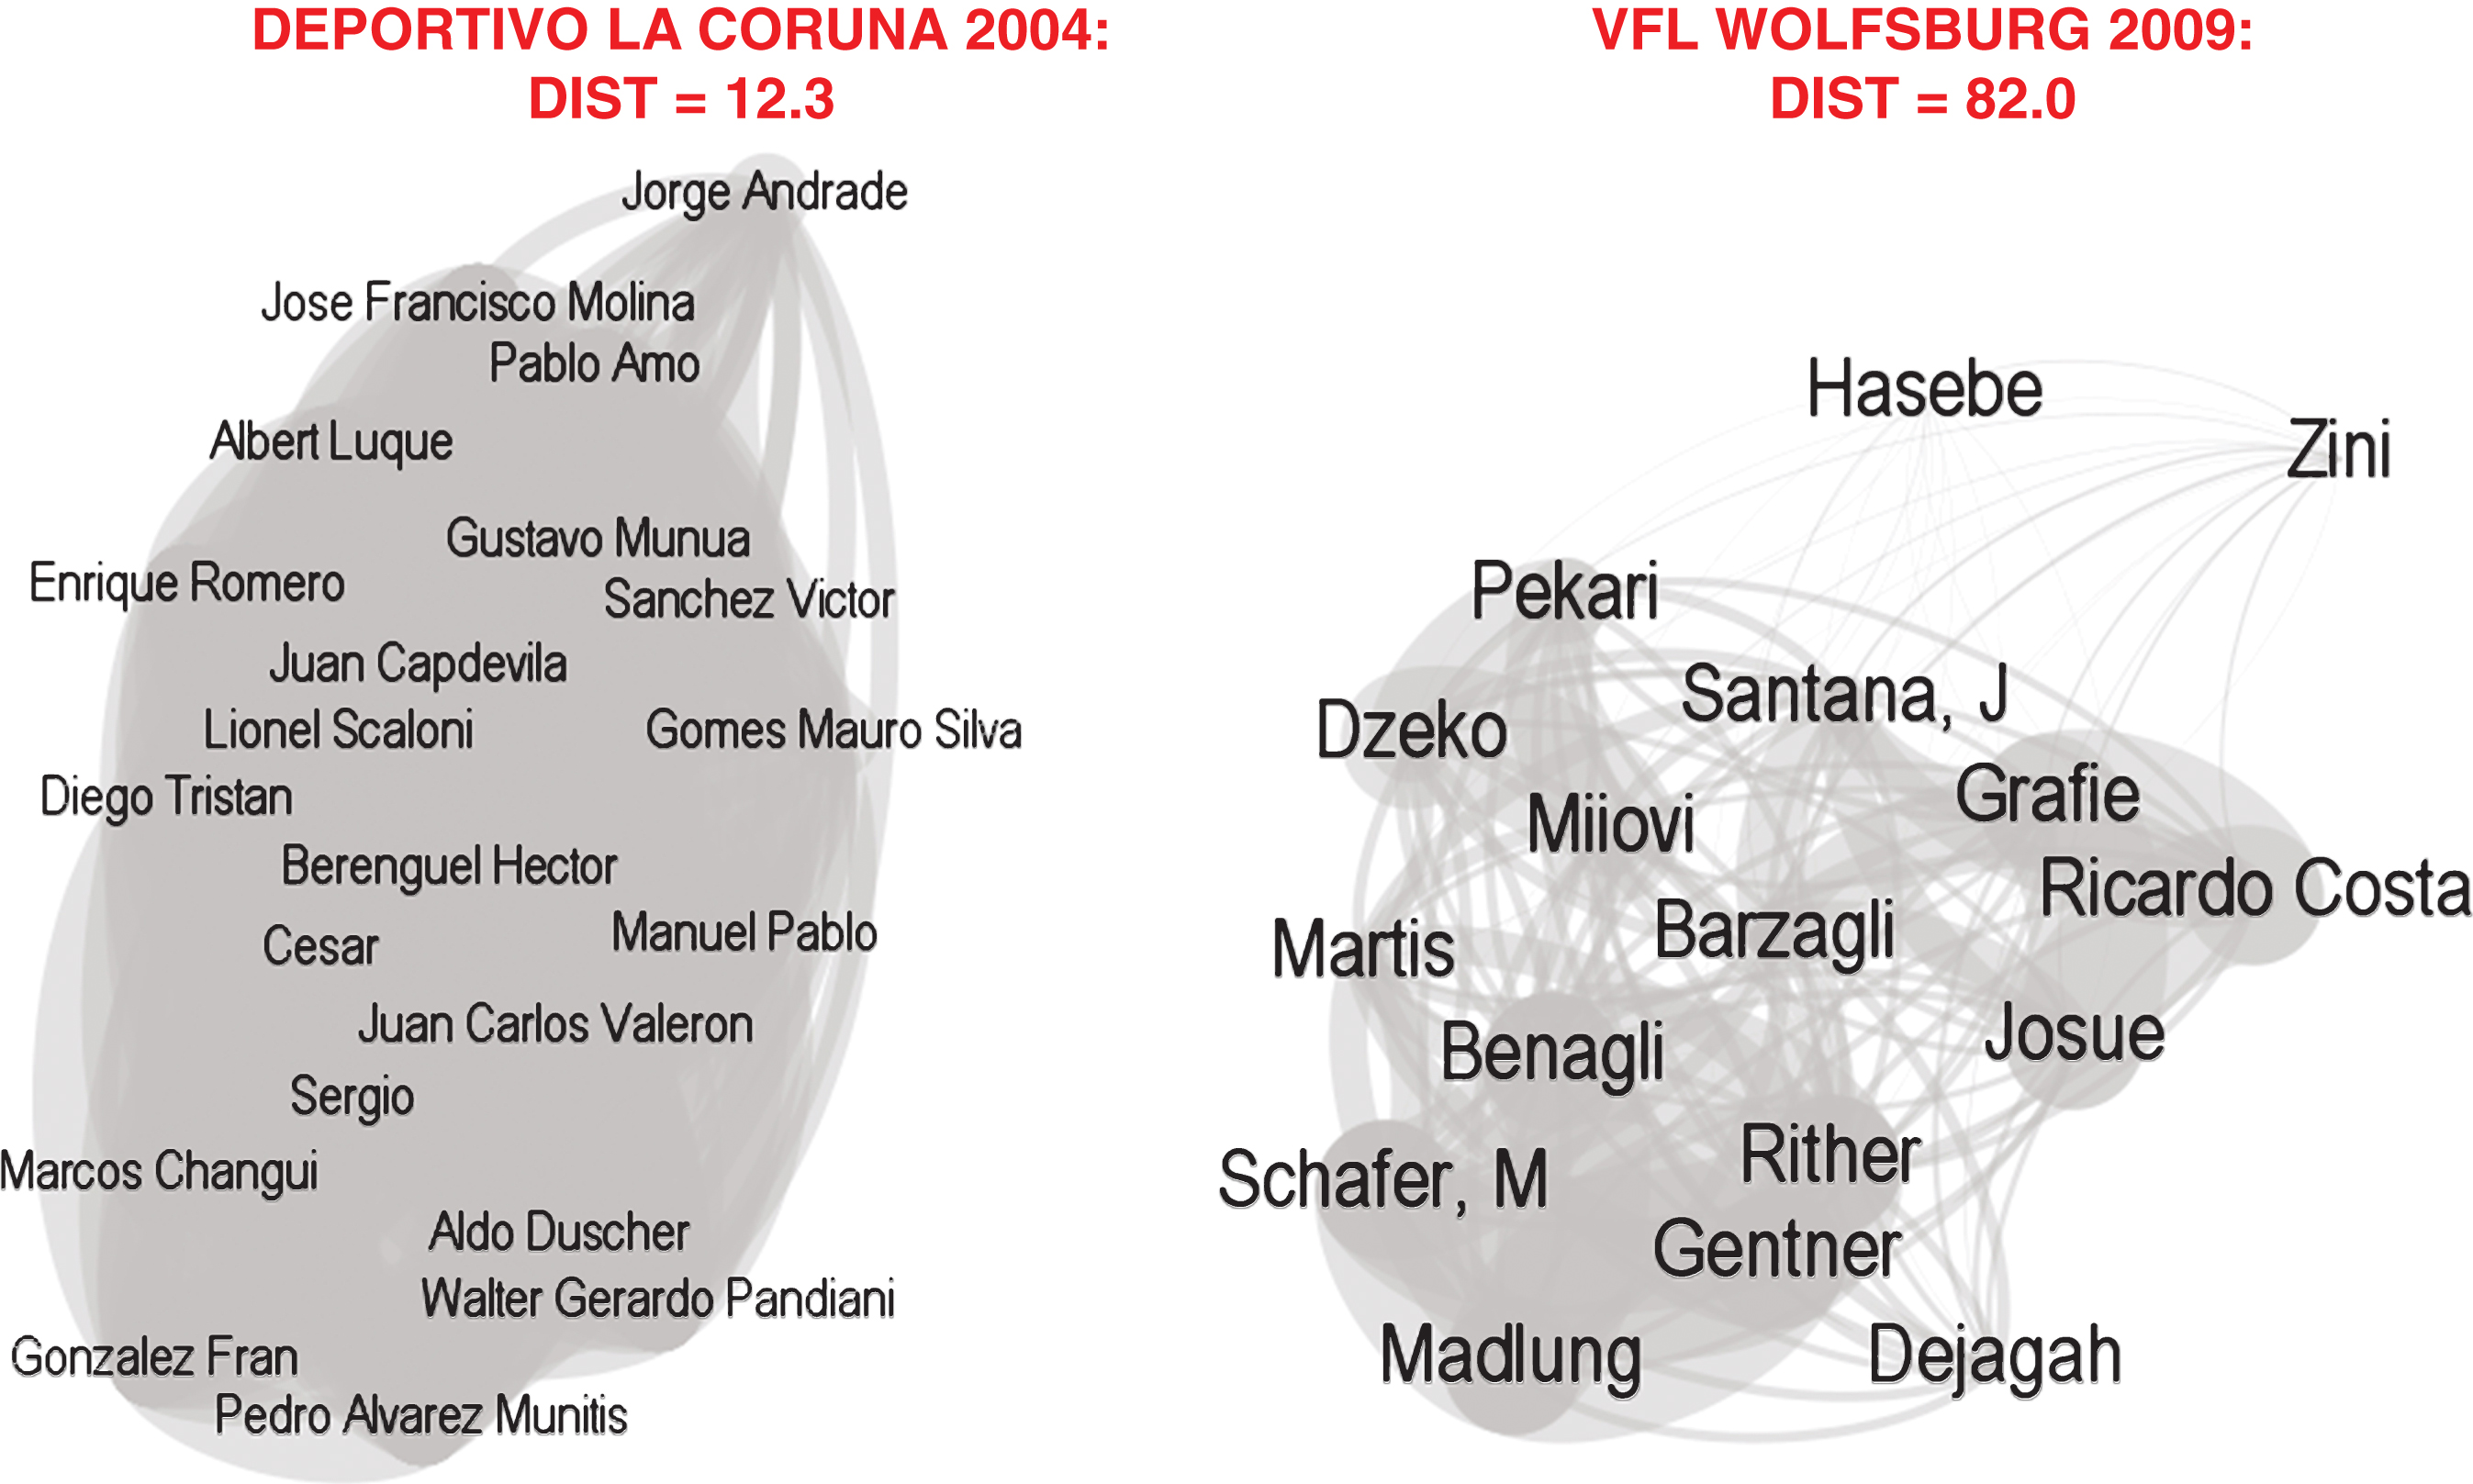
Figure 3 tracks one of the world’s most popular teams, Manchester United, between 2004 and 2012, showing how its diversity has ebbed and flowed for each year it competed in the Champion’s League. This graph wonderfully represents how even the best teams in the world demonstrate over time diversity that can be exploited to understand the impact of changes in diversity on team performance.
Fig.3
Distance between players for Manchester United (2004–2012). Each node contains one player on the team. The thicker the line the closer the languages are on the linguistic distance scale (0–100). For instance, Ferdinand and Rooney both speak English, meaning zero distance and the thickest line in the graph. Similar languages are lumped together, creating a gray shaded are when teams have multiple speakers of the same language.
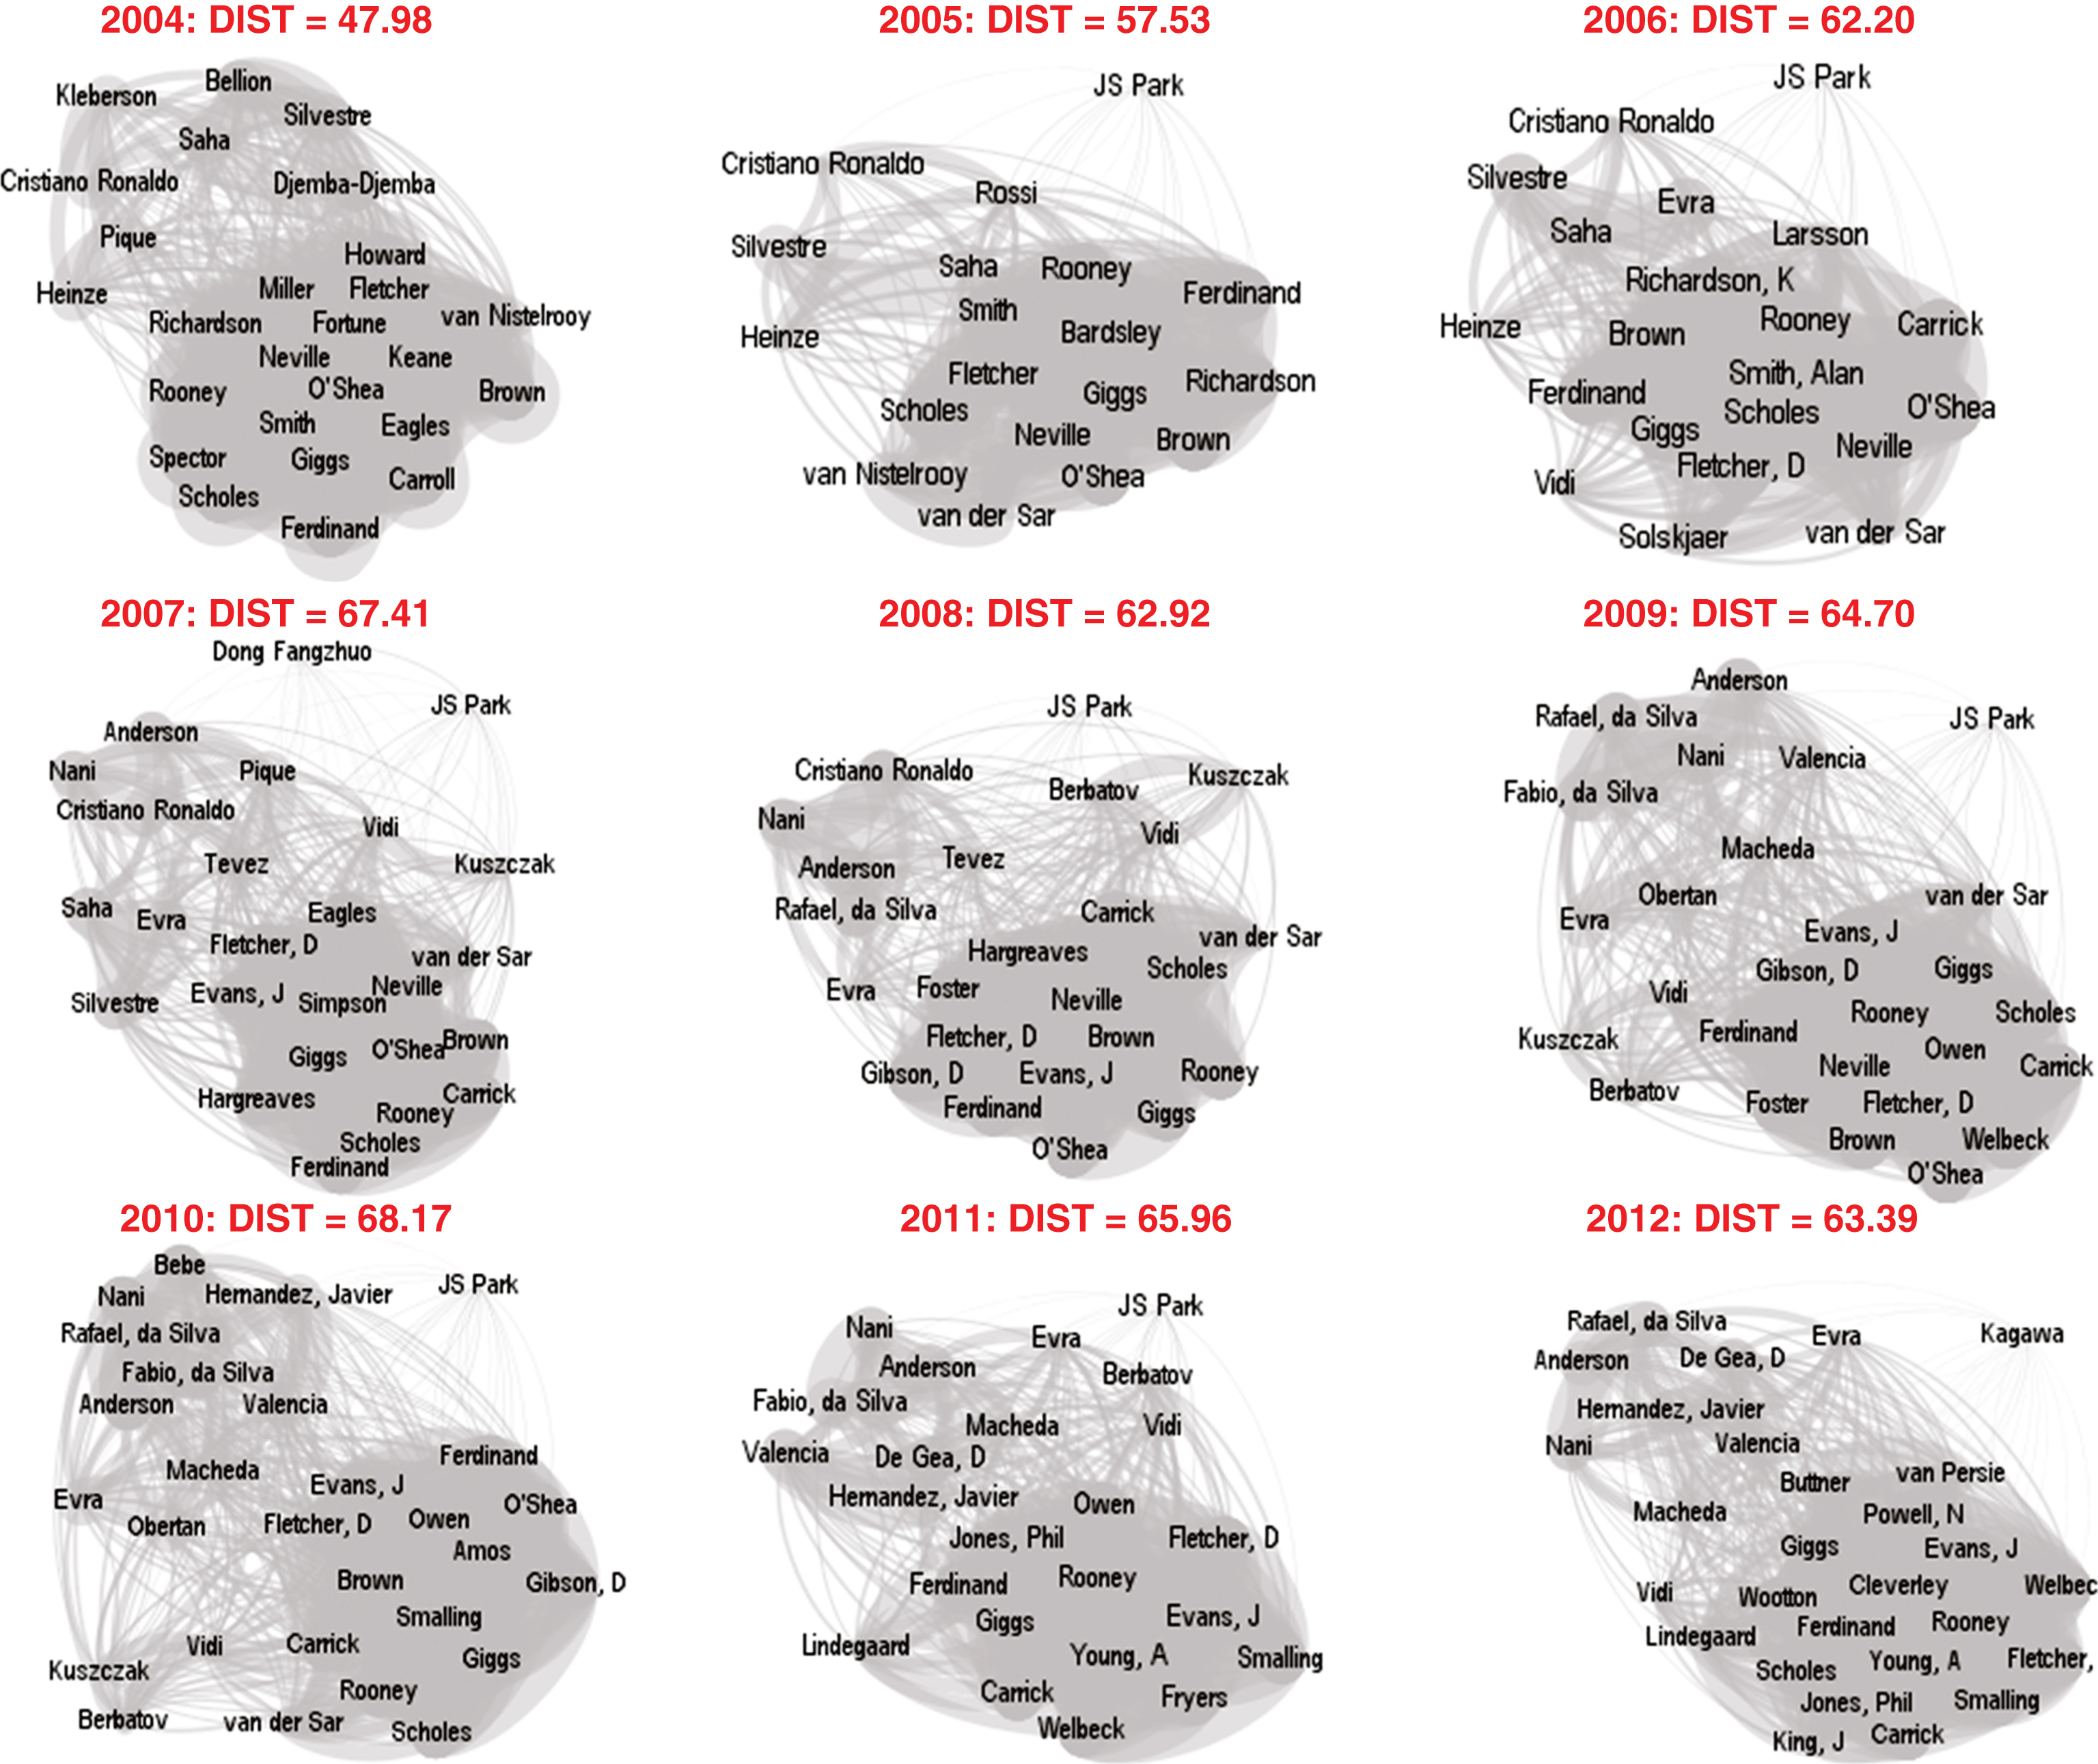
Figure 4 provides aggregate statistics for our key causal variable. In the main panel, we provide the average diversity for every team that entered the Champions’ League between 2003 and 2012. Several famous international clubs populate the top right portion of the graphic, indicating high diversity and high performance, including Arsenal, Chelsea, and Bayern Munich. These clubs famously pursued talent from all over world, as they built their teams into international brands (Tett, 2009, Christopher, 2010).
Fig.4
Average linguistic distance by team, league, and year (2003–2012). Bar colors in the left panel represent the league that a team plays. Colors can be identified in the top right panel.
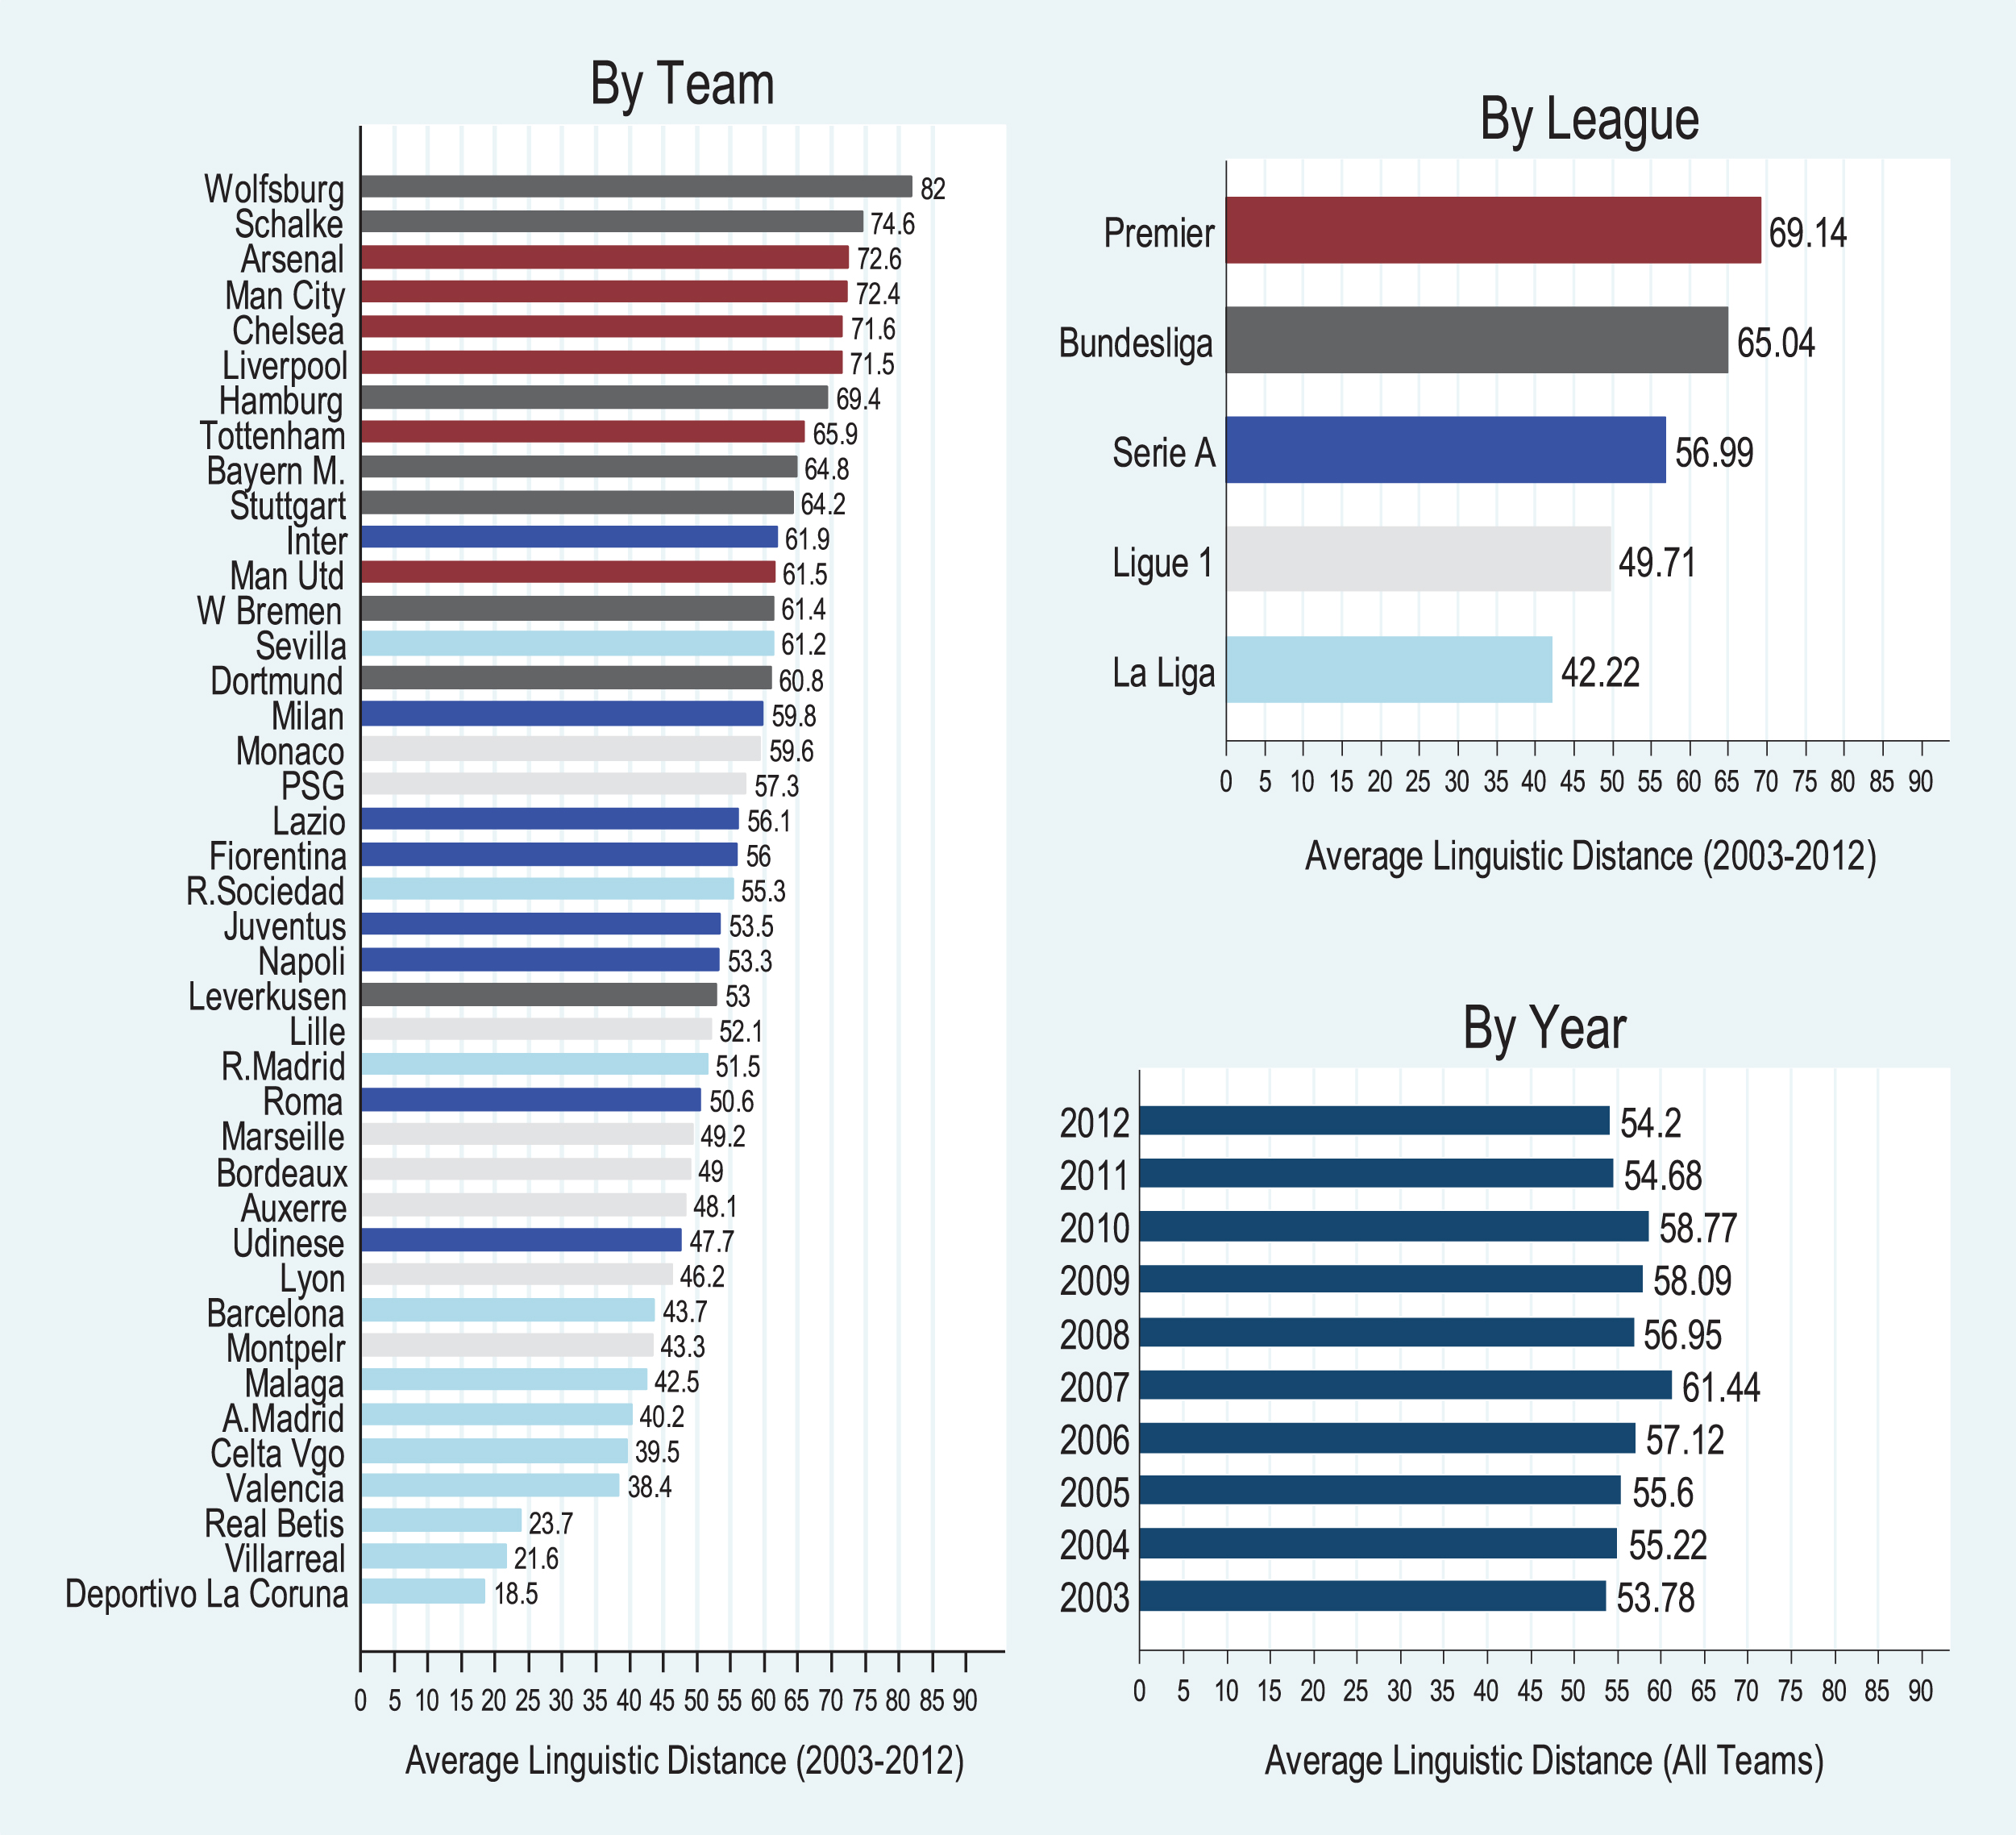
In addition to these super clubs, several other British (Liverpool, Manchester City) and German (Wolfsburg, Schalke 04) teams demonstrate high diversity. Notably farther back on the diversity scale are the equally famous clubs of Spain (Real Madrid, Barcelona, Valencia, Atletico de Madrid) and Italy (Udinese, Roma, Lazio). Barcelona is particularly well-known for eschewing foreign talent in favor of a homegrown farm system (The Economist 2012). Real Madrid may appear as a surprise to some readers, because of its famous “Galacticos” strategy of paying premium prices for one the world’s greatest players every year between 2000 and 2006 (Elberse and Quelch, 2008; Cattani et al., 2013). In fact, the strategy appears to have reduced diversity overall, as the high salaries for elite players necessitated surrounding them with a cheaper supporting cast comprised primarily of Spanish players.16
The national patterns observed above are not a coincidence, but are instead caused by systematic differences in rules regarding non-European players across the European soccer leagues. The Northeast panel of Fig. 4 demonstrates this exogenous league-wide variance in diversity, which we exploit in our identification strategy below. While England (Premier) and Germany (Bundesliga), placed few restrictions on the employment of non-European players after the Bosman ruling, Spain (La Liga), Italy (Serie A), and France (Ligue 1) all legislated quotas protecting the employment of homegrown players (Colucci, 2008; Freeburn, 2009). In all three cases, the quotas were justified under the assumption that it would help develop local talent for their national squads. Although there was an attempt by the major associations (UEFA and FIFA) to come up with a common international rule for homegrown quotas (i.e. 6 homegrown players on every squad (“the 6+5 rule”), this was ultimately rejected by the European Parliament (Freeburn, 2009; UEFA, 2002, Economist 2012).17 Germany and England have well over 50% non-European players and correspondingly high linguistic distance measures, as can be seen in Fig. 4. No British team (highlighted in Red) that was represented in the Champions’ League has a linguistic distance below 60, about the 70th percentile, and only one German team (Leverkusen) is below the median of 57. By contrast, only about a third of the players in the other three leagues are expatriates, and their linguistic distance measures decline accordingly.
The final panel of Fig. 4 shows the average annual linguistic distance of all teams in the Champions League. Notice that there is very little evidence of a time trend in the sample. Average diversity oscillates between 53 and 61 throughout the time period under investigation. In our regression analysis below, we use year fixed effects to address any annual shocks in diversity and performance, but there does not appear to be any threat of non-stationarity in the time series.
3.3Control variables
Figure 4 also highlights the key concern for causal inference in our analysis. Many of the teams at the top of the bar graph are rich, metropolitan clubs with financial resources to purchase the best players in the world, regardless of where they come from (Elberse and Quelch, 2008; Cattani et al., 2012). These associations could bias the bivariate relationship between diversity and performance could be positively biased.
Our research strategy was designed to mitigate against this concern by narrowing analysis to only the richest, most prestigious, and most successful clubs in Europe. Remember, almost all of our teams are ranked in the top-25 clubs in a given year, and the median number of Guardian Top 100 players on each team is four. As we noted above, however, even within the UEFA tournament, there is still variance in in team payroll and prestige. The most critical threat to our research is that the richest teams may have the scouting resources and financial wherewithal to travel the globe looking for the best players. Of course, not all the best players in the world speak the same language. In this search, they may end up with a more diverse team, but that diversity is a merely function of team wealth rather than a separate factor in team performance. To ensure that our analysis is not at risk of this omitted variable bias, we measure the teams’ financial prowess by collecting data on each individual player’s market value (the transfer price, which includes the player’s salary plus the amount transferred to the other team as a result of hiring away their talent). In economic terms, it is the true wage rate paid to the marginal unit of labor. We obtained this information from the TransferMarkt website.18 For each team, we add its players’ values, and calculate its total roster value, to capture the team’s financial capability. The total value of the roster of the representative team in our sample amounts to $385,349,647 USD. The team with the lowest total roster value in our sample is Auxerre in 2010 ($99,900,000 USD) and the one with the highest is F.C. Barcelona in 2011 ($930,000,000 USD).
While standard economy theory predicts that labor should be paid its marginal product, implying that transfer values are the best proxy for a team’s talent base, there is some risk that transfer value may not be adequate. First of all, there is the problem of measurement error. The market tends to disproportionately reward the glamour positions of striker and midfielder, where players rack up recognizable statistics (goals and assists), as opposed to the positions of goalie and defender, which are equally important to victory.19 Second, the market may lag true changes in talent, overpaying for aging players with historically good records, but who will never reach that level of productivity again. Conventional wisdom states that the market tends to overpay for British players, because of the Premier League’s popularity, and Brazilian players, because of the visibility of their national teams in World Cup play. Third, transfer value may overweight the value of a couple of particularly expensive players, rather than a highly talented team of eighteen players. Because of these deficiencies, transfer value may be imperfectly correlated with the latent measure of talent, allowing for unexplained variation that may still be associated with diversity, biasing our results.
To address this threat, we also collected data from a spectrum of different independent rankings of top players, including: 1) the Guardian’s list of 100 top players in the word (Sedghi, 2013);20 2) adjusted plus-minus statistics, measuring the impact of having a player on the field on a team’s offensive and defensive production (Silver, 2014); 3) points above replacement, measuring the net benefit of a particular player over the most valuable player at his position who could conceivably be purchased instead (Laidig, 2013); 4) And a standard composite index ranking, that is a weighed measure of critical on-field statistics (WhoScored, 2014); and 5) A weighted, running average of a team’s performance against the competition, called the Elo method (Schiefler, 2014). Unfortunately, these rankings are a new industry, and only the Elo measures reach back throughout our entire time period.
Table 1 provides descriptive statistics on all variables used in the analysis,21 while the first panel of Table 2 shows their bivariate correlations. Although statistically significant, the bivariate correlation between player value and diversity is actually quite weak – about 0.23 for total size and 0.17 for the average per player. Notably, Barcelona (43.7) and Auxerre (48.1) both have very low levels of average diversity, despite their widely divergent roster values. The second panel of Table 2 provides the bivariate correlations between diversity, team wealth, and our various measures of talent. While transfer market value is significantly correlated with all the different talent metrics (r > 0.68 on all measures), the correlations between diversity and talent is never significantly different from zero, although generally positive. Two clear lessons emerge from this analysis. First, transfer market value appears to be an excellent proxy for average team talent. Second, diversity is not a proxy for talent, capturing an entirely separate dimension of team composition and quality.
Table 1
Descriptive statistics of key variables
| Variable | n | Mean | SD | Min. | Max. |
| Dependent Variables | |||||
| Per-Game Goal Differential | 168 | 0.31 | 0.75 | –2.00 | 2.08 |
| Key Causal Variables | |||||
| Linguistic Distance | 168 | 56.60 | 13.77 | 12.30 | 82.00 |
| Control Variable | |||||
| Total Roster Value in 100,000,000 s of Pounds (ln) | 152 | 5.30 | 0.51 | 4.07 | 6.30 |
| Average Roster Value in 100,000,000 s of Pounds (ln) | 152 | 1.85 | 0.50 | 0.38 | 2.95 |
| Instruments | |||||
| Quota for Domestic Players | 168 | 1.89 | 1.72 | 0.00 | 5.00 |
| National Stock Market Index (2003 = 100) | 168 | 171.68 | 70.84 | 84.13 | 347.86 |
| Other Measures of Diversity | |||||
| Linguistic Distance Squared | 168 | 3392.0 | 1439.7 | 151.2 | 6723.3 |
| Linguistic Fractionalization Index | 152 | 0.352 | 0.141 | 0.134 | 0.831 |
| Shared Common Language | 168 | 0.350 | 0.153 | 0.092 | 0.823 |
| Country of Origin Fractionalization | 152 | 0.261 | 0.110 | 0.099 | 0.594 |
| Individualism/Collectivism | 152 | 17.095 | 5.505 | 1.688 | 30.4664 |
| Linguistic Distance (High Frequency Players) | 152 | 56.939 | 14.880 | 7.995 | 81.372 |
| Linguistic Distance (Low Frequency Players) | 150 | 55.618 | 21.186 | 0.000 | 91.720 |
| Genetic Distance | 168 | 311.626 | 198.787 | 16.514 | 842.726 |
| Quality Measures | |||||
| No. of Top 100 Players (Guardian) | 33 | 4.03 | 4.11 | 0.00 | 12.00 |
| Soccer Power Index Offense (ESPN) | 8 | 2.49 | 0.23 | 2.23 | 2.92 |
| Soccer Power Index Defense (ESPN) | 8 | 0.54 | 0.14 | 0.33 | 0.74 |
| Points Above Replacement | 12 | 1.90 | 0.67 | 0.19 | 2.55 |
| Average Rating of Player on Roster (Who Scored) | 16 | 7.13 | 0.13 | 6.92 | 7.31 |
| Team Rating (Who Scored) | 16 | 7.03 | 0.17 | 6.76 | 7.33 |
| Elo Club Rating | 168 | 1836.15 | 85.64 | 1679.00 | 2098.00 |
Table 2
Bivariate correlations of variables used in the analysis
| Panel A: Variables Used in Main Analysis | |||||||||||||
| Variables | 1 | 2 | 3 | 4 | 5 | 6 | 7 | 8 | 9 | 10 | 11 | 12 | 13 |
| 1. Per-Game Goal Differential | 1 | ||||||||||||
| 2. Linguistic Distance | 0.2255* | 1 | |||||||||||
| 3. Total Roster Value in 100,000,000 s of Pounds (ln) | 0.5402* | 0.2279* | 1 | ||||||||||
| 4. Average Roster Value in 100,000,000 s of Pounds (ln) | 0.5417* | 0.1663* | 0.9630* | 1 | |||||||||
| 5. Quota for Domestic Players | –0.0811 | –0.5089* | –0.4028* | –0.3454* | 1 | ||||||||
| 6. National Stock Market Index (2003 = 100) | 0.1387 | –0.3312* | 0.2014* | 0.2515* | 0.2393* | 1 | |||||||
| 7. Linguistic Fractionalization Index | –0.2698* | –0.9654* | –0.2907* | –0.2281* | 0.4919* | 0.3749* | 1 | ||||||
| 8. Shared Common Language | –0.2602* | –0.9057* | –0.3538* | –0.2986* | 0.4974* | 0.2454* | 0.9632* | 1 | |||||
| 9. Country of Origin Fractionalization | –0.2975* | –0.7922* | –0.2692* | –0.2176* | 0.3822* | 0.1286 | 0.7941* | 0.7432* | 1 | ||||
| 10. Individualism/Collectivism | 0.2946* | 0.6887* | 0.3896* | 0.3258* | –0.5179* | –0.3613* | –0.7141* | –0.7247* | –0.6414* | 1 | |||
| 11. Linguistic Distance (High Frequency Players) | 0.2353* | 0.9211* | 0.2491* | 0.1865* | –0.4615* | –0.3765* | –0.9008* | –0.8605* | –0.7439* | 0.6653* | 1 | ||
| 12. Linguistic Distance (Low Frequency Players) | 0.0385 | 0.5759* | 0.0771 | 0.0756 | –0.3571* | –0.2584* | –0.5261* | –0.4568* | –0.4160* | 0.3774* | 0.3517* | 1 | |
| 13. Genetic Distance | 0.0081 | 0.2591* | –0.1583 | –0.2093* | 0.0229 | –0.1107 | –0.145 | –0.0784 | –0.4324* | 0.0675 | 0.2320* | 0.0662 | 1 |
| Panel B: Talent, Value, and Diversity | |||||||||||||
| Variables | 1 | 2 | 3 | 4 | 5 | 6 | 7 | 8 | 9 | 10 | |||
| 1. Linguistic Distance | 1 | ||||||||||||
| 2. Total Roster Value in 100,000,000 s of Pounds (ln) | 0.2279* | 1 | |||||||||||
| 3. Average Roster Value in 100,000,000 s of Pounds (ln) | 0.3819 | 0.9671* | 1 | ||||||||||
| 4. No. of Top 100 Players (Guardian) | 0.1559 | 0.8422* | 0.7970* | 1 | |||||||||
| 5. Soccer Power Index Offense (ESPN) | –0.6404 | 0.618 | 0.5783 | –0.0598 | 1 | ||||||||
| 6. Soccer Power Index Defense (ESPN) | 0.5901 | –0.3415 | –0.3844 | –0.3987 | –0.0843 | 1 | |||||||
| 7. Points Above Replacement | –0.0041 | 0.6964* | 0.7355* | 0.7373* | –0.0376 | –0.7526* | 1 | ||||||
| 8. Average Rating of Player on Roster (Who Scored) | 0.1799 | 0.6767* | 0.6789* | 0.6219* | 0.6044* | 0.1634 | 0.3434 | 1 | |||||
| 9. Team Rating (Who Scored) | 0.1837 | 0.7470* | 0.7980* | 0.7408* | 0.8132* | –0.0545 | 0.5495* | 0.9172* | 1 | ||||
| 10. Elo Club Rating | 0.0415 | 0.7674* | 0.7428* | 0.7823* | 0.7273* | –0.0462 | 0.5305 | 0.6851* | 0.6894* | 1 | |||
*Significant at the 0.05 level.
4Main results
To identify whether diversity has a causal impact requires an appropriate identification strategy. As argued above, the UEFA Champions League provides an ideal testing location for our theory. The teams in this competition represent the very best sides in their respective countries. Moreover, the presence of these top clubs is consistent from year to year. Since 2003 when our data begins, Arsenal, Chelsea, Manchester United and Real Madrid qualified all ten years, while A.C. Milan, Barcelona, Bayern Munich, Internazionale Milano (a.k.a. Inter), and Olympique Lyonnais only missed it once. Consequently, looking at Champions League competitors allows us to hold constant teams’ quality and prestige.
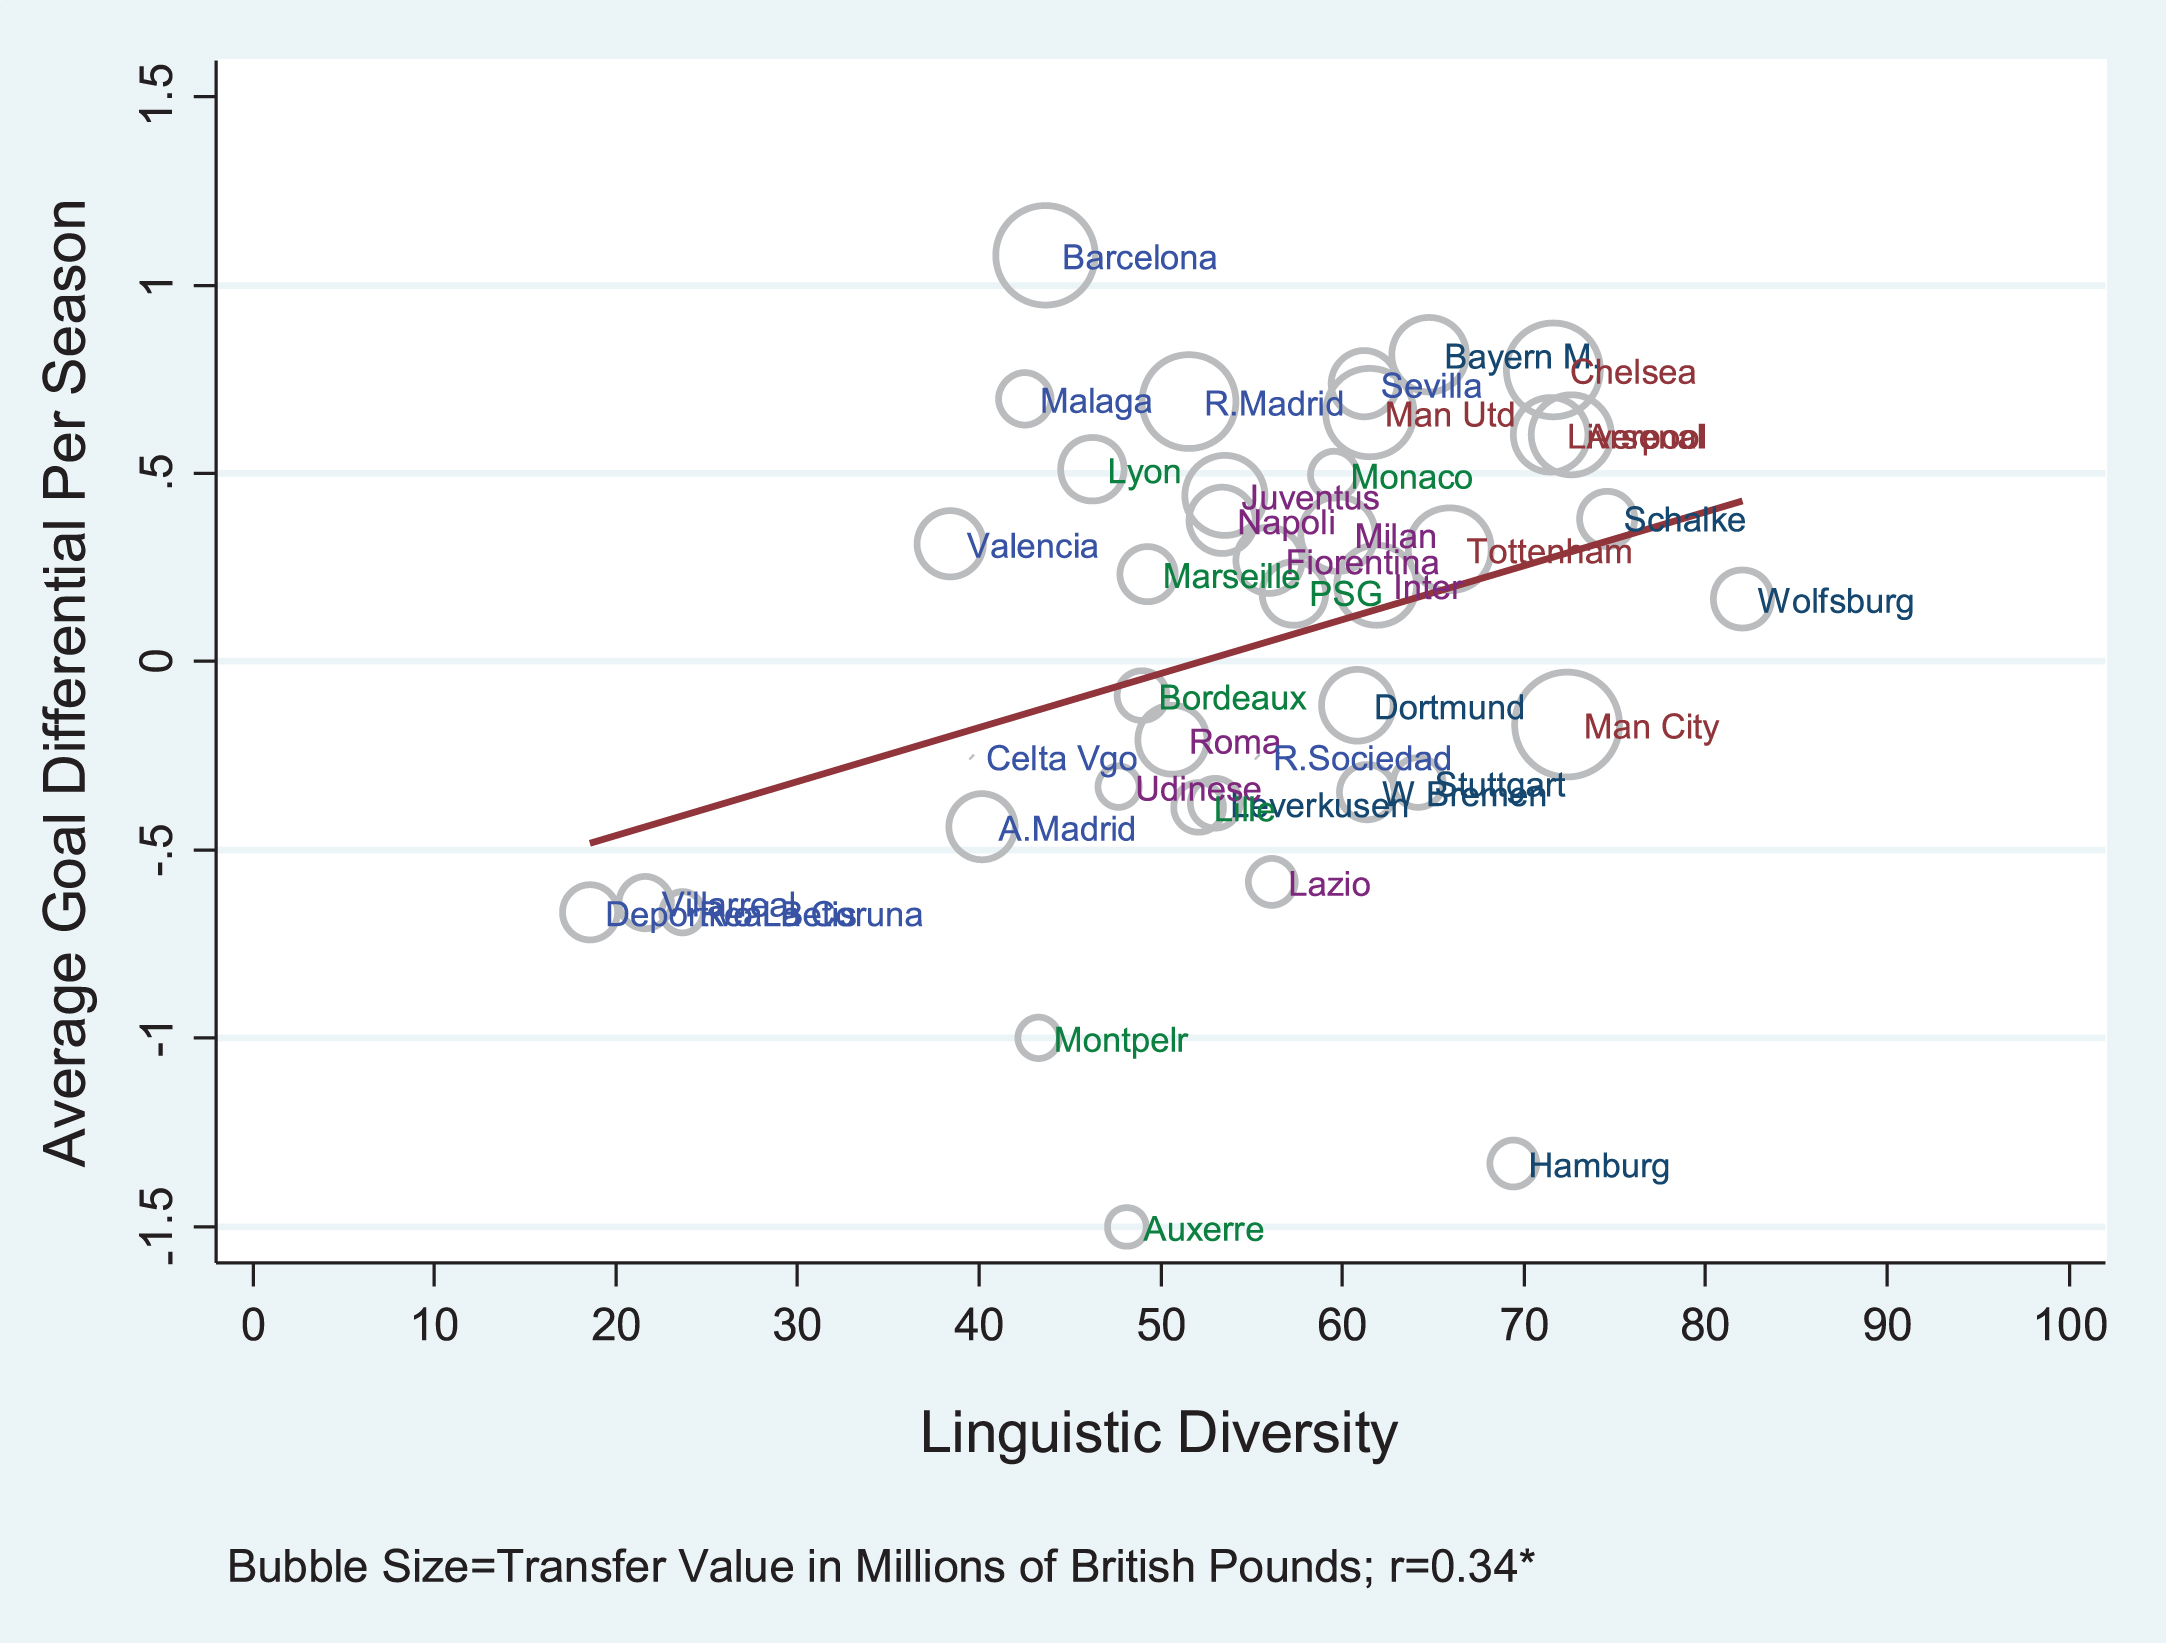
Figure 5 presents a scatterplot relating linguistic diversity for each team between 2003 and 2012 (on the horizontal axis) to the average goal differential per season. The markers placed next to each team (circles) are drawn proportional to their roster’s value (measured in millions of British pounds). The graphical relationship is visibly positively sloped.
Fig.5
Scatterplot demonstrating the relationship between average goal differential and linguistic diversity. The value of each team’s roster (measured in pounds) is represented by the area of the circle. Label colors differentiate each team’s league.
This graphical representation, however, does not fully address the issue of robustness to teams’ talent and financial prowess. To properly account for these confounding effects, we estimate the following equation:
Table 3 presents our main results. We regress our measure of team performance (goal differential per game) on linguistic distance using Ordinary Least Squares (OLS). We begin with the straightforward bivariate relationship (Model 1) and then control for total team value (Model 2) and average team value (Model 3). In Model 4, we use an alternative measure of a team’s financial prowess. In all of these specifications, we include league fixed effects. If our theory is correct, the relationship between diversity and team performance should hold within and across different leagues. We also include year fixed effects, as we are drawing on ten years of professional league data, and want to account for any season-specific features or trending that might be associated with both diversity and performance. Finally, we estimate a model including both year and team fixed effects (Model 5). This specification allows us to examine whether “within” teams and conditional on common time-varying factors, a higher degree of diversity is associated with better team performance.
Table 3
Determinants of team performance in UEFA Champions League (OLS regression)
| Core Specification | Adjusting for Talent | ||||||||
| Model | Diversity | Total | Average | Yres | Team FE | Total | Average | Total | Average |
| (1) | (2) | (3) | (4) | (5) | (6) | (7) | (6) | (7) | |
| Linguistic Distance | 0.021*** | 0.014** | 0.016** | 0.025*** | 0.014* | 0.014** | 0.016** | 0.030** | 0.030** |
| (0.007) | (0.007) | (0.007) | (0.007) | –0.006 | (0.007) | (0.006) | (0.014) | (0.014) | |
| Total Value (ln) | 1.041*** | 1.067*** | 0.305 | ||||||
| (0.175) | (0.208) | (0.611) | |||||||
| Average Value (ln) | 0.945*** | 0.970** | 0.913*** | 0.474 | |||||
| Yres (Deviation of team wealth from expected) | (0.155) | 1.279*** | (0.214) | (0.178) | (0.768) | ||||
| (0.389) | |||||||||
| Club Elo Rating | –0.000 | 0.000 | |||||||
| (0.001) | (0.001) | ||||||||
| 0.104 | 0.084 | ||||||||
| Number of Players in Guardian Top 100 (lag 1) | (0.065) | (0.086) | |||||||
| Constant | –1.239** | –5.852*** | –2.326*** | –1.556** | –2.524*** | –5.645*** | –2.735 | –3.577 | –2.773* |
| (0.500) | (0.757) | (0.511) | (0.674) | (0.480) | (1.497) | (1.670) | (3.133) | (1.403) | |
| Year FE | Yes | Yes | Yes | Yes | Yes | Yes | Yes | Yes | Yes |
| League FE | Yes | Yes | Yes | Yes | No | Yes | Yes | Yes | Yes |
| Team FE | No | No | No | No | Yes | No | No | No | No |
| Observations | 168 | 152 | 152 | 152 | 152 | 152 | 152 | 33 | 33 |
| R-squared | 0.147 | 0.391 | 0.381 | 0.224 | 0.543 | 0.392 | 0.382 | 0.520 | 0.524 |
| RMSE | 0.721 | 0.626 | 0.631 | 0.707 | 0.625 | 0.628 | 0.633 | 0.730 | 0.727 |
Robust standard errors, clustered at team level in parentheses, ***p < 0.01, **p < 0.05, *p < 0.1. The dependent variable is the average goal differential of a team in the UEFA Champion’s league in a given year. Model 1 is the bivariate correlation. Models 2 & 3 control for total player value and average player value respectively. Model 4 controls for the residual value, after estimating expected value based on year and team fixed effects. Model 5 employs team fixed effects. Models 6–9 replicate Models 2 & 3 but add a control for Club Elo Rating and the number of Guardian 100 players included on the team. The n drops because this data is only available for two years.
We employ Huber-White Robust standard errors to address heteroskedasticity. These errors are clustered at the team level, as yearly changes in their diversity levels cannot be considered to be independent draws.22
Model 1 reports the results of our “baseline” model, where we regress goal differential on linguistic distance using year and league dummies. The coefficient estimate of 0.021 implies that a one-standard deviation increase in the linguistic diversity (13.78) of the average team is associated with a 0.29 rise in per-game goal differential.
In Model 2 we control for teams’ total roster value. Unsurprisingly, wealth has a significant impact on performance. A one-standard deviation rise in the total value of a team’s roster is associated with a 0.44 increase in its per-game goal differential. Note that despite having larger standard errors, the coefficient associated with our main variable of interest, diversity, is only slightly smaller and still statistically significant.23
Treating wealth as exogenous, however, ignores that to a large extent, a team’s value depends on its stock of competencies, knowledge, social and personality attributes, embodied in the ability to produce output (i.e. human capital). In other words, a talented team will be composed of more valuable individual members, who will perform better, producing more revenue for the team and thus increasing its value. For a recent example of this, witness the £85 million in revenue that Tottenham was able to raise by selling Gareth Bale to Real Madrid this year, provided them with resources to spend on multiple talented players from around the world (Whitwell, 2013).24 Given our argument that talent and diversity are correlated, including diversity and the total value of a team’s roster is problematic. The inclusion of both variables would potentially wash out the effects of a measure of diversity (language distance) with a variable that can be partially driven by players’ culture-inherent skills (total value of team’s roster). To put it in Angrist and Pischke’s terms, a team’s value is a “proxy control”— that is, causally “affected by the variable of interest”— and hence not a good candidate as a control variable (Angrist and Pischke 2009 : 66).
We take four approaches to dealing with this problem. The first is to include the value of a team’s average player, instead of the total value of the team’s roster. It is not unusual for these elite teams to include a few very talented foreign players (maybe even just one or two). These players can drive up the total value of a team’s roster by themselves. One way to avoid this problem is to divide the total value of a team by the number of players in its roster. We thus calculated an alternative measure of a team’s worth including both active and inactive players in our denominator. Empirically, this indicator is less correlated with linguistic distance as the aggregate roster value, while still conveying information about a team’s ability to recruit talent.
Our second approach consists of employing the stochastic rather than systematic part of a team’s value. Letting Yit denote the total value of team i’s roster in year t, we first regress Yit on team and year fixed effects. Conceptually, this procedure splits Yit into two components. The first one,
Third, results of the specification with team fixed effects are presented in the Model 5. This model allow us to account for hard-to-measure factors such as corporate culture, quality of training facilities, an intimidating fan base, and other time-invariant unobservable factors, all of which may have an effect on team performance. The estimates corroborate that a higher level of diversity is associated with better— rather than worse— performance. The similarity between the cross-sectional (Model 3, “between”) and the panel (Model 5, “within”) estimates also suggests that the threat of omitted variable bias arising from hard-to-account-for team characteristics is very small.26
Finally, in Models 6–9, we re-run our core specification, but this time add measures of team quality as controls. In Models 6 and 7, we use the rating of team performance, developed by Arpad Elo,27 This measure takes into account the team’s performance against each particular rival, weighted by the importance of the venue and the size of the victory. We use the Elo ratings on the eve of the Champion’s League to measure the team’s overall talent at that time. Of course, Elo is based on team performance, and even includes goal differential indirectly into the weighting, so it correlates highly with our measure of goal differential. As an alternative measure, we also count the number of a team’s players in the Guardian’s Top 100 list on the eve of the tournament. Although our dataset includes 71 of the top 100 players in 2012, they are not distributed evenly by teams. The median number of top 100 players on a club is four. Barcelona and Bayern have 11 a piece, and five teams (including Wolfsburg) have zero. While this number is a fantastic gauge of raw ability, it is only available for two years.
As we might have expected based on the bivariate correlations in Table 2, controlling for team talent has limited influence on the relationship between diversity and goal differential. In fact, the size of the coefficient on linguistic distance actually increases somewhat. Due to high multicolinearity, however, talent and transfer market value are now no longer individually significant.
The results in Table 3 provide compelling evidence that diversity is strongly correlated with team performance.28 After parsing out diversity from income, we find that the impact of a one standard deviation change in diversity ranges from 0.19 to 0.39, about 0.29 on average. This translates into between 1.14 and 2.34 net goals for teams during the group stage. And, for those teams that advance to the finals, a one standard deviation increase in diversity is associated with an increase of 1.71 to 3.5 net goals over the tournament. As mentioned above, a large number of games are decided by a single goal. Therefore, by turning a tie to a win (or, a loss to a tie), the addition of culturally inherent skills could clearly mean the difference between a team advancing in the tournament and heading homeearly.
4.1Robustness and falsification tests
To make sure that we are capturing the effect of diversity on group performance, we conduct the following robustness and falsification tests. First, we use different measures of teams’ performance as well as alternative indicators of cultural diversity. Next, we conduct a number of additional tests. Specifically, we: (1) examine the proposed quadratic effect of diversity that theories proposing an optimal level of diversity would expect (Lazear, 1999, Ashraf and Galor, 2013); (2) analyze the role of diversity on and off the pitch; (3) use genetic distance, a measure of genealogical relatedness between human populations; (4) correlate diversity (as measured by language distance) with a team’s performance in the Champions League competition held in the previous year as a placebo test.
The results of our first set of tests are presented on Table 4. One possible concern with our output measure is that teams in the Champions league may rack up a large goal differential in the initial stages of the competition but do not perform nearly as well in subsequent rounds. To address this concern, in Models 1 and 3, we replace goal differential with average points obtained and winning percentage, respectively. In soccer, three points are awarded to the team winning a match, with no points to the losing team. If the game is drawn, each team receives one point. As before, we calculate average number of points per game played in a given year for each team.29 Similarly, we calculate each team’s winning percentage taking into account the number of games in which it participated. As mentioned above, because soccer games can be decided by a single goal, these measures are not as fine-grained as goal differential. Nonetheless, as the results indicate, our main findings are robust when we use these alternative performance measures. Again, in Models 2 and 4, we control for team talent, but our results are unaffected.
Table 4
Alternative conceptualizations of diversity (OLS regression)
| Dependent Variable | 1. Average Points | 2. Winning Percentage | 3. Average Goal Differential | |||||
| (1) | (2) | (3) | (4) | (5) | (6) | (7) | (8) | |
| Linguistic Distance | 0.007* | 0.008* | 0.282* | 0.305** | ||||
| (0.004) | (0.004) | (0.144) | (0.147) | |||||
| Linguistic Fractionalization | –1.553** | |||||||
| (0.591) | ||||||||
| Shared Common Official Language | –1.718*** | |||||||
| (0.621) | ||||||||
| Country of Origin Fractionalization | –1.479** | |||||||
| (0.553) | ||||||||
| Individualism v. Colectivism | 0.035** | |||||||
| (0.013) | ||||||||
| Average Value (ln) | 0.633*** | 0.544*** | 21.785*** | 18.200*** | 0.930*** | 0.993*** | 0.905*** | 0.955*** |
| (0.094) | (0.132) | (3.411) | (4.625) | (0.153) | (0.146) | (0.163) | (0.153) | |
| Club Elo Rating | 0.001 | 0.027 | ||||||
| (0.001) | (0.021) | |||||||
| Constant | 0.044 | –1.064 | –8.149 | –53.029 | –0.807** | –0.910*** | –0.843*** | –1.877*** |
| (0.313) | (1.158) | (10.985) | (37.401) | (0.308) | (0.295) | (0.298) | (0.354) | |
| Year FE | Yes | Yes | Yes | Yes | Yes | Yes | Yes | Yes |
| League FE | Yes | Yes | Yes | Yes | Yes | Yes | Yes | Yes |
| Observations | 152 | 152 | 152 | 152 | 152 | 152 | 152 | 152 |
| R-squared | 0.349 | 0.353 | 0.323 | 0.328 | 0.384 | 0.388 | 0.385 | 0.373 |
| RMSE | 0.422 | 0.422 | 15.34 | 15.33 | 0.629 | 0.627 | 0.629 | 0.635 |
Robust standard errors, clustered at team level in parentheses, ***p < 0.01, **p < 0.05, *p < 0.1. All models replicate Table 3 (Model 3), but test the robustness of the association to different operationalizations of performance and diversity. The new dependent variables are average points (Model 1) and winning percentage (Model 2). Models 3 & 4 control for the Elo rating. Models 5–8 regress average goal differential on alternative measures of cultural diversity from the literature.
As a check for robustness of the ASJP language distance metric, we consider other measures of cultural diversity (Models 3–6). First, we use a standard measure of linguistic fractionalization, which ranges from 0 (all players have a different language) to 1 (all players share the same language). As noted above, linguistic fractionalization is less preferable because it under-estimates the scale of differences between teammates. Second, averaging across pairwise comparisons of teammates as before, but replacing the paired ASJP score with a 1 or 0 depending on whether the pair natively speaks the same language, we calculate a shared common language measure (SCL).30 Third, we construct a Country of Origin Fractionalization Index (COFI) using the Herfindal-Hirschman (HH) index of concentration. Using country rather than language tests whether linguistic distance underestimates diversity by not addressing different cultures that speak similar languages. Romance languages are a particular concern. More poignantly, are teams in the La Liga penalized for relying heavily on Latin American talent, who speak Spanish? Extremely multi-national teams would receive values closer to 0, whereas completely homogenous ones would be associated with values closer to 1.31 Finally, we consider a measure of diversity frequently used by management scholars to assess team performance. Based on Geert Hofstede’s cultural dimensions theory, it is possible to classify countries according to different dimensions in their national culture (Hofstede, 1980). Once again, we create a distance measure that calculates the average distance between two players on the Individualism versus Collectivism (IDV) score. We use this indicator as, an alternative measure of cultural diversity.32
The results presented in Table 4 indicate that the significant association between diversity and team performance is robust to the operationalization of diversity. More homogeneous teams (i.e. those with higher values for the LFI, SCL, and COFI measures) do not do as well as teams that are less homogeneous (Models 5–9). Interestingly, when we compare the coefficients on the LFI and COFI, it is clear that diversity in home country actually has a slightly larger effect than linguistic diversity. Finally, teams that have a higher level of cultural diversity, as measured by Hoftede’s indicator (IDV) tend to outperform less diverse ones (Model 6).
Table 5 presents the results from our additional tests. In Model 1, we study the quadratic effect of diversity, finding no support for the optimal theory. In fact, the coefficient on the quadratic term is precisely zero. Next, we consider two alternative mechanisms by which diversity affects performance, using our core ASJP language distance metric. First, we recalculate the teams’ diversity taking into account only those players who participated in at least 50% of the Champions League games (Model 2). Then, we calculate the same measure, but we only consider those players who participated in less than 50% of the games their teams played in the tournament (Model 3). These alternative measures allow us to assess whether it is diversity on or off the pitch what matters for team performance. The coefficient associated with the diversity of high-frequency players is positive and statistically significant, but the one for the low-frequency players is statistically indistinguishable from zero. These results suggest that it is the variation in problem-solving abilities on the pitch, rather than getting along and fitting well together off the pitch that matters most when it comes to a team’s performance.33
Table 5
Additional tests of causal mechanism (OLS regression)
| Dependent Variable | 1. Average Goal Differential | 2. Goal Diff (Lagged) | |||
| (1) | (2) | (3) | (4) | (5) | |
| Linguistic Distance | 0.035 | –0.003 | |||
| (0.026) | (0.005) | ||||
| Linguistic Distance Squared | –0.000 | ||||
| (0.000) | |||||
| Linguistic Distance (High Freq.) | 0.010** | ||||
| (0.005) | |||||
| Linguistic Distance (Low Freq.) | –0.001 | ||||
| (0.004) | |||||
| Wacziarg Genetic Distance | 0.000 | ||||
| (0.000) | |||||
| Average Value (ln) | 0.920*** | 0.962*** | 1.012*** | 1.039*** | 0.942*** |
| (0.163) | (0.156) | (0.148) | (0.144) | (0.227) | |
| Constant | –2.676*** | –1.973*** | –1.308*** | –1.511*** | –1.217** |
| (0.753) | (0.420) | (0.390) | (0.312) | (0.435) | |
| Year FE | Yes | Yes | Yes | Yes | Yes |
| League FE | Yes | Yes | Yes | Yes | Yes |
| Observations | 152 | 152 | 150 | 152 | 104 |
| R-squared | 0.385 | 0.366 | 0.345 | 0.350 | 0.401 |
| RMSE | 0.631 | 0.639 | 0.647 | 0.646 | 0.500 |
Robust standard errors, clustered at team level in parentheses, *** p < 0.01, **p < 0.05. The dependent variable is the average goal differential of a team in the UEFA Champion’s league in a given year. All models replicate Table 3 (Model 3). Model 1 employs a quadratic specification. Models 2 restricts analysis to starters (high frequency players), while Model 3 studies only substitutes (low frequency players). Model 4 uses subsistutes genetic distance for cultural diversity. Finally, Model 5 offer a placebo test by regressing lagged goal differential on today’s linguistic distance.
In Model 4 we use ancestry, rather than linguistic distance, as our indicator of diversity. The measure was constructed by Spolaore and Wacziarg (2009) using genetic distance data compiled Cavalli-Sforza et al. (1994) and captures the length of time since two populations became separated from each other (i.e. relatedness). As Spolaore and Wacziarg (2009) note, these differences in neutral genes can be used to assess the effectiveness of pre-Columbian barriers to diffusion of technology, culture, and people. While it is possible that such differences may have an effect on societies’ long-run development prospects, there is little reason to believe that they should have an effect on the performance of multi-national soccer teams.
This is especially true, since many teams are ethnically diverse according to the Spolaore and Wacziarg measure, but not culturally diverse in terms of their soccer backgrounds. For example, Olympique de Marseille between 2007–2011 is an excellent example. With players of Algerian (Samir Nasri), Tunisian (Hatem Ben Arfa), Senagalese (Souleymane Diawara, Édouard Cisse), and Malian (Alou Diarra) descent, but who grew up and learned to play soccer in France, the team possessed a high level of ethnic diversity, but ranked very low in terms of the heterogeneity of its culturally-inherent skills. And, despite participating in the competition for five consecutive years during that period, its performance – with an average goal differential of 0.01 (compared to 0.31 and 0.11 for the sample average and for the French teams, respectively) – was quite disappointing.
We thus use this measure as a “placebo” or ineffectual treatment for performance. As the results in Table 5 indicate, we do not find any significant association between genetic relatedness and team performance, as expected. Finally, as a further placebo test, we consider teams’ per-game goal differential in the previous year’s Champions League as the dependent variable, and find no meaningful correlation with language distance (Model 5).
5Instrumental variables (IV) estimation
The above results are compelling evidence that diversity is correlated with team performance, even after adjusting for team wealth. Our identification strategy is based on the notion that teams from the Big Five European soccer leagues that make it to the Champions League are equally attractive to prospective talented foreign players. As such, we do not think that the selection effect caused by the recruitment of international talent poses a threat to ourresults.
Nevertheless, some readers may remain skeptical about our ability to establish a causal relationship between diversity and team performance. After all, beyond quality, players may also be drawn to a particular club for other reasons, including necessity, opportunity, existing connections, etc. If international players select teams based on such features, there is a possibility that the results in Tables 3–5 may be biased.
To address these concerns, we turn to a structural equation model where we exploit exogenous variation in diversity and team value.
5.1Instrumenting diversity
An important source of variation in teams’ diversity is given by the wide differences in non-European player quotas applied by the Big Five national leagues discussed above. These quotas are imposed exogenously on club teams by national legislatures with an eye toward preparing national squads for the World Cup tournament. Our specific measure counts the number of domestic players that are required (per the national regulations) in a given year to be represented on each team in the top professional leagues under what are known as “Home Grown” player rules. An example of such a rule is FIFA’s proposed “6+5 rule”, which provides that a club team must start a match with at least six players that would be eligible for the national team of the country in which the club is domiciled (Fryburg, 2009). Since the Bosman ruling, La Liga (Spain), Serie A (Italy), and Ligue 1 (French) have experimented with different versions of home grown quotas, ranging from three to five players, while Germany did not adopt home grown protections and receives a score of zero over the entire period. England only adopted a home grown quota at the start of the 2010/2011 Premier League campaign. The legal variation across leagues gives potential exogenous variation to use in a two-stage estimation strategy.
A two-stage approach will only work, however, if there are no other league-specific attributes that might also impact a team’s performance. To meet the exclusion criterion, the only pathway possible pathway between league and team performance must be through variation in diversity. If training styles, coaching, and team strategies also vary systematically by league, our identification strategy will breakdown.
Fortunately, Anderson (2010b) empirically studied differences in league play carefully as part of analysis of viewer interest. The analysis demonstrates that on common metrics of offensive production (i.e. goals scored, shots on goal, or the goal to shot ratio) there is virtually no difference between the leagues. A follow-up analysis examines the competitiveness of the league based on Gini coefficients, finding that the Gini coefficient varies between 0.17 (Ligue 1) and 0.22 (Serie A) (Anderson 2011), indicating reasonable equality across all the leagues with little variation. The only observable differences Anderson (2010b) identified were that the Premier League has a significantly lower number of foul calls and yellow cards issued. He concluded that this means that it has a faster flow, which is more enjoyable for viewers, but there is no reason to believe that it would set these teams apart from those of other leagues when they competed internationally.
5.2Instrumenting team wealth
To separately identify the average value of a team, we use the performance of the major stock markets in our five countries of interest, standardizing the base year of 2003 at 100. We use the change in the stock market index in the preceding year to instrument average transfer value, under the assumption that the economic performance in a country would affect the amount of money that team owners could marshal to spend on player salaries.
It is important to note that this estimation will generate a Local Average Treatment Effect (LATE), as different teams will be affected to greater or lesser extent by changes in the stock markets. We can group our teams by the level of responsiveness to stock price changes. First, ten of our forty teams are actually listed on their local stock market exchanges. This group has been growing since the first public offering of a team occurred in 1983. Such teams include Borussia Dortmund, Manchester City, Arsenal, A.S. Roma, and Juventus. The second group of teams consists of clubs of owners, such as the 155,000 F.C. Barcelona “socios”, who buy shares in the team for about $300. This practice, common in Spain (e.g. Real Madrid and Atletico), exposes the team heavily to changes in the domestic economy because of their wide array of local owners. The third group consists of teams that are privately owned by an owner or group of owners who share the national descent of the country in which the team is domiciled. Examples include Bayern Munich, Inter-Milan, and AC Milan (the latter, owned by Silvio Berlusconi). Because the owners of these teams run businesses that are exposed to the domestic market, changes in the local economy will influence their ability to spend freely on transfer players. As opposed to the “socios,” however, their own companies’ performance could diverge from the national trend. The final group consists of owners who live and run businesses outside of the country in which their team plays. Classic examples include Chelsea (owned by Roman Abramovich, a Russian), Paris St. Germain (owned by a Quatari consortium), and Manchester United (owned by American Malcom Glazer). For this fourth group, the ownership is relatively insulated from changes in the domestic economy and will be least affected by changes in the stock market, although they may be effected indirectly by changes in attendances sales and merchandising. Because of these differences in exposure, we expect instrument strength to be strongest in groups one and two, and weakest in group four.
We believe this instrument theoretically satisfies the exclusion criterion, as there is very little risk that aggregate national stock market performance affects an individual club’s on-field goal scoring directly, and reverse causality is even less of a threat. We do use the lagged stock market performance because of evidence that team performance on the field affects the specific stocks of listed firms (Scholtens and Peenstra 2009), but both the number of listed teams and their share of national stock market weights is so small, this effect can only be marginal.
5.3Estimation strategy
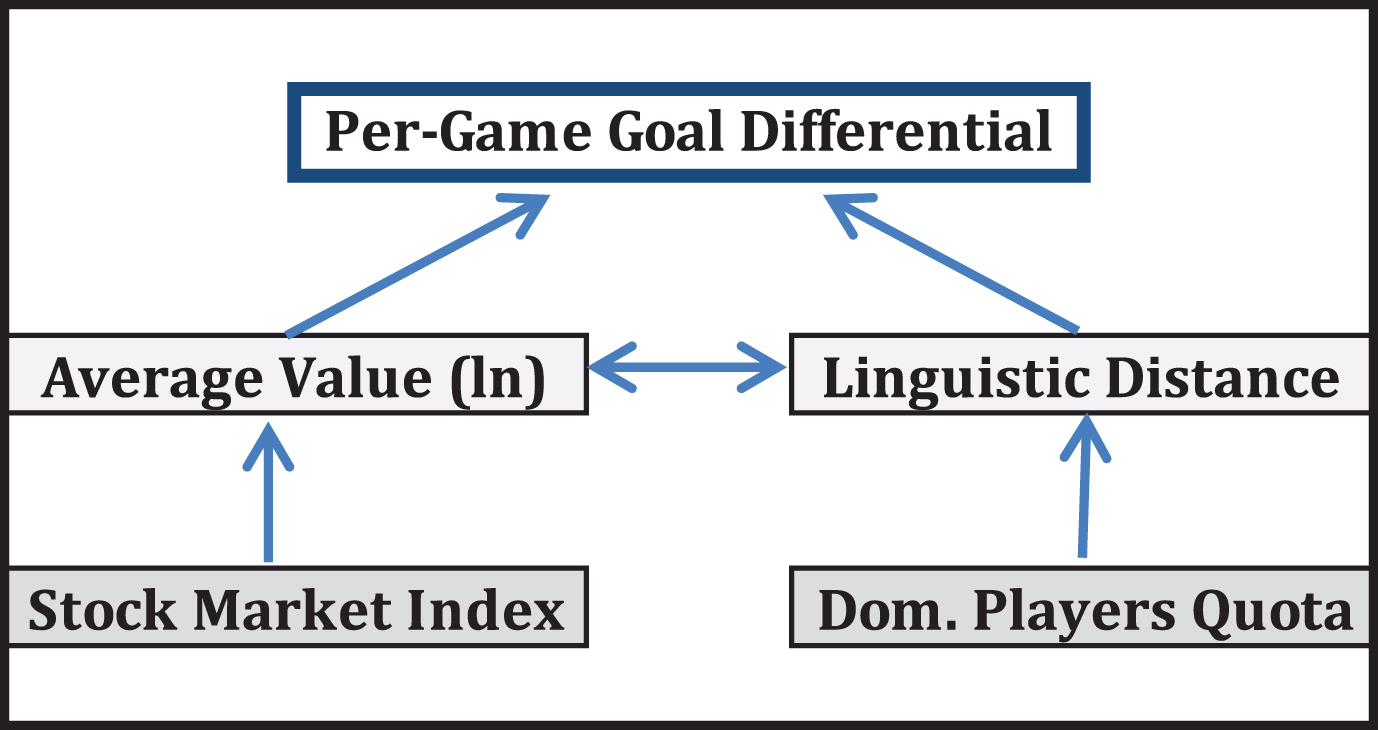
To isolate the causal effects of wealth and diversity, we estimate a three equation Structural Equation Model (SEM), shown below.
The first Equation 2.1 is essentially the same model Table 2 (Model 3), but without the league and time fixed effects, as variation in these dimensions is critical for identifying the hypothesized causal relationship. Home grown player rules and stock market performance are both observed at the country-year level. The key difference between this analysis and Table 2, however, is that we account for: 1) the high covariation between average player value and linguistic distance in the model; 2) the endogenous selection into a soccer team. In Equation 2.2, we allow player value in country i at time t to be a function of an endogenous component (Linguistic Distance) and an exogenous component (Stock Market value). In equation 2.3, we endogenize Linguistic Distance, by regressing it on home grown player quotas (exogenous) in a given year and player values (endogenous). A graphical depiction of the estimation strategy can be shown in Fig. 6 below.
6Results
Table 6 depicts the result of the SEM analysis. In Model 2, we find that both stock market performance and endogenized linguistic distance are both positively correlated with average player values. A 10% change in a country’s stock market performance in the year before leads to about a 5% change in the average transfer value of player values. Angrist and Pishke diagnostics reveal that this the equation is strongly identified and that there is little risk of weak identification bias. In addition, we find that increasing a team’s diversity by one point, would actually increase player values by about 3.5%.
Table 6
Structural equation model (SEM)
| Dependent Variable | Average Goal Differential | Average Value (ln) | Linguistic Distance |
| (1) | (2) | (3) | |
| Endogenous Covariates | |||
| Linguistic Distance | 0.009** | 0.035*** | |
| (0.004) | (0.006) | ||
| Average Value (ln) | 0.781*** | –22.270*** | |
| (0.103) | (5.214) | ||
| Instruments | |||
| National Stock Market Index (Lag 1, 2003 = 100) | 0.005*** | ||
| (0.001) | |||
| Quota for Domestic Players | –6.410*** | ||
| (0.917) | |||
| Constant | –1.628*** | –0.954** | 110.509*** |
| (0.266) | (0.450) | (10.855) | |
| Observations | 152 | 152 | 152 |
| Correlation between DV and Yhat | 0.56 | 0.34 | 0.30 |
| Standardized root mean squared residual | 0.04 | ||
| LR Test (Model v. Saturated) | 9.678** | ||
| LR Test (Baseline v. Saturated) | 174.023*** | ||
| Bayesian Information Criterion | 4029.063 | ||
| Angrist and Pischke Chi-Square (Under) | 21.05*** | 48.35*** | |
| Angrist and Pischke F-Test (Weak) | 20.64*** | 47.39*** |
Standard errors in parentheses; ***p < 0.01, **p < 0.05. This table depicts a three-equation structural equation model, in which average player value and linguistic distance are instrumented by lagged national stock market index and league domestic player quotas respectively.
In Model 3, we also find strong support for our identification strategy. Each one unit increase in the number of players protected by “home grown” rules leads to a –6.4 point decline in linguistic diversity – about one half of a standard deviation. Once we strip away the high covariance between player value and diversity using our two instruments, we find that average player value is actually negatively correlated with the level of diversity not explained by the quotas. In essence, teams are more likely to spend the windfall wealth created by a growing stock market to hire an additional high-profile player (extensive margin) rather than diversifying their average composition of roster (intensive margin). Alternatively, declining stock market performance leads teams to divest from high-profile players.
Moving back to Model 1, which presents the final effects on goal differential once endogeneity and multicollinearity have been addressed, we find strong and significant relationships between both diversity and player value on team performance. In both cases, the coefficient size is about half of the effect of the naïve model (Table 3, Model 3), which is exactly what we would expect after removing potential reverse causality. All else equal, average player value remains extremely important – a 10% change in the salary of players is worth 7.8 goals a game.
More importantly, a one standard deviation change in diversity buys a team about 0.12 goals a game. Thus, a team advancing from the group qualifiers through the knockout the finals would gain 1.56 goals over the course of 13 games. Even after accounting for endogeneity, this is an important substantive effect. About 70% of soccer teams are decided with one of the two teams scoring less than two goals and the average goals per match for both teams is less than three in every league (Anderson 2010b). The bottom line is that teams benefit from adding culturally inherent skill to their roster at every level of playertalent.
7Concluding remarks
In this paper, we explore the question of diversity and performance in the world of professional soccer. Soccer teams are engaged in the exact same pursuit – to score goals and win games. The benefits of a diverse talent pool will have the same theorized benefit for every team. Second, the market for professional players provides a clear indication of the relative talent of any individual player – their transfer price and salary. Wage is related directly to productivity, and is not obscured by seniority or other non-market influences. This allows us to statistically separate the effect of talent from diversity. Third and most importantly, the UEFA Champions League Tournament setting addresses many of the empirical problems that have plagued other work. Only the best teams from each league play, meaning that wealth and prestige are essentially held constant.
The results are clear and straightforward – there is a positive relationship between diversity and performance that is visible even among the very best teams in the world. Teams that eschew international talent to cultivate solely homegrown are likely to come up short on the world’s biggest stage.
Notes
1 The empirical literature that addresses demographic diversity effects in other sports presents inconsistent results as well. Testing racial and age diversity of professional basketball and baseball teams, Timmerman (2000) finds evidence that both diversity dimensions decreased a team’s winning percentage in basketball and were irrelevant in baseball. Kahane et al. (2013) find that teams in the National Hockey League that employed a higher proportion of European players performed better. However, their results also indicate that teams perform better when their European players come from the same country rather than being spread across many European countries.
2 For instance, in 2012, sixteen teams from the Big 5 qualified for the Champion’s League. These sixteen teams include the ten richest clubs in the world by transfer market value (all over all over $480 million USD according to the TransferMarkt website) The next three teams are in the top twenty-five richest world clubs with over $230 million USD in transfer market value. In fact, only one team in 2012 was ranked out of the 100 richest teams worldwide (Montpelier ranked 103).
3 Note that these two objectives do not need to be in conflict with one another. Take the case of Branch Rickey, who broke baseball’s color line and opened Major League Baseball for underrepresented players by signing Jackie Robinson for the Dodgers in 1947 and Roberto Clemente for the Pirates in 1955. The Negro leagues and the Professional Baseball League of Puerto Rico were a huge, untapped source of inexpensive talent. Hence, Rickey’s determination to desegregate Major League Baseball was born out of a combination of idealism and business sense.
4 For a comprehensive survey of the literature, see Alesina and La Ferrara (2005).
5 See Thompson (2014) for a crtitical assessment of Hong and Page (2001) and Page (2007).
6 This negative perspective draws on the theories of social categorization (Tajfel and Turner, 1979) or similarity attraction (Byrne, 1971). These theories suggest that diversity nurtures conflict and turnover and decreases social identification, cohesion, and performance. Hence, all else being equal, groups of similar people should exhibit less internal conflict and greater task performance (Timmerman, 2000).
7 For example, Mannix and Neale (2005) conclude that heterogeneity in race/ethnicity is more likely to have negative effects for groups to function effectively. Milliken and Martins (1996) and Richard et al. (2002), however, do not find a consistent link between racial or gender diversity and team performance. Finally, in a review of the research on diversity and group performance, Williams and O’Reilly (1998) find evidence for both positive and negative effects of age and racial diversity.
8 Freedman and Huang (2014), building on this insight, have shown that research papers written by a more diverse set of co-authors have higher citation rates.
9 The ruling is a European Court of Justice decision concerning freedom of movement for workers. It banned restrictions of European Union (EU) members within the national soccer leagues and allowed professional players in the EU to move freely to another team at the end of their term of contract with their present club. Many leagues, however, continue to insist on quotas for local players– a fact we exploit in the empirical analysis below.
10 Total Football was originally used by the Hungarian national team in the 1950s, and was discovered by Ajax Amsterdam coaches Jack Reynolds and Rinus Michels, a former player under Reynolds. The style came to prominence in the early 1970s when the Dutch national team, which was coached by Michels, won three straight European Championships. Most famously, Ajax won the 1974 European Cup (the precursor to the Champions League) 2-0 over Inter-Milan, which was playing the classic Italian counterattacking style, capping off a 46-0-0 record over two full seasons (Winner, 2012).
11 Despite Ferguson’ statement to the contrary, it is clear that his views were affected by the long-standing historical tensions between Britain and Argentina.
12 For example, in a Total Football framework, each player on the team shoud be capable of handling the ball, and players switch positions fluidly, as game play demands it. Therefore, defenders may venture forward, as midfielders or even strikers drop back to replace them. Players move in and out of open spaces, and the ball moves rapidly through multiple series of short passes until opportunities can be found for attack when the team presses forward (Drejer, 2001, 143).
13 The studies by Carmichael et al. (2000) and Hoffmann et al. (2002) also focus on how team composition affects performance. However, they do not include any direct measure for cultural/national diversity.
14 The tournament consists of several stages. It begins with three knockout qualifying rounds and a play-off round. The ten surviving teams join twenty-two seeded teams in the group stage, in which there are eight groups of four teams each. The eight group winners and eight runners-up enter a knockout phase, which culminates with a final match between the remaining teams.
15 If anything, using this criterion plausibly leads us to underestimate the effect of diversity on team performance.
16 As Anderson and Sally (2013) note, Real Madrid’s President, Florentino Pérez, knew that he could not afford to buy eleven superstars. He could manage, at best, to recruit half a dozen of the very best in the world. The rest would originate in the youth team. This was the policy of Cracks y Pavones, of superstars like Zidane and homegrown hopefuls such as Francisco Pavón.
17 At the time of the analysis, France restricted Ligue 1 teams to 4 non-European players, Italy allows five on rosters and three per match, and Spain allowed for 3 licensed and three fielded (Colucci, 2008). Workarounds exist in all three cases. In Italy, quotas are exchangeable with rich able teams able to buy the quotas of lower-ranked teams in order to pursue international talent. In Spain, citizenship can be obtained via an ancestors’ nationality or after a five-year waiting period. The workarounds, however, are unable to overcome the transaction costs in acquiring diversity created by the rules.
19 In actuality, we observe a strong correlation. See Appendix 3 for a player-level analysis, regressing talent on wealth, controlling for position, country of origin, and player age.
20 Swaab et al. (2014) employ a measure very similar to this one, when they use FIFA All Star line-ups to code talent.
21 See Appendix 1 for team by team descriptive statistics on key variables, and Appendix 2 for correlations between those variables.
22 With only one exception, we cluster the standard errors by team. Due to serial correlation, standard errors in the “within” Model 5 are clustered at the league level.
23 Swaab et al. (2014) suggest that the impact of talent on performance may be quadratic, but we find no evidence for such a relationship in any specification.
24 As Whitwell (2013) notes, Tottenham spent Bale’s fee on the likes of Érik Lamela (Argentina), Christian Erikse (Denmark), Vlad Chiriches (Romania), Étienne Capoue (France), Roberto Soldado (Spain), Nacer Chadli (Belgium), and Paulinho (Brazil).
25 For example, these deviations in a team’s wealth may be due to the appearance of a wealthy individual who is willing to spend a lot of his/her own personal fortune to hire more talented players. This was the case of Chelsea’s Roman Abramovich (2003), Manchester City’s Sheikh Mansour bin Zayed Al Nahyan (2008), and Paris Saint-Germain’s Sheik Hamad bin Jassem bin Jabr Al Thani (2012).
26 Cultural and differences may also impose integration costs on the team off the pitch. Hence, one potential confounder could be the nationality/language of the training staff, coaches etc. The main results, however, are virtually identical when we include coach fixed effects and when we include a dummy variable indicating that a team’s coach is a foreign national. See Appendix A4.
28 Results are very similar when we include teams’ average age, a squared yearly trend instead of year dummies, or when we saturate the model with dummies for league and year combinations.
29 So, for example, if a team wins the Champions League with a 6-6-1 (win-draw-loss) record, such as Chelsea’s in 2007, its average points per game would be 1.84. But a 9-3-1 record, such as Barcelona’s in 2010, is associated with 2.3 points per game.
30 Regression analysis shows the ASJP and SCL language distances are highly correlated (–0.93), with ASJP accounting for roughly 86% of the variation in SCL.
31 The COFI measure in our sample ranges from 0.098 for Arsenal 2011 to 0.59 for Real Bettis in 2005. It is correlated with LFI at 0.79 and linguistic distance at –0.79.
32 The Individualism versus Colectivism cultural dimension captures the degree to which individuals are integrated into groups. In individualistic societies, the stress is put on personal achievements and individual rights. In contrast, in collectivist societies, individuals act predominantly as members of a lifelong and cohesive group or organization (see http://geert-hofstede.com/dimensions.html).
33 We also constructed alterantive measure of team diversity based on the players’ positions on the pitch (i.e. defender, midfielder, forward). The results (available upon request) indicate that what matters is the overall diversity of team rather the the diversity of its constituent “units.” As such, these findings buttress the notion that, in soccer, players’ decisions mutually offset one another (i.e. they are strategic substitutes).
References
1 | Alesina A. and Ferrara E.L. , (2005) , Ethnic diversity and economic performance, Journal of Economic Literature 43: , 762–800. |
2 | Ancona D. and Caldwell D. , (1992) , Demography and design: Predictors of new product team performance, Organization Science 3: , 321–341. |
3 | Andresen M. and Altmann T. , (2006) , Diversity und erfolg im profifussball, Zeitschrift Fuhrung+Organisation 75: , 325–332. |
4 | Anderson C. , (2010) a, The most common scores in soccer: Comparing the big four leagues. Soccer by the Numbers. November 17th http://www.soccerbythenumbers.com/2010/11/most-common-scores-in-soccer-comparing.html |
5 | Anderson C. , (2010) b, Comparing the best soccer leagues in the world. Sports, Inc. 3.1: (Fall), 10–12. |
6 | Anderson C. , (2011) , Comparing the competitiveness of European football leagues, Soccer by the Numbers June 16, 2011. <http://www.soccerbythenumbers.com/2011/06/comparing-competitiveness-of-european.html> |
7 | Anderson C. and Sally D. , (2013) , The Numbers Game. New York: Penguin Books. |
8 | Angrist J.D. and Pischke J.-S. , (2009) , Mostly Harmless Econometrics: An Empiricist’s Companion. Princeton, N.J.: Princeton University Press. |
9 | Ashraf Q. and Galor O. , (2013) . Genetic diversity and the origins of cultural fragmentation, American Economic Review 103: , 528–533. |
10 | Bakker D. , Müller A. , Velupillai V. , Wichmann S. , Brown C.H. , Brown P. , Egorov D. , Mailhammer R. , Grant A. and Holman E.W. , (2009) , Adding typology to lexicostatistics: A combined approach to language classification, Linguistic Typology 13: , 169–181. |
11 | Baur D.G. and McKeating C. , (2011) , Do football clubs benefit from initial public offerings? International Journal of Sports Finance 6: , 40–59. - See more at: http://footballperspectives.org/do-football-clubs-benefit-initial-public-offerings#sthash.GPeJTBZf.dpuf |
12 | Berrone P. , (2011) . Business lessons from the soccer World Cup, Management Research: The Journal of the Iberoamerican Academy of Management 9: , 73–78. |
13 | Brandes L. , Franck E. and Theiler P. , (2009) , The effect from national diversity on team production – empirical evidence from the sports industry, Schmalenbach Business Review 61: , 225–246. |
14 | Bucci G.A. and Tenorio R. , (2010) , Group diversity and salience: A natural experiment from a television game show, The Journal of Socio-Economics 39: , 306–315. |
15 | Carmichael F. , Thomas D. and Ward R. , (2000) , Team performance. The case of English premiership football, Managerial and Decision Economics 21: , 31–45. |
16 | Cattani G. , Ferriani S. , Mariani M. and Mengoli S. , (2012) , Tackling the ‘Galácticos’ Effect: Team Familiarity and the Performance of Star-Studded Projects, Available at SSRN (2012). |
17 | Cavalli-Sforza L. , Luca L. , Menozzi P. and Piazza A. , (1994) , The history and geography of human genes. Princeton: Princeton University Press. |
18 | Christopher D. , (2010) , Arsenal doomed to being a french player’s midnight dream? Bleacher Report. <http://bleacherreport.com/articles/537076-is-arsenal-doomed-to-being-a-french-players-mid-night-dream> |
19 | Colucci M. , (2008) , Quota for Foreign Football Players Allowed to Play in a Club: A Comparative Analysis at a National Level, www.rdes.it/FOREIGN_PLAYERS36.pdf |
20 | Drejer A. , (2001) , How can we define and understand competencies and their development? Technovation 21: (3), 135–146. |
21 | Earley C. and Mosakowski E. , (2000) , Creating hybrid team cultures: An empirical test of transnational team functioning, Academy of Management Journal 43: , 26–39. |
22 | Economist (The), (2012) , Quotas in football: Home groan, Game Theory. Apr 18th <http://www.economist.com/blogs/gametheory/2012/04/quotas-football> |
23 | Elberse A. and Quelch J. , (2008) , Real Madrid Club de Fútbol in 2007: Beyond the Galácticos. Harvard Business School Case Ferguson, Alex. 2013. My Autobiography. London: Hodder & Stoughton. |
24 | Football L. , (2014) , Dataset. Available at <http://www.football-lineups.com> |
25 | Franck E. and Nüesch S. , (2010) , The effect of talent disparity on team productivity in soccer, Journal of Economic Psychology 31: , 218–229. |
26 | Freeburn L. , (2009) , European football’s home-grown players rules and nationality discrimination under the european community treaty, Marq. Sports L. Rev 20: , 177. |
27 | Freeman R.B. and Huang W. , (2014) , Collaborating With People Like Me: Ethnic co-authorship within the US, NBER Working Paper No. 19905, Cambridge, MA. |
28 | Frías F.J.L. , (2015) La Roja: A journey through spanish football, Soccer & Society 16: (1), 149–151. |
29 | Gardiner S. and Welch R. , (2011) , Bosman - there and back again: The legitimacy of playing quotas under european union sports policy, European Law Journal 17: (6), 828–849. |
30 | Gardiner S. and Welch R. , (2011) , Nationality and protectionism in football: Why are FIFA’s ‘6+ 5 rule’and UEFA’s ‘home-grown player rule’on the agenda? Soccer & Society 12: (6), 774–787. |
31 | Gruenfeld D.H. , Mannix E.A. , Williams K.Y. and Neale M.A. , (1996) , Group composition and decision making: How member familiarity and information distribution affect process and performance, Organizational Behavior and Human Decision Processes 67: , 1–15. |
32 | Haas H. and Nüesch S. , (2012) , Are multinational teams more successful? The International Journal of Human Resource Management 23: , 3105–3113. |
33 | Hamilton B.H. , Nickerson J.A. and Owan H. , (2003) , Team incentives and worker heterogeneity: An empirical analysis of the impact of teams on productivity and participation, Journal of Political Economy 111: , 465–497. |
34 | Hoffmann R. , Ging L.C. and Ramasamy B. , (2002) , The socio-economic determinants of international soccer performance, Journal of Applied Economics 5: , 253–272. |
35 | Hofstede G. , (1980) . Culture’s Consequences. Sage, New York. |
36 | Hoisl K. , Gruber M. and Conti A. , (2013) , Knowledge Diversity & Knowledge Overlap in Teams: Empirical Evidence from the Formula 1 Motorsport Industry, unpublished manuscript, Munich School of Management. |
37 | Hollinger J. , (2002) , Pro Basketball Prospectus: 2002 Edition. Potomac Books. |
38 | Hong L. and Page S.E. , (2001) , Problem Solving by Heterogeneous Agents, Journal of Economic Theory 97: , 123–163. |
39 | Kahane L. , Longley N. and Simmons R. , (2013) , The effects of coworker heterogeneity on firm-level output: Assessing the impacts of cultural and language diversity in the national hockey league, Review of Economics and Statistics 95: , 302–314. |
40 | Kremer M. , (1993) , The o-ring theory of economic development, Quarterly Journal of Economics 108: , 551–575. |
41 | Kuper S. and Szymanski S. , (2010) , Soccernomics. New York: Nation Books. |
42 | Ladig D. , (2013) , Points above Replacement: An Investigation in Value, http://www.par-stat.com/?page_id=4 |
43 | Lazear E.P. , (1999) , Globalization and the market for team-mates, The Economic Journal 109: , 15–40. |
44 | Lechner F.J. , (2007) . Imagined communities in the global game: Soccer and the development of Dutch national identity, Global Networks 7: , 215–229. |
45 | Lucey P. , Bialkowski A. , Monfort M. , Carr P. and Matthews I. , (2015) , Quality vs Quantity’: Improved Shot Prediction in Soccer using Strategic Features from Spatiotemporal Data, paper presented at the 9th Annual MIT Sloan Sports Analytics Conference, Boston, February 27-28, 2015. |
46 | Mannix E. and Neale M.A. , (2005) , What differences make a difference? The promise and reality of diverse teams in organizations, Psychological Science in the Public Interest 6: , 31–55. |
47 | Mello A.S. and Ruckes M.E. , (2006) , Team Composition, The Journal of Business 79: , 1019–1039. |
48 | Miguel E. , Saiegh S.M. and Satyanath S. , (2011) , Civil war exposure and violence, Economics & Politics 23: , 59–73. |
49 | Milliken F.J. and Martins L.L. , (1996) , Searching for common threads: Understanding the multiple effects of diversity in organizational groups, Academy of Management Review 21: , 402–433. |
50 | Nüesch S. , (2009) , Are demographic diversity effects spurious? Economic Analysis & Policy 39: , 379–388. |
51 | O’Reilly C.A. and Flatt S. , (1989) , Executive team demography: Organizational innovation and firm performance. Working paper, School of Business, University of California at Berkeley. |
52 | Osborne E. , (2006) , Baseball’s international division of labor, Journal Of Sports Economics 7: , 150–167. |
53 | Page Scott E. , (2007) , The Difference. Princeton: Princeton University Press. |
54 | Prat A. , (2002) , Should a team be homogeneous? European Economic Review 46: , 1187–1207. |
55 | Richard O.C. , Kochan T.A. and McMillan-Capehart A. , (2002) , The impact of visible diversity on organizational effectiveness, Journal of Business and Management 8: (3), 265–291. |
56 | Sedghi A. , (2013) , The world’s best footballers in 2013: Lionel Messi retains his crown, Guardian Datablog. http://www.theguardian.com/news/datablog/2013/dec/24/world-best-footballers-top-100-list-2013-lionel-messi |
57 | Schleifer L. , (2014) , Football Club Elo Ratings, <http://clubelo.com/> |
58 | Silver N. , (2009) , A guide to ESPN’s SPI ratings, ESPN, <A guide to ESPN’s SPI ratings>. |
59 | Spolaore E. and Wacziarg R. , (2009) , The diffusion of development, Quarterly Journal of Economics 124: , 469–529. |
60 | Spolaore E. and Wacziarg R. , (2013) , How deep are the roots of economic development? forthcoming, Journal of Economic Literature. |
61 | Steiner I.D. , (1972) , Group process and productivity. New York: Academic Press. |
62 | Stern H.S. and Mock B. , (1998) , College basketball upsets: Will a 16-seed ever beat a 1-seed? Chance, 11: (1), 26–31. |
63 | Scholtens B. and Peenstra W. , (2009) , Scoring on the stock exchange? The effect of football matches on stock market returns: An event study. Applied Economics 41: (25), 3231–3237. |
64 | Swaab R.I. , Schaerer M. , Anicich E.M. , Ronay R. and Galinsky A.D. , (2014) , The too-much-talent effect team interdependence determines when more talent is too much or not enough. Psychological Science Forthcoming. |
65 | Smith M.D. , (1979) a, Hockey violence: A test of the violent subculture hypothesis, Social Problems 27: (2), 235–247. |
66 | Smith M.D. , (1979) b, Towards an explanation of hockey violence: A reference other approach, Canadian Journal of Sociology 4: (2), 105–124. |
67 | Tajfel H. and Turner J.C. , (1979) , An Integrative Theory of Intergroup Conflict, in Worchel S. and Austin W.G. (eds.). The Social Psychology of Intergroup Relations. Monterey, CA: Brooks- Cole, pp. 94–109. |
68 | Tett G. , (2009) , What bankers can learn from Chelsea football club, Financial Times. |
69 | Timmerman T.A. , (2000) , Racial diversity, age diversity, interdependence, and team performance, Small Group Research 31: , 592–606. |
70 | Thompson A. , (2014) , Does diversity trump ability? An example of the misuse of mathematics in the social sciences, Notices of the American Mathematical Society 61: (9), 1024–1030. |
71 | Transfermarkt, (2014) , 100 Most Valuable Clubs, available at <“http://www.transfermarkt.co.uk> |
72 | United European Football Association (UEFA), (2002) , Italians bar non-EU imports, July 17. <http://www.uefa.com/memberassociations/association=ita/news/newsid=28321.html> |
73 | Watson W.E. , Kumar K. and Michaelsen L.K. , (1993) , Cultural diversity’s impact on interaction process and performance: Comparing homogeneous and diverse task groups, Academy of Management Journal 36: , 590–602. |
74 | Whitwell L. , (2013) , Forget Bale... Tottenham are genuine title contenders now, insists old boy Caulker. Mail Online. September 23rd. http://www.dailymail.co.uk/sport/football/article-2430249/Tottenham-genuine-title-contenders-gareth-Bale-says-Steven-Caulker.html#ixzz2fsFeO3ni |
75 | Whoscored.con, (2014) , Team Statistics. <http://www.whoscored.com/Statistics„> |
76 | Williams K.Y. and O’Reilly C.A. , (1998) , Demography and diversity in organizations: A review of 40 years of research, in Research in Organizational Behavior 20: , 77–140. |
77 | Winner D. , (2012) , Brilliant Orange: The Neurotic Genius of Dutch Football. London: Bloomsbury Publishing. |

