
Gender differences in marathon pacing and performance prediction
Abstract
In this study, we demonstrate that men overestimate their marathon abilities compared to women and propose that this may result from men’s relative overconfidence as well as lead men to execute suboptimal race strategy relative to women. We present a novel dataset of marathoners’ predicted finish times from the 2013 Houston Marathon. Using the runners ex-ante predictions of their own marathon finish times, we show that men consistently overestimate their abilities relative to women. Further, we find that men slow more than women in the later stages of the race and find that less even pacing is correlated with worse marathon performance, results in-line with previous studies. Finally, we argue that this poor pacing is in part explained by men’s overconfidence.
1Introduction
“I have great faith in fools; self-confidence my friends call it.”- Edgar Allen Poe
Who runs a better marathon, men or women?
The answer partly depends on how one defines“better”. When it comes to speed, male runners have the upper hand: elite female marathoners have yet to surpass the records set by elite male marathoners, and many believe this will continue to be the case even for ultra-marathon distances (Zingg et al. 2014).
However, do female runners execute better race strategy, and if they do, why?
Studies from other fields suggest that female runners may have a psychological advantage when it comes to performance under stressful circumstances. For example, studies in the field of finance show that male investors are more overconfident than female investors, leading male investors to overtrade their accounts, manage risk suboptimally, and underperform female investors in their investment strategies (Barber & Odean 2001). Other examples of male overconfidence include Lundeberg et al. (1994), who analyze students’ self evaluations of their answers on course exams and find that undergraduate men show inappropriately high degrees of confidence in their incorrect test answers while women have more accurate perceptions of their incorrect test answers, and Deaux & Farris (1977), who analyze the stated performance of actors and find that men evaluate their performance more favorably than women despite equivalent objective scores.
If male runners are more overconfident than female runners in their athletic abilities, they may pace suboptimally relative to female runners in long distance race events like the marathon which, because of their duration, allow for numerous pace adjustments throughout the race. In fact, previous studies consistently show that women run a more even pace in the marathon than do men, and more even pacing is consistently correlated with faster overall marathon times (Deaner et al. 2014, Santos-Lozano et al. 2014, Trubee et al. 2014, Fitzgerald 2013, March et al. 2011, Lambert et al. 2004). However previous work does little to investigate the cause of this pacing difference between men and women.
Do women execute better, or at least more even, race strategies due to some innate physiological advantage over men? Or, as shown in studies from other disciplines, is the difference due to psychological factors?
In this paper, we introduce a novel dataset of marathoners’ predicted finish times, which we were able to obtain through the generous help of the organizers of the annual Houston Marathon. We test the hypothesis that men overestimate their own marathon ability. We find the data are consistent with this hypothesis; that is, we find a statistically significant difference between how men and women perform relative to their stated goals.
After we show men significantly overestimate their marathon abilities relative to women, we show that this discrepancy explains some of the differences between male and female runners in marathon pacing that has been shown in earlier work. Specifically, we demonstrate that overstating one’s predicted marathon performance is correlated to greater slowdown in the latter portion of the race.
This paper is organized as follows: Section 2 reviews results from relevant past work. Section 3 describes the dataset and states our hypotheses. Section 4 contains the results of our analyses of male vs. female race strategy. Finally, Section 5 delineates our conclusions and proposes potential future work.
2Literature review
Earlier studies have investigated optimal pacing strategies for divers running events. Gosztyla et al. (2006) analyze the impact of pacing on the performance of 5k races and find that runners should begin the race 3–6% faster than their average race pace. That said, given the difference in the physiological demands of a 5k race compared to a marathon, it is not immediately evident these results are applicable to the marathon distance.
Haney Jr et al. (2011) analyze the relationship between race performance and pace variance. They collect data on the pace variance of 311 runners from the Las Vegas and San Diego marathons from GPS data on the website Garmin Connect. The authors find that a lower variability in pacing is associated with faster finishing times. In the Appendix, we confirm these results with runners from the Houston Marathon. Similarly, Lambert et al. (2004) report that in the 100 km IAU World Challenge, faster runners were able to maintain their initial speed for a longer distance and showed a lower overall percentage decrease in their speed relative to slower runners. We will visit similar results in Section 4.
Improvements in pace timing technology have enabled a moderate amount of recent work analyzing differences in running performance and pacing between men and women. March et al. (2011) report that age and sex are both determinants of pacing and find women to be superior pacers compared to men, where “pacing” is defined as the mean velocity in the last 9.7 km divided by the mean velocity in the first 32.5 km with a lower ratio implying better pacing. Similar results were later reported in Trubee et al. (2014), which extend the literature by factoring in heat stress. Santos-Lozano et al. (2014) and Deaner et al. (2014) both report similar results, the former based on data from the New York marathon from 2006 to 2011, and the latter based on data from 14 marathons in 2011. Further, Deaner et al. (2014) show that slower and less experienced runners exhibit worse pacing but find that this does not explain the gender pacing difference. In the Appendix, we confirm the work of March et al. (2011) for participants of the Houston Marathon by running a regression to assess the effects of age, sex and finish time on pacing.
The literature consistently finds that women run a more even pace in the marathon than do men, but what is the underlying mechanism responsible for this pacing difference between genders? Earlier work has proposed the possibility that women have a metabolic advantage over men in races at the marathon distance or longer because women store and metabolise fat more efficiently than do men (Coast et al. 2004). This physiological difference may explain why men slow down more in the latter part of the marathon than do women. However, previous works refute the idea that women can outrun men in distances up to the 24-hour ultra-marathon and suggest that the metabolic benefits that women may enjoy are overshadowed by regular glucose intake during these races (Peter et al. 2014, Zingg et al. 2014, Coast et al. 2004). Deaner et al. (2014) conclude that the sex difference in pacing may reflect differences in physiology, decision making or both but provide no compelling evidence of either cause. Finally, a working paper by Krawczyk et al. (2015) present results of a 2012 study of the Warsaw Marathon, where participants were asked to predict their marathon performance and were awarded prizes for finishing close to their predictions. Similar to our work, the authors also find a relationship between over-prediction of marathon ability and pacing.
There is a wide body of work analyzing differences in overconfidence between men and women outside marathon pacing. Lundeberg et al. (1994) analyze students’ self evaluations of their answers on course exams and find that undergraduate men show inappropriately high degrees of confidence in their incorrect test answers while women have more accurate perceptions of their incorrect test answers. Deaux & Farris (1977) analyze the stated performance of actors and find that men evaluate their performance more favorably than women and that this effect is strongest for tasks perceived to be masculine. Barber & Odean (2001) apply the same notion of overconfidence to the field of economics. The authors claim the overconfidence of men is exhibited in their overtrading in household brokerage accounts and that the difference has a net negative impact on the profits of the overly confident gender.
Croson & Gneezy (2009) survey the existing literature on gender differences in economic experiments. They find evidence that women are more risk averse than men and that women are more averse to competition than men. While overconfidence is one explanation for the difference in risk attitudes between genders, a difference in emotional experiences of outcomes between men and women is another plausible explanation. Further, the authors find that men tend to react differently to competition, with men’s performance generally improving relative to women as the competitiveness of an environment increases. These differential risk preferences and responses to competition offer an alternative to overconfidence as potential psychological drivers of men’s overestimating their abilities ex-ante relative to women in running and in other fields.
We believe we add to the literature by first providing statistically significant evidence in favor of the hypothesis that men overestimate their predicted finish times relative to women when assessing their own marathon racing abilities. While we hypothesize that this overestimation is a measure of overconfidence, we caution that this measure could reflect a general difference in risk preferences potentially driven by a blend of factors. We also contribute to the growing body of work on marathon pacing by showing a statistically significant link between the ex-ante overestimation of and realized marathon performance.
3Data
We use data from the 2013 Chevron Houston Marathon, posted online at (Houston Marathon Committee 2013) along with registration metadata obtained from the Houston Marathon Committee. Our ability to study this novel dataset is entirely due to the generosity of the Houston Marathon Committee.
To our knowledge, this is the first time anonymized registration data, in particular predicted finish times, has been used to study psychological effects in marathon pacing strategy. We describe each of the dataset features below.
3.1Features
The dataset provided by the Houston Marathon Committee has the following features:
• Gender - Male or female.
• Age- The age of the runner. For our analysis, we group runners by decade with the exception that we group all runners under the age of 20 together due to the small size of this subset.
• Corral - Houston Marathon participants were organized into four separate corrals based on expected finish times. Acceptance into corral A was dependent on prior marathon or half marathon performance, whereas corral B and corral O entry was based on predicted finish times. Ex-ante we believe it is likely that runners from the three different corrals represent different populations of runners, so when possible we group results by corral. Finally, corral X represents the elite corral. To summarize, the four corrals are
– Corral X - The elite corral.
– Corral A - Requires a marathon completed in the past year in 4:00:00 or faster or a half marathon completed in 1:52:55 or faster.
– Corral B - Predicted finish time faster than 4:30:00.
– Corral O - Predicted finish time 4:30:00 or slower.
• Net Finish Time - The amount of time between when the runner crossed the start line to when the runner crossed the finish line. All participants’ bibs included a timing chip providing an accurate estimate of when the participant crossed the start and finish lines.
• Splits - The amount of time between when the runner crossed the start line and when the runner crossed the 5K, 10K, 15K, 20K, half marathon, 25K, 30K, and 35K points. Because GPS-enabled running watches and other devices can interfere with chip technology, not all splits are available for all runners.
• Predicted Finish Time - The amount of time a runner expected to take to finish the marathon at the time they registered. Runners were allowed to register up to 9 months before the race. We do not have data on the exact time of registration for each runner. Because the predicted finish times are self-reported, we interpret this value as a runner’s estimation of his/her own ability.
We also define two derived features for each runner:
• Shortfall - The log difference between the runner’s net finish time and his/her predicted finish time, computed as log (Fnet) − log (Fpredicted).1 That is, how much the runner fell short of his/her predicted finish time. Because Fpredicted is self-reported prior to the race by each runner, we believe shortfall is a proxy for a runner’s ex-ante overestimation of his or her own abilities. That said, there are many other exogenous factors that may determine Fnet, for example race-day conditions, last minute injuries, or unexpected health issues. Nevertheless, we believe our work is the first to link self-reported data of predicted performance to realized pacing strategies.
• 2nd Half Slowdown - The log difference between the runner’s net time from the half point to the finish line and the runner’s net time from the start line to the half point, computed as log (Thalf,finish) − log (Thalf,finish) . This measure is in line with similar measure of pacing used by previous literature, and we further describe other measures of pacing in Section 2.
3.2Data Survey
The data cover a total of 6676 runners. Table 1 summarizes the coverage of our data for various buckets. Specifically, for each bucket we provide counts of the total number of runners (column A), counts of the total number of runners for whom we have a valid predicted finish time (column B) and the total number of runners that have valid splits (column C). We provide both a raw count and a percent of the total number of runners. Also, we provide data split by age and corral.
We note that corral A makes up 36% of the overall running population but only 18% of the population of runners with valid predicted finish times. Thus, corral A may be under-represented in analyses involving predicted finish times. In this paper, when possible, we try to group results by corral to verify that reported effects hold within each corral as well as across the entire population.
Figure 1 plots the histogram of finish times for men and women. On average, men ran the 2013 Houston Marathon faster than women. Also, though not a focus of this paper, we see visual evidence of men having a greater tendency to run times closer to round number reference points (Allen & Dechow 2013). We discuss topics related to risk aversion and loss in Sections 2 and 5.
Figure 2 plots the distribution of finish times for runners split by corral and by age. Figure 2a visualizes the expected result that runners in slower corrals do indeed run more slowly on average. Figure 2b plots the density of net finish times by age decade. We see that the oldest runners (runners over the age of 50) and the youngest runners (runners under the age of 20) tend to run the slowest races.
3.3Data cleaning
In the raw dataset, we find a number of egregious entries for predicted finish times which are likely due to either data collection or user input errors. For example, it is possible some runners erroneously input predicted half marathon finish times in place of full marathon predicted finish times. Before any analysis, we apply the following basic filtering rules to our input data in order to remove the most egregious outliers.
• Remove runners outside corral X (the elite corral) that predict they will run faster than the course record2 This criterion alone removes 54 runners from our sample.
• Remove runners in corral B or O who predict they will run faster than 2:30:00. This criterion alone removes 63 runners from our sample.
• Remove runners whose predicted finish time is within 15 minutes of their best half marathon time. This criterion alone removes 6 runners.
Applying all three rules removes a total of 71 runners3 from our sample, or 1% of our total runner population. We believe these three filters are intuitive and should add negligible bias to our sample.
4Results
4.1Shortfall: Predicted finish time vs. actual finish time
In this section we focus on shortfall, defined in Section 3 as the log difference between runners’ ex-ante predicted finish time and their actual finish time.
In particular, because predicted finished times are supplied by runners themselves prior to the race, we argue that in general these predicted times represent runners’ evaluation of their own abilities. Further, we propose shortfall reflects a runner’s confidence in their abilities with larger values of shortfall (a runner’s over-prediction of his/her own marathon speed) indicating overconfidence. However, it is also possible that the more aggressive male predicted times reflect a general preference for greater risk-taking perhaps due to a confluence of factors including confidence, emotion, and competitiveness. Below, we analyze how shortfall varies by gender, corral, and age.
Figure 3 plots shortfall density across all runners and by gender, corral, and age, and Table 2 provides summary statistics for shortfall across all runners and by gender, corral, and age. The average shortfall is 8.5% across all runners – that is, on average, all runners run about 8.5% slower than their self-reported predicted finish times.
We see from Fig. 3c and Table 2c that runners in corral A run closer to their predicted times than runners in corral B. The average shortfall of runners in corral A is approximately 9.6%, while the average shortfall for corral B is approximately 11.2%. Table 3 shows that this difference is statistically significant withp <0.01.
When comparing corral O to corrals A or B we see that runners in corral O on average have the lowest shortfall, and this number is significantly lower than the averages for corrals A and B. At first this seems puzzling, particularly in comparison to corral A, as corral A runners must demonstrate previous marathon or half marathon experience in order to gain entry into corral A, and it is reasonable to expect prior experience running long distance races to translate into better finish time predictions. However, we recall from Section 3 that runners have a maximum time of 6 hours to finish the marathon, and all runners slower than 6 hours have been effectively removed from our sample. This cutoff is especially apparent in the density plot in Fig. 2b where the distribution shows a sharp clip at 6 hours. Given that runners whose predicted finish times are slower than 4:30 were placed in corral O, and given that these runners have the greatest likelihood of running more slowly than 6 hours, corral O is the most susceptible to this selection bias.
Tables 2b and 3 show that there is a statistically significant difference in shortfall between men and women. Women tend to underestimate their finish times by roughly 7.6% and men tend to underestimate their finish times by approximately 9.0%. The difference in shortfall between genders is statistically significant with p <0.01. Tables 4a and 4b show that this difference in shortfall between genders is consistent within different corrals and age groups.
Table 2d compares shortfall between different age groups. Although the 30–40 age group appears to be the best at running their predicted pace, Table 3 shows that once we account for the effects of multiple hypothesis testing (comparing all pairs of age groups), we find no statistically significant difference in shortfall between age groups.
In summary, we find a statistically significant difference in shortfall between men and women with men consistently overstating their ex-ante predicted marathon performance. We find that the difference in shortfall between men and women is consistent (though not always significant) across all starting corrals and age groups. From this, we conclude that men consistently over-predict their marathon racing abilities relative to women.
We believe our comparison of ex-ante predictions of marathon performance between genders provides a significant extension to the existing literature. We posit that the bias men exhibit in over-predicting their marathon speed also drives them to adopt suboptimal pacing strategies relative to women. We explore this hypothesis in the sections below.
4.2Pace profile
In this section, we demonstrate that men execute a less even pacing strategy relative to women, building on earlier work that demonstrates that men are more likely to slow down in the latter part of a marathon than are women (Deaner et al. 2014, Santos-Lozano et al. 2014, Trubee et al. 2014).
To compare this slowdown effect between men and women, we analyze the split times described in Section 3. First, we examine a coarse, univariate measure of pacing defined above: 2nd Half Slowdown4 Figure 5a shows a histogram of the Second Half Slowdown metric for all runners by gender and provides visual evidence that male runners tend to slow down more than their female counterparts in the second half of the race. On average, men slow down roughly 11% in the second half of the race while women slow down about 8%, and this difference is significant (T-statistic = 13.3). Further, Figs. 5b, 5d, and 5d show that the difference between men and women’s pacing strategies is consistent across corrals.
Because we have splits data at every 5K for the 2013 Houston Marathon, we are able to analyze the runners’ pacing strategy on a more granular basis. We compute for each runner a pace profile – the percentage difference between the pace in each split from the runner’s pace for the full race. We then plot the average pace profile across male and female runners in Fig. 6a and compute the Tstatistic of the difference between average male and female pace profiles across splits, shown in Tables 5 and 6 in the Overall column.
We find that men pace significantly faster than women before 25K and significantly more slowly than women in the last 12.2K of the race. This corroborates earlier results that men slow down significantly relative to women in the latter part of the marathon.
We also plot the average pace profiles across corrals (Fig. 6b) and across age decades (Fig. 6c). These plots suggest that pace profiles do not differ significantly across corrals or across age groups, except for runners under 20, who on average ran a less even race than runners in other age groups.
Table 5 and Table 6 show that the difference between men and women’s pace profiles remains significant across both corrals and age groups: before the 25K mark, men pace more quickly than women, and after the 30K mark, men pace significantly more slowly than women. The effect is less significant in the under 20 and 60–70 age groups, partly because of the small number of datapoints in each (<100 in the under 20 age group and 233 in the 60–70 age group) – the average difference between men’s and women’s pacing is of a similar or larger magnitude as compared to other age groups. It is also possible that the psychological or physiological differences that lead to pacing differences between men and women are less pronounced in the youngest, least experienced runners and in the elderly.
4.3Pacing and shortfall
We have shown that men tend to overstate their marathon abilities ex-ante, and we have also shown that on average men tend to slow down in the latter part of a marathon more than do women. In this section, we link these two concepts by showing a significant relationship between pacing and shortfall. We begin by revisiting known results between overall marathon performance and pacing, and we then extend these results to include shortfall.
As discussed in Section 2, popular marathon wisdom and previous work show a positive correlation between marathon pacing and marathon performance – that is, runners that slow down more in the latter parts of the race also post slower marathon times (Santos-Lozano et al. 2014, Deaner et al. 2014). We now add to the existing literature by first confirming this result in our dataset: for runners of the 2013 Houston Marathon, slower pacing is associated with slower finish times. These results are in line with prior results reported by Haney Jr et al. (2011) and Lambert et al. (2004).
Figure 7 provides a scatterplot of net finish times against 2nd Half Slowdown. We see the same effect across all runners as within each corral: runners who slow down more in the second half of the race tend to run more slowly. The correlation between 2nd Half Slowdown and overall finish time is 32%. Also, as reported in the Appendix, we see the same effect using both 2nd Half Slowdown and a similar metric proposed by March et al. (2011): both measures of pacing are positively correlated with slower finish times5
Is the relationship between faster finish times and more even pacing due to physiology or psychology? On one hand, the same physiological mechanisms that determine a runner’s overall marathon ability may also influence their ability to pace. In particular, faster runners may be better trained and capable of storing more glycogen than slower runners. On the other hand, slower runners may be less experienced and therefore more likely to overestimate their abilities in the first half of the race. Indeed, the relationship between marathon speed and pacing is likely a blend of both psychological and physiological factors.
Given this ambiguity, our shortfall measure provides a unique perspective on the relationship between performance and pacing. Because shortfall is based on a runner’s self-assessment of his/her future performance, we have proposed above that shortfall is a measure of a runner’s overconfidence. We now show a significant relationship between shortfall and pacing.
Figure 8 documents the significant positive correlation between shortfall and 2nd Half Slowdown across all runners. Figures 8b, 8c, 8d show that this significant positive correlation holds across all corrals. Figure 9 shows that this relationship is also stable across genders.
To summarize, we first confirm that there is a statistically significant relationship between pacing and overall marathon performance, an effect which has been documented in earlier investigations. We are the first work to independently verify that this effect also exists for participants in the Houston Marathon. We then argue that pacing is at least partially psychological by showing a statistically significant relationship between pacing and our unique shortfall measure. We find that this significant positive correlation between shortfall and marathon pacing holds across age groups, gender categories, and starting corrals.
5Conclusions
Although many aspects of men’s physiology give them an advantage over women in running speed, men’s psychology may give them a disadvantage compared to women when it comes to pacing strategy.
In this study, we show that men under perform their predicted finish times worse than women, and we posit that overconfidence is one of the reasons for this shortfall. Our result adds to a growing body of literature from other fields comparing overconfidence and risk preferences between men and women. We also affirm that men tend to run a less even pace than women, a result in line with previous studies, and we confirm well known results that more even pacing is associated with faster marathon performance. We argue that poor pacing is in part explained by psychological factors like overconfidence.
We first define shortfall as the log difference between runners’ ex-ante predicted finish times and their actual marathon finish times. Because predicted finish times are specified by each runner prior to the race, we argue that shortfall is a measure of runners’ overconfidence in their own abilities, and we believe this is the first study to analyze such a measure. We present evidence that show that on average men have higher shortfall than women, a difference that is statistically significant, and we believe this difference is evidence of overconfidence. We now present alternative hypotheses.
One alternate hypothesis lies with our interpretation of shortfall. While we posit this reflects a runner’s overconfidence in his or her own abilities, it is possible shortfall reflects a more a general difference in risk preferences across genders previously observed (Allen & Dechow 2013, Croson & Gneezy 2009). For example, shortfall could reflect a measure of how aggressively a runner sets his or her own goals, with more conservative goals reflecting higher risk aversion. As discussed in Croson & Gneezy (2009), in addition to confidence differences, a higher risk aversion among women could be explained by other factors such as one’s emotional response to not achieving a goal. For example, women may experience stronger emotional responses to negative outcomes (missing their goal time) and may set target times more conservatively as a result.
Another alternative explanation is that shortfall is not a good measure of overconfidence because predicted finish time is a weak or inaccurate proxy for runners’ ex-ante evaluation of their own abilities. This may be true if runners put little thought into their predicted finish times. For example, if all runners predicted a 4 hour finish time regardless of their abilities then shortfall would provide no new information beyond actual finish times. Some runners may input their predicted finish times with the goal of entering a specific corral (e.g., to run next to a friend) rather than with the goal of accurately predicting their finish time. Furthermore, we do not know exactly when runners entered their predicted finish values. It is likely that the longer the gap between when a runner specified his/her predicted time and the day of the race, the more noisy and inaccurate his/her predicted finish time becomes at measuring self-reported ability. Many issues, including injury and sickness, can arise during a marathon training program that may cause runners to adjust their expectations. It is possible that such issues afflict men more frequently than they do women and that shortfall reflects a higher incidence of injury during training in men rather than overconfidence. It may be possible to gather a better measure of predicted finish time by interviewing runners at the start line immediately prior to the race, though this may prove infeasible at scale.
Another argument against shortfall as a proxy for overconfidence is that unlike other domains such as finance, there are no real penalties for specifying poor or unrealistic finish times. In fact, one can argue that there is a larger penalty for under prediction of one’s abilities, since runners in later corrals are generally slower (perhaps making it harder to run at a faster target pace), and later corrals have a later start time. That said, these rewards and penalties are experienced by all runners in corrals B and C, yet we find consistent over-prediction of men in all corrals.
After we show that men experience significantly higher shortfall than do women, we analyze pace profile and show that men tend to pace more poorly than women in the 2013 Houston Marathon. More specifically, men show a greater tendency to slow down in the latter stages of a marathon compared to women. Men also show a greater tendency to pace faster than women in the first 25K of the marathon. We find this effect holds across corrals and genders. This confirms results previously reported in the literature for other populations of runners.
Finally, we demonstrate a relationship between shortfall and marathon performance. We first analyze the relationship between pacing and finish time and show that for runners of the 2013 Houston Marathon, slowing down in the second half of the race is positively correlated with slower marathon times, confirming another previously reported effect. We also find a significant relationship between pacing and shortfall, and we argue that this is evidence of a psychological component in pacing. In particular, men demonstrate greater shortfall, over-prediction of their own abilities, and we propose this leads men to pace worse relative to women in the marathon. We suggest shortfall is a measure of overconfidence, and one way overconfidence may lead to less even (arguably suboptimal) pacing is that overconfident runners begin the marathon at an unsustainably fast past and slow by the end of the race. Our analysis of men’s and women’s pacing profiles finds evidence that men pace the first 25K of the marathon significantly faster compared to women, consistent with the psychological mechanism of overconfidence. It is worth noting that this argument rests on the assumption that more even pacing is an optimal strategy, which may not be true, especially for non-elite runners, and that shortfall provides a measure of overconfidence and, as mentioned above, shortfall may be a poor or noisy estimate of overconfidence.
Throughout this paper, we have tried to be diligent about selection bias and when possible, we verify that results hold within different corrals and age groups. However, it is possible our results are still driven by biases in our data or methodology. First, as described in Section 4.1, our dataset is missing all runners with finish times over 6 hours, since this was the maximum time allowed for the course. Removing runners with finish times over 6 hours may bias our sample. Further, it is possible that the differences between walking and running could bias our results especially in corral O, where participants are likely to have a greater chance of walking. Also, it is possible that runners with predicted finish times are not representative of the full sample of Houston Marathon runners. For example, in corral A, where specifying predicted finish times was optional, it is possible only the most overconfident runners opted to specify finish times. Also, while we believe it unlikely, it is possible that runners of the Houston Marathon are not representative of the general population of marathon runners. Thus, although we believe our conclusions are representative of runners in general, we concede that it is possible our results are subject to biases in our data.
With these caveats in mind, we believe we have presented a novel metric for overconfidence in quantitative running literature – shortfall, the difference between a runner’s predicted finish time and his/her actual finish time – and demonstrated a positive relationship between shortfall and marathon pacing. These results add to the literature by providing empirical evidence that psychological factors partly explain men’s less even pacing strategy relative to women.
Appendices
6
6Appendix
6.1Confirmation: Alternative pacing measure
We now explore the metric proposed by March et al. (2011), which the authors define as the mean velocity during the last 9.7k divided by mean velocity during the first 32.5km6 We first confirm the results reported in March et al. (2011) for runners in the Houston Marathon, showing that age, sex, and finish time all determinants of pacing.
Table 7 provides results for the following regression, which is similar to that reported by March et al. (2011):
(1)
6.2Confirmation: Variability of pacing
Here, we explore the metric proposed by Haney Jr et al. (2011) using data from the Houston Marathon. The authors propose the following:
Velstdev is the standard deviation of velocity over the duration of the marathon Velmean is the average velocity over the duration of the marathon. However, while Haney Jr et al. (2011) analyzed GPS data from the Garmin Connect webpage, our pacing is sampled at 5k intervals. Thus, we calculate Velmean for runners of the Houston Marathon using the 5k split times described in Section 3.
We first note that Velcov is highly correlated to both 2nd Half Slowdown and the pacing measure defined by March et al. (2011). We find a 88% correlation between Velcov and second half slowdown, and an 83% correlation between Velcov and the pacing measure used by March et al. (2011).
Next, we confirm that the effect reported by Haney Jr et al. (2011) also holds with runners from the Houston Marathon by analyzing the following linear regression:
Where Marathon Finish Time is the time in hours. We find the following coefficients:
Acknowledgments
We would like to thank Vicky Oddi and the Houston Marathon Committee for helping provide data for our analysis. We would also like to thank Ken Baron for his invaluable guidance, and Chris Kanich for his insightful feedback.
References
1 | Allen E.J., Dechow P.M., (2013) . The ‘rationality’ of the long distance runner: Prospect theory and the marathon, Available at SSRN 2342396. |
2 | Barber B.M., Odean T., (2001) . ‘Boys will be boys: Gender, overconfidence, and common stock investment’, Quarterly Journal of Economics. 261–292. |
3 | Coast J.R., Blevins J.S., Wilson B.A., (2004) . Do gender differences in running performance disappear with distance? Canadian Journal of Applied Physiology. 29: (2), 139–145. |
4 | Croson R., Gneezy U., (2009) . Gender differences in preferences, Journal of Economic Literature. 448–474. |
5 | Deaner R.O., Carter R.E., Joyner M.J., Hunter S.K., (2014) . Men are more likely than women to slow in the marathon, Medicine and Science in Sports and Exercise. |
6 | Deaux K., Farris E., (1997) . Attributing causes for one’s own performance: The effects of sex, norms, and outcome, Journal of Research in Personality. 11: (1), 59–72. |
7 | Fitzgerald M., (2013) . The art –and science –of marathon pacing. URL: competitor.com. |
8 | Gosztyla A.E., Edwards D.G., Quinn T.J., Kenefick R.W., (2006) . The impact of different pacing strategies on five-kilometer running time trial performance, The Journal of Strength & Conditioning Research. 20: (4), 882–886. |
9 | Haney T. Jr., et al., (2011) . A description of variability of pacing in marathon distance running, International Journal of Exercise Science. 4: (2), 6. |
10 | Houston Marathon Committee, (2013) . Houston marathon 2013 results. http://results.houstonmarathon.com/2013/ |
11 | Krawczyk M., Wilamowski M., et al., (2015) . Are we all overconfident in the long run? evidence from one million marathon participants, Technical report. |
12 | Lambert M.I., Dugas J.P., Kirkman M.C., Mokone G.G., Waldeck M.R., (2004) . Changes in running speeds in a 100 km ultra-marathon race, Journal of Sports Science & Medicine. 3: (3), 167. |
13 | Lundeberg M.A., Fox P.W., Punćcohaŕ J., (1994) . Highly confident but wrong: Gender differences and similarities in confidence judgments, Journal of Educational Psychology. 86: (1), 114. |
14 | March D.S., Vanderburgh P.M., Titlebaum P.J., Hoops M.L., (2011) . Age, sex, and finish time as determinants of pacing in the marathon, The Journal of Strength & Conditioning Research. 25: (2), 386–391. |
15 | Peter L., Rust C.A., Knechtle B., Rosemann T., Lepers R., (2014) . Sex differences in 24-hour ultra-marathon performance-a retrospective data analysis from 1977 to 2012, Clinics. 69: (1), 38–46. |
16 | Santos-Lozano A., Collado P., Foster C., Lucia A., Garatachea N., (2014) . Influence of sex and level on marathon pacing strategy. insights from the New York City race, International Journal of Sports Medicine, (EFirst). |
17 | Trubee N.W., Vanderburgh P.M., Diestelkamp W.S., Jackson K.J., (2014) . Effects of heat stress and sex on pacing in marathon runners, The Journal of Strength & Conditioning Research. 28: (6), 1673–1678. |
18 | Zingg M.A., Karner-Rezek K., Rosemann T., Knechtle B., Lepers R., Rüst C.A., et al., (2014) . Will women outrun men in ultra-marathon road races from 50 km to 1,000 km, Springer Plus.3: , 97. |
Notes
1 Throughout this paper, we report shortfall as a percentage. While log differences and percent differences are approximately equal at first order, we prefer log differences due to the symmetry of the transformation. Furthermore, we prefer log differences to raw differences since we find the magnitude of log differences to be more invariant to overall finish time.
2 At the time of analysis, the male course record was 2:06:51, and the female course was 2:23:14.
3 Many runners met 2 or more criteria.
4 Our 2nd Half Slowdown metric is similar to the metrics proposed by March et al. (2011). We provide further results on alternative pacing metrics in the Appendix.
5 Our 2nd Half Slowdown metric is roughly 91% correlated with the pacing metric proposed by March et al. (2011).
6 Because we only have splits sampled at 5k intervals, we report the mean velocity during the last 10k divided by the first 32.19k.
Figures and Tables
Fig.1
Histogram of finish times normalized by gender.
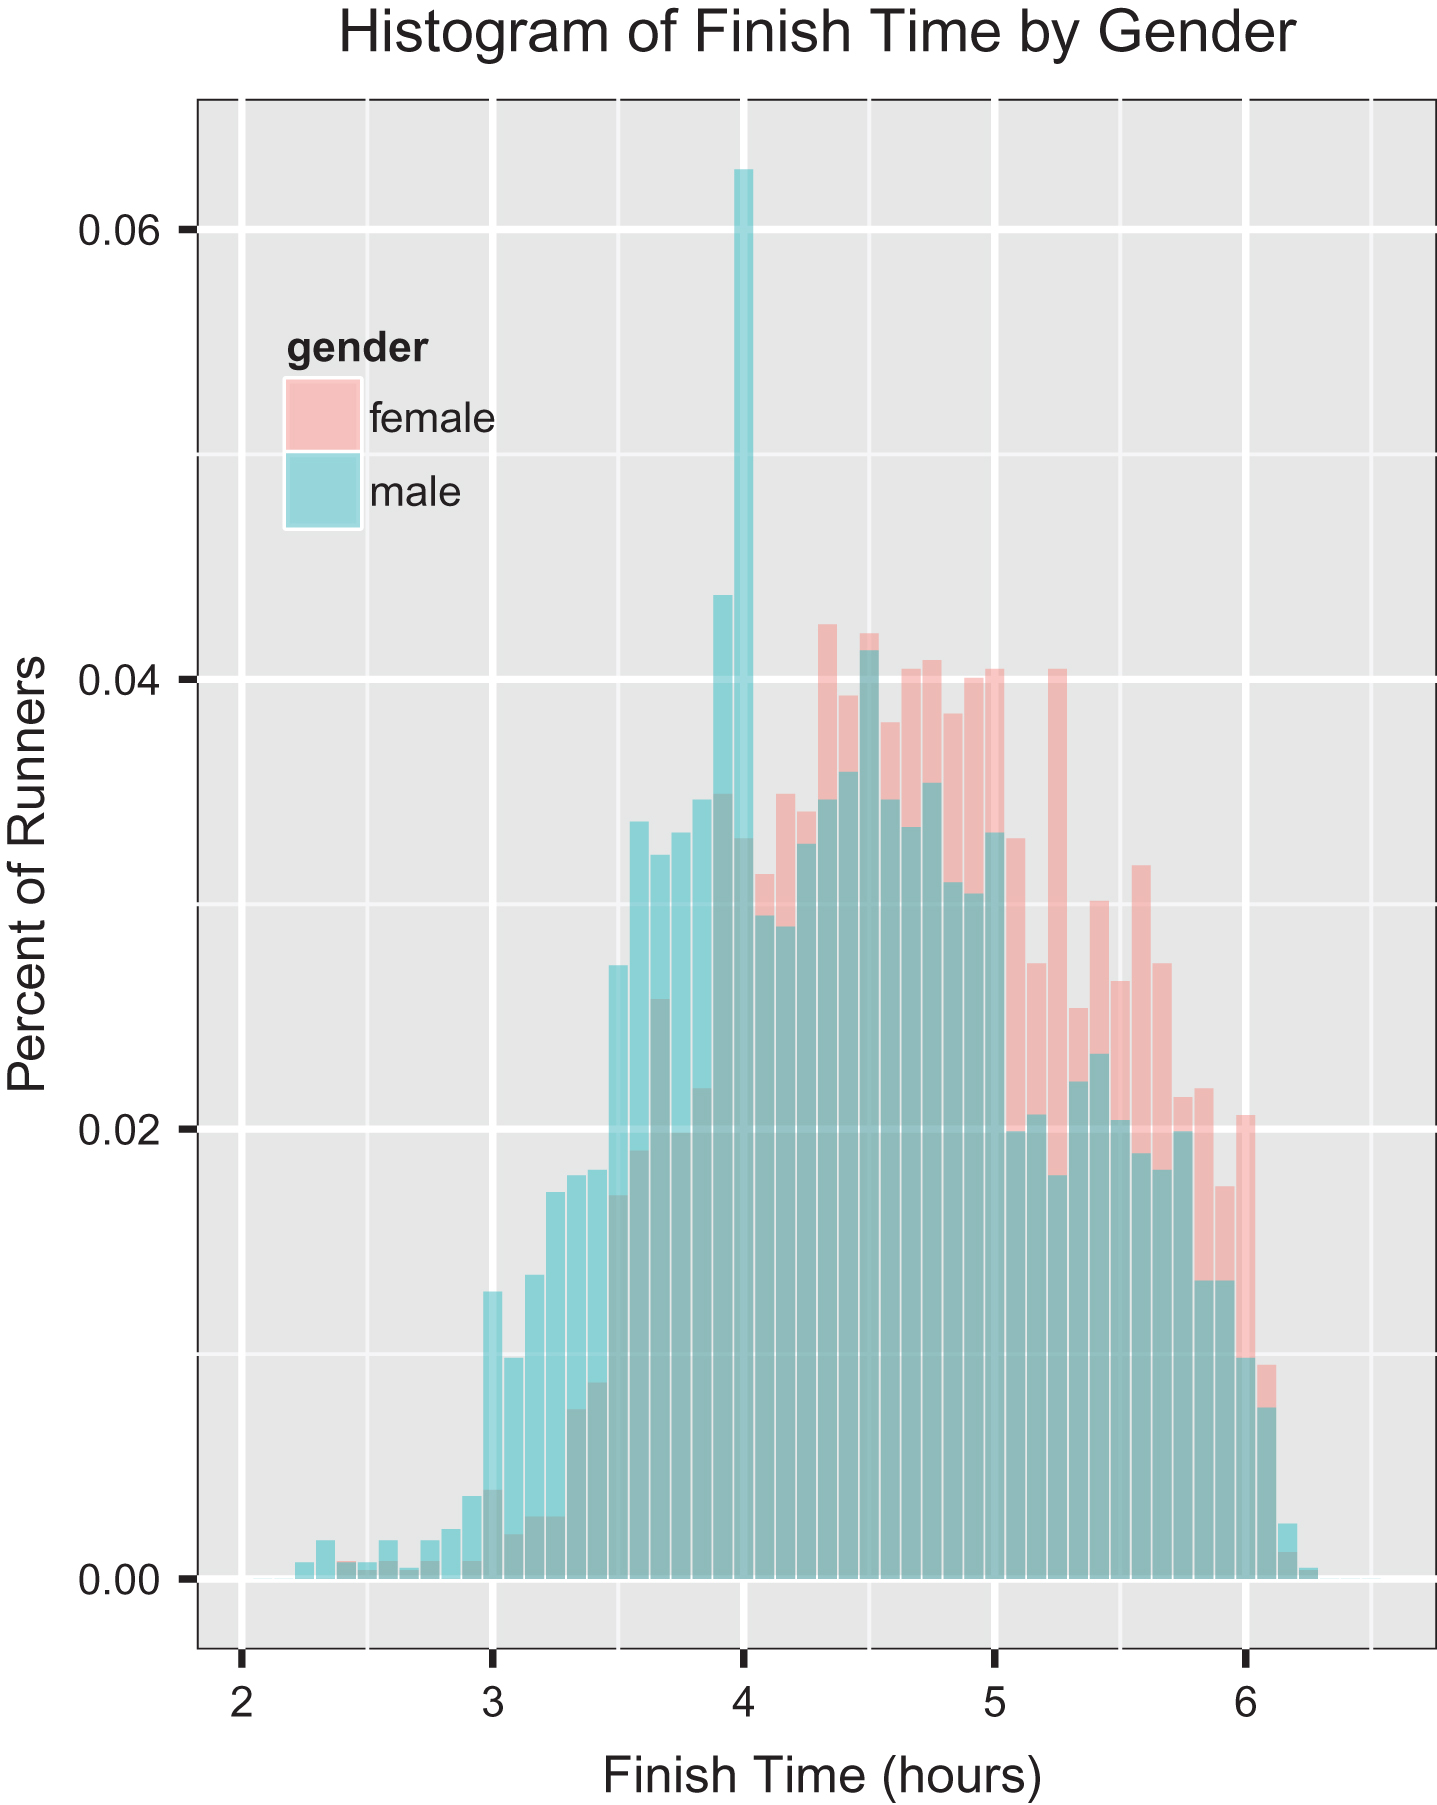
Fig.2
Density plot of finish times by corral and age.
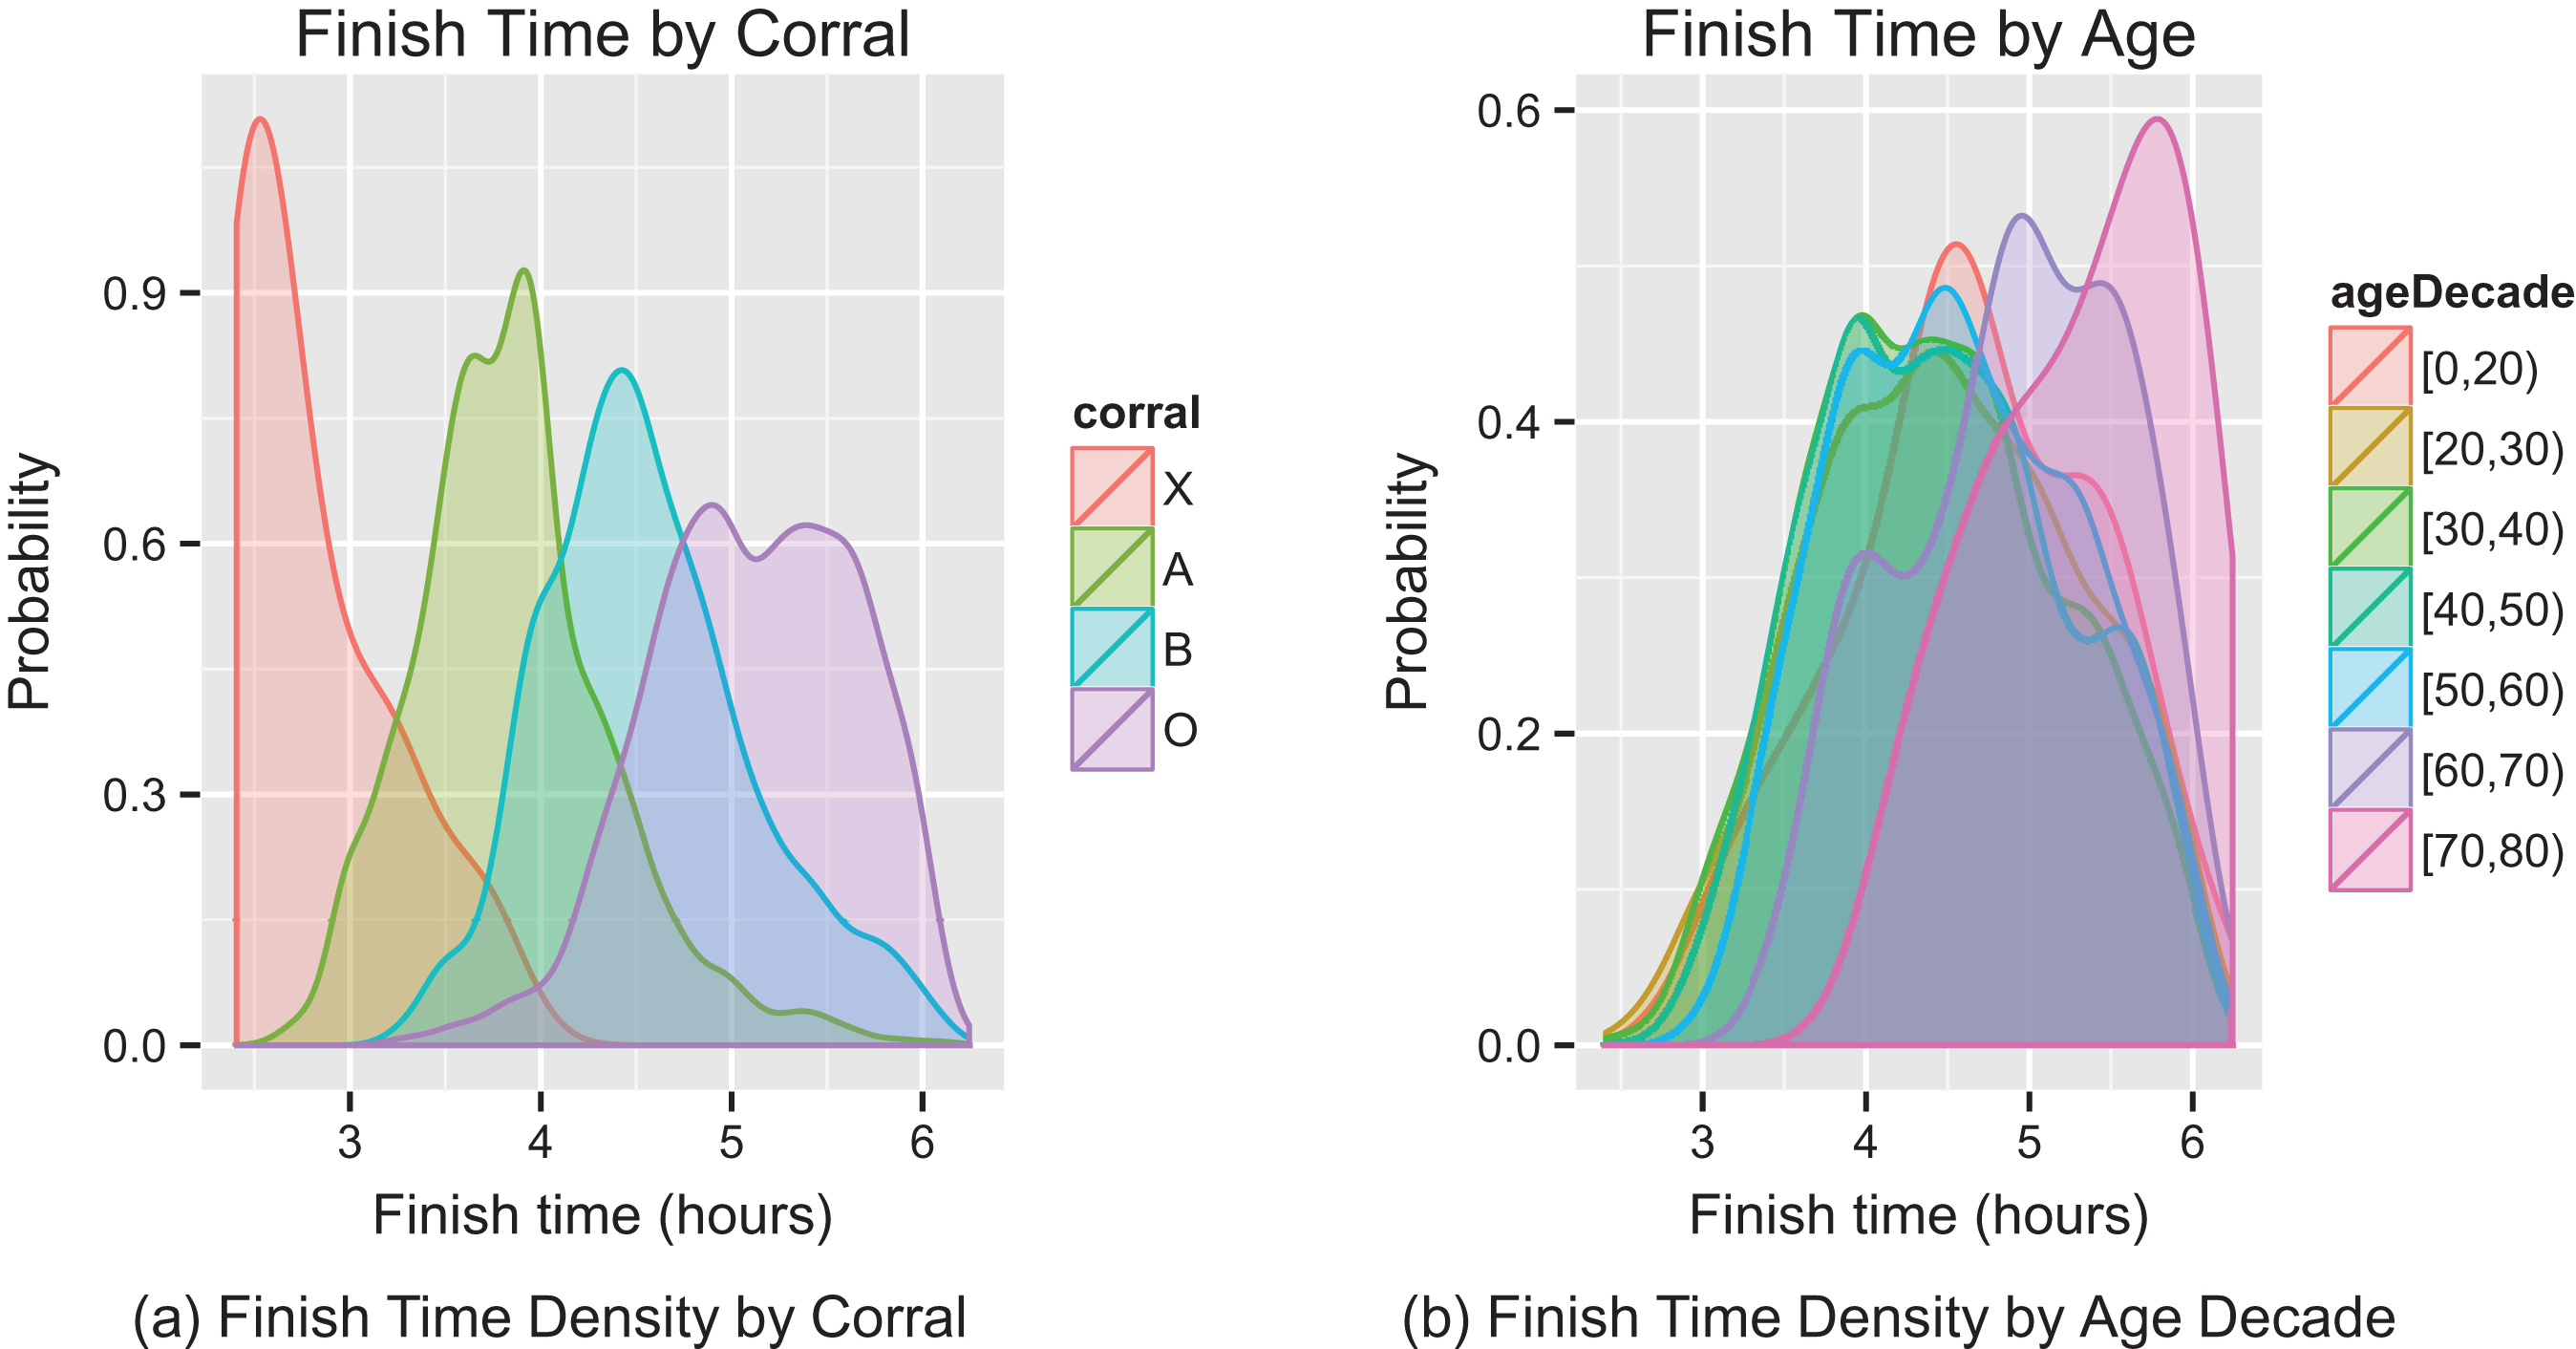
Fig.3
Shortfall density for all runners and by gender, corral and age. Note that for visualization purposes, we remove the elite corral (corral X) when bucketing by corral in Fig. 3c, and we remove runners under the age of 20 and runners over the age of 60 when bucketing by age in Fig. 3b.
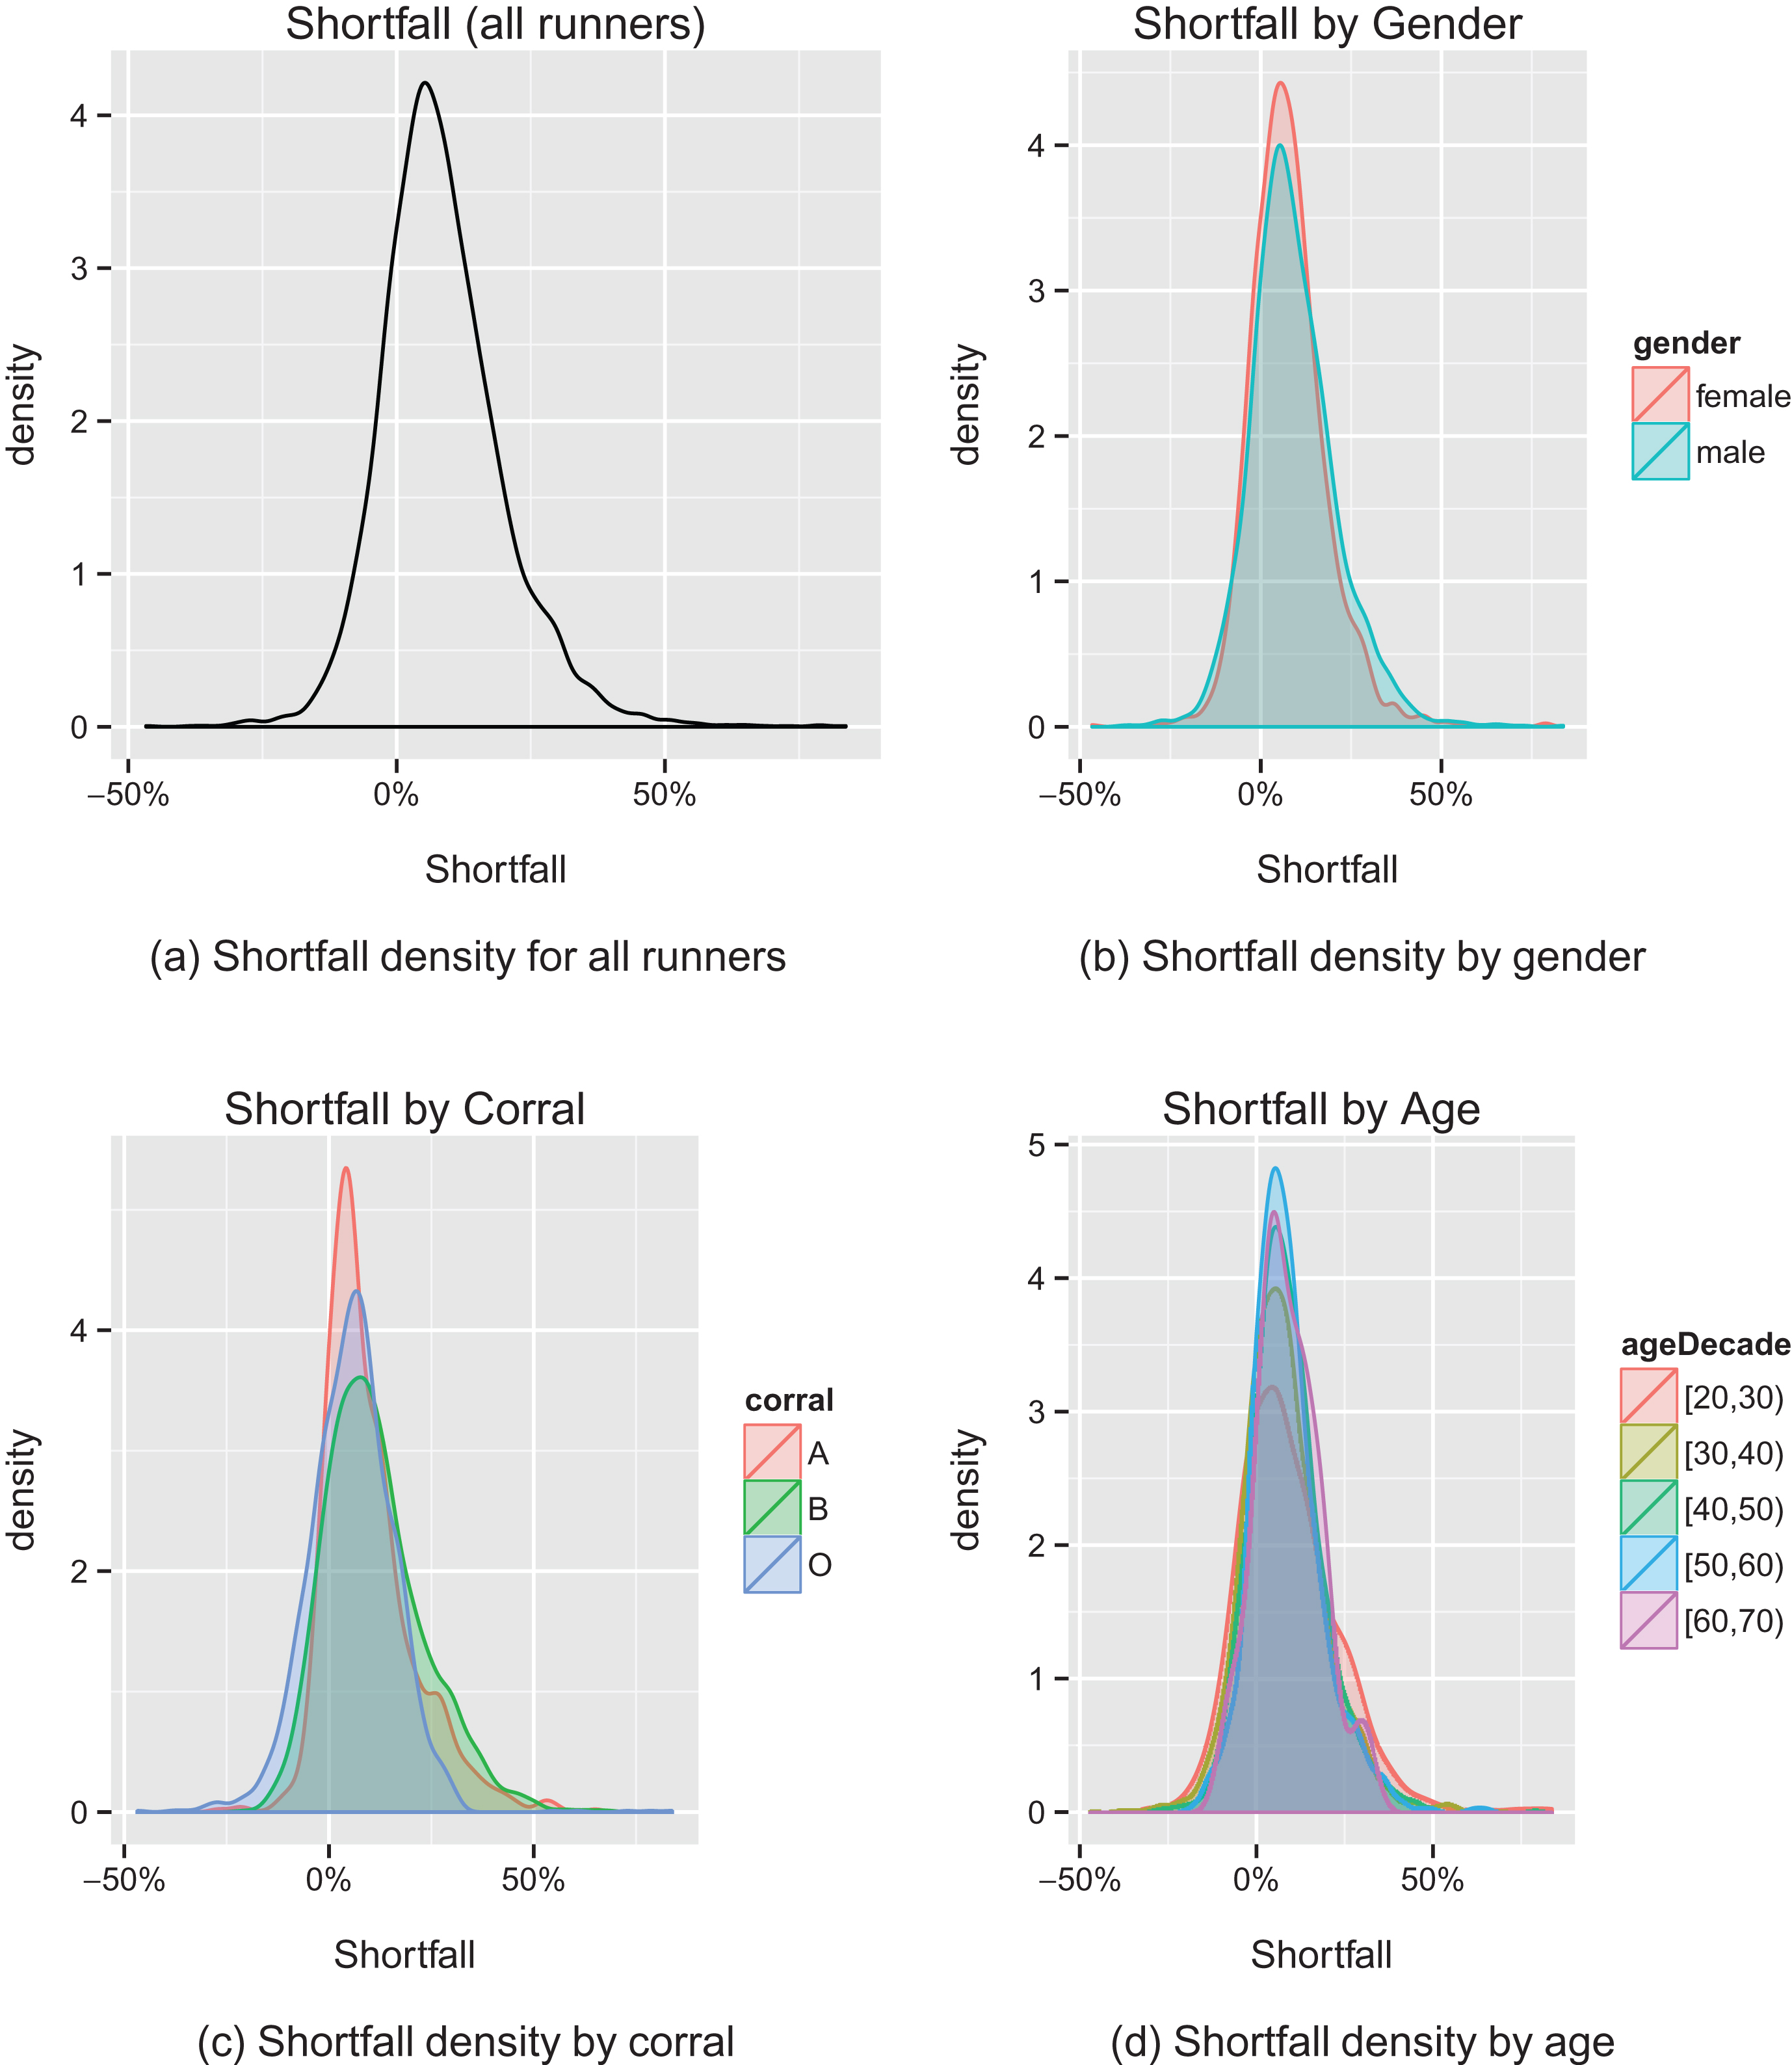
Fig.4
Shortfall histogram of male and female runners for all corrals.
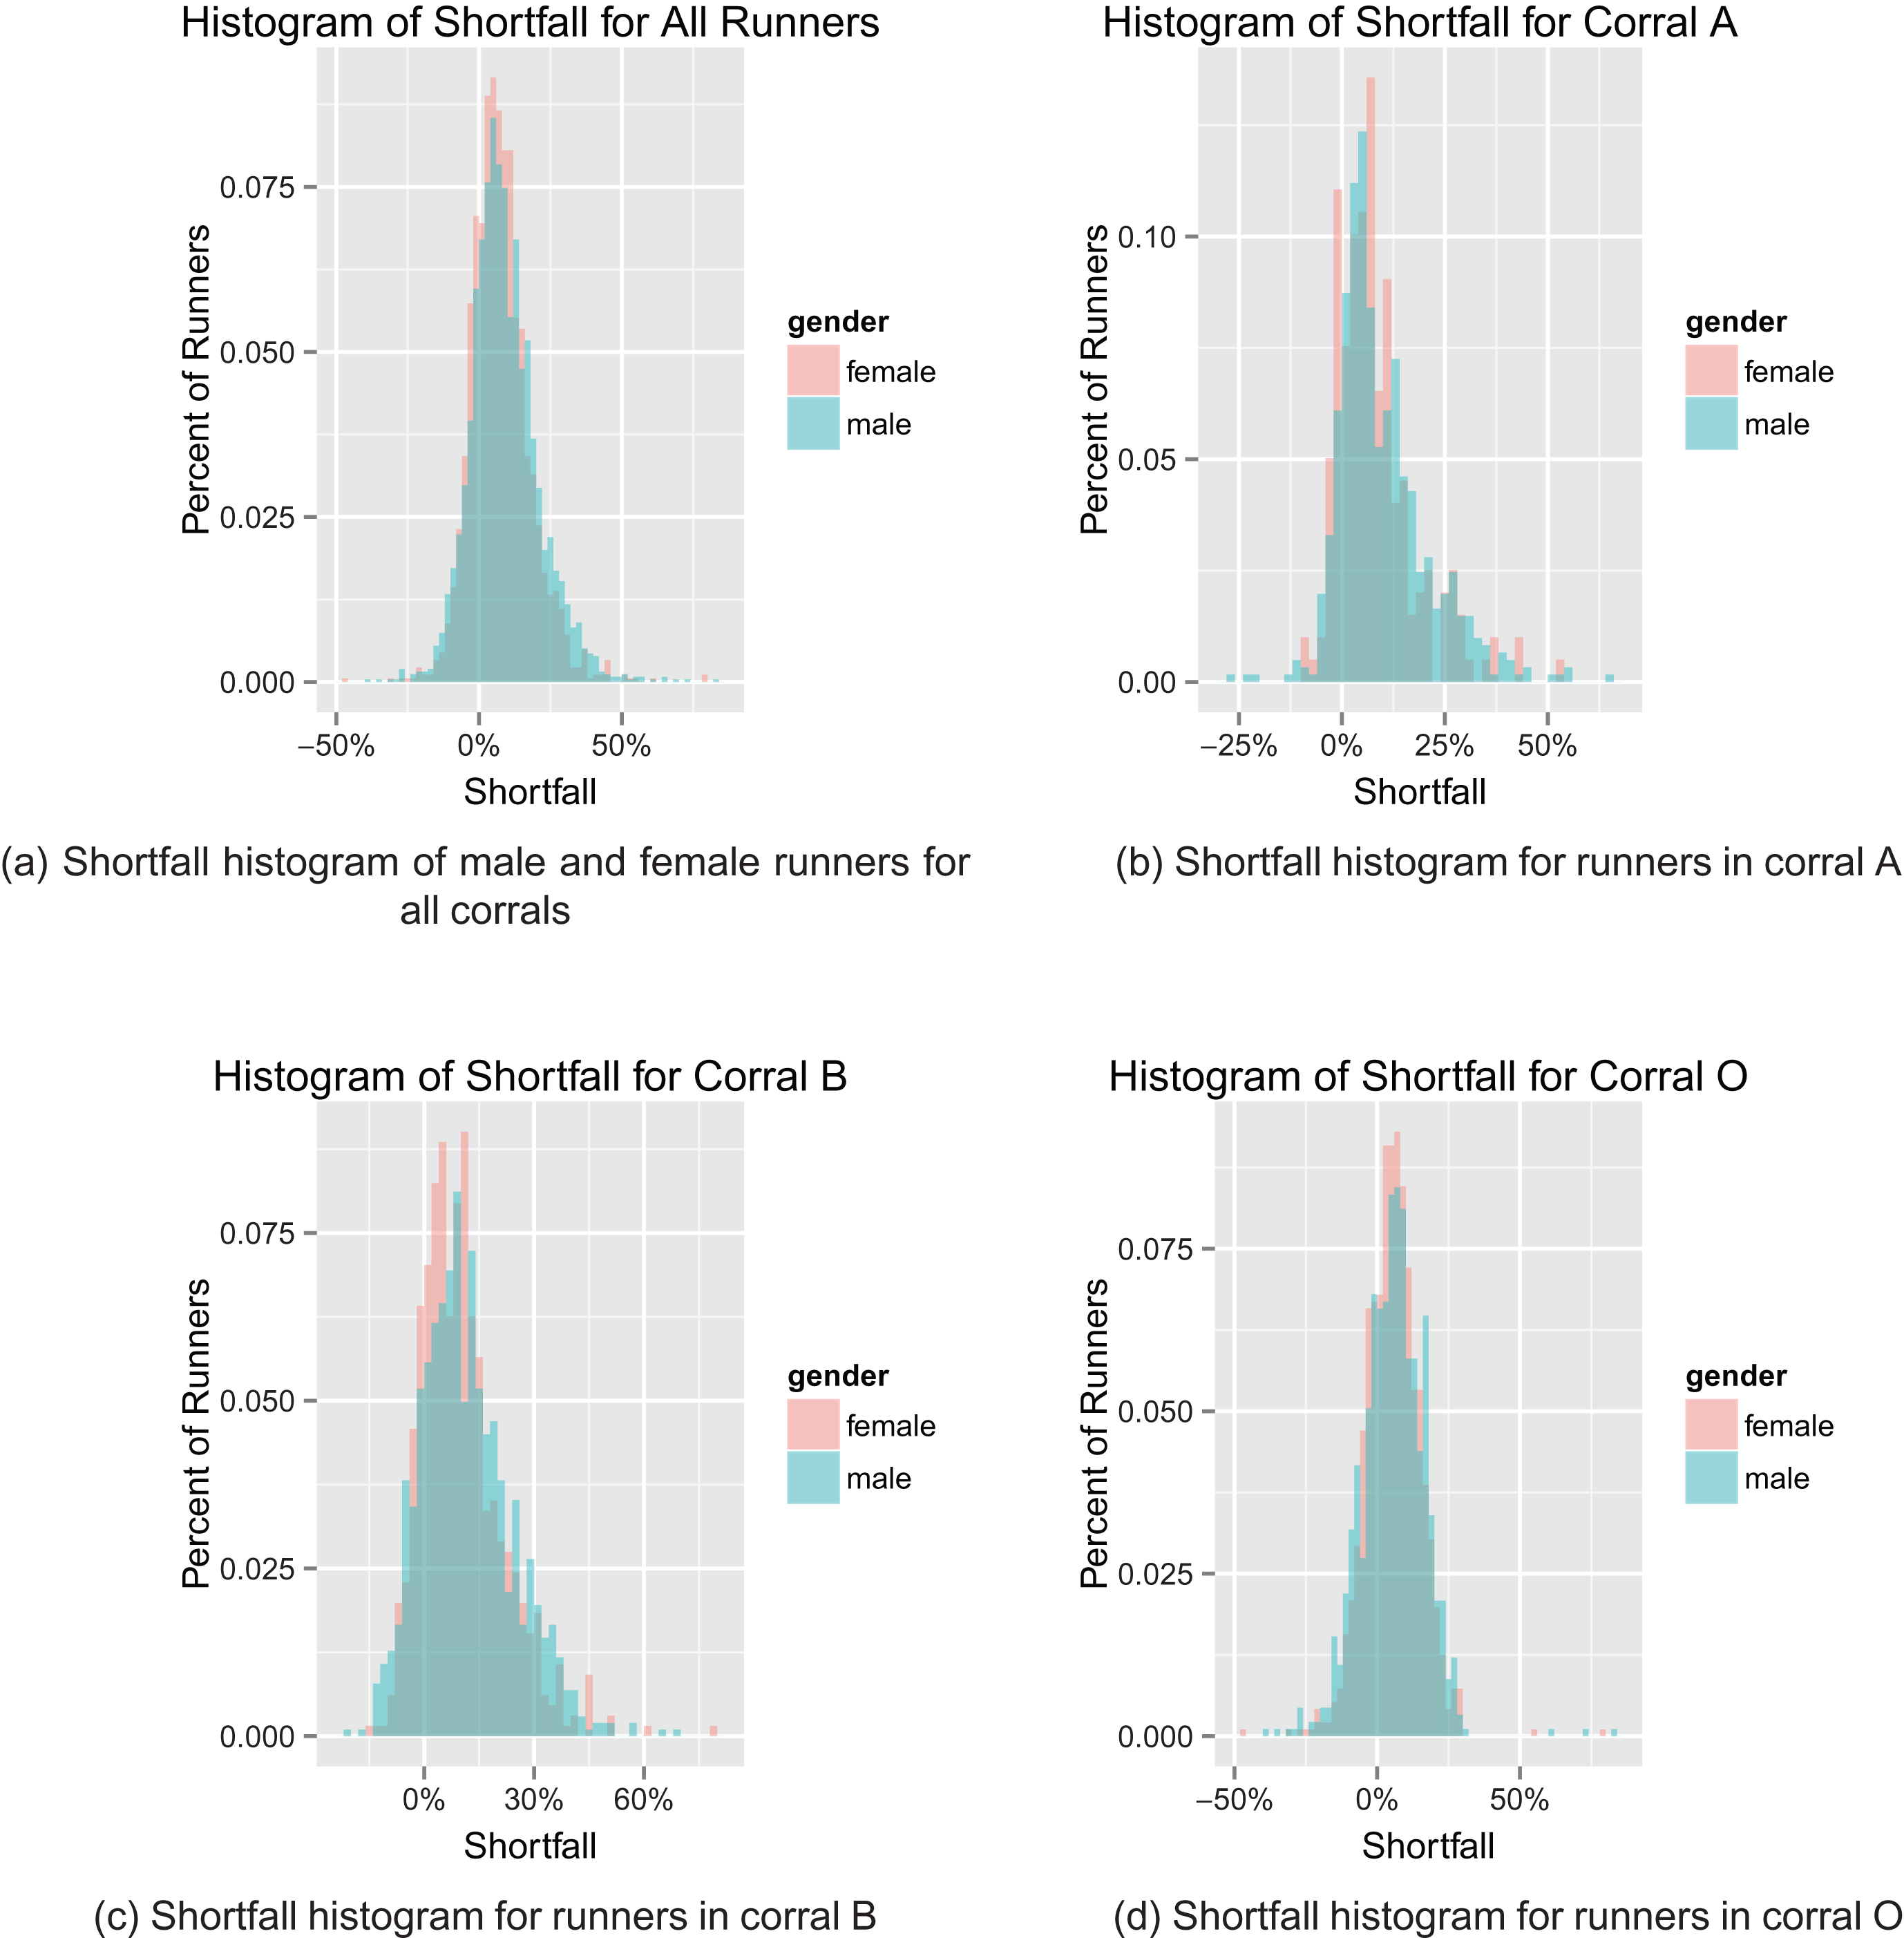
Fig.5
2nd Half Slowdown histogram of male and female runners.
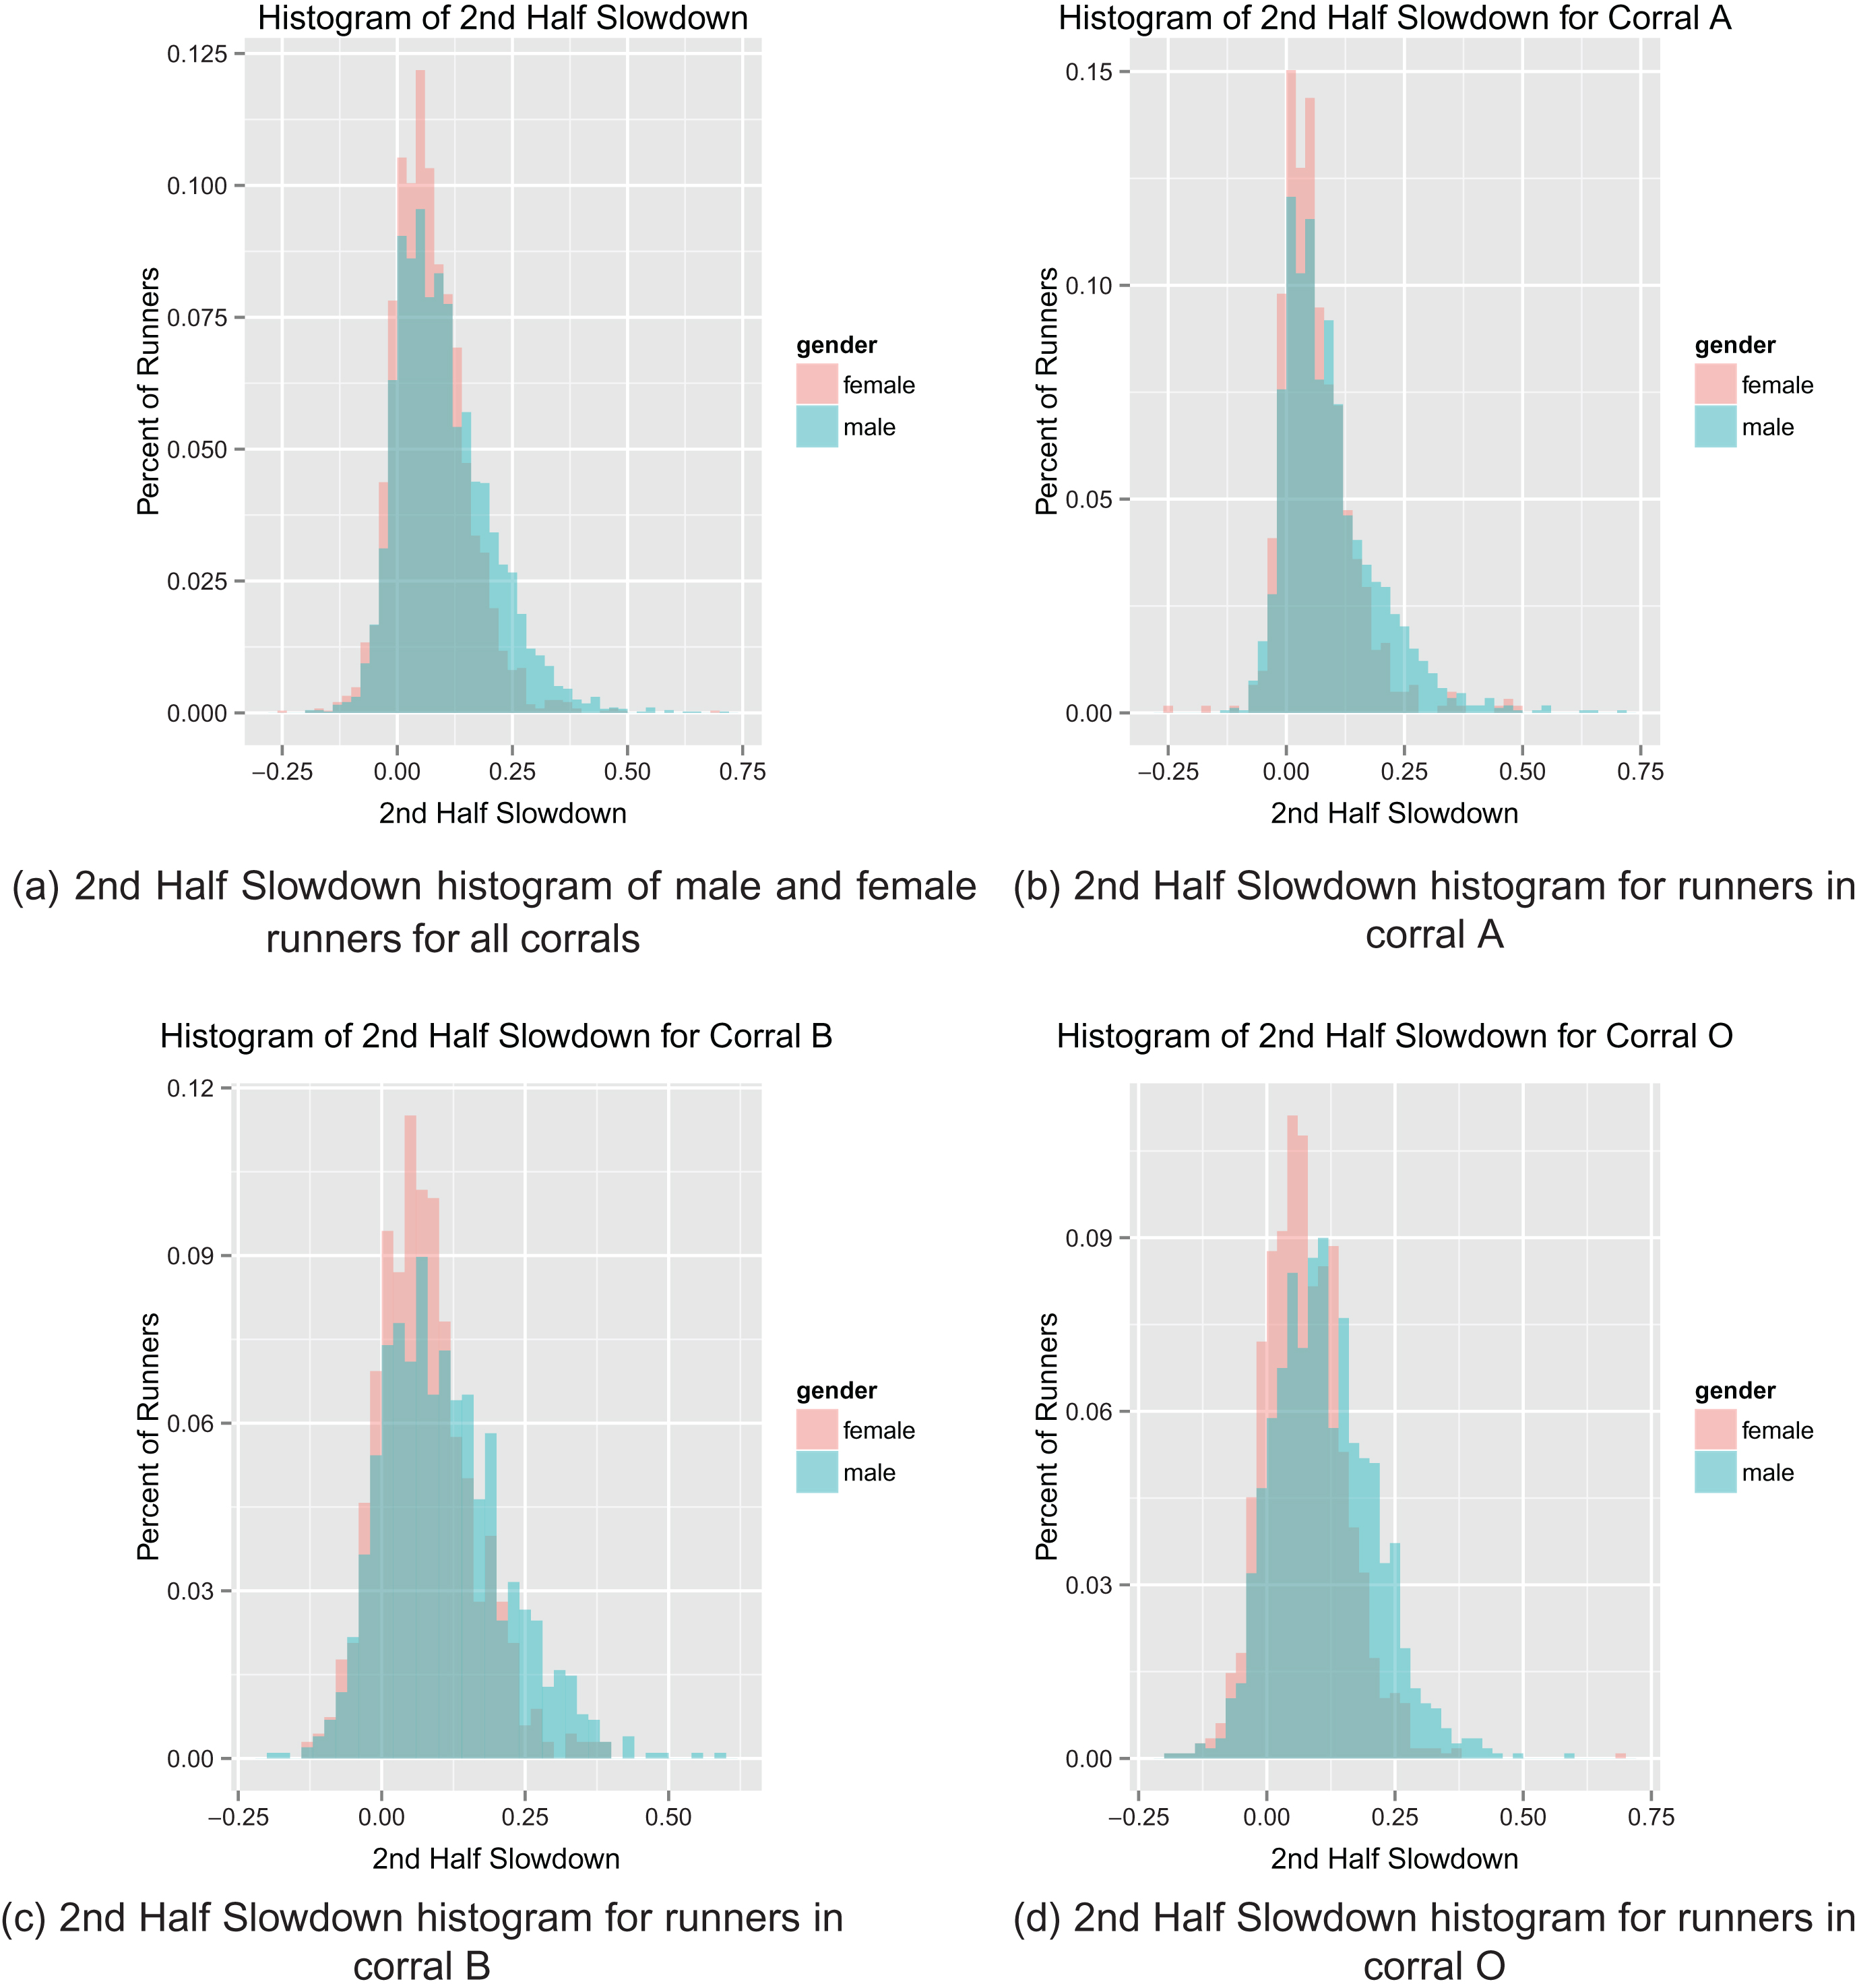
Fig.6
Pace profiles for each 5k split by various buckets. We calculate pace profile as the percentage difference between the pace in each split from the runner’s pace for the full race.
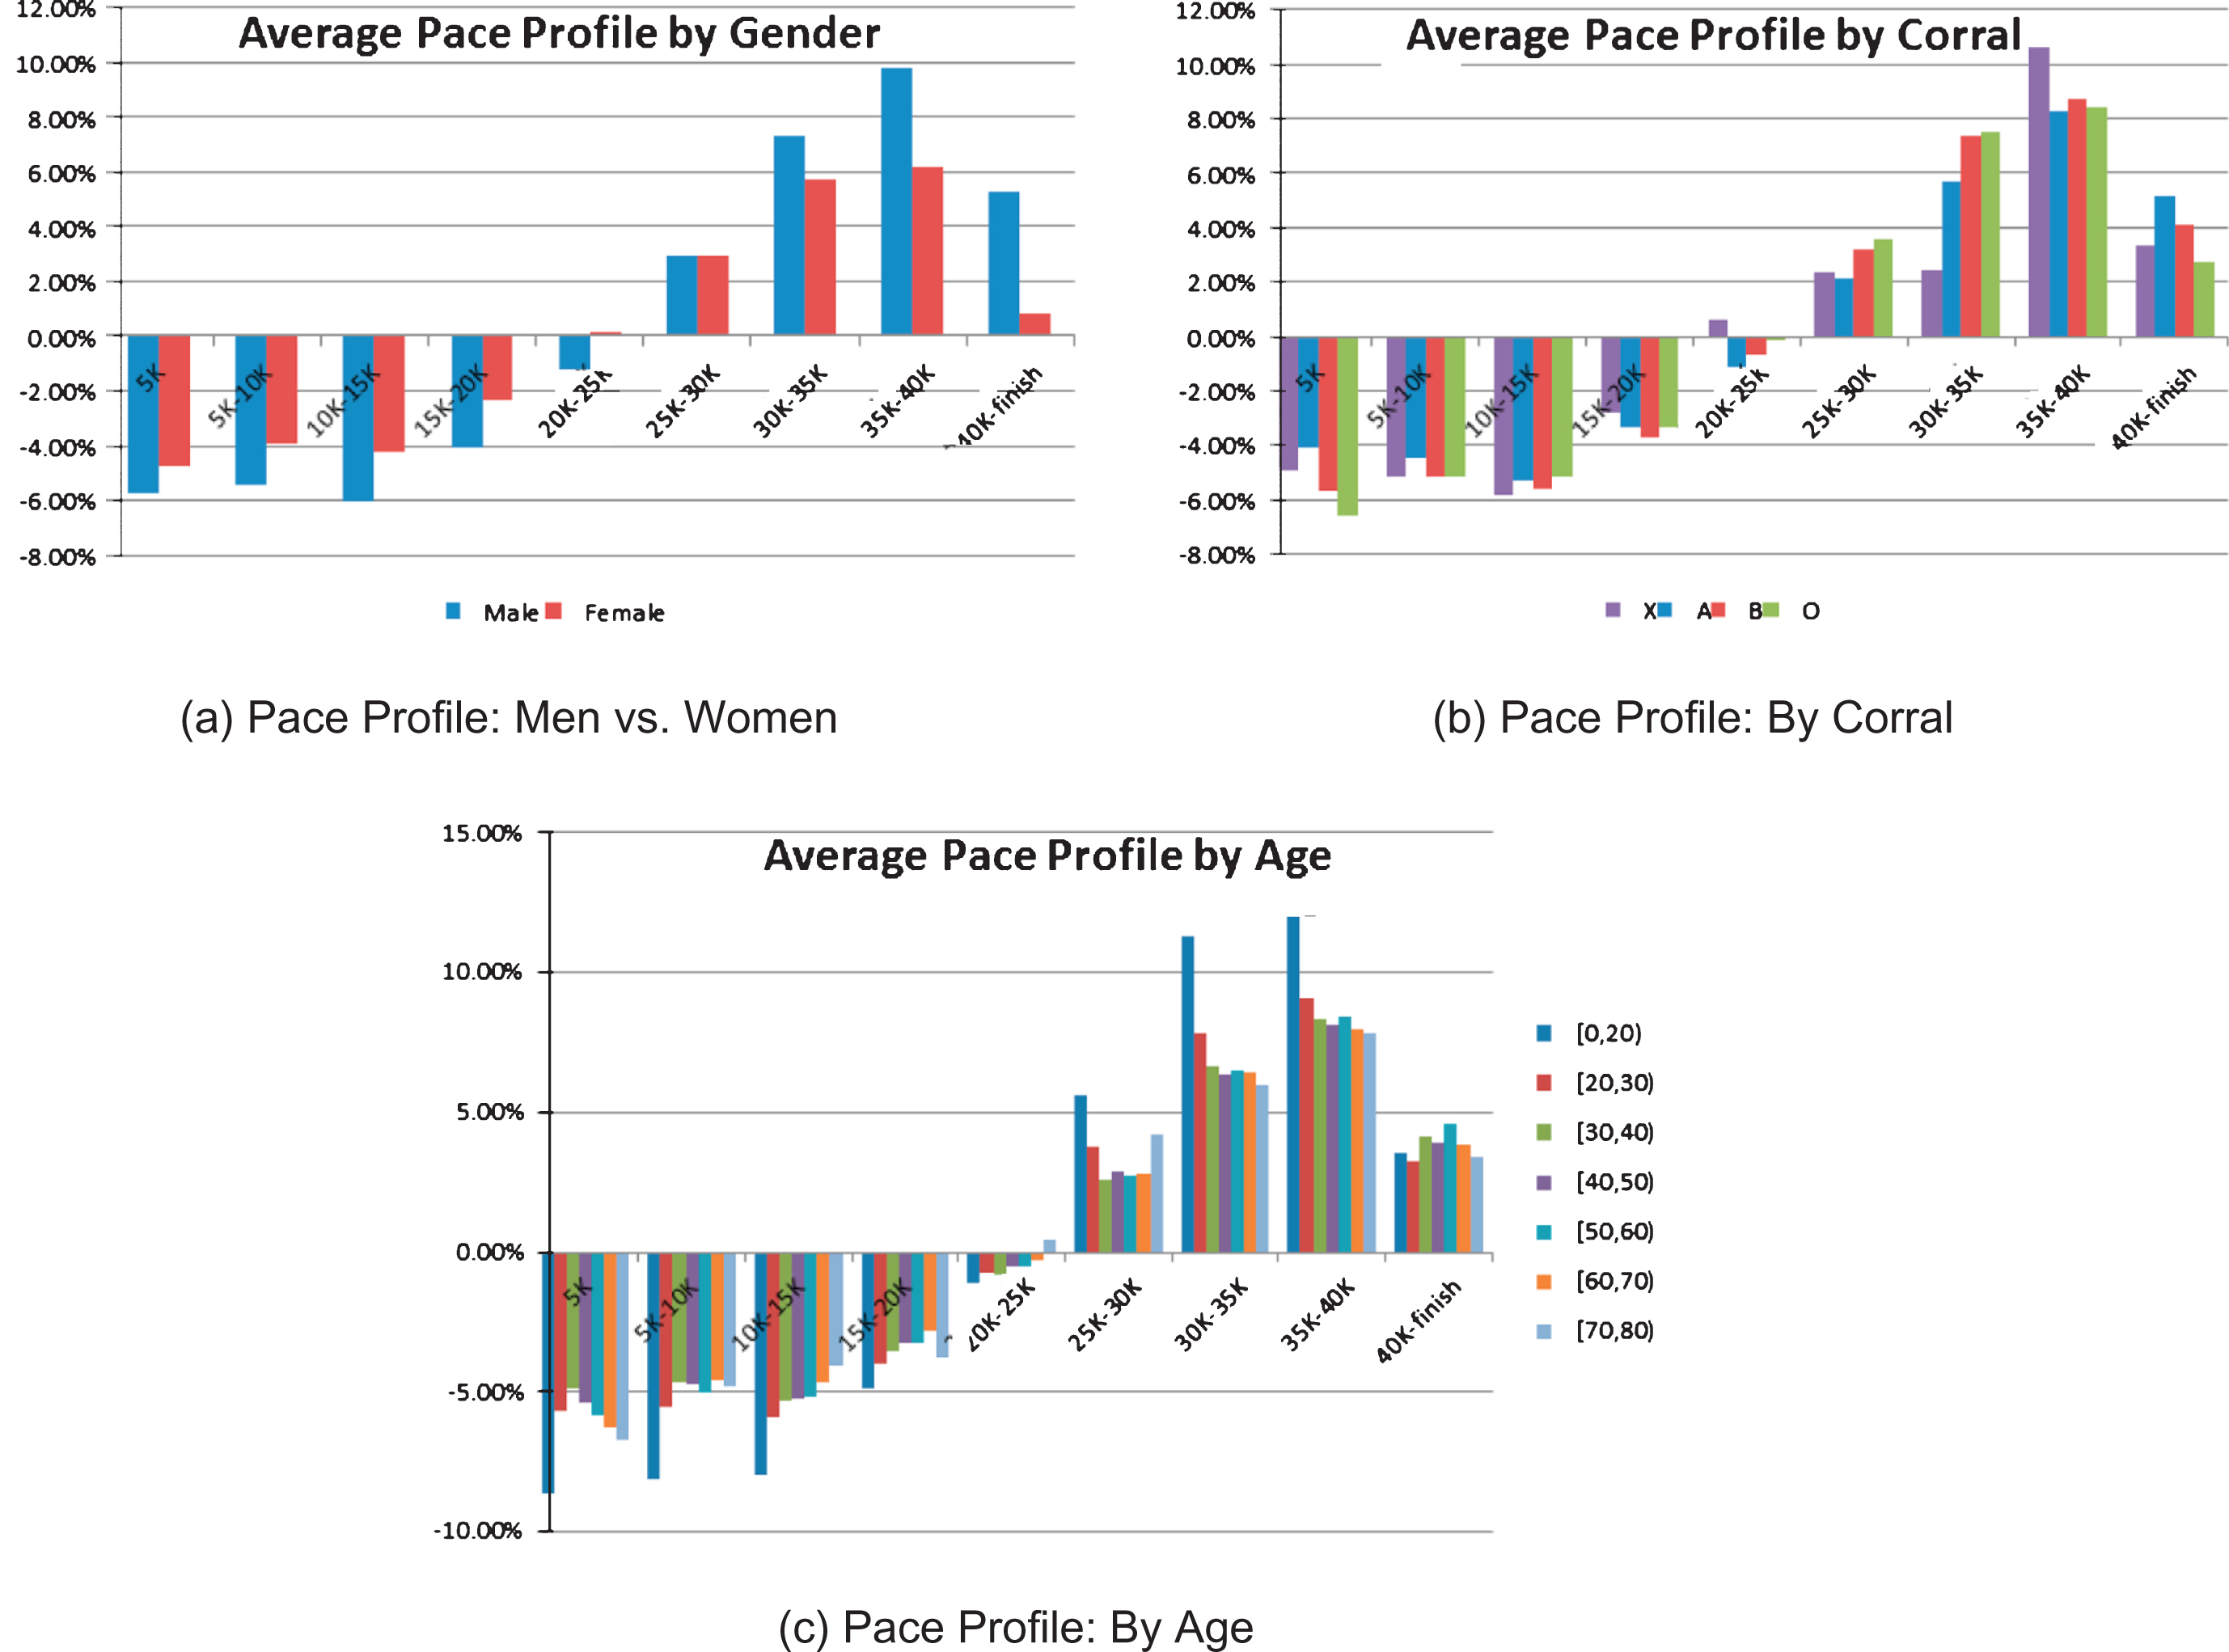
Fig.7
Scatterplot of the relationship between 2nd Half Slowdown and finish time. As reported in previous literature, we find a statistically relationship between pacing and slowdown across all runners as well as within each corral. The overall correlation is about 0.32.
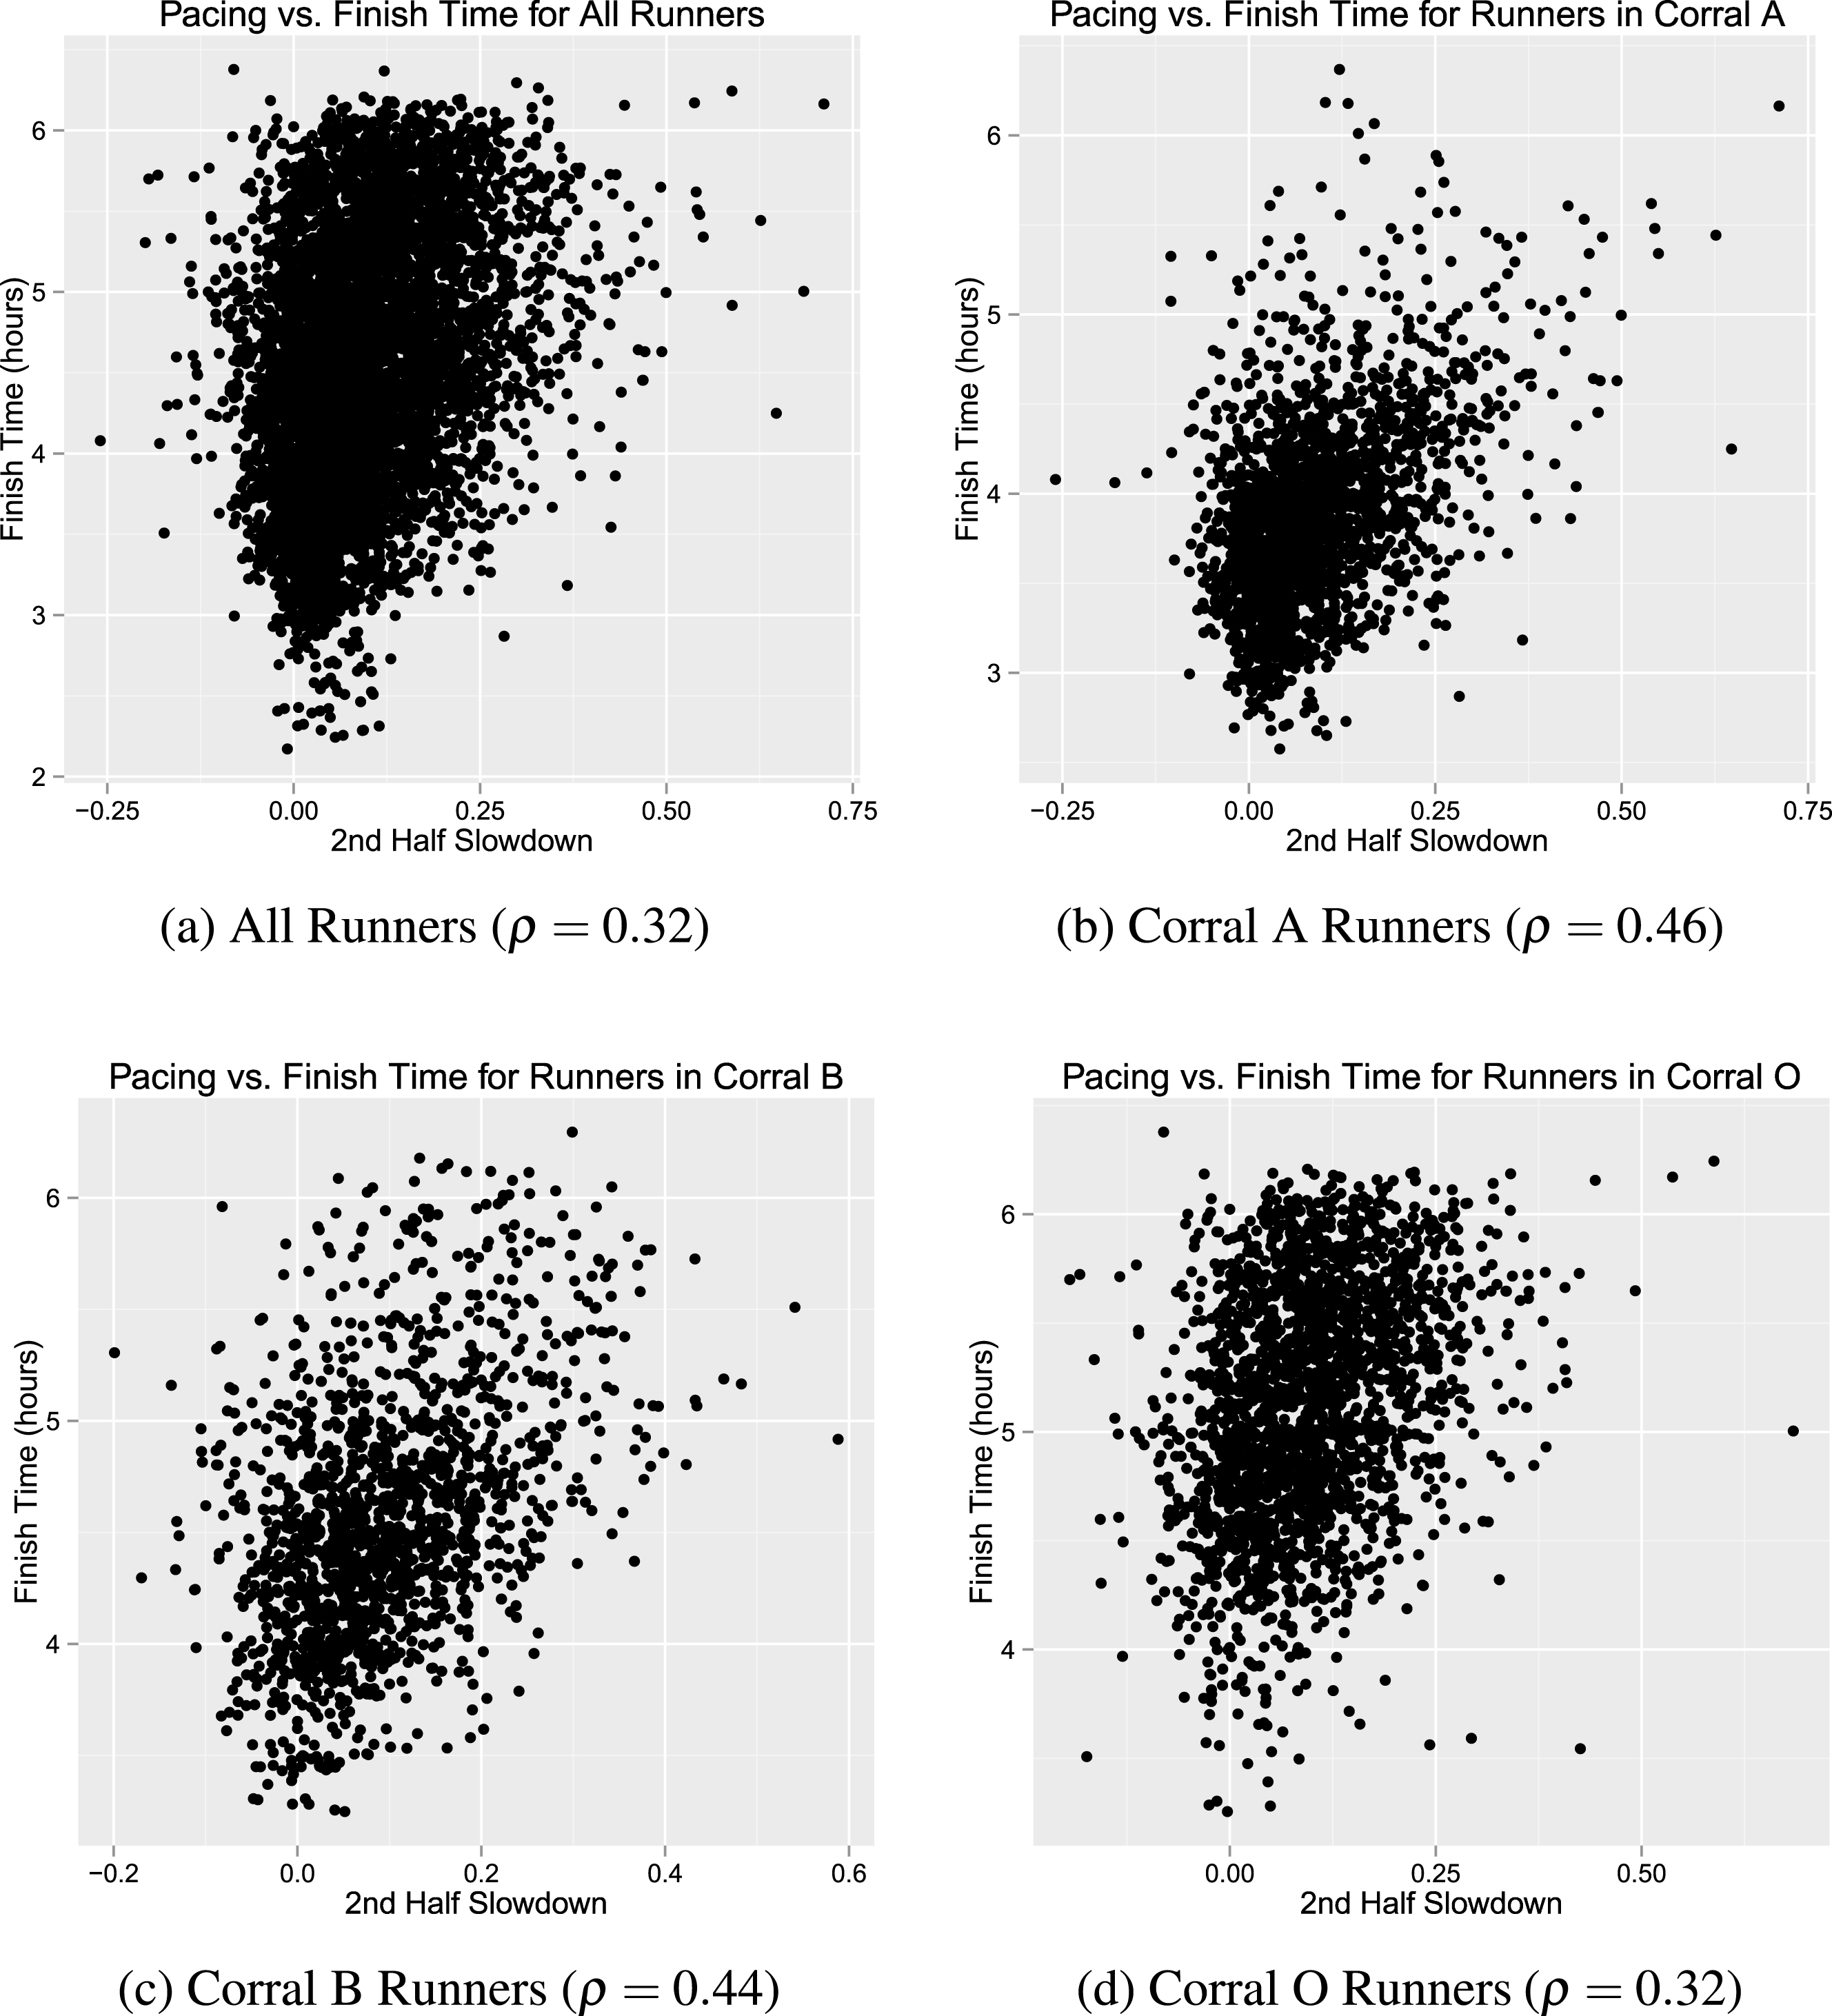
Fig.8
Scatterplot of the relationship between 2nd half slowdown and shortfall for all runners and runners by corral. We find a statistically significant correlation (p <0.01) between pacing and shortfall across all corrals.
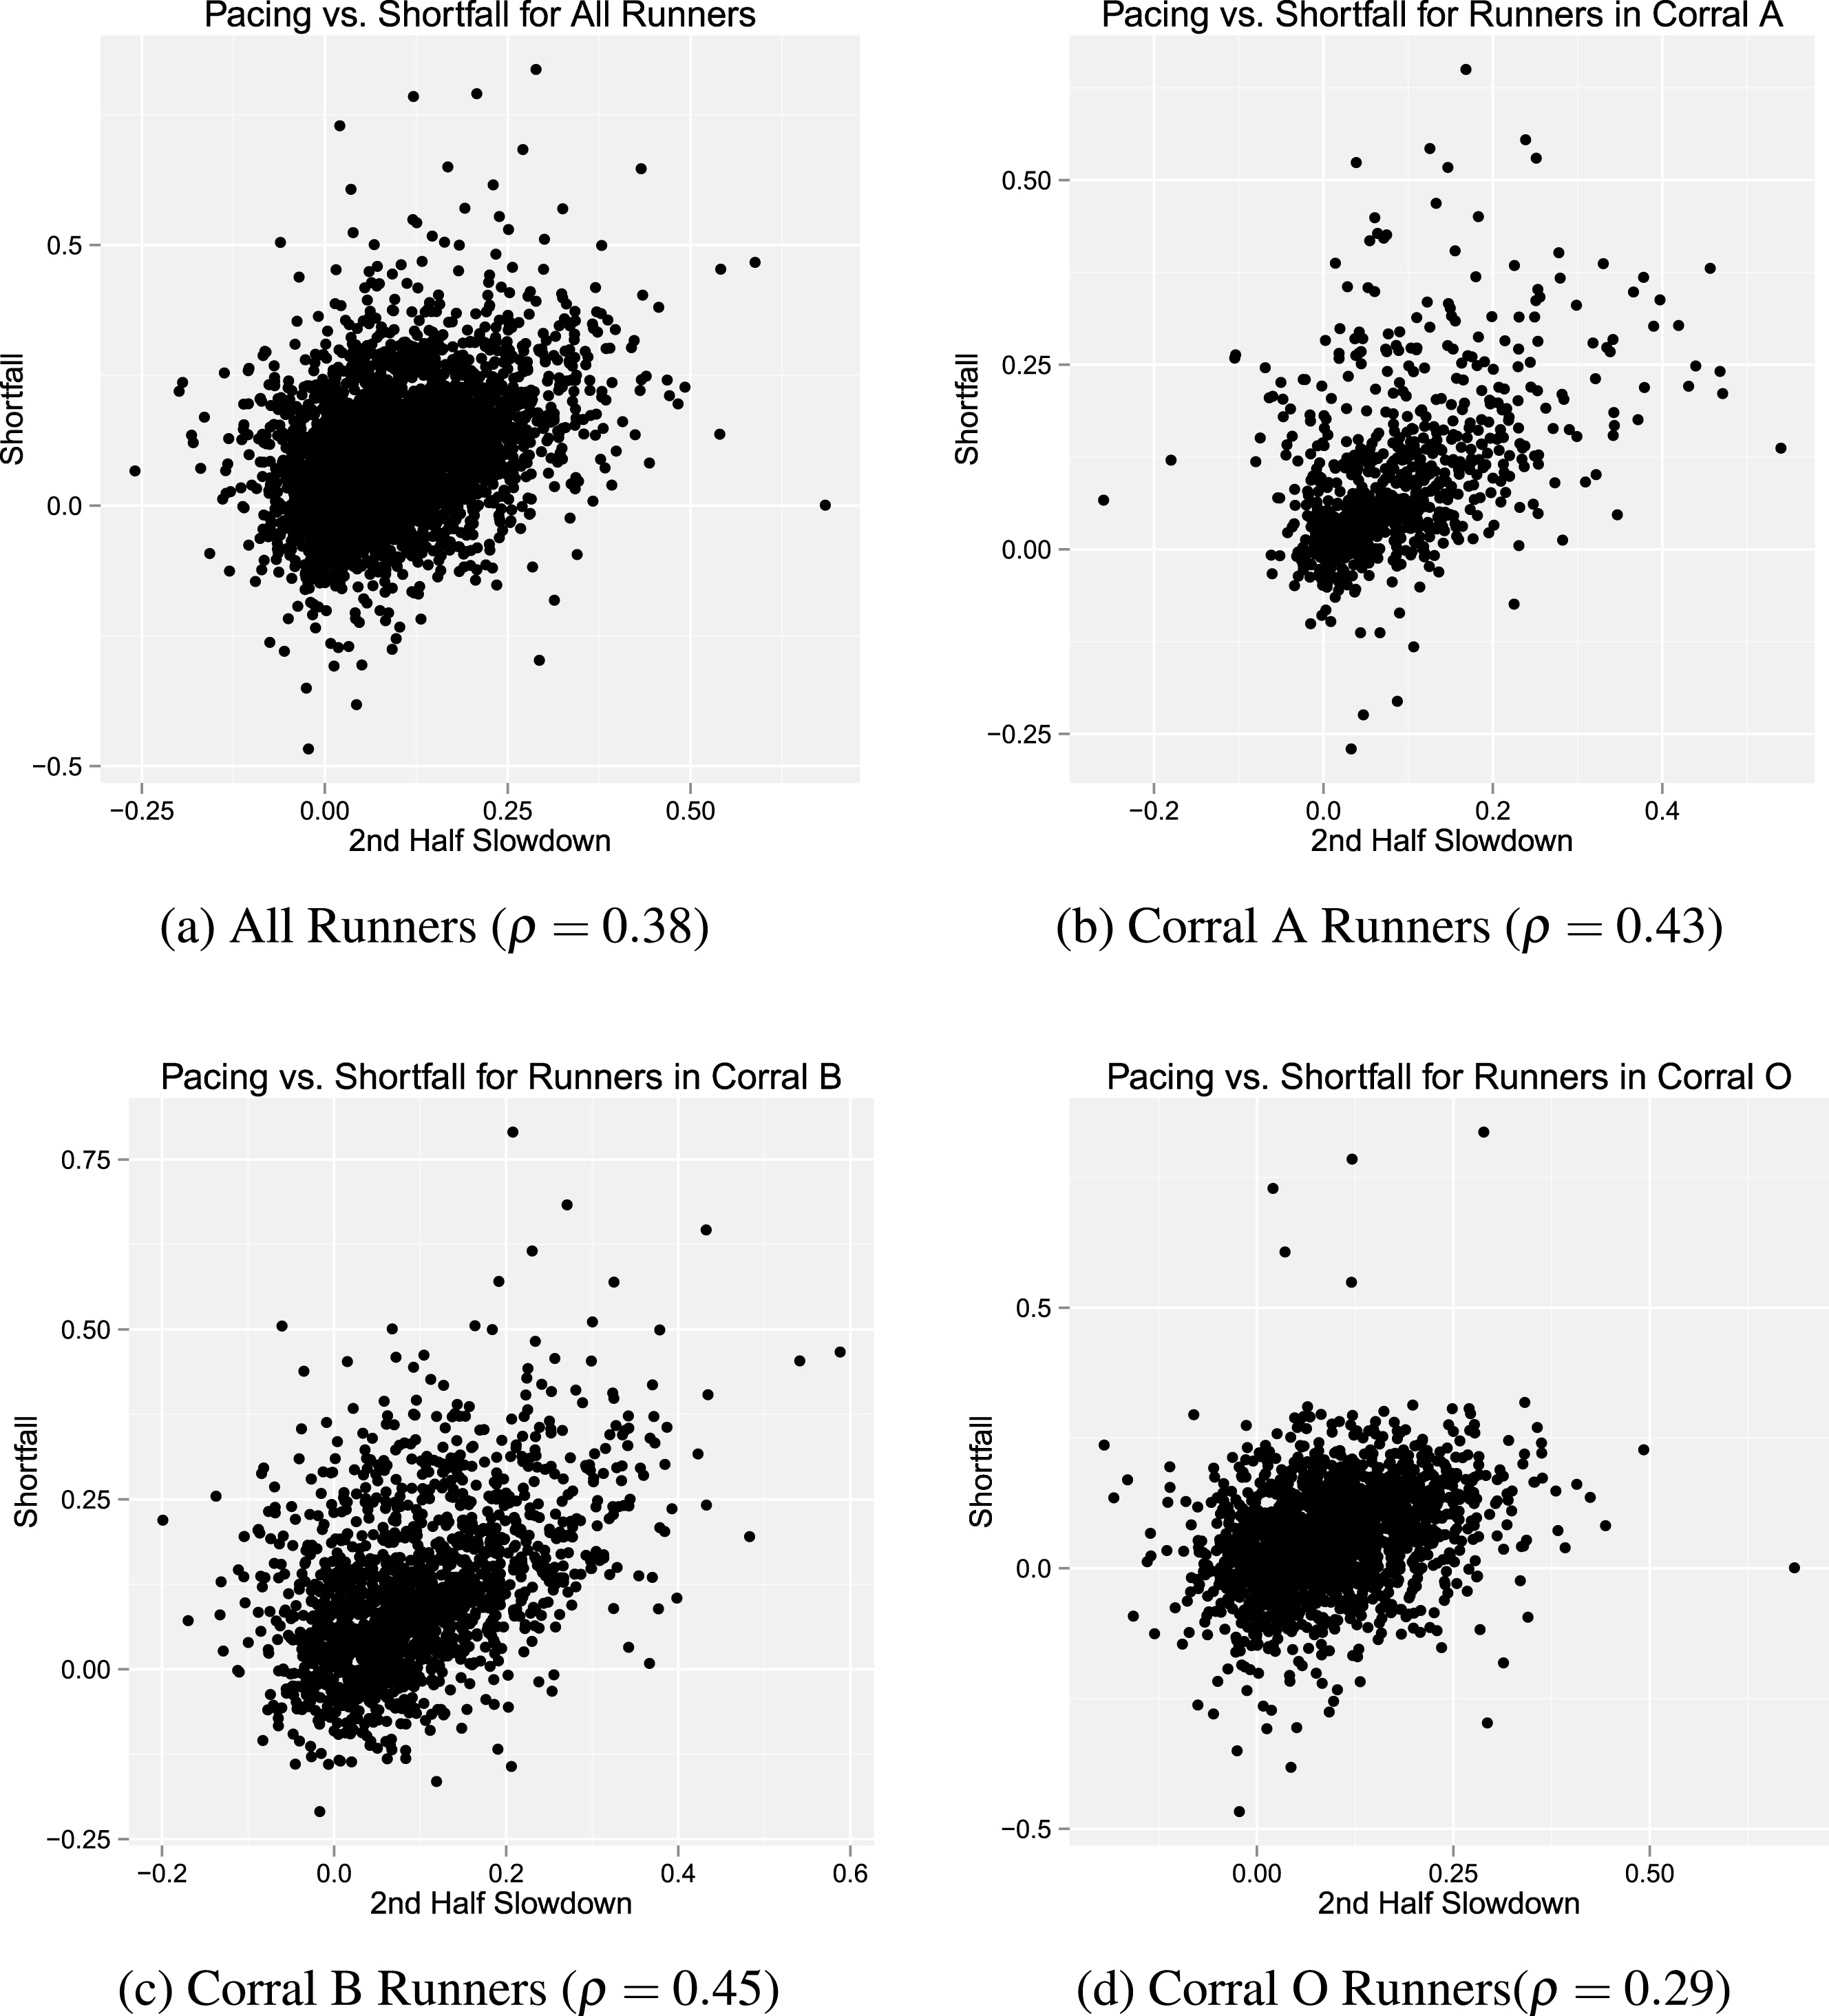
Fig.9
Scatterplot of the relationship between 2nd half slowdown and shortfall for runners by gender. We find a statistically significant correlation (p <0.01) between pacing and shortfall across all genders.
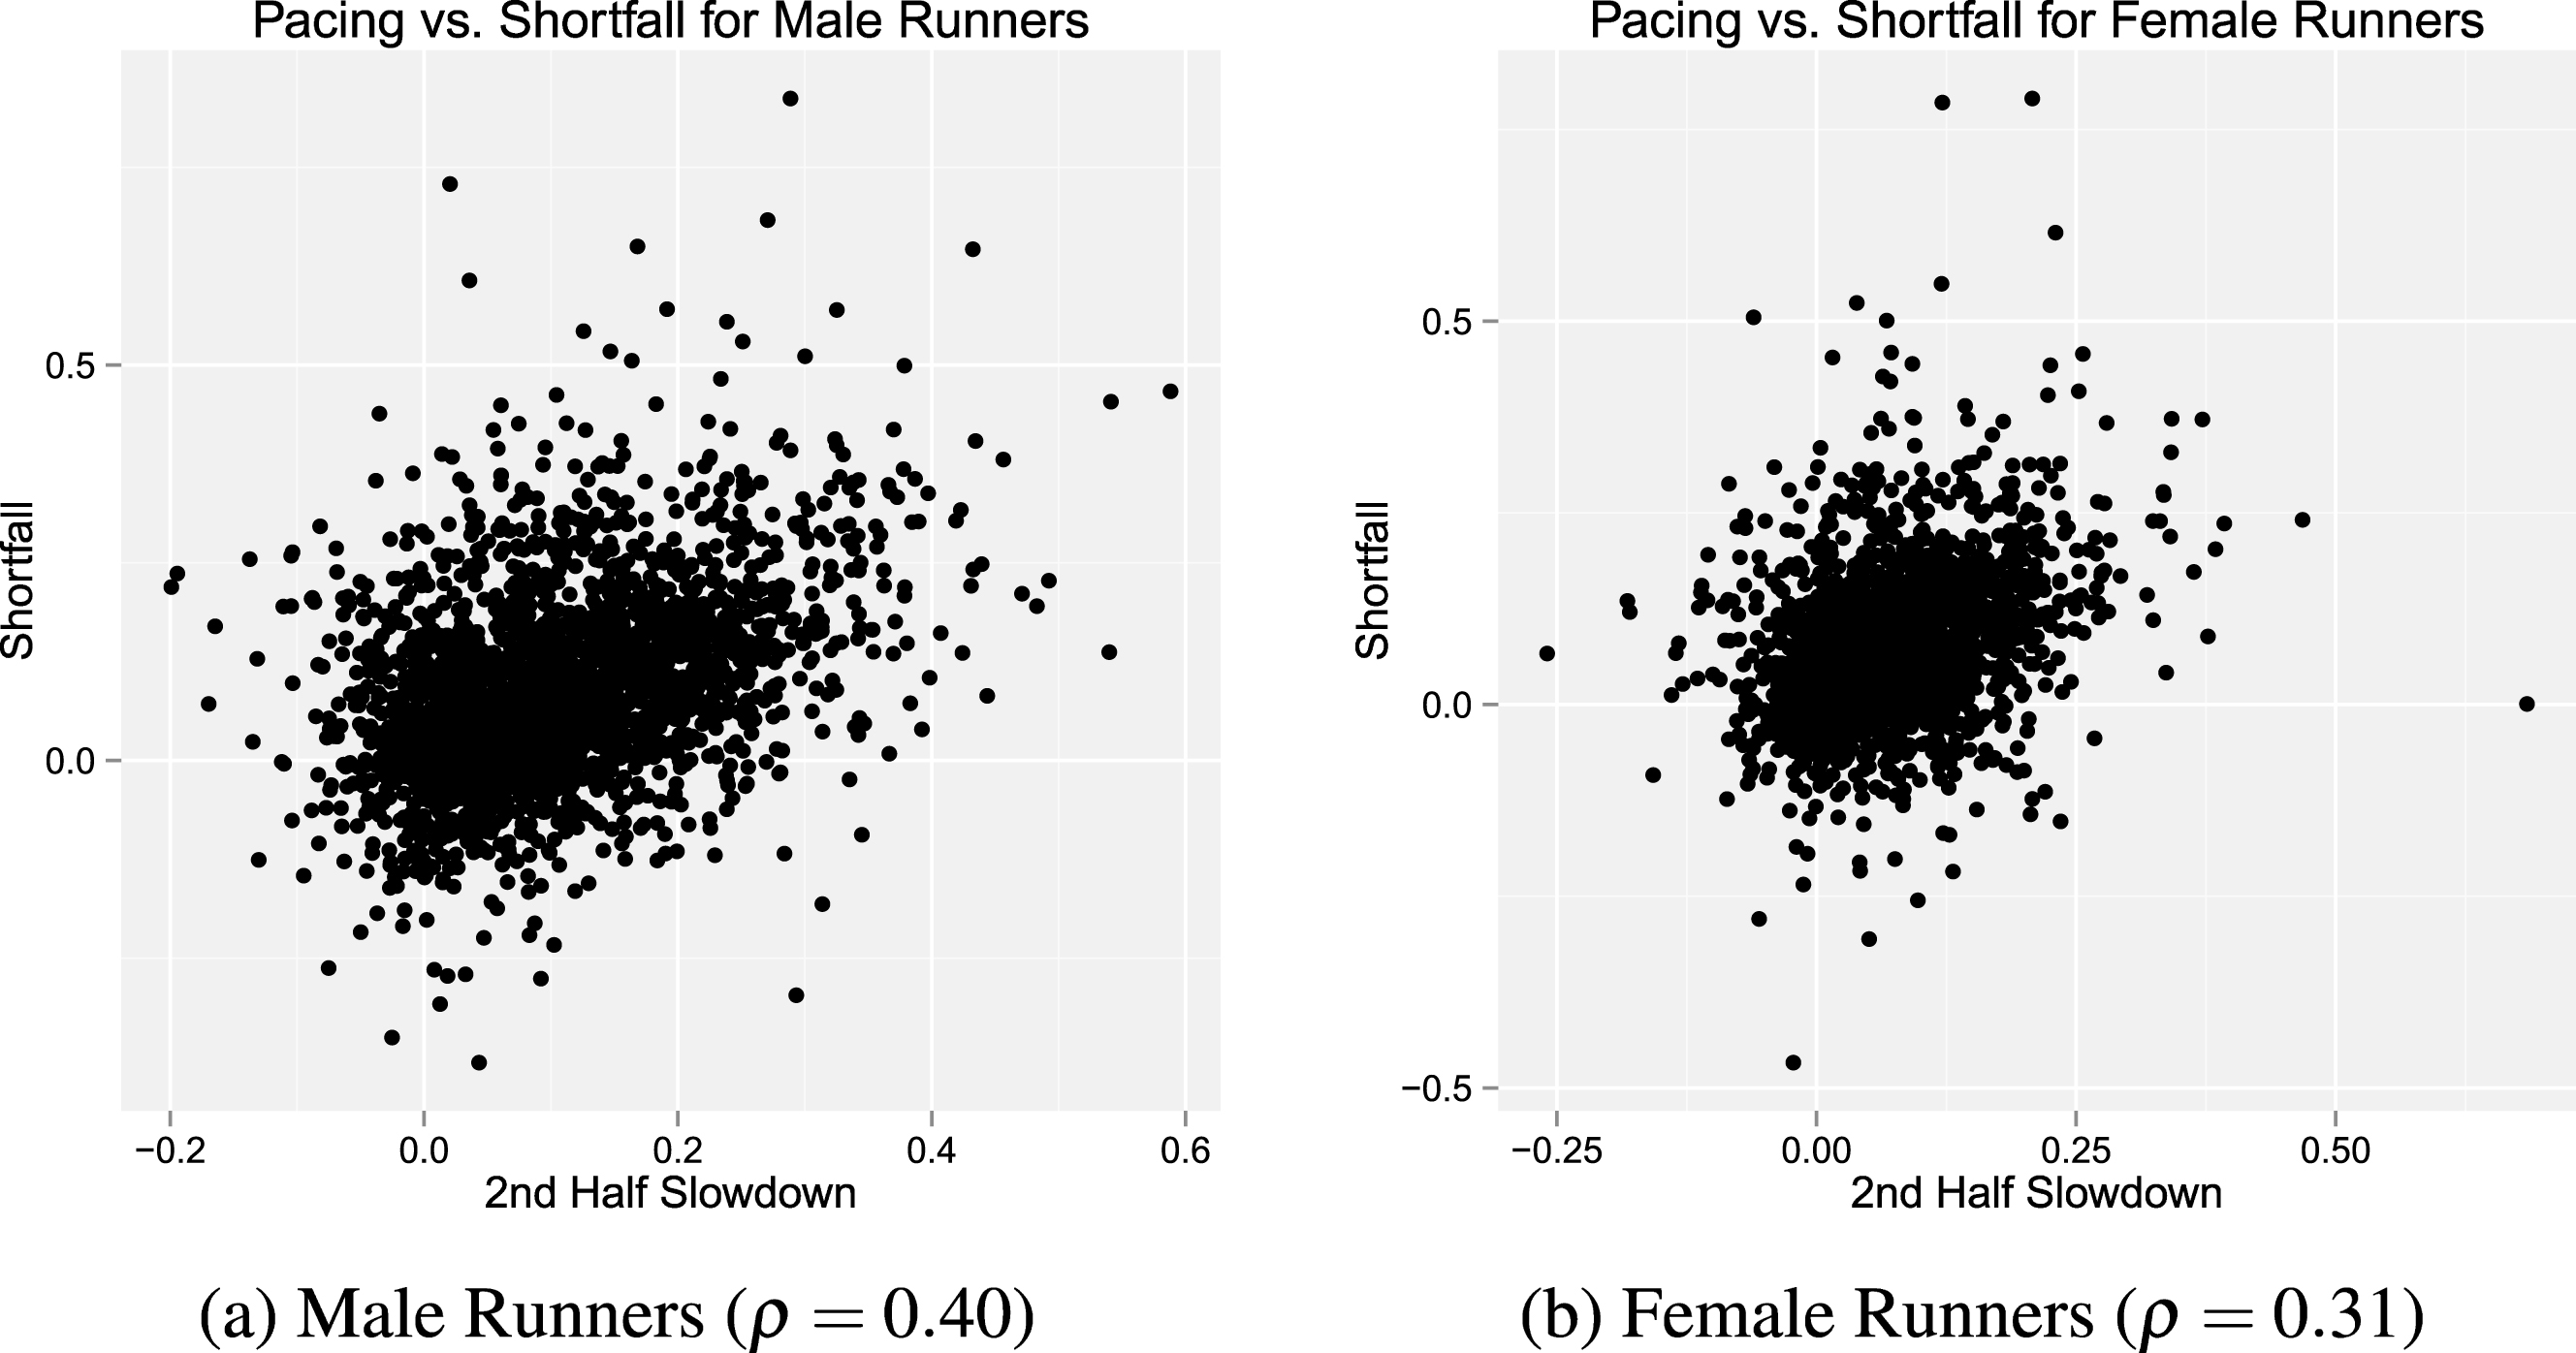
Table 1
Summary counts and data availability for runners of the 2013 Houston Marathon
| Group | (A) Count | (B) Count with pred finish | (C) Count of all valid splits |
| ALL | 6676 (100%) | 4428 (66%) | 6066 (91%) |
| gender:female | 2521 (38%) | 1813 (27%) | 2323 (35%) |
| gender:male | 4069 (61%) | 2551 (38%) | 3696 (55%) |
| gender:missing | 86 (1%) | 64 (1%) | 47 (1%) |
| Corral:X | 11 (0%) | 11 (0%) | 8 (0%) |
| Corral:A | 2402 (36%) | 810 (12%) | 2232 (33%) |
| Corral:B | 1756 (26%) | 1691 (25%) | 1580 (24%) |
| Corral:O | 2441 (37%) | 1916 (29%) | 2184 (33%) |
| (Missing) | 66 (1%) | 0 (0%) | 62 (1%) |
| Age:[0,20) | 69 (1%) | 42 (1%) | 64 (1%) |
| Age:[20,30) | 1039 (16%) | 655 (10%) | 942 (14%) |
| Age:[30,40) | 2207 (33%) | 1379 (21%) | 2003 (30%) |
| Age:[40,50) | 2023 (30%) | 1323 (20%) | 1843 (28%) |
| Age:[50,60) | 1059 (16%) | 794 (12%) | 962 (14%) |
| Age:[60,70) | 258 (4%) | 215 (3%) | 233 (3%) |
| Age:[70,80) | 21 (0%) | 20 (0%) | 19 (0%) |
Table 2
Shortfall statistics for all runners as well as runners in each gender, corral, and age group
| (a) Shortfall statistics for all runners | ||||
| mean | sd | N | stderr of mean | |
| 8.53% | 11.55% | 4428 | 0.17% | |
| (b) Shortfall statistics for all runners by gender | ||||
| gender | mean | sd | N | stderr of mean |
| female | 7.58% | 10.56% | 1813 | 0.25% |
| male | 9.02% | 12.01% | 2551 | 0.24% |
| (c) Shortfall statistics for all runners by corral | ||||
| corral | mean | sd | N | stderr of mean |
| X | 8.54% | 11.83% | 11 | 3.57% |
| A | 9.59% | 10.94% | 810 | 0.38% |
| B | 11.22% | 12.25% | 1691 | 0.30% |
| O | 5.72% | 10.49% | 1916 | 0.24% |
| (d) Shortfall statistics for all runners by age | ||||
| ageDecade | mean | sd | N | stderr of mean |
| [0, 20) | 9.92% | 20.31% | 42 | 3.13% |
| [20, 30) | 9.10% | 14.06% | 655 | 0.55% |
| [30, 40) | 7.80% | 11.75% | 1379 | 0.32% |
| [40, 50) | 8.80% | 10.73% | 1323 | 0.30% |
| [50, 60) | 8.62% | 10.15% | 794 | 0.36% |
| [60, 70) | 9.16% | 9.26% | 215 | 0.63% |
| [70, 80) | 9.92% | 7.04% | 20 | 1.58% |
Table 3
T-statistics comparing average shortfall across different population groups. Confidence intervals have been adjusted for multiple comparisons using the Bonferroni correction based on the number of different possible comparison for that category
| Category | Group 1 | Group 2 | t-statistic | p-value | # of comparisons | new p-value threshold (c.i. of 0.01) |
| Gender | Male | Female | 4.19 | <1e-4 | 1 | 0.01 |
| Corral | B | A | 3.36 | <1e-3 | 6 | 0.0016 |
| Age | [20 : 30) | [30, 40) | 2.06 | 0.04 | 21 | 5e-4 |
Table 4
Shortfall statistics by gender and age. T-statistics are provided with p-values below in parentheses. Due to lack of data, we have removed age group 70–80 in Table 4b. We see that men consistently exhibit higher shortfall than women across all corrals and age groups
| (a) Shortfall by gender and corral | ||||||
| corral | gender | mean | sd | N | stderr | t-statistic of difference |
| A | female | 8.36% | 9.83% | 199 | 0.70% | 1.87 |
| A | male | 9.91% | 11.18% | 607 | 0.45% | (0.063) |
| B | female | 10.36% | 11.38% | 655 | 0.44% | 2.08 |
| B | male | 11.60% | 12.57% | 1023 | 0.39% | (0.063) |
| O | female | 5.51% | 9.64% | 957 | 0.31% | 0.06 |
| O | male | 5.54% | 11.05% | 912 | 0.37% | (0.950) |
| (b) Shortfall by gender and corral | ||||||
| age | gender | mean | sd | N | stderr | t-statistic of difference |
| [0, 20) | female | 7.78% | 15.61% | 16 | 3.90% | 0.86 |
| [0, 20) | male | 12.81% | 21.93% | 25 | 4.39% | (0.398) |
| [20, 30) | female | 7.73% | 12.46% | 321 | 0.70% | 2.21 |
| [20, 30) | male | 10.14% | 15.19% | 327 | 0.84% | (0.028) |
| [30, 40) | female | 6.84% | 10.43% | 658 | 0.41% | 2.46 |
| [30, 40) | male | 8.38% | 12.63% | 698 | 0.48% | (0.014) |
| [40, 50) | female | 8.24% | 9.70% | 561 | 0.41% | 1.31 |
| [40, 50) | male | 9.01% | 11.33% | 745 | 0.42% | (0.189) |
| [50, 60) | female | 7.78% | 9.80% | 222 | 0.66% | 1.35 |
| [50, 60) | male | 8.84% | 10.11% | 561 | 0.43% | (0.178) |
| [60, 70) | female | 8.32% | 9.16% | 34 | 1.57% | 0.66 |
| [60, 70) | male | 9.46% | 9.28% | 177 | 0.70% | (0.510) |
Table 5
Differences in divergence from even pacing between male and female pace in different corrals. The difference shown is the difference in percentage slowdown from or speedup over the overall pace in the split along with the T-stat of the difference between men and women in parentheses. A significant negative T-stat means that men are pacing significantly faster relative to women in that split. The X corral is excluded due to the low number of datapoints
| Split | A | B | O | Overall |
| 0–5K | –1.38 | –1.06 | –1.79 | –0.92 |
| (–5.25) | (–3.05) | (–6.31) | (–5.49) | |
| 5K–10K | –1.16 | –1.82 | –2.01 | –1.48 |
| (–5.17) | (–5.30) | (–7.36) | (–9.35) | |
| 10K–15K | –1.35 | –2.14 | –2.18 | –1.83 |
| (–6.62) | (–7.62) | (–8.74) | (–13.15) | |
| 15K–20K | –1.57 | –2.03 | –1.87 | –1.74 |
| (–8.15) | (–8.03) | (–7.94) | (–13.41) | |
| 20K–25K | –1.28 | –1.22 | –1.21 | –1.35 |
| (–8.02) | (–5.52) | (–5.81) | (–11.99) | |
| 25K–30K | –0.11 | –0.04 | 0.75 | –0.02) |
| (–0.48) | (–0.15) | (2.92) | (–0.12) | |
| 30K–35K | 3.58 | 2.12 | 2.41 | 1.63 |
| (4.82) | (5.81) | (7.95) | (8.69) | |
| 35K–40K | 3.58 | 3.91 | 4.02 | 3.63 |
| (9.09) | (9.05) | (11.44) | (16.48) | |
| 40K–finish | 3.86 | 4.30 | 4.14 | 4.44 |
| (8.01) | (8.76) | (10.63) | (17.17) |
Table 6
Differences in divergence from even pacing between male and female pace in different age groups. The difference shown is the difference in percentage slowdown from or speedup over the overall pace in the split along with the T-stat of the difference between men and women in parentheses. A significant negative T-stat means that men are pacing significantly faster relative to women in that split. The 70–80 age group is excluded for lack of datapoints
| Split | [0, 20) | [20, 30) | [30, 40) | [40, 50) | [50, 60) | [60, 70) | Overall |
| 5K | –1.05 | –0.87 | –0.97 | –0.75 | –0.66 | –1.65 | –0.92 |
| (–0.50) | (–1.86) | (–3.29) | (–2.55) | (–1.66) | (–1.26) | (–5.49) | |
| 5K–10K | –1.65 | –1.92 | –1.39 | –1.61 | –1.31 | –1.89 | –1.48 |
| (–0.85) | (–4.29) | (–5.34) | (–5.41) | (–3.42) | (–2.20) | (–9.35) | |
| 10K–15K | –3.48 | –2.46 | –1.97 | –1.56 | –2.06 | –2.64 | –1.83 |
| (–2.17) | (–6.02) | (–8.45) | (–6.31) | (–5.86) | (–3.11) | (–13.15) | |
| 15K–20K | –1.74 | –2.29 | –2.07 | –1.65 | –1.44 | –1.32 | –1.74 |
| (–1.13) | (–6.36) | (–9.66) | (–7.41) | (–3.84) | (–1.49) | (–13.41) | |
| 20K–25K | –0.60 | –1.23 | –1.39 | –1.73 | –1.54 | 0.46 | –1.35 |
| (–0.52) | (–4.16) | (–7.40) | (–8.46) | (–4.72) | (0.60) | (–11.99) | |
| 25K–30K | 1.07 | 0.66 | 0.03 | –0.22 | –0.39 | 0.57 | –0.02 |
| (0.59) | (1.52) | (0.13) | (–0.82) | (–1.09) | (0.68) | (–0.12) | |
| 30K–35K | 5.47 | 1.93 | 1.86 | 1.59 | 1.39 | 2.12 | 1.63 |
| (2.15) | (3.50) | (5.43) | (5.16) | (2.96) | (2.67) | (8.69) | |
| 35K–40K | 1.77 | 4.07 | 3.76 | 3.79 | 3.67 | 3.56 | 3.63 |
| (0.66) | (6.06) | (9.66) | (10.19) | (7.18) | (3.18) | (16.48) | |
| 40K–finish | 0.64 | 4.47 | 4.82 | 4.30 | 3.98 | 2.51 | 4.44 |
| (0.22) | (6.09) | (9.81) | (9.41) | (6.98) | (1.84) | (17.17) |
Table 7
This table confirms the results from March et al. (2011) that age, sex, and finish time are all determinants of pacing for runners in the Houston marathon based on multi-factor linear regressions. Estimated values are provided with Tstatistics below in parentheses
| α | βmale | βage | βfinishtime | R2 |
| 0.074 | 0.046 | |||
| (32.31) | (15.80) | 0.04 | ||
| 0.118 | –0.0004 | |||
| (20.71) | (-2.778) | 0.001 | ||
| –0.059 | 0.036 | |||
| (-7.14) | (19.85) | 0.06 | ||
| –0.089 | 0.0628 | –0.001 | 0.045 | |
| (-9.39) | (21.76) | (-8.86) | (24.77) | 0.12 |

