
Decreased Risk of Parkinson’s Disease After Rheumatoid Arthritis Diagnosis: A Nested Case-Control Study with Matched Cases and Controls
Abstract
Background:
Rheumatoid arthritis (RA) and the genetic risk landscape of autoimmune disorders and Parkinson’s disease (PD) overlap. Additionally, anti-inflammatory medications used to treat RA might influence PD risk.
Objective:
To use a population-based approach to determine if there is an association between pre-occurring rheumatoid arthritis (RA) and later-life risk of PD.
Methods:
The study population was 3.6 million residents of Sweden, who were alive during part or all of the follow-up period; 1997–2016. We obtained diagnoses from the national patient registry and identified 30,032 PD patients, 8,256 of whom each was matched to ten controls based on birth year, sex, birth location, and time of follow-up. We determined the risk reduction for PD in individuals previously diagnosed with RA. We also determined if the time (in relation to the index year) of the RA diagnosis influenced PD risk and repeated the analysis in a sex-stratified setting.
Results:
Individuals with a previous diagnosis of RA had a decreased risk of later developing PD by 30–50% compared to individuals without an RA diagnosis. This relationship was strongest in our conservative analysis, where the first PD diagnosis occurred close to the earliest PD symptoms (odds ratio 0.47 (CI 95% 0.28–0.75, p = 0.0006); with the greatest risk reduction in females (odds ratio 0.40 (CI 95% 0,19–0.76, p = 0.002).
Discussion:
Our findings provide evidence that individuals diagnosed with RA have a significantly lower risk of developing PD than the general population. Our data should be considered when developing or repurposing therapies aimed at modifying the course of PD.
INTRODUCTION
Parkinson’s disease (PD) is an age-related neurodegenerative disease characterized by the classical motor deficits (akinesia, rigidity, tremor and postural instability) as well as several non-motor signs and symptoms. The neuropathology of PD includes the loss of midbrain dopamine neurons and the presence of intraneuronal protein aggregates (Lewy bodies) in widespread brain areas [1]. The underlying pathogenic process in PD is not fully understood. It has been suggested that inflammation, mitochondrial deficits, oxidative stress and failure of the lysosomal autophagy system all play roles [2].
The prevalence of PD is estimated at between 0.5 and 2% [3], depending on the age profile of the population and the diagnostic vigilance of the health care system. The incidence rate peaks at the age of 70 years and PD is rarely diagnosed in individuals younger than 50 years. PD is almost twice as frequent among men as women [3, 4]. It is estimated that only 5% of PD cases are familial, and that among sporadic cases, the cumulative impact of heritability is less than 25%, which suggests that environmental and lifestyle factors play an important role in governing PD risk [5, 6]. Previous epidemiological studies have suggested that, e.g., Type II diabetes, exposure to pesticides, certain infections (e.g., Hepatitis C) and inflammatory bowel disease are associated with elevated PD risk [7–10]. By contrast, consumption of coffee, cigarette smoking and intake of certain anti-inflammatory drugs have been associated with reduced PD risk [6, 11–14]. In addition, the use of immunosuppressants are associated with a reduced risk of PD [15]. While PD is primarily viewed as a brain disorder, the most upstream pathogenic events could occur in, e.g., the gut or peripheral parts of the olfactory system. The PD pathogenic process has been suggested to start 5–20 years prior the onset of the classical motor deficits and formal diagnosis [1]. This phase is called prodromal PD and is characterized by loss of sense of smell, constipation, depression, anxiety and sleep disorders.
Rheumatoid arthritis (RA) is a common, chronic and often severe autoimmune disease. It has been suggested that the genetic risk landscape of autoimmune disorders and PD partially overlap [16]. At the same time, anti-inflammatory medications used to treat RA could be hypothesized to influence PD risk as they do with inflammatory bowel disease [11]. Therefore, we were interested in exploring the association between RA and PD in a large and well characterized population. Four prior studies have addressed the possible association between RA and PD (Table 2). In one study, individuals with RA had almost half the risk of being diagnosed with PD during the follow up period [17]. However, the three other studies, found no effect of RA on subsequent PD risk, or found an opposite association, namely that people diagnosed with RA had an increased risk of developing PD later in life [18–20].
Table 1
Comparison of four classes of patients based on the type of their first PD diagnosis
| Registry | Diagnose | Percentage | Median age |
| Outpatient | Main | 28% | 69 |
| Outpatient | Secondary | 3% | 73 |
| Inpatient | Main | 22% | 74 |
| Inpatient | Secondary | 47% | 77 |
Percentage indicates how many PD patients remain in the dataset when a certain restriction on the source of their PD diagnosis is applied. Median age described the age of the patients at their first PD diagnosis. The data is visualized in the Supplementary Figure 5.
In this study, we optimized the epidemiological analysis by taking extra measures to capture the first PD diagnosis date of each patient as accurately as possible and by stratifying and analyzing the impact of the number of years between a RA diagnosis and subsequent PD diagnosis. We hypothesized that because the PD prodromal phase likely is several years, it is particularly important to analyze people who were diagnosed with RA relatively early in relation to the age when PD is expected to occur.
METHODS
Population
The study population consists of Sweden’s residents who had a Swedish personal number and lived in Sweden between 1964 and 2016. This assures that all the individuals included in this study were tracked in the national healthcare registers.
Data source
Medical data was obtained from Socialstyrelsen (SoS), a Swedish governmental agency managing medical registries. Study subjects’ background data (birth year, birth location) was received from governmental agency Statistiska centralbyrån (SCB). Our data consists of an extract from inpatient and outpatient medical registers, used to investigate co-morbidities between different chronic diseases with inflammatory components. The dataset includes individuals who are themselves affected or who have parents, children or siblings affected by diabetes mellitus or celiac disease. The extract consists of approximately 3.6 million individuals or 22% of the total Swedish population followed-up in these registers (Supplementary Figure 1). The conservative method of analysis utilized only in-patient data whereas the more inclusive analysis (included the in-patient and out-patient data) to study the associations between PD and RA.
To ensure that any observed associations are not driven by the selection of individuals, we performed the following technical matching in the analyses; PD cases and PD controls were (additionally) matched on eight dichotomous variables:
1) Does this person have celiac disease?
2) Do any of this person’s siblings have celiac disease?
3) Does either of this person’s parents have celiac disease?
4) Do any of this person’s children have celiac disease?
5) Does this person have diabetes?
6) Do any of this person’s siblings have diabetes?
7) Does either of this person’s parents have diabetes?
8) Do any of this person’s children have diabetes?
The full matching procedure is explained below.
Working dataset
While identifying PD cases and their controls, we used all four historical ICD revisions, spanning years 1964–2017. To identify the RA cases and controls, the latest revision, ICD-10, was used, spanning years 1997–2017. The wider follow-up period of 1964–2017 was needed to identify, with a high likelihood, the date of first PD diagnosis for every PD patient. This allowed us to construct an analysis in which RA is diagnosed first and to test whether the probability of PD diagnosis increases or decreases after a certain number of years (a lag period). This design led to a maximum follow up time of 20 years post RA diagnosis.
Exclusion criteria
Individuals who were not born in Sweden were excluded, as well as individuals receiving any of the following ICD codes regardless of whether it was their main diagnosis or a secondary diagnosis. Syphilis: ICD code entries beginning with “02 [0–9]”, “02 [0–9]”, “A52” and assigned during the periods 1964–1968, 1969–1999, and 1997–2017, respectively. Schizophrenia: ICD code entries beginning with “300,99”, “295”, “F20” and assigned during the periods 1964–1968, 1968–2001, and 1997–2017, respectively. Secondary Parkinsonism: ICD code entries beginning with “332B”, “G21” assigned during the periods 1987–1997 and 1997–2017, respectively. Other extrapyramidal movement disorders: exact ICD code entries “331,0”, “331,0 [0–2, 9]” assigned during the period 1969–1990; exact ICD code entries “780,3”, “780,3 [0–2,9]”, “780,4”, “780,4 [0, 2–4, 9]” assigned during the period 1969–1986; ICD code entries beginning with “333” or “G25” assigned during the periods 1987–1997 and 1997–2017, respectively. Other degenerative diseases of basal ganglia: ICD code entries beginning with “331, [0–2, 9]”, “333,9”, “347,9”, “780, [3, 4]”, “306,2”, “300,8”, “787,1”, “733,9” assigned during the period 1969–1986; also ICD code entries beginning with “333”, “G23” assigned during the periods 1987–1997 and 1997–2017, respectively.
PD cases
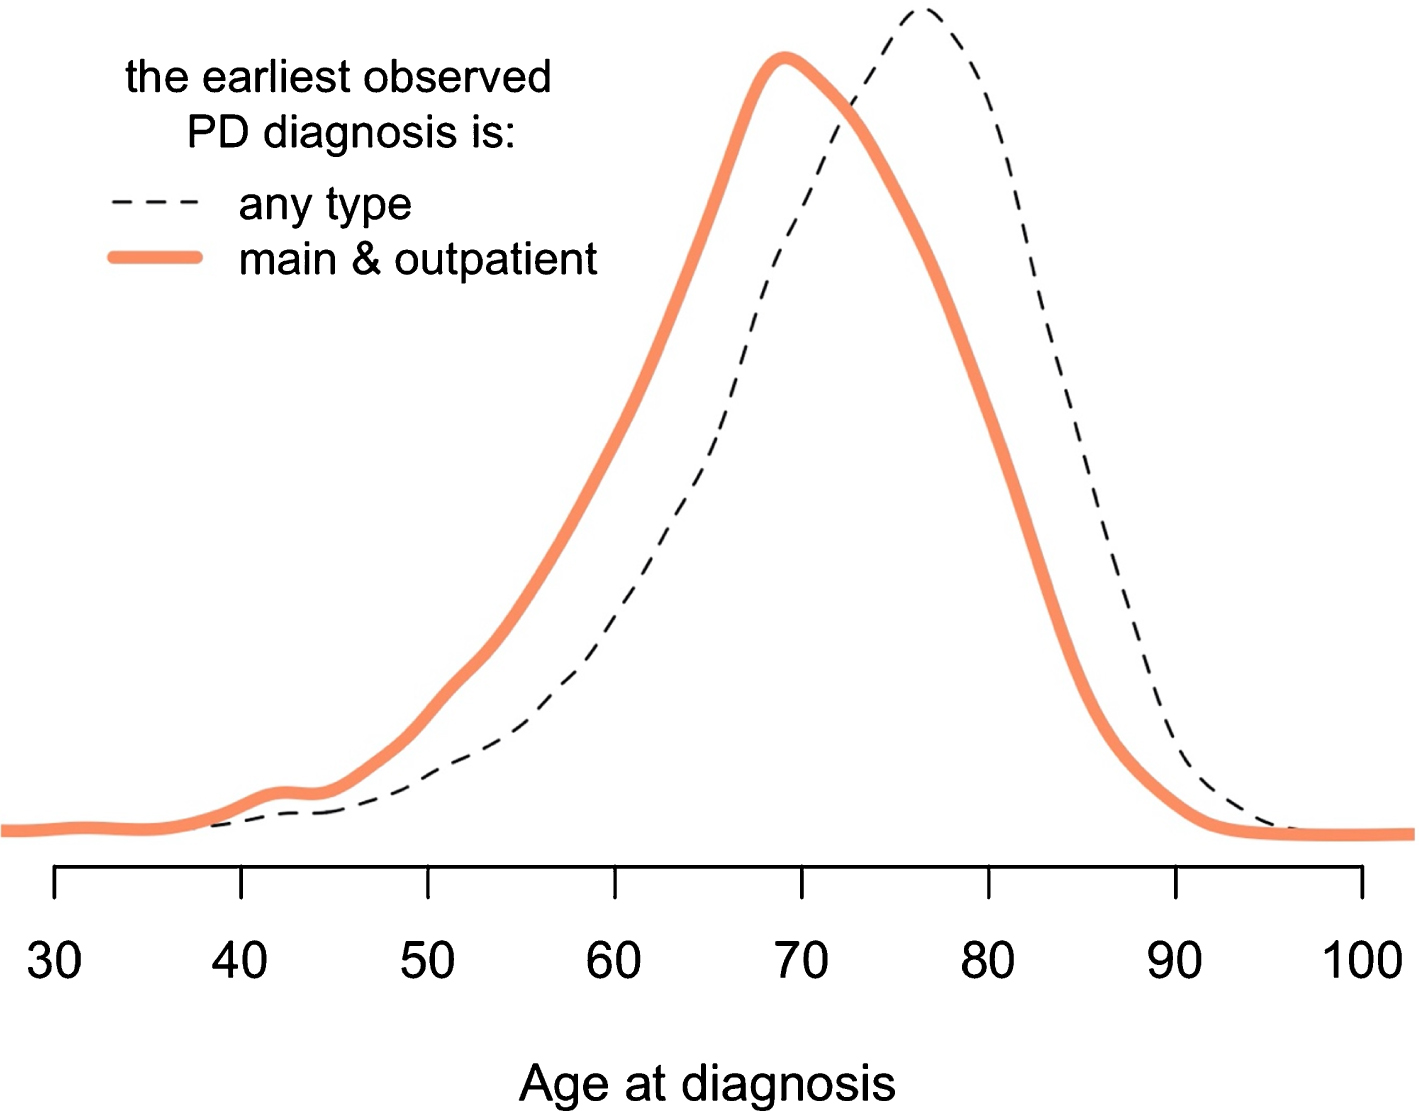
We defined PD patients as those having ICD code entries beginning with “350”, “342”, “332A”, or “G20” and assigned during the periods 1964–1968, 1969–1986, 1987–1997, and 1997–2017, respectively. We performed two analyses with different inclusion criteria; we refer to the first one as the conservative and the second one as the inclusive analysis. In the conservative branch of the study, we took several measures to ensure that the date of each individual’s first PD diagnosis was as accurate as possible, while in the inclusive branch of the study we did not (Fig. 1). The first measure was a requirement that each individual’s first PD diagnosis would have been assigned as the main diagnosis of his/her visit to a doctor. This was done to increase the likelihood that it truly represents each individual’s first diagnosis (which, theoretically, could be not recorded in the medical register). The second measure was that each individual’s first PD diagnosis would come from the outpatient register and not the inpatient register. The justification for these two rules is given in Fig. 2. In the conservative branch of the study, both of these two conditions had to be fulfilled. PD patients not fulfilling these requirements were removed from that study branch. In the inclusive analysis, data from all PD patients was used whether diagnosis was made in the in-patient or out-patient registry. These steps are detailed in Fig. 1.
Fig. 1
Data preparation workflow with exclusion steps used to derive the working datasets. PD, Parkinson’s disease; RA, rheumatoid arthritis; ICD-10, International Classification of Diseases revision 10. Red - inclusive analytical branch, Green - conservative analytical branch. Lower color saturation - controls. Dotted line symbolizes matching (ratio 1 to 10). Reasonable age at follow up refers to a person’s age at follow up; this cannot exceed 100 years of age. This cutoff was used to avoid a hypothetical scenario with individuals who died outside of Sweden and were never labeled as dead in the register.
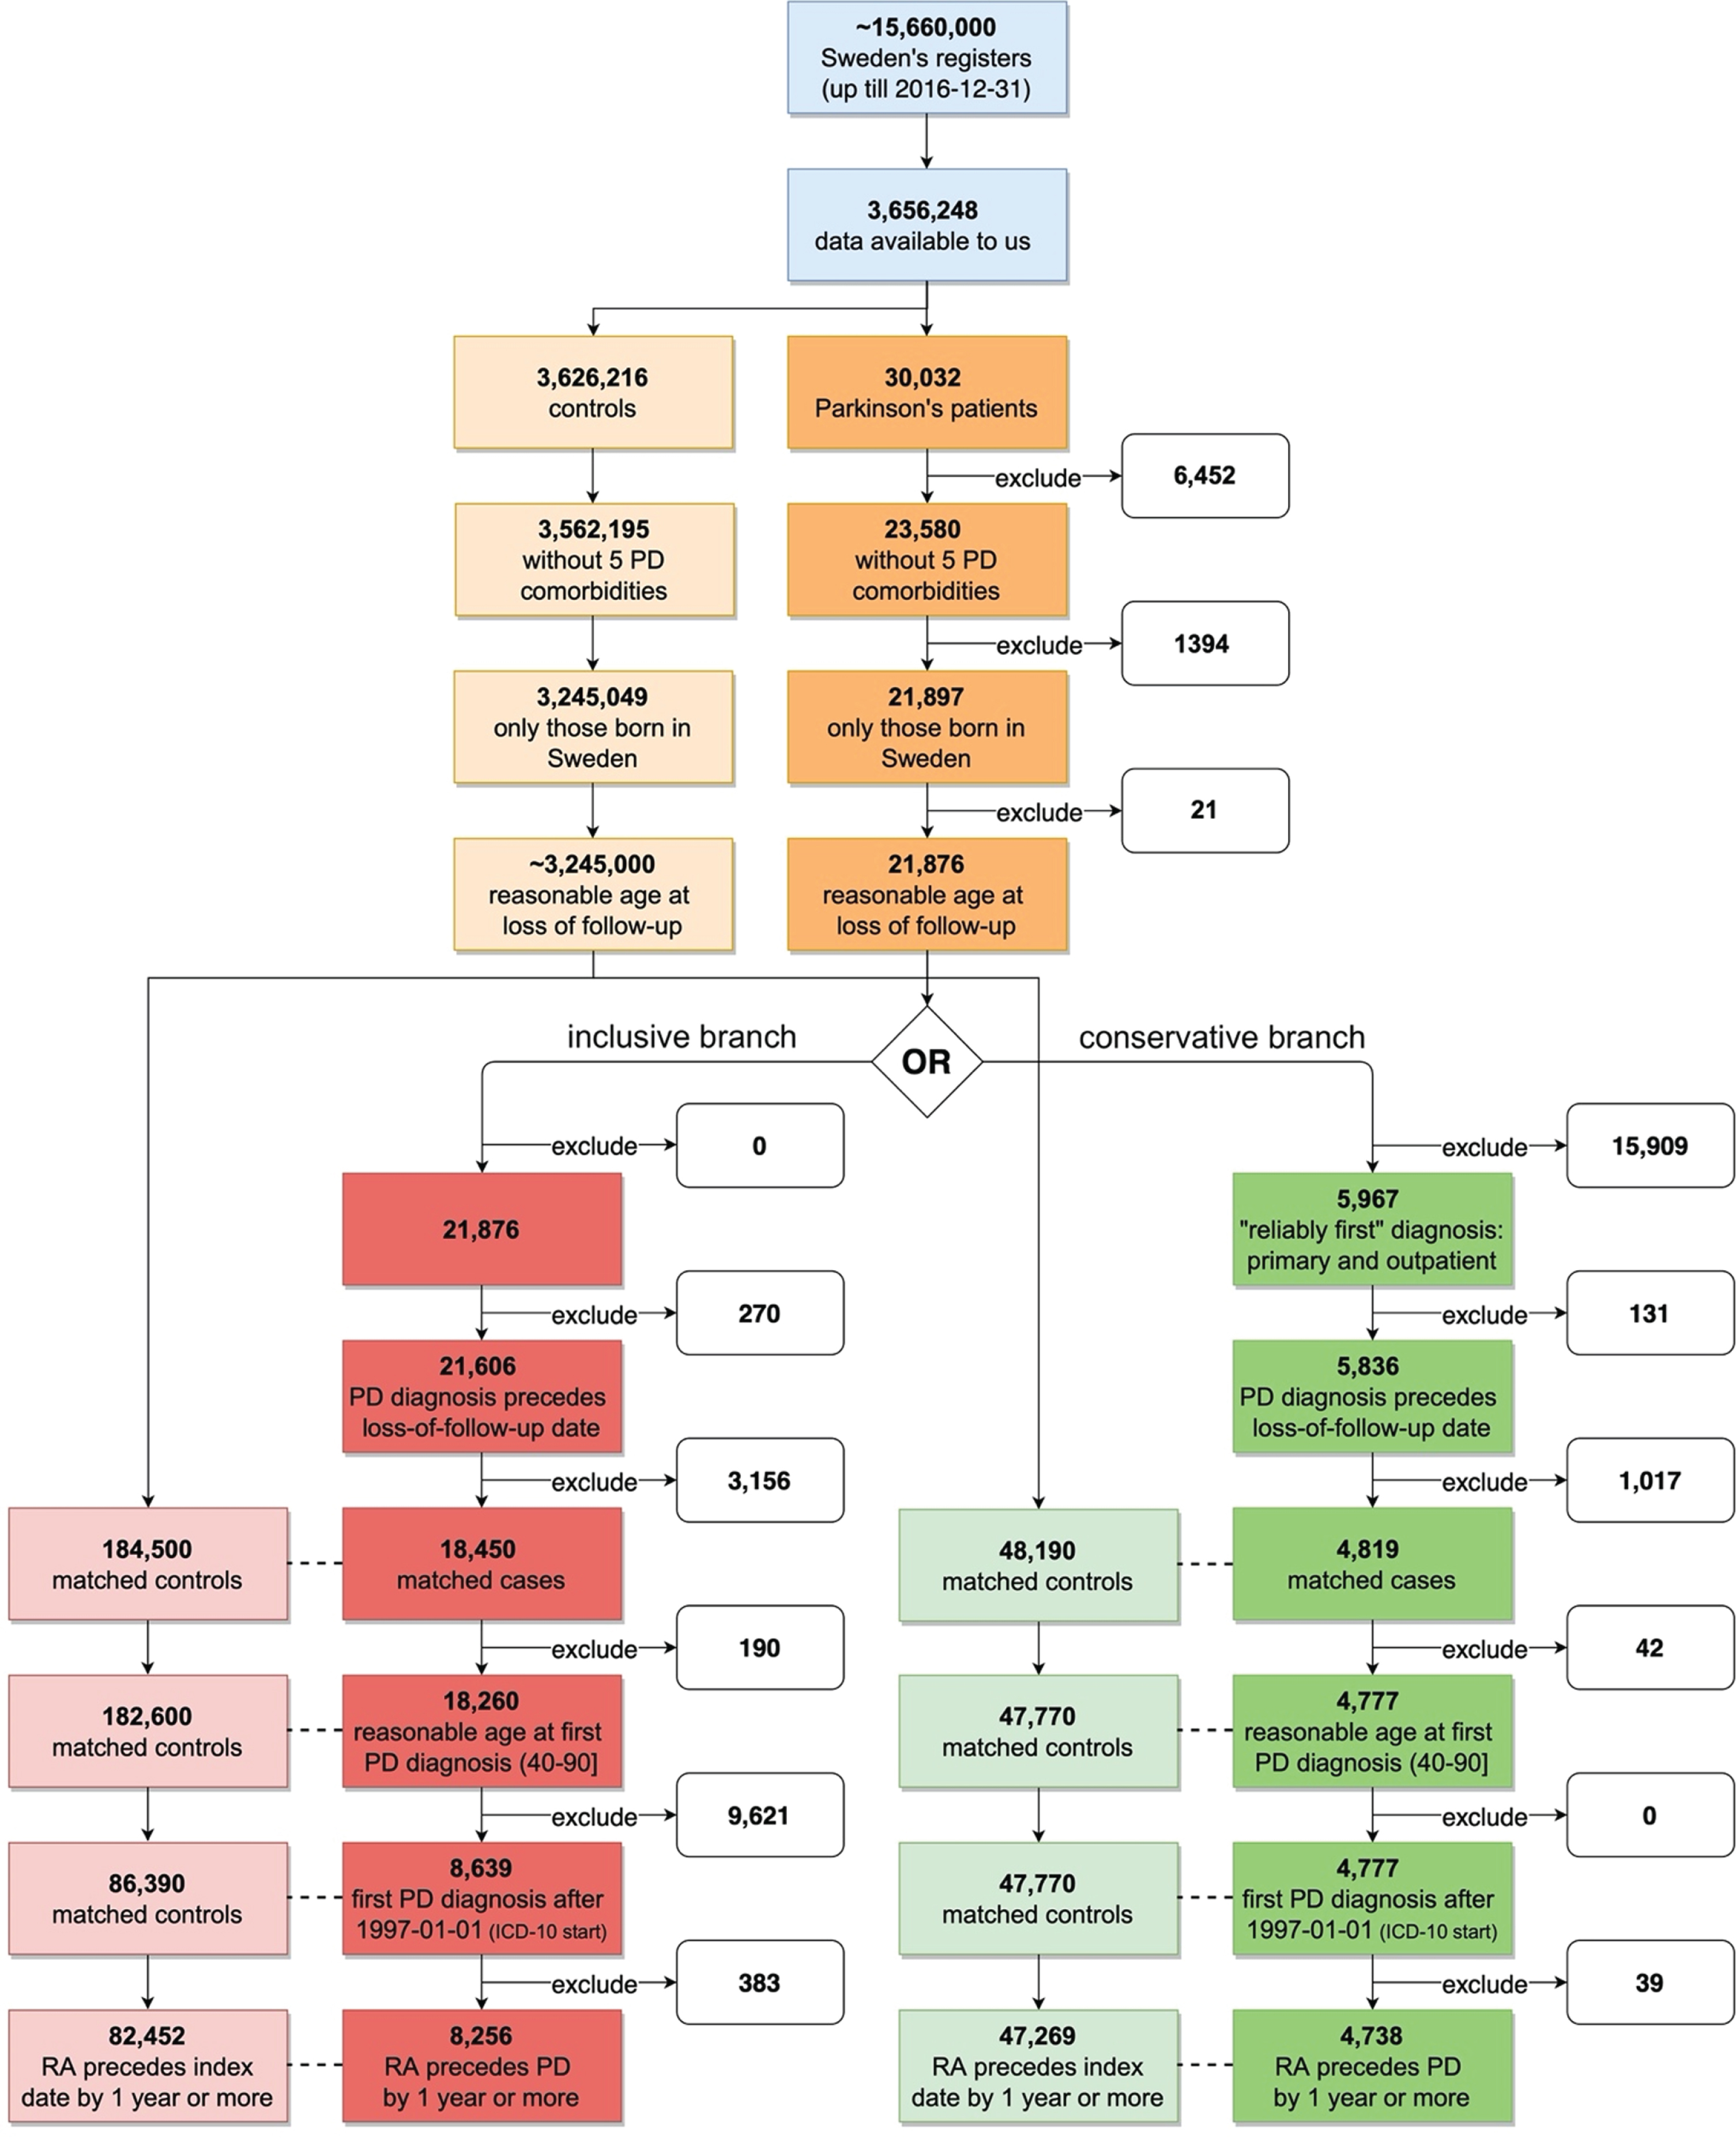
Fig. 2
Conservative method to accurately identify first PD diagnosis. A more conservative method results in younger age at the first diagnosis. The “main” means that diagnosis was assigned as the primary reason for that particular healthcare facility visit (there can be only one main diagnosis and multiple secondary diagnoses during one visit). The “any type” means that the earliest observed PD diagnosis might come from inpatient or outpatient registers, also it can be assigned as the main or the secondary diagnosis. A more detailed version of this figure is provided in Supplementary Fig. 5.
PD controls
All remaining individuals who were not among PD cases, nor removed in the exclusion step, and were not among the excluded PD cases due to ambiguous date of first diagnosis - were potential controls.
Matching cases with controls
All PD patients were labeled with a matching type constructed from a combination of three study-related variables and eight technical variables. The three study-related variables were: birth year, sex, birth location. The remaining technical variables were not related to our research question but were used to ensure that the cohort used (diabetes-celiac patients and their relatives) did not interfere nor bias the study results (see Supplementary Material). In total there were 8404 unique matching types.
For each matching type, the following procedure was done:
1) PD case individuals of this type were extracted and ordered randomly, forming a pool of cases, named A. PD control individuals of this type were extracted and ordered randomly, forming a much larger pool of controls, named B.
2) To find matches for individuals in the pool A, a sub-pool b was formed by selecting individuals from pool B using the following procedure. For each individual in sub-pool b, their personal follow-up end date (death, emigration) must supersede the date of PD diagnosis for each individual in pool A. Individual b1, who is the first person in sub-pool b, is assigned to the first person in pool A (A1). Individual b1 is permanently eliminated from pools b and B.
3) The step 2) is repeated sequentially with all individuals in A.
4) The step 3) is repeated maximum 200 times, or until the pool B is depleted, or until none of the individuals in A is assigned a new match.
The procedure assures that matched controls are distributed evenly to all cases without any systemic bias. The technical matching was described above.
Matching optimization
Three requirements were needed to optimize the case-control matching:
1) every PD case in the downstream analyses has the same number of matched controls;
2) the number of cases excluded from the downstream analyses due to 1) is minimized;
3) the number of matched controls per one case in the analyses is maximized.
To fulfil these three requirements, a power-calculation using hypothetical comorbidity was simulated (Supplementary Figure 7). The cost of losing PD cases is balanced against the benefits of having multiple controls per case. The resulting optimized number of matched cases per one control was estimated to be in the range of 9 to 11, and we chose to use 10 to construct the final case-control matched dataset.
Final matched dataset
PD cases who have less matched controls than the estimated optimized number, were excluded from the dataset. For each PD case who has more matched controls than the estimated optimized number, a random subset of matched controls was selected and the remaining controls discarded.
All in all, we matched PD and controls based on all the variables that were present in our dataset, within the smallest possible bins (e.g., birth year). As every case was matched to 10 controls (without exception), thus every control (or case) had equal weight in our study, allowing us to select the analysis outlined in the flowchart (Fig. 1) without the use of conditional logistic regression.
Rheumatoid arthritis patients
RA patients were defined as those in the final matched dataset, having ICD code entries beginning with “M05” or “M06” assigned during the period 1997–2017 (ICD-10). For each patient, the earliest observed date of this diagnosis was kept (regardless of whether it was the main or the secondary diagnosis) and the later dates (if any) were discarded.
Antecedent analysis
The sliding threshold defines the minimum number of years required to separate the RA diagnosis (antecedent) and the index date (PD diagnosis date). RA is always required to precede PD. Only the RA cases that fulfill this requirement are used in the analysis and all other RA cases are excluded. The threshold has a maximum value of 20 (calculated from the last diagnosis date in the working dataset minus the first date of the ICD-10 code usage, 2017 and 1997, respectively).
With each value of sliding threshold, we cross tabulated the numbers of PD cases and controls and the numbers of RA cases and controls in a two-by-two table. The association is expressed as an odds ratio with 95% confidence intervals. The results are visualized by plotting these estimates (y-axis) with their respective thresholds (x-axis).
Statistical methods
All statistical analyses were done using R –a language and software for statistical computing and graphics (version 3.6.1). The strength of association between RA and PD was evaluated by arranging matched case-control data (with respect to PD) in a 2-by-2 matrix and then using Fisher’s exact test for count data to obtain odds ratios, their 95% confidence intervals, and p-values. When interpreting the results, we considered associations to be statistically significant when p-values were below 0.05.
RESULTS
ICD codes found
The most common observed ICD codes matching PD diagnosis criteria were “G209”, “332A”, “342,00”, while the most common observed ICD codes matching RA diagnosis criteria were “M059”, “M069”, “M060” (Supplementary Figures 2 and 3).
PD cases and matched controls
Out of approximately 3.6 million people in our data source cohort, we identified 30,032 PD patients (∼0.8%). After various steps of exclusion and matching, 8,256 cases were used in the inclusive analysis and 4,738 PD cases were included in the conservative branch of the study (Fig. 1). The first step of exclusions involving the five PD comorbidities is shown in Supplementary Figure 4.
The two branches of analytical pipeline differ in reliability of the first date of PD diagnosis and sample size. The inclusive branch includes all PD patients, while the conservative branch includes only those who had their first (earliest) PD diagnosis assigned to them in the outpatient register as the main diagnosis (conservative method reduces working dataset by half). In the conservatively constructed cohort, the age-at-first-diagnosis distribution is significantly shifted towards the younger age (Fig. 2). This implies that this method better captures the earliest date of PD symptom manifestation as the main diagnosis in the outpatient register is likely to be assigned earlier in a PD patient’s life compared to PD diagnoses assigned in the in-patient registry. A breakdown of the four classes of patients based on the type of their first PD diagnosis is included in Table 1.
Number of patients with rheumatoid arthritis
In the inclusive branch, the final matched dataset consisted of 90,708 individuals (8,256 PD cases and 82,452 controls), of whom 1,194 also had RA diagnosis. In the conservative branch, the final matched dataset consisted of 52,007 individuals (4,738 PD cases and 47,269 controls), of whom 674 also had RA diagnosis.
Antecedent analysis
In all variations of our analyses, we found a significant negative association between RA, as an antecedent, and a later diagnosis of PD (Fig. 3). The risk of getting PD diagnosis was decreased roughly by 30–50% in those individuals who received an RA diagnosis earlier (compared to those who did not receive it). In the inclusive branch of analyses, the odds of getting PD diagnosis 5 (or more) years after the RA diagnosis –was reduced by 35%, odds ratio 0.65 (CI 95% 0.46–0.89), p = 0.006 (Supplementary Table 1). Similarly, in the conservative branch (with 37% less PD cases), the odds of getting PD diagnosis 5 (or more) years after the RA diagnosis –was reduced by 53% : odds ratio 0.47 (CI 95% 0.28–0.75), p = 0.0006 (Supplementary Table 2). In general, the association in the conservative branch of analyses (with less individuals and more reliable date of the first PD diagnosis) was stronger than in the inclusive branch.
Fig. 3
Results from antecedent analyses reveal decreased risk of PD diagnoses after RA diagnosis. A) Inclusive analyses; B) conservative analyses; C) conservative analyses with only males; D) conservative analyses with only females. Antecedent threshold is the minimal number of years separating antecedent (RA) and the main outcome (PD), also called “lag period”. The bars show 95% confidence intervals of the estimated odds ratio. Tabulated results are presented in the Supplementary Tables 1 and 2.
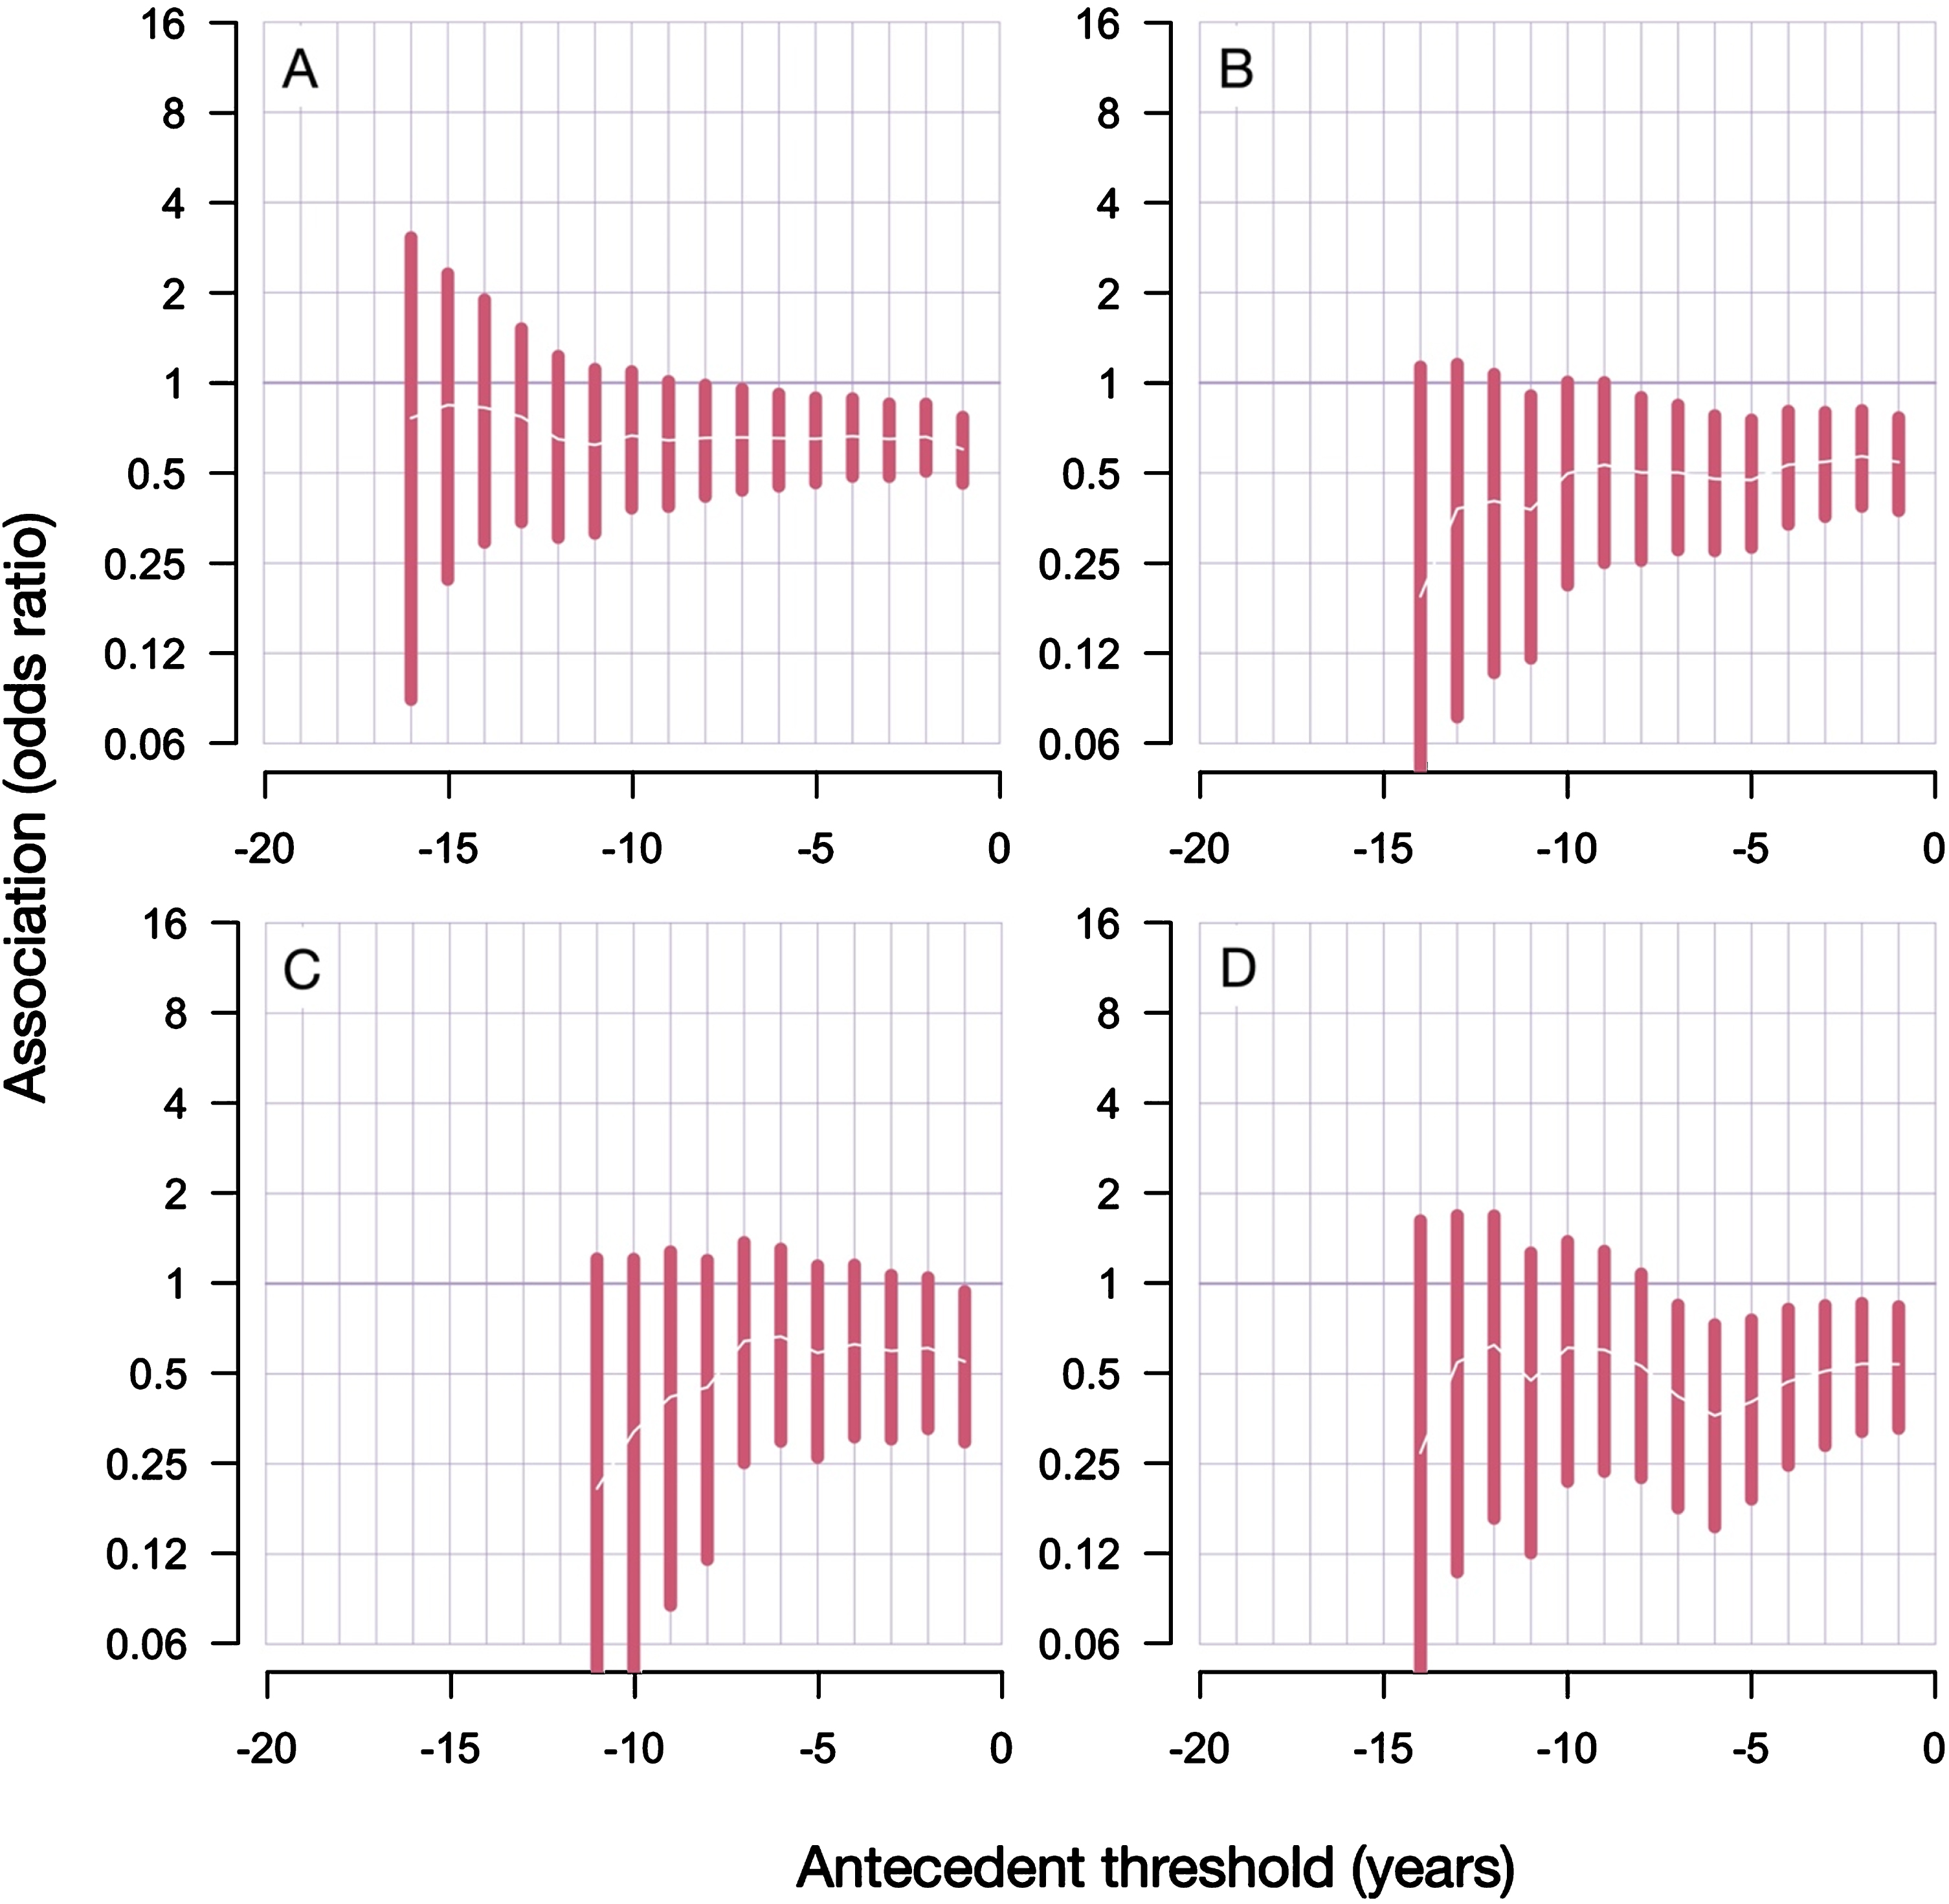
The qualitative conclusion did not change with different lag periods (the minimal number of years required to separate RA and first PD diagnosis): the association between RA and PD was always negative, albeit statistically less significant when the analyzed cohort reduced in size due to the applied lag period restrictions.
Comparing the sex-stratified results in the conservative branch of analyses gives a clear conclusion that the female group, despite being smaller, manifests a more pronounced and more statistically significant negative association between RA and PD (Fig. 3). With the lag period of 5 years (or more), the odds ratio in male group was 0.59 (CI 95% 0.26–1.14) and p-value 0.13; while the odds ratio in females was 0.40 (CI 95% 0.19–0.76) and p-value 0.002. Here, the number of PD patients in the female group is 64% the size of the male group (1658 vs 2571).
DISCUSSION
We found a negative association between RA and PD in our cohort, consisting of a total of 3.6 million individuals. A pre-occurring diagnosis of RA was associated with a significantly decreased risk of subsequent PD diagnosis, with the risk reduction being 30–50%, depending on the time period separating these two diagnoses. Various steps of filtering applied to increase the strength with which the first PD diagnosis in the registry captures early PD symptoms produced a smaller sub-cohort (conservative branch) with an even more pronounced negative association.
There are several possible explanations for our results. There could be a genetic antagonistic pleio-tropy, where the same heritable variants would manifest a dual effect: an increased risk of RA and a decreased risk of PD. For example, the disease pathogenesis in RA, involving an autoimmune response, could potentially counteract the disease process that leads to PD. Another possibility could be that RA is associated with environmental, lifestyle- or dietary changes that concomitantly reduce the risk of PD. And finally, the use of anti-inflammatory medications to treat RA might mitigate the risk of subsequent PD. Below, we will expand on these three possibilities.
While pleiotropic genetic variants, manifesting their phenotype in a dual way: increased risk for PD and decreased risk for RA (or vice versa), earlier studies suggest that the genetic landscape associated with increased risk for autoimmune disorders, such as RA, overlaps with the landscape associated with elevated PD risk, making the first explanation perhaps less plausible. However, more work is needed to clarify possible genetic opposing allele risk overlap. According to the Genome-wide association study (GWAS) catalog (accessed on October 21, 2020), 18 out of 131 chromosomal regions harboring PD-related variants have overlapping associations with RA chromosomal regions (as defined by cytogenic band of less than 1 M base pairs). Since no overlapping single nucleotide polymorphisms (SNP) are reported, we cannot say if the associated genetic variants/haplotypes are manifesting antagonistic or unidirectional effect on both phenotypes.
Regarding lifestyle factors influencing the diseases, it is known that RA itself can lead to reduced mobility. On the contrary, there is some evidence that the PD risk is reduced in those who have mobile lifestyles and occupations [21] which would speak against this as a contributing factor. Cigarette smoking is a lifestyle factor that has been repeatedly shown to be associated with reduced PD risk [22–24]. Conversely, the risk for RA has been shown to be increased with smoking [25, 26]. This may suggest that individuals who are smokers increase their risk of RA, while actually decreasing their risk of PD; which possibly could be a factor influencing our result, and in line with our data. Smoking is a strong risk factor for developing seropositive RA and sustained smoking cessation could delay or even prevent the disease [27]. Unfortunately, our dataset from the Swedish patient registry does not capture data on smoking. Notably, people who consume on average 1–3 cups of coffee per day have also been shown to have a reduced risk of PD [28]. While it has not been reported that people with RA drink more coffee, there is a correlation between smoking and coffee intake [29]. In our study, we were unfortunately not able to determine whether smoking, coffee or other life style factors impacted the results, as we did not have this data available for the population.
The chronic use of anti-inflammatory medications by RA patients is a particularly interesting potential explanation as to why people with RA have a reduced risk of developing PD later in life. A common aim of RA treatments is to reduce the chronic inflammation that may otherwise result in joint damage and extra-articular features, and impairment to other organs and systems. TNF-alpha has been recognized as one of the major mediators of the inflammatory process that occurs in RA patients. Since the 1930s, the first disease-modifying anti-rheumatic drugs (DMARDs) such as gold salts, sulfasalazine and, some years later, antimalarials, such as hydroxychloroquine, have been in use, to treat RA patients who did not respond to treatment with non-steroidal anti-inflammatory drugs (NSAIDs). In the 1950s, the Nobel prize awarded discovery of corticosteroids provided the physicians with a strong anti-inflammatory treatment against RA, but the adverse events of these drugs stimulated further efforts aiming at the development of new drugs, currently grouped as conventional synthetic DMARDs (csDMARDs). The introduction of the immunosuppressive drug methotrexate, in the 1980s, and of targeted biologic drugs (bDMARDs), in the 1990s, revolutionized the treatment of RA. A study of RA treatments in Sweden from 2011 [30] reported that 15% of the RA patients were prescribed bDMARDs, 62% received csDMARDs, 49% were on glucocorticoids and 13% on NSAIDs. Only 11% of RA patients had no record of prescriptions for any anti-rheumatic drug. There is now a trend for earlier and wider use of bDMARDs. The last decade has also seen the introduction of biosimilars (bsDMARDs) and JAK-inhibitors (tsDMARDs), but considering that the time window of our study closed in 2016, these new medications are unlikely to have impacted our results. The evidence that systemic inflammation and neuroinflammation play roles in PD pathogenesis is growing rapidly and has been reviewed extensively by others [31]. For example, TNF-alpha-mediated mechanisms have been suggested to contribute to the pathogenesis of PD [32]. A 78% reduction in PD risk has been reported in a retrospective study among the patients with inflammatory bowel diseases who received TNF–alpha inhibitors, compared with those who did not [11]. Taken together, we propose that the successive increased use of such drugs and other targeted biological agents that reduce chronic inflammation in the treatment of RA patients are likely to, at least partially, account for the reduced PD risk that we observe in our study.
Our findings are in line with two out of four previous studies investigating an association between RA and PD (Table 2). We note some methodological differences between those studies and our study, which might contribute to the different outcomes. For example, Chang et al., 2017 [18] matched based on age, using a window of 5 years, and the authors used the ICD-9 for diagnosis while the follow-up period spans the year range of the ICD-10. This issue is also present in Sung et al., 2016 [17]. In the study by Li et al., 2012 [19], the authors did not exclude secondary parkinsonism (ICD-10 code G21) patients. Finally, it is also possible that differences in ethnicity of the studied cohorts and lifestyle factors contribute to the differences in outcomes between our study and previous work.
Table 2
Studies previously investigating whether RA influences the risk for PD
| Study | Sample size | Population | Follow-up | Finding | Reference |
| Chang et al. 2018 | PD = 2,664 | Taiwan | 2001–2012 | HR = 1.14 (1.03–1.2) | [18] |
| RA = 19,542 | |||||
| PD&RA = 379 | |||||
| Sung et al. 2016 | PD = 2,741 | Taiwan | 1998–2010 | HR = 0.65 (0.58–0.73) | [17] |
| RA = 33,221 | |||||
| PD&RA = 360 | |||||
| Li et al. 2011 | PD = 26,791 | Sweden | 1964–2007 | SIR = 1.07 (0.89–1.26) | [19] |
| RA = 52,994 ? | |||||
| PD&RA = 132 | |||||
| Rugbjerg et al. 2009 | PD = 13,695 | Denmark | 1986–2006 | OR = 0.7 (0.5–0.9) | [20] |
| RA = 519 | |||||
| PD&RA = 63 |
Pitfalls, limitations, and alternative interpretations
Given that the Swedish health care system typically offers everyone a life-long follow-up, it is unlikely that RA remains undiagnosed in RA-affected individuals or that PD remains undiagnosed in PD-affected individuals. It is impossible to fully exclude that the association we detected was caused by a confounder, however, we took great care to match PD cases and controls in order to make the groups as similar as possible. A potential confounder that we did not account for could be, for example, educational attainment. Shorter education is associated with increased prevalence of RA in Sweden [30]. Since it has conversely been shown that men attaining higher IQ scores (correlated with educational attainment) during military conscription in Sweden exhibit higher risk of developing PD [33], education level is potentially a confounder that could influence the risk for both diseases.
It is important to highlight that our working dataset was limited to only individuals who were first-degree relatives of (or were him/herself) a person diagnosed with diabetes mellitus or celiac disease. While this dataset was limited, it still allowed us to include 3.6 million individuals, or more than 20% of the entire population followed in the registry. We took precautions to ensure that PD cases and controls were also matched based on the exact type of a relative (self, sibling, child, parent) who had PD and RA. The matching was intended to prevent potential fictitious associations that could arise, due to (for example) unequal distribution of family-size affecting factors between PD case and control groups.
An important pitfall in epidemiological studies of PD is that some patients are misdiagnosed. Ultimately, the diagnosis of PD is only confirmed with absolute certainty when the brain is examined neuropathologically post-mortem. One approach to increase the accuracy of diagnosis is to restrict the analysis to include only patients who have received the diagnosis of PD over several occasions during an extended period of time, as the diagnostic accuracy is known to increase then. The same principle applies to RA patients. We considered this approach of requiring each diagnosis to appear on repeated visits, but concluded it would require an even larger starting data set than we have. Instead, we probed our data further by stratifying it according to the clinical setting in which the diagnosis was made. Thus, we used data from both the in-patient and out-patient registries, which allowed us to conduct analysis where the diagnosis of PD and RA was either more conservative (using the in-patient data) or liberal (using the out-patient data) in the same population. The diagnosis of PD in an in-patient setting is known to be more accurate [34]. Importantly, in both situations, our analyses indicate that RA is negatively associated with a later diagnosis of PD. We then deepened our analysis further by separating our data based on the length of the time interval between the diagnosis of RA and PD to explore if it influences the negative association between the two diseases. We found that the odds of getting PD diagnosis 5 (or more) years after the RA diagnosis using both the in-patient and out-patient data –was significantly reduced.
Future studies could address the validity of our findings by using other cohorts and registries, such as the Swedish Rheumatology Quality (SRQ) register [30]. The SRQ register covers both outpatients and inpatients, starting from 1964 for the inpatients, and this could be an interesting source to probe if certain diagnostic RA subgroups (based on age of onset, medication, disease severity etc.) exhibit a particularly reduced risk for PD. Exploring the SRQ register would capture large numbers of RA patients and might also reveal if confounders such as geographical location and access to hospital care influence the associations we report.
CONCLUSION
We show, in a cohort of 3.6 million inhabitants of Sweden, that an RA diagnosis is significantly associated with a lower incidence of subsequent PD diagnosis. We propose that common anti-inflam-matory treatments used in RA might protect against the later development of PD [35]. This hypothesis can be tested by examining PD risk imposed by the use of anti-inflammatory drugs in conditions other than RA. These data should be taken into account when developing- and clinically evaluating new or repurposed drugs aimed at modifying the disease process in PD.
CONFLICT OF INTEREST
P.B. has received commercial support as a consultant from Axial Therapeutics, Calico, CuraSen, Fujifilm-Cellular Dynamics Inc, Idorsia, IOS Press Partners, LifeSci Capital LLC, Lundbeck A/S, and Living Cell Technologies LTD. He has received commercial support for grants/research from Lundbeck A/S and Roche. He has ownership interests in Acousort AB and Axial Therapeutics and is on the steering committee of the NILO-PD trial. J.B. has received consulting fees from Roche. M.C. has received one speaker fee from AbbVie and one consultant fee from Sanofi.
ACKNOWLEDGMENTS
This study was performed with financial support from the Farmer Family Foundation. We also acknowledge the generous support of Van Andel Institute.
SUPPLEMENTARY MATERIAL
[1] The supplementary material is available in the electronic version of this article: https://dx.doi.org/10.3233/JPD-202418.
REFERENCES
[1] | Braak H , Tredici KD , Rub U , Vos RAI de , Steur ENHJ , Braak E ((2003) ) Staging of brain pathology related to sporadic Parkinson’s disease. Neurobiol Aging 24: , 197–211. |
[2] | Johnson ME , Stecher B , Labrie V , Brundin L , Brundin P ((2019) ) Triggers, facilitators, and aggravators: Redefining Parkinson’s disease pathogenesis. Trends Neurosci 42: , 4–13. |
[3] | Marras C , Beck JC , Bower JH , Roberts E , Ritz B , Ross GW , Abbott RD , Savica R , Eeden SK Van Den , Willis AW , Tanner CM ((2018) ) Prevalence of Parkinson’s disease across North America. NPJ Parkinsons Dis 4: , 21. |
[4] | Cerri S , Mus L , Blandini F ((2019) ) Parkinson’s disease in women and men: What’s the difference? J Parkinsons Dis 9: , 501–515. |
[5] | Blauwendraat C , Nalls MA , Singleton AB ((2020) ) The genetic architecture of Parkinson’s disease. Lancet Neurol 19: , 170–178. |
[6] | Paul KC , Chuang Y-H , Shih I-F , Keener A , Bordelon Y , Bronstein JM , Ritz B ((2019) ) The association between lifestyle factors and Parkinson’s disease progression and mortality. Mov Disord 34: , 58–66. |
[7] | Camargo Maluf F , Feder D , Alves de Siqueira Carvalho A ((2019) ) Analysis of the relationship between type II diabetes mellitus and Parkinson’s disease: A systematic review. Parkinsons Dis 2019: , 1–14. |
[8] | Choi H , Mai TH , Kim K , Cho H , Ki M ((2020) ) Association between viral hepatitis infection and Parkinson’s disease: A population-based prospective study. J Viral Hepat 27: , 1171–1178. |
[9] | Brudek T ((2019) ) Inflammatory bowel diseases and Parkinson’s disease. J Parkinsons Dis 9: , S331–S344. |
[10] | Marras C , Canning CG , Goldman SM ((2019) ) Environment, lifestyle, and Parkinson’s disease: Implications for prevention in the next decade. Mov Disord 34: , 801–811. |
[11] | Peter I , Dubinsky M , Bressman S , Park A , Lu C , Chen N , Wang A ((2018) ) Anti–tumor necrosis factor therapy and incidence of Parkinson disease among patients with inflammatory bowel disease. JAMA Neurol 75: , 939. |
[12] | Chen H , Zhang SM , Hernán MA , Schwarzschild MA , Willett WC , Colditz GA , Speizer FE , Ascherio A ((2003) ) Nonsteroidal anti-inflammatory drugs and the risk of Parkinson disease. Arch Neurol 60: , 1059–1064. |
[13] | Chen H , Jacobs E , Schwarzschild MA , McCullough ML , Calle EE , Thun MJ , Ascherio A ((2005) ) Nonsteroidal antiinflammatory drug use and the risk for Parkinson’s disease. Ann Neurol 58: , 963–967. |
[14] | Maclagan LC , Visanji NP , Cheng Y , Tadrous M , Lacoste AMB , Kalia L V. , Bronskill SE , Marras C ((2020) ) Identifying drugs with disease-modifying potential in Parkinson’s disease using artificial intelligence and pharmacoepidemiology. Pharmacoepidemiol Drug Saf 29: , 864–872. |
[15] | Racette BA , Gross A , Vouri SM , Camacho-Soto A , Willis AW , Searles Nielsen S ((2018) ) Immunosuppressants and risk of Parkinson disease.. Ann Clin Transl Neurol 5: , 870–875. |
[16] | Witoelar A , Jansen IE , Wang Y , Desikan RS , Gibbs JR , Blauwendraat C , Thompson WK , Hernandez DG , Djurovic S , Schork AJ , Bettella F , Ellinghaus D , Franke A , Lie BA , McEvoy LK , Karlsen TH , Lesage S , Morris HR , Brice A , Wood NW , Heutink P , Hardy J , Singleton AB , Dale AM , Gasser T , Andreassen OA , Sharma M , International Parkinson’s Disease Genomics Consortium (IPDGC), North American Brain Expression Consortium (NABEC) and UKBEC (UKBEC) I ((2017) ) Genome-wide pleiotropy between Parkinson disease and autoimmune diseases. JAMA Neurol 74: , 780–792. |
[17] | Sung Y-F , Liu F-C , Lin C-C , Lee J-T , Yang F-C , Chou Y-C , Lin C-L , Kao C-H , Lo H-Y , Yang T-Y ((2016) ) Reduced Risk of Parkinson disease in patients with rheumatoid arthritis: A nationwide population-based study. Mayo Clin Proc 91: , 1346–1353. |
[18] | Chang C-C , Lin T-M , Chang Y-S , Chen W-S , Sheu J-J , Chen Y-H , Chen J-H ((2018) ) Autoimmune rheumatic diseases and the risk of Parkinson disease: A nationwide population-based cohort study in Taiwan. Ann Med 50: , 83–90. |
[19] | Li X , Sundquist J , Sundquist K ((2012) ) Subsequent risks of Parkinson disease in patients with autoimmune and related disorders: A nationwide epidemiological study from Sweden. Neurodegener Dis 10: , 277–284. |
[20] | Rugbjerg K , Friis S , Ritz B , Schernhammer ES , Korbo L , Olsen JH ((2009) ) Autoimmune disease and risk for Parkinson disease: A population-based case-control study. Neurology 73: , 1462–1468. |
[21] | McKenzie JA , Spielman LJ , Pointer CB , Lowry JR , Bajwa E , Lee CW , Klegeris A ((2017) ) Neuroinflammation as a common mechanism associated with the modifiable risk factors for Alzheimer’s and Parkinson’s diseases. Curr Aging Sci 10: , 158–176. |
[22] | Hernán MA , Takkouche B , Caamaño-Isorna F , Gestal-Otero JJ ((2002) ) A meta-analysis of coffee drinking, cigarette smoking, and the risk of Parkinson’s disease. Ann Neurol 52: , 276–84. |
[23] | Checkoway H , Powers K , Smith-Weller T , Franklin GM , Longstreth WT , Swanson PD ((2002) ) Parkinson’s disease risks associated with cigarette smoking, alcohol consumption, and caffeine intake. Am J Epidemiol 155: , 732–8. |
[24] | Ascherio A , Schwarzschild MA ((2016) ) The epidemiology of Parkinson’s disease: Risk factors and prevention. Lancet Neurol 15: , 1257–1272. |
[25] | Sugiyama D , Nishimura K , Tamaki K , Tsuji G , Nakazawa T , Morinobu A , Kumagai S ((2010) ) Impact of smoking as a risk factor for developing rheumatoid arthritis: A meta-analysis of observational studies. Ann Rheum Dis 69: , 70–81. |
[26] | Hoovestol RA , Mikuls TR ((2011) ) Environmental exposures and rheumatoid arthritis risk.. Curr Rheumatol Rep 13: , 431–9. |
[27] | Liu X , Tedeschi SK , Barbhaiya M , Leatherwood CL , Speyer CB , Lu B , Costenbader KH , Karlson EW , Sparks JA ((2019) ) Impact and timing of smoking cessation on reducing risk of rheumatoid arthritis among women in the nurses’ health studies. Arthritis Care Res (Hoboken) 71: , 914–924. |
[28] | Ascherio A , Zhang SM , Hernán MA , Kawachi I , Colditz GA , Speizer FE , Willett WC ((2001) ) Prospective study of caffeine consumption and risk of Parkinson’s disease in men and women. Ann Neurol 50: , 56–63. |
[29] | Hewlett P , Smith A ((2006) ) Correlates of daily caffeine consumption. Appetite 46: , 97–99. |
[30] | Neovius M , Simard JF , Askling J ((2011) ) Nationwide prevalence of rheumatoid arthritis and penetration of disease-modifying drugs in Sweden. Ann Rheum Dis 70: , 624–629. |
[31] | Hirsch EC , Standaert DG ((2021) ) Ten unsolved questions about neuroinflammation in Parkinson’s disease. Mov Disord 36: , 16–24. |
[32] | Qin H , Buckley JA , Li X , Liu Y , Fox TH , Meares GP , Yu H , Yan Z , Harms AS , Li Y , Standaert DG , Benveniste EN ((2016) ) Inhibition of the JAK/STAT pathway protects against α-synuclein-induced neuroinflammation and dopaminergic neurodegeneration. J Neurosci 36: , 5144–5159. |
[33] | Fardell C , Torén K , Schiöler L , Nissbrandt H , Åberg M ((2020) ) High IQ in early adulthood is associated with Parkinson’s disease. J Parkinsons Dis 10: , 1649–1656. |
[34] | Feldman AL , Johansson ALV , Gatz M , Flensburg M , Petzinger GM , Widner H , Lew MF , Pedersen NL , Wirdefeldt K ((2012) ) Accuracy and sensitivity of Parkinsonian disorder diagnoses in two Swedish National Health Registers. Neuroepidemiology 38: , 186–193. |
[35] | San Luciano M , Tanner CM , Meng C , Marras C , Goldman SM , Lang AE , Tolosa E , Schüle B , Langston JW , Brice A , Corvol J , Goldwurm S , Klein C , Brockman S , Berg D , Brockmann K , Ferreira JJ , Tazir M , Mellick GD , Sue CM , Hasegawa K , Tan EK , Bressman S , Saunders-Pullman R , Saunders-Pullman R , Raymond D , Deik A , Barrett MJ , Cabassa J , Groves M , Hunt AL , Lubarr N , Miravite J , Palmese C , Sachdev R , Sarva H , Severt L , Shanker V , Swan MC , Soto-Valencia J , Johannes B , Ortega R , Ozelius L , Bressman S , Alcalay RN , Tang M , Santana HM , Roos E , Orbe-Reilly M , Fahn S , Cote L , Waters C , Mazzoni P , Ford B , Louis E , Levy O , Rosado L , Ruiz D , Dorovski T , Clark L , Marder KS , Corvol J , Cormier F , Bonnet A , Welter M , Mesnage V , Vidailhet M , Roze E , Lacomblez L , Grabli D , Mart i Masso JF , Martinez JR , Mondragon Rezola E , Alustiza AE , Pagola AG , Pont-Sunyer C , Rolan DV , Fernandez-Santiago R , Quintana M , Fernandez M , Maragall L , Hentati F , Farrer M , Duda J , Read M , Middleton L , Gibson R , Trinh J , Sassi S Ben , Zouari M , Rimamouri , Farhat E , Nabli F , Aasly J , Warø BJ , Andersen S , Bertoni J , Carter J , Elmer L , Jimenez NG , Martin W , Pahwa R , Lyons K , Reich S , Rodnitzky R , Ramos CS , Wojcieszek J , Mirelman A , Gurevich T , Shira AB , Weisz MG , Yasinovsky K , Zalis M , Thaler A , Orr-Urtreger A , Giladi N , Mountain J , Mestre T , Visanji N , Ghate T , Singerman J , Al Dakheel A , Connolly BS , Gasser T , Brockmann K , Conley ED , Mullins ME , Northover C , Facheris M , Fiske B , Urkowiz A ((2020) ) Nonsteroidal anti-inflammatory use and LRRK2 Parkinson’s disease penetrance. Mov Disord 35: , 1755–1764. |

