
Variation in Recent Onset Parkinson’s Disease: Implications for Prodromal Detection
Abstract
Background: The detection of prodromal Parkinson’s disease (PD) is desirable to test drugs with neuroprotective potential, but will be affected by known disease variations.
Objective: To assess the prevalence of four key non-motor prodromal PD markers, and evaluate the sensitivity of case detection when non-motor screening tools for prodromal PD are implemented in an early clinical PD cohort.
Methods: Hyposmia (University of Pennsylvania smell identification test ≤15th centile or Sniffin’ Sticks at or ≤10th centile corrected for age and sex), rapid-eye movement sleep behaviour disorder (RBD questionnaire >4), constipation (<1 daily spontaneous bowel motion) and depression (Leeds >6) were recorded in recent onset PD cases, and proposed non-motor screening criteria applied.
Results: In 1,719 PD cases, mean age 68.6 years (SD 8.1), 65.5% male, mean disease duration 1.3 years (SD 0.9), 72.2% were hyposmic, 43.3% had RBD, 22.1% depression, and 21.5% constipation. 11.6% of cases had no key non-motor features, 38.8% one, 32.1% two, 15.5% three, and 2.0% all four. Increasing numbers of non-motor features were associated with younger age (p = 0.019), higher motor scores (p < 0.001), more postural instability gait difficulty (PIGD) (p < 0.001), greater cognitive impairment (p < 0.001) and higher total non-motor burden (p < 0.001). Cases with hyposmia alone were younger (p < 0.001), had less severe cognitive (p = 0.006) and other non-motor features (p < 0.001). All screening criteria selected younger patients (p = 0.001, p < 0.001), three of four greater overall non-motor burden (p = 0.005, p < 0.001), and inclusion of RBD more cognitive impairment (p = 0.003, p = 0.001) and PIGD (p = 0.004, p = 0.001).
Conclusions: Varying sensitivity levels, and age and phenotype selectivity, are found when different non-motor screening methods to detect prodromal PD are applied to an early clinical PD cohort.
INTRODUCTION
Several non-motor features of Parkinson’s disease (PD) precede the initial motor features and therefore the diagnosis of PD, often by several years [1]. These include olfactory dysfunction, rapid eye movement sleep behaviour disorder (RBD), constipation and depression. Such early non-motor manifestations likely reflect extra-nigral pathology in the olfactory bulb, lower brainstem nuclei and enteric nerves, which precedes the characteristic dopaminergic degeneration of the substantia nigra [2]. In the absence of tissue or directed imaging biomarkers to identify patients in this pre-diagnostic or pre-motor phase, attention has increasingly focused on screening for these non-motor features, recognising their potential significance in identifying and defining individuals ‘at risk’, in whom putative neuroprotective agents might be tested [3–8].
Individual non-motor features are common in the general population, with around a 20–40% prevalence for each of the following: anosmia, constipation and depression, but only a minority of subjects with these features will eventually develop PD [9]. RBD affects less that 1% of the general population compared to 15–46% of adults with PD, giving it much higher specificity [10], but is limited by a prolonged latency period prior to conversion [11]. Since multiple concurrent non-motor features are more prevalent in those with PD than in healthy controls [12–14], combining non-motor features may improve screening specificity [4, 6, 15, 16]. Additional proposed enrichment approaches include selecting those with a family history of PD [4] and targeting an older age group [7], with refinement by secondary screening with transcranial sonography [3] or dopamine transporter imaging [17].
However, while increasing the number of non-motor features will undoubtedly improve specificity, the sensitivity of existing non-motor screening methods to the presence of PD has not yet been established. Testing the presence of non-motor markers in PD cases after the motor diagnosis was reached would help to clarify this issue.
Selectivity for disease subtype could also result from particular screening approaches. There is increasing recognition of disease heterogeneity in PD, involving the presence and rate of progression of motor and non-motor features. RBD is associated with PIGD (postural instability gait difficulty), increased autonomic dysfunction and higher risk of cognitive impairment and dementia [9]. Depression is associated with poorer quality of life in PD [18], PIGD and more rapid disease progression [19] and constipation may reflect greater autonomic involvement, at least of the enteric nervous system [20]. If the utilisation of key non-motor features to detect PD introduced a selectivity bias for PD subtype, this would have implications for prognosis [21], and therefore the design and interpretation of the proposed treatment studies in pre-motor ‘at risk’ subjects.
To address these issues we examined an early clinical PD cohort for the prevalence and clinical correlates of four key non-motor features known to increase the risk of PD when present in asymptomatic individuals. We then stratified the cohort according to the fulfilment of several screening methods [3–6], to rank the sensitivity of the proposed screening methods, and to assess their selectivity for disease severity and classification.
METHODS
Study cohort
Study participants were enrolled in the recent onset (diagnosed within the last 3.5 years) arm of the Tracking Parkinson’s study, a prospective multi-centre study (n = 72 sites) in the United Kingdom. The full study protocol including inclusion/exclusion criteria and definitions has been outlined in detail [22]. In brief, cases with a clinical diagnosis of PD were recruited, fulfilling Queen Square Brain Bank criteria, and supported by structural and functional presynaptic dopaminergic neuroimaging performed on clinical grounds. Cases diagnosed with vascular, drug induced and atypical parkinsonism (multiple system atrophy, progressive supranuclear palsy and corticobasal degeneration) were excluded. Cases with normal functional imaging performed after study entry were excluded from analysis, as well as cases with a revised diagnosis or emerging clinical features which reduced diagnostic certainty. The study was undertaken with written consent, with the approval of the multi-centre regional ethics committee, and in compliance with national legislation and the Declaration of Helsinki.
Measurement instruments
Olfaction was assessed using either the British version of the 40-item University of Pennsylvania smell identification test score (UPSIT) test (Sensonics Inc, Haddon Heights, NJ, US), or the 16-item Sniffin’ Sticks test (Burghart Messtechnik, Wedel, Germany). Hyposmia was defined as Sniffin’ Stick score at or below the 10th centile [23] or UPSIT scores at or below the 15th centile, corrected for age and sex [24]. RBD was assessed using the RBD screening questionnaire (RBDSQ), and a cut-off score of greater than 4 applied [25]. Depression was scored if cases had a Leeds/Hospital Anxiety and Depression Scale score >6. Information on a previous diagnosis of depression, as indicated in the Mini Environmental Risk Questionnaire for Parkinson’s disease baseline (MERQ-PD-B), was also collected. Constipation was defined as less than one daily spontaneous bowel motion [26].
Motor function was scored according to Part 3 of the Movement Disorder Society unified PD rating scale (UPDRS 3), indicating whether cases were in an ‘on’ or ‘off’ state. Motor subtypes were defined as tremor dominant, postural instability and gait disorder, or indeterminate, according to UPDRS 3, using a predetermined formula [27]. Cognition was assessed by the Montreal cognitive assessment (MoCA), scored out of 30, and categorised using diagnostic cut-offs as normal cognition (24–30), mild cognitive impairment (22–23) or dementia (<22) [28, 29]. The 30 item non-motor symptom scale (NMSS), which combines severity and frequency of symptoms, was used following the established categories of mild (1–20), moderate (21–40), severe (41–70) and very severe (>70) [30]. Levodopa equivalent daily dose (LEDD) dose was calculated using established formulas [31]. Smoking status was measured using the MERQ-PD-B and categorised as never (no regular period of smoking, defined as 1 cigarette per day over 6 months), current, previous or passive (defined as living with a smoker, not mutually exclusive of own smoking status).
Screening methods
Screening criteria from four recent studies [3–6] of prodromal PD were included. We selected these studies as representative of differing non-motor screening approaches. Comparisons enabled the evaluation of whether different screening criteria were differentially sensitive in the detection of the various subgroups of PD patients.
1. Hyposmia and/or family history [3]
Age 50 years and older, hyposmia, and/or a positive history family for PD were the primary criteria, which identified 468 (34.6%) ‘at risk’ subjects from an original cohort of 1352 without PD, of whom 8 (1.7% of those identified from primary screening) developed PD during a median follow-up of 35.2 months.
2. Hyposmia (subset with family history of PD) [4]
Subjects without evidence of PD over 50 years old, of whom approximately 50% had a first degree relative with PD, underwent olfactory assessment. The second stage of screening, by dopamine transporter imaging, found that the 669 cases with hyposmia (13.4% of their 4, 999 subjects) were more likely to have dopamine transporter (DAT) deficits (11% of 203 assessed hyposmics, versus 1% of 100 normosmics) [17].
3. Hyposmia and/or RBD and/or depression [6]
Depression, RBD and hyposmia were used to screen 698 subjects without PD, aged 50–80 years. 25 cases (3.6%) had all 3 features. The greater the number of these 3 features that were present in an individual patient, the higher the proportion with additional features (from a set of 8 motor, and 15 additional non-motor features which occur in PD).
4. RBD and olfactory dysfunction [5]
Olfactory dysfunction had a diagnostic accuracy of 82.4% for Lewy body disease, in patients with polysomnography-confirmed idiopathic RBD at an average duration of 2.4 years. The relative risk of Lewy body disease in the lowest tertile of olfactory dysfunction was 7.3 (confidence interval 1.8–29.6) compared with the top two tertiles.
We tested these four screening algorithms, in our cohort of recent onset clinical PD, to determine the sensitivity of each method. Accordingly, only cases aged 50 years and older were included in our analysis, since three of the four screening studies included subjects by this age definition, while the fourth included only 34 patients [5]. When assessing the screening algorithm requiring hyposmia and/or RBD and/or depression [6], depression was scored if individuals had a Leeds score >6 or a self reported history of depression (MERQ-PD), rather than a Leeds score >6 alone, in order to more closely match the definition of depression utilised in that study. A supplementary analysis was also performed using additional variables, identified from a meta-analysis, which double the PD risk (family history, never smokers and constipation) [1].
Statistical analysis
Cases with a revised diagnosis or emerging clinical features suggesting an alternative diagnosis, at their latest follow up visit (average 3.5 years) were excluded. General linear modelling was used to assess variables across non-motor categories, adjusting for multiple covariates (age, sex and disease duration) with heterogeneity p-values calculated when the number of categories was more than two. In the case of motor subtype analyses multinomial logistic regression was used with the Tremor Dominant category as the baseline. For the categorised MoCA analyses ordered logistic regression was used. For age, disease duration, UPDRS 3 and NMSS total, linear regression was used, while for analyses of sex and whether dopamine imaging was performed, logistic regression was used. The main analysis was performed using a complete case approach. An additional sensitivity analysis was performed imputing missing outcome and exposure data. Where sum scores of scales were used in analysis we first calculated expected scores when at least 80% of the questions in these scales were answered. Any remaining missing data was imputed using the chained equation approach to multiple imputation creating 10 imputed datasets. Adjusted p values <0.05 were considered significant. IBM SPSS Statistics for Windows, Version 22.0, Armonk, NY and STATA version 13 was used for statistical analysis.
RESULTS
Out of 2,006 cases recruited to the study, and followed to a mean of 3.5 years (SD 1.2) from diagnosis, 287 cases were excluded due to a revised diagnosis (n = 22), disease duration greater than 3.5 years (n = 6), age less than 50 (n = 91), missing age (n = 1), or with one or more features atypical for PD (n = 167) (Fig. 1). There were thus 1,719 recent onset cases available for analysis, whose demographic, motor and non-motor characteristics are shown in Table 1. Of the four non-motor features of interest, hyposmia was present in 72.2%, RBD in 43.3%, depression in 22.1%, and constipation in 21.5% of cases. Restricted to 1324 cases with complete data on all four non-motor features, 11.6% of cases had none of the four features; increasing the required number of non-motor features identified smaller numbers of cases, from one non-motor symptom in 38.8% of cases, through to four non-motor symptoms in 2.0% of cases (Table 2). The proportion of cases with individual and combination features highlighted wide variations in patterns of non-motor involvement (Fig. 2).
Increasing non-motor burden was associated with a higher UPDRS motor score (p < 0.001) including more PIGD (p < 0.001), a higher total NMSS score (p < 0.001) and a greater proportion with MCI and dementia (p < 0.001) (Table 2). Cases with multiple non-motor features were also significantly younger (p = 0.019), than those without these features.
Considering the 38.8% of cases with only one non-motor feature, there were significant differences in age (p < 0.001), cognition (p = 0.006), and total NMSS (p < 0.001), according to which non-motor feature was present (Table 3). Patients with isolated depression were most impaired, with the greatest cognitive and non-motor severity, compared to patients with other isolated non-motor features. Those with isolated hyposmia were youngest, with the least cognitive impairment and overall non-motor burden, compared to patients with other isolated non-motor features (Table 3).
The proportion of recent onset patients identified using the four proposed screening criteria are detailed in Table 4. One or more of hyposmia, RBD or depression identified the largest proportion (90.6%) of the cohort [6]. There were significant differences in the clinical characteristics identified by the different screening algorithms (Table 4). All the screening algorithms identified younger cases (p = 0.001, p < 0.001), three [3, 5, 6] of four methods greater total non-motor burden (p = 0.005, p < 0.001), while two of the four methods [5, 6] preferentially selected for the PIGD subtype (p = 0.004, p = 0.001) and greater cognitive impairment (p = 0.003, p = 0.001). Hyposmia and/or depression and/or RBD [6] additionally identified greater motor impairment (p = 0.003). Hyposmia and RBD [5] also identified males (p < 0.001), those with a longer disease duration (p = 0.007), and a greater proportion with the indeterminate subtype (p = 0.002). Using factors which were shown to double PD risk [1], identified 55.4% of our cohort, and when key non-motor features were added to these variables, the rate increased to a maximum of 94.5% (Supplementary Table 1).
After calculating expected scores for those who answered 80% or more of the questions, missing data on PD outcomes ranged from only 1.2% (UPDRS 3 and MoCA) to 3.8% (motor subtype). For our four non-motor features, missing data ranged from 2.5% (RBD) to 12.4% (hyposmia). In order to address this further, we repeated our analysis, undertaking missing data imputation (Supplementary Tables 2–4). The p-values of the complete case analysis and analysis using data imputation were very similar, with only one difference in statistical significance (indeterminate phenotype Table 2 versus Supplementary Table 2).
DISCUSSION
Our study is, to our knowledge, the first to analyse proposed non-motor screening methods for prodromal PD in an early clinical PD cohort as a ‘best case scenario’ for the utility of these screening methods, and has two main findings.
First, we found that non-motor screening algorithms aiming for high specificity by combining non-motor features had variable sensitivity in detecting those with early clinical PD. 11.6% of PD cases, diagnosed on average 1.2 years earlier, had none of the four key non-motor features, with 38.8% having only one such non-motor feature. In turn, the proposed non-motor screening methods detected between 31.9% and 90.6% with early clinical PD. Second, we found evidence that both the number and type of non-motor feature included in screening methods may introduce selectivity for particular clinical characteristics.
Incremental increases in disease severity were seen as the number of key non-motor features increased from none to four. Cases with three or more non-motor features were significantly younger, more likely to have PIGD, and had more severe Parkinson’s, both from the motor and non-motor viewpoint. Also, they were more likely to have dementia. All of these differences remained after correcting for confounding variables. These findings are consistent with several other studies, encompassing recent onset PD cases, and screening paradigms in ‘at risk’ cases. In two studies in newly diagnosed PD, a worsening motor score was found with increasing numbers of non-motor features [13, 32]. Others have also noted the association between increasing non-motor features and PIGD [13, 33]. In the TREND screening study, one or more of the three non-motor screening features correlated with a broader range of non-motor features, and with prodromal motor symptoms [6]. A similar correlation was present when hyposmia and RBD were analysed against other non-motor and potential motor disease markers, in the PREDICT-PD study [7]. However, such associations are not universal: in the ONSET-PD study, 60% of patients had few, minimally disabling non-motor symptoms, and they did not differ from the remaining 40% with a high non-motor burden, in terms of either motor severity, or motor phenotype [14]. However, the overall balance of evidence favours concurrence of selected non-motor features with other non-motor features, greater motor severity and PIGD.
In addition to the number of key non-motor features included in screening algorithms, the type of non-motor feature selected for inclusion may also affect the clinical characteristics of cases identified. ‘Hyposmia only’ cases had milder overall non-motor burden than cases with only one of the other key non-motor features. This matches the TREND results, in which hyposmic subjects had a lower number of additional prodromal PD features (including other non-motor, motor and neuropsychiatric features) compared to those with depression and RBD [3]. The low non-motor severity is also in keeping with the PARS study in which a very small proportion of hyposmic cases had multiple non-motor features [4]. Depression, in contrast, emerged as a marker for a particularly severe overall non-motor burden, consistent with previous observations [14]. Strikingly, only 52.4% of those with depression were cognitively normal, in contrast to 82.1% of those with hyposmia alone, again consistent with previous findings [34], but which may in part be explained by “pseudodementia” due to lack of motivation to engage in cognitive tests [35].
Overall, the unifying feature across screening methods using these key non-motor features was their selectivity for younger patients, and when RBD was included, the PIGD subtype and greater cognitive impairment. The sensitivity and selectivity levels for particular disease characteristics need to be taken into account when considering the application of screening methods and the generalisability of observational or therapeutic studies that have used these methods. However, there appears to be scope for improving sensitivity by adding additional screening variables. For example, additional PD risk variables emerging from meta-analysis (family history of tremor, and/or never smoking, and/or constipation) as doubling the risk of future PD [1] appeared sensitive, identifying 55.4% of our cohort before any of the remaining key non-motor features were added. Adding those non-motor features increased sensitivity to 94.5%. The NMSS may be worthy of exploration given the relationship we found between the four key non-motor features and the total NMSS score, and the relatively high cost of olfaction testing compared to a questionnaire. Phenotypic selectivity could be addressed by inclusion of risk markers. Genetic variation for example may in part determine clinical heterogeneity in PD [36]. However, genetic risk classification showed only incremental effects on classification accuracy beyond the clinical variables, while constipation and smoking were not found to be additive in a diagnostic model comparing PD and controls [37]. More recently, probability methodology for prodromal PD has been developed [26], encompassing a spectrum of predictive markers including both background risk (genetic and environmental) and diagnostic marker testing (including non-motor features) expressed as likelihood ratios.
It is important that our findings are representative of the non-motor profile in an early PD population. The rank order with each non-motor feature was comparable to another recent onset cohort using similar methods [38]. As in other cohort studies, hyposmia was the most prevalent of the non-motor features [13, 14, 38] and accounted for over half of those with only one non-motor feature. The rate of other non-motor features was also similar to other cohort studies, but with some variation; depression was more common in one study [39], and RBD less common in another [14]. Some variation between studies is expected given the heterogeneity and different sensitivity of measurement techniques, as well as varying disease durations, and would likely influence the exact proportions with none, one or combinations of non-motor features found in other studies, but overall the similarities across studies appear to be sufficient.
Potential limitations of the study relate to the presence and persistence of non-motor features. Improvement in non-motor features by antiparkinsonian drug therapy may have reduced the sensitivity of the screening methods in our cohort, given that only 9.7% of our PD cases were drug naïve. However, no differences in the severity of non-motor features were found in treated versus untreated early (<5 years) PD patients in another study [32], which concluded that non-motor features were influenced more by the underlying disease process than dopaminergic replacement. The second aspect is the assumption that the key non-motor symptoms are persistent, which is almost certainly true for hyposmia, but less accurate for depression and RBD which are known to fluctuate. Furthermore given that our cohort all manifested motor PD, we cannot be sure that those people screening positive for these non-motor symptoms exhibited them before the onset of their motor disorder; i.e. they could be used to predict the onset of motor PD in these individuals. Another consideration relates to diagnostic accuracy, and whether a higher proportion of our cases with few non-motor features could have an alternative diagnosis than PD, often referred to as subjects without evidence of dopaminergic deficit (SWEDD). However, we found no difference in the proportion of patients who had confirmatory presynaptic dopaminergic imaging according to the number of the four key non-motor features that were present. In addition, there was no evidence of a lower rate of non-motor features in SWEDD cases in another recent cohort study [40]. While we excluded cases with revised diagnoses, or emerging features suggesting an alternative diagnosis, in keeping with all population studies we cannot exclude the possibility that a small proportion of cases may have atypical parkinsonian disorders.
In conclusion, screening methods based largely on non-motor features show varying levels of sensitivity even in early PD, and are generally selective for younger patients and those with a PIGD motor phenotype. Awareness of these factors is important as we work further to enhance screening methodologies.
CONFLICT OF INTEREST
DMA Swallow, MA Lawton, KA Grosset, N Malek, CR Smith, Y Ben-Shlomo, N Williams, NW Wood: No conflicts of interest
N Bajaj has received payment for advisory board attendance from UCB, Teva Lundbeck, Britannia, GSK, Boehringer, and honoraria from UCB Pharma, GE Healthcare, Lily Pharma, Medtronic. He has received research grant support from GE Healthcare, Wellcome Trust, MRC and Parkinson’s UK and royalties from Wiley.
RA Barker has received grants from Parkinson’s UK, NIHR, Cure Parkinson’s Trust, Evelyn Trust, Rosetrees Trust, MRC and EU along with payment for advisory board attendance from Oxford Biomedica and LCT, and honoraria from Wiley and Springer.
DJ Burn has received grants from NIHR, Wellcome Trust, GlaxoSmithKline Ltd, Parkinson’s UK, and Michael J Fox Foundation. He has acted as consultant for GSK.
T Foltynie has received payment for advisory board meetings for Abbvie and Oxford Biomedica, and honoraria for presentations at meetings sponsored by Medtronic, St Jude Medical, Britannia and Teva pharmaceuticals.
J Hardy has received honoraria from Eisai, and grant support from MRC/Wellcome, Parkinson’s UK, and the Michael J Fox Foundation.
HR Morris has received grants from Medical Research Council UK, Wellcome Trust, Parkinson’s UK, Ipsen Fund, Motor Neurone Disease Association, Welsh Assembly Government, PSP Association, CBD Solutions and Drake Foundation, and payment for advisory board attendance and lectures from Teva, AbbVie, Boehringer Ingelheim, and GSK.
DG Grosset has received payment for advisory board attendance from AbbVie, and honoraria from UCB Pharma, GE Healthcare, and Civitas Inc.
AUTHORS’ ROLES
DMAS: Data analysis, manuscript writing and editing; MAL: Data analysis, manuscript editing; KAG, DGG: Study design, data collection and analysis, manuscript writing and editing; NM: Data collection, manuscript editing; CRS: Data analysis; NPB, RAB, DJB, TF: Study design, data collection and manuscript editing; YBS, JH: Study design, manuscript editing; HRM: Study design, data collection; NW, NWW: Study design.
ACKNOWLEDGMENTS
The research was funded by Parkinson’s UK and supported by the National Institute for Health Research (NIHR) DeNDRoN network, the NIHR Newcastle Biomedical Research Unit based at Newcastle upon Tyne Hospitals NHS Foundation Trust and Newcastle University, and the NIHR funded Biomedical Research Centre in Cambridge.
The study group was (principal investigators): Grosset D, Bajaj N, Sugathapala L, Burn D, Graham A, Bathgate D, Bland R, Worth P, Mamutse G, Amar K, Walker R, Raw J, Carroll C, Clarke CE, Hemsley Z, Fackrell R, Roberts H, Guptha S, Nath U, Barker R, Counsell C, Sheridan R, Silverdale M, Sharma J, Piccini P, Hindle J, Arianayagam S, Ellis S, Ward T, Lennox G, Carson M, Sveinbjornsdottir S, Boothman B, Paviour D, Misbahuddin A, Schrag A, Athey R, Sarda P, Steiger M, Dhakam Z, Kock N, Molloy S, O’Neill M, Stern J, Capps E, Critchley P, Foltynie T, George J, Bandmann O, Harper G, Andrews T, Woodward W, Whone A, Borland C, Wilson M, Adenwala Y, Tidswell P, Chaudhuri R, Watt A, Church A, Morris H, Hu M, Kamath S, Adler B, Barber S, De Pablo-Fernandez E, Sophia R; and (research nurses and healthcare professionals): Agarwal V, Alderton L, Amor K, Andrew A, Arif S, Bennett J, Birchall K, Birt J, Blachford K, Brooke J, Brown A, Brown P, Brugaletta C, Bryden N, Burrows M, Butler S, Cable S, Callaghan R, Canovas L, Carey G, Cattarall L, Clipsham K, Colwell W, Cowen Z, Cox C, Craw S, Creaser-Smith A, Croucher Y, Daniel S, De Pietro A, Dellafera D, Dodds S, Donaldson A, Donaldson D, Dougherty A, Downes C, Dube S, Dwornik W, Edwards C, Ekins E, Fernandes R, Foale C, Forbes H, Ford S, Frost J, Fuller T, Gallagher L, Gentle R, Gethin L, Gilford J, Gray C, Gunter E, Hall S, Hamilton C, Hare M, Henderson A, Hetherington V, Higgins R, Higham A, Hill L, Hodgson K, Humphries R, Hurlstone S, Hursey A, Inniss R, James R, Johnson E, Joyce R, Kefalopoulou Z, Kelly M, Korley M, Lehn A, Levy S, Lithgo K, Long C, Lyle A, Lynn H, MacKinnon L, Makahamadze C, Mahan T, Marks N, Marrinan S, Marshall M, Martin-Forbes P, Massey I, McBrearty C, McEntee J, McNichol A, Mills D, Morgan S, Mullan D, Murphy T, Newman J, O’Connell H, O’Donnell A, O’Donnell D, O’Reilly C, Olanrewaju O, Oughton E, Owen C, Painter S, Palfreeman S, Paterson P, Perkins L, Pilcher A, Powell K, Price C, Rachman P, Renton L, Rickett J, Rizos A, Roberts T, Roche M, Roopun R, Roussakis A, Rowland R, Saunders G, Sequeira C, Shields S, Simmons D, Snape C, Stickley J, Strong L, Sunderland C, Sutherland S, Temple N, Thomson E, Trimmer M, Tuazon J, Tyrrell E, Visentin E, Vandor C, Vernon N, Verstraelen N, Visick M, Walsh H, Walsh S, Ward K, Watson A, Watt A, Whelan E, Williams J, Williams M, Williams S, Wilson B, Witherington K, Woodcock R, Wyatt L.
Appendices
The supplementary table and figure are available in the electronic version of this article: http://dx.doi.org/10.3233/JPD-150741.
REFERENCES
[1] | Noyce AJ , Bestwick JP , Silveira-Moriyama L , Hawkes CH , Giovannoni G , Lees AJ , & Schrag A ((2012) ) Meta-analysis of early nonmotor features and risk factors for Parkinson disease. Ann Neurol, 72: , 893–901. |
[2] | Braak H , Del Tredici K , Rüb U , de Vos RA , Jansen Steur EN , & Braak E ((2003) ) Staging of brain pathology related to sporadic Parkinson’s disease. Neurobiol Aging, 24: , 197–211. |
[3] | Berg D , Godau J , Seppi K , Behnke S , Liepelt-Scarfone I , Lerche S , Stockner H , Gaenslen A , Mahlknecht P , Huber H , Srulijes K , Klenk J , Fassbender K , Maetzler W , Poewe W , & PRIPS study group ((2013) ) The PRIPS study: Screening battery for subjects at risk of Parkinson’s disease. Eur J Neurol, 20: , 102–108. |
[4] | Siderowf A , Jennings D , Eberly S , Oakes D , Hawkins KA , Ascherio A , Stern MB , Marek K , & PARS Investigators ((2012) ) Impaired olfaction and other prodromal features in the Parkinson At-Risk Syndrome Study. Mov Disord, 27: , 406–412. |
[5] | Mahlknecht P , Iranzo A , Högl B , Frauscher B , Müller C , Santamaría J , Tolosa E , Serradell M , Mitterling T , Gschliesser V , Goebel G , Brugger F , Scherfler C , Poewe W , Seppi K , & Sleep Innsbruck Barcelona Group ((2015) ) Olfactory dysfunction predicts early transition to a Lewy body disease in idiopathic RBD. Neurology, 84: , 654–658. |
[6] | Gaenslen A , Wurster I , Brockmann K , Huber H , Godau J , Faust B , Lerche S , Eschweiler GW , Maetzler W , & Berg D ((2014) ) Prodromal features for Parkinson’s disease – baseline data from the TREND study. Eur J Neurol, 21: , 766–772. |
[7] | Noyce AJ , Bestwick JP , Silveira-Moriyama , Hawkes CH , Knowles CH , Hardy J , Giovannoni G , Nageshwaran S , Osborne C , Lees AJ , & Schrag A ((2014) ) PREDICT-PD: Identifying risk of Parkinson’s disease in the community: Methods and baseline results. J Neurol Neurosurg Psychiatry, 85: , 31–37. |
[8] | Liu R , Umbach DM , Peddada SD , Xu Z , Tröster AI , Huang X , & Chen H ((2015) ) Potential sex differences in nonmotor symptoms in early drug-naive Parkinson disease. Neurology, 84: , 2107–2115. |
[9] | Postuma RB , Aarsland D , Barone P , Burn DJ , Hawkes CH , Oertel W , & Ziemssen T ((2012) ) Identifying prodromal Parkinson’s disease: Pre-motor disorders in Parkinson’s disease. Mov Disord, 27: , 617–626. |
[10] | Iranzo A , Santamaria J , & Tolosa E ((2009) ) The clinical and pathophysiological relevance of REM sleep behavior disorder in neurodegenerative disease. Sleep Med Rev, 13: , 385–401. |
[11] | Burn DJ , & Anderson K ((2012) ) To sleep, perchance to dement: RBD and cognitive decline in Parkinson’s disease. Mov Disord, 27: , 671–673. |
[12] | Chen H , Zhao EJ , Zhang W , Lu Y , Liu R , Huang X , Ciesielski-Jones AJ , Justice MA , Cousins DS , & Peddada S ((2015) ) Meta-analyses on prevalence of selected Parkinson’s nonmotor symptoms before and after diagnosis. Transl Neurodegener, 4: , 1. |
[13] | Khoo TK , Yarnall AJ , Duncan GW , Coleman S , O’Brien JT , Brooks DJ , Barker RA , & Burn DJ ((2013) ) The spectrum of nonmotor symptoms in early Parkinson disease. Neurology, 80: , 276–281. |
[14] | Pont-Sunyer C , Hotter A , Gaig C , Seppi K , Compta Y , Katzenschlager R , Mas N , Hofeneder D , Brücke T , Bayés A , Wenzel K , Infante J , Zach H , Pirker W , Posada IJ , Álvarez R , Ispierto L , De Fábregues O , Callén A , Palasí A , Aguilar M , Martí MJ , Valldeoriola F , Salamero M , Poewe W , & Tolosa E ((2015) ) The onset of nonmotor symptoms in Parkinson’s disease (The ONSET PD study). Mov Disord, 30: , 229–237. |
[15] | Berg D , Marek K , Ross GW , & Poewe W ((2012) ) Defining at-risk populations for Parkinson’s disease: Lessons from ongoing studies. Mov Disord, 27: , 656–665. |
[16] | Ross GW , Abbott RD , Petrovich H , Tanner CM , & White LR ((2012) ) Pre-motor features of Parkinson’s disease: The Honolulu-Asia Aging Study experience. Parkinsonism Relat Disord, 18: (Suppl 1), S199–S202. |
[17] | Jennings D , Siderowf A , Stern M , et al , Seibyl J , Eberly S , Oakes D , Marek K , & PARS Investigators ((2014) ) Imaging prodromal Parkinson disease. The Parkinson Associated Risk Syndrome Study. Neurology, 83: , 1739–1746. |
[18] | Brown RG , Landau S , Hindle JV , Playfer J , Samuel M , Wilson KC , Hurt CS , Anderson RJ , Carnell J , Dickinson L , Gibson G , van Schaick R , Sellwood K , Thomas BA , & Burn DJ , Study PROMS-PD, Group ((2011) ) Depression and anxiety related subtypes in Parkinson’s disease. J Neurol Neurosurg Psychiatry, 82: , 803–809. |
[19] | Burn DJ , Landau S , Hindle JV , Samuel M , Wilson KC , Hurt CS , Brown RG , & PROMS-PD Study Group ((2012) ) Parkinson’s disease motor subtypes and mood. Mov Disord, 27: , 379–386. |
[20] | Goldstein DS ((2014) ) Dysautonomia in Parkinson disease. Compr Physiol, 4: , 805–826. |
[21] | Williams-Gray CH , Mason SL , Evans JR , Foltynie T , Brayne C , Robbins TW , & Barker RA ((2013) ) The CamPaIGN study of Parkinson’s disease: 10-year outlook in an incident population-based cohort. J Neurol Neurosurg Psychiatry, 84: , 1258–1264. |
[22] | Malek N , Swallow DMA , Grosset KA , Lawton MA , Marrinan SL , Lehn AC , Bresner C , Bajaj N , Barker RA , Ben-Shlomo Y , Burn DJ , Foltynie T , Hardy J , Morris HR , Williams NM , Wood N , & Grosset DG ((2015) ) Tracking Parkinson’s: Study design and baseline patient data. J Parkinsons Dis, 5: , 947–959. |
[23] | Hummel T , Kobal G , Gudziol H , & Mackay-Sim A ((2007) ) Normative Data for the “Sniffin’ Sticks” including tests of odor identification, odor discrimination, and olfactory thresholds: An upgrade based on a group of more than 3,000 subjects. Eur Arch Otorhinolaryngol, 264: , 237–243. |
[24] | Doty RL ((1995) ) The Smell Identification Test ™ Administration Manual. Sensonics Inc., Haddon Heights: NJ, pp. 1–13. |
[25] | Stiasny-Kolster K , Mayer G , Schäfer S , Moller JC , Heinzel-Gutenbrunner M , & Oertel WH ((2007) ) The REM sleep behavior disorder screening questionnaire –a new diagnostic instrument. Mov Disord, 22: , 2386–2393. |
[26] | Berg D , Postuma RB , Adler CH , Bloem BR , Chan P , Duboiss B , Gasser T , Goetz , Halliday , Joseph L , Lang AE , Liepelt-Scarfone I , Litvan I , Marek K , Obeso J , Oertel W , Olanow CW , Poewe W , Stern M , & Deuschl G ((2015) ) MDS research criteria for prodromal Parkinson’s disease. Mov Disord, 30: , 1600–1609. |
[27] | Stebbins GT , Goetz CG , Burn DJ , Jankovic J , Khoo TK , & Tilley BC ((2013) ) How to identify tremor dominant and postural instability/gait difficulty groups with the movement disorder society unified Parkinson’s disease rating scale: Comparison with the unified Parkinson’s disease rating scale. Mov Disord, 28: , 668–670. |
[28] | Hu MT , Szewczyk-Królikowski K , Tomlinson P , Nithi K , Rolinski M , Murray C , Talbot K , Ebmeier KP , Mackay CE , & Ben-Shlomo Y ((2014) ) Predictors of cognitive impairment in an early stage Parkinson’s disease cohort. Mov Disord, 29: , 351–359. |
[29] | Dalrymple-Alford JC , MacAskill MR , Nakas CT , Livingston L , Graham C , Crucian GP , Melzer TR , Kirwan J , Keenan R , Wells S , Porter RJ , Watts R , & Anderson TJ ((2010) ) The MoCA. Well suited screen for cognitive impairment in Parkinson disease. Neurology, 75: , 1717–1725. |
[30] | Chaudhuri KR , Rojo JM , Schapira AH , Brooks DJ , Stocchi F , Odin P , Antonini A , Brown RJ , & Martinez-Martin P ((2013) ) A proposal for a comprehensive grading of Parkinson’s disease severity combining motor and non-motor assessments: Meeting an unmet need. PLoS One, 8: , e57221. |
[31] | Tomlinson CL , Stowe R , Patek S , Rick C , Gray R , & Clarke CE ((2010) ) Systematic review of levodopa dose equivalency reporting in Parkinson’s disease. Mov Disord, 25: , 2649–2653. |
[32] | Zis P , Martinez-Martin P , Sauerbier A , Rizos A , Sharma JC , Worth PF , Sophia R , Silverdale M , & Chaudhuri KR ((2015) ) Non-motor symptoms burden in treated and untreated early Parkinson’s disease patients: Argument for non-motor subtypes. Eur J Neurol, 22: , 1145–1150. |
[33] | Baig F , Lawton M , Rolinksi M , Ruffmann C , Nithi K , Evetts SG , Fernandes HR , Ben-Shlomo Y , & Hu MT ((2015) ) Delineating nonmotor symptoms in early Parkinson’s disease and first-degree relatives. Mov Disord, 30: , 1759–1766. |
[34] | Rojo A , Aguilar M , Garolera MT , Cubo E , Navas I , & Quintana S ((2003) ) Depression in Parkinson’s disease: Clinical correlates and outcome. Parkinsonism Relat Disord, 10: , 23–28. |
[35] | Roca M , López-Navarro E , Monzón S , Vives M , García-Toro M , García-Campayo J , Harrison J , & Gili M ((2015) ) Cognitive impairment in remitted and non-remitted depressive patients: A follow-up comparison between first and recurrent episodes. Eur Neuropsychopharmacol, 25: , 1991–1998. |
[36] | Petrucci S , Ginevrino M , & Valente EM ((2016) ) Phenotypic spectrum of alpha-synuclein mutations: New insights from patients and cellular models. Parkinsonism Relat Disord, 22: (Suppl 1), S16–S20. |
[37] | Nalls MA , McLean CY , Rick J , Eberly S , Hutten SJ , Gwinn K , Sutherland M , Martinez M , Heutink P , Williams NM , Hardy J , Gasser T , Brice A , Price TR , Nicolas A , Keller MF , Molony C , Gibbs JR , Chen-Plotkin A , Suh E , Letson C , Fiandaca MS , Mapstone M , Federoff HJ , Noyce AJ , Morris H , Van Deerlin VM , Weintraub D , Zabetian C , Hernandez DG , Lesage S , Mullins M , Conley ED , Northover CA , Frasier M , Marek K , Day-Williams AG , Stone DJ , Ioannidis JP , Singleton AB , & Parkinson’s Disease Biomarkers Program and Parkinson’s Progression Marker Initiative investigators ((2015) ) Diagnosis of Parkinson’s disease on the basis of clinical and genetic classification: A population based modelling study. Lancet Neurol, 14: , 1002–1009. |
[38] | Szewczyk-Krolikowski K , Tomlinson P , Nithi K , Wade-Martins R , Talbot K , Ben-Shlomo Y , & Hu MT ((2013) ) The influence of age and gender on motor and non-motor features of early Parkinson’s disease: Initial findings from the Oxford Parkinson Disease Center (OPDC) discovery cohort. Parkinsonism Relat Disord, 20: , 99–105. |
[39] | Aarsland D , Brønnick K , Alves G , Tysnes OB , Pedersen KF , Ehrt U , & Larsen JP ((2009) ) The spectrum of neuropsychiatric symptoms inpatients with early untreated Parkinson’s disease. J Neurol Neurosurg Psychiatry, 80: , 928–930. |
[40] | Sprenger FS , Seppi K , Djamshidian A , Reiter E , Nocker M , Mair K , Göbel G , & Poewe W ((2015) ) Non motor symptoms in subjects without evidence of dopaminergic deficits. Mov Disord, 30: , 976–981. |
Figures and Tables
Fig.1
Disposition of cases recruited to the study, and reasons for exclusion, to define the main analysis dataset of 1719 patients.
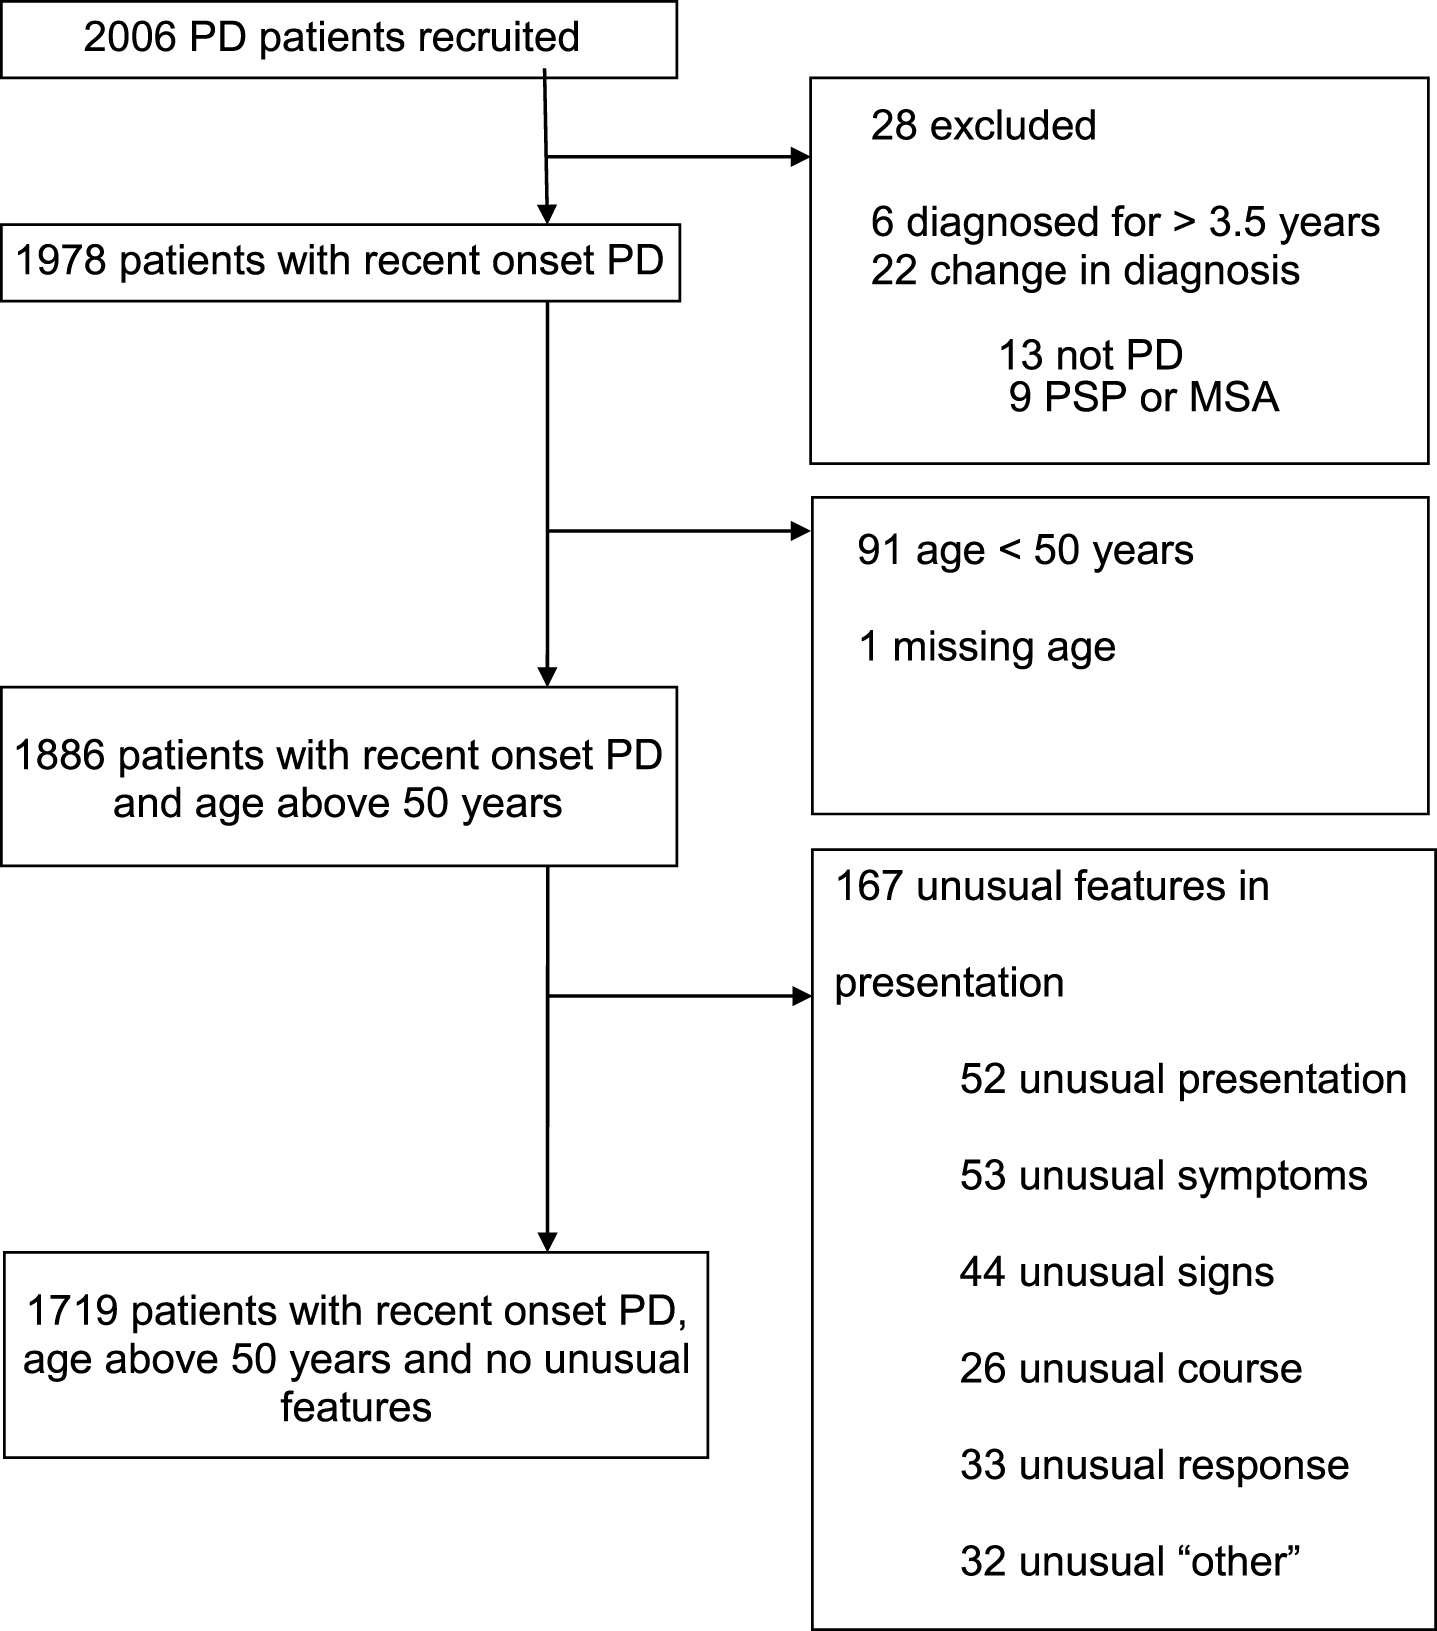
Fig.2
Frequency of individual and combinations of non-motor features in 1324 recent onset Parkinson’s disease cases with data on all four non-motor features
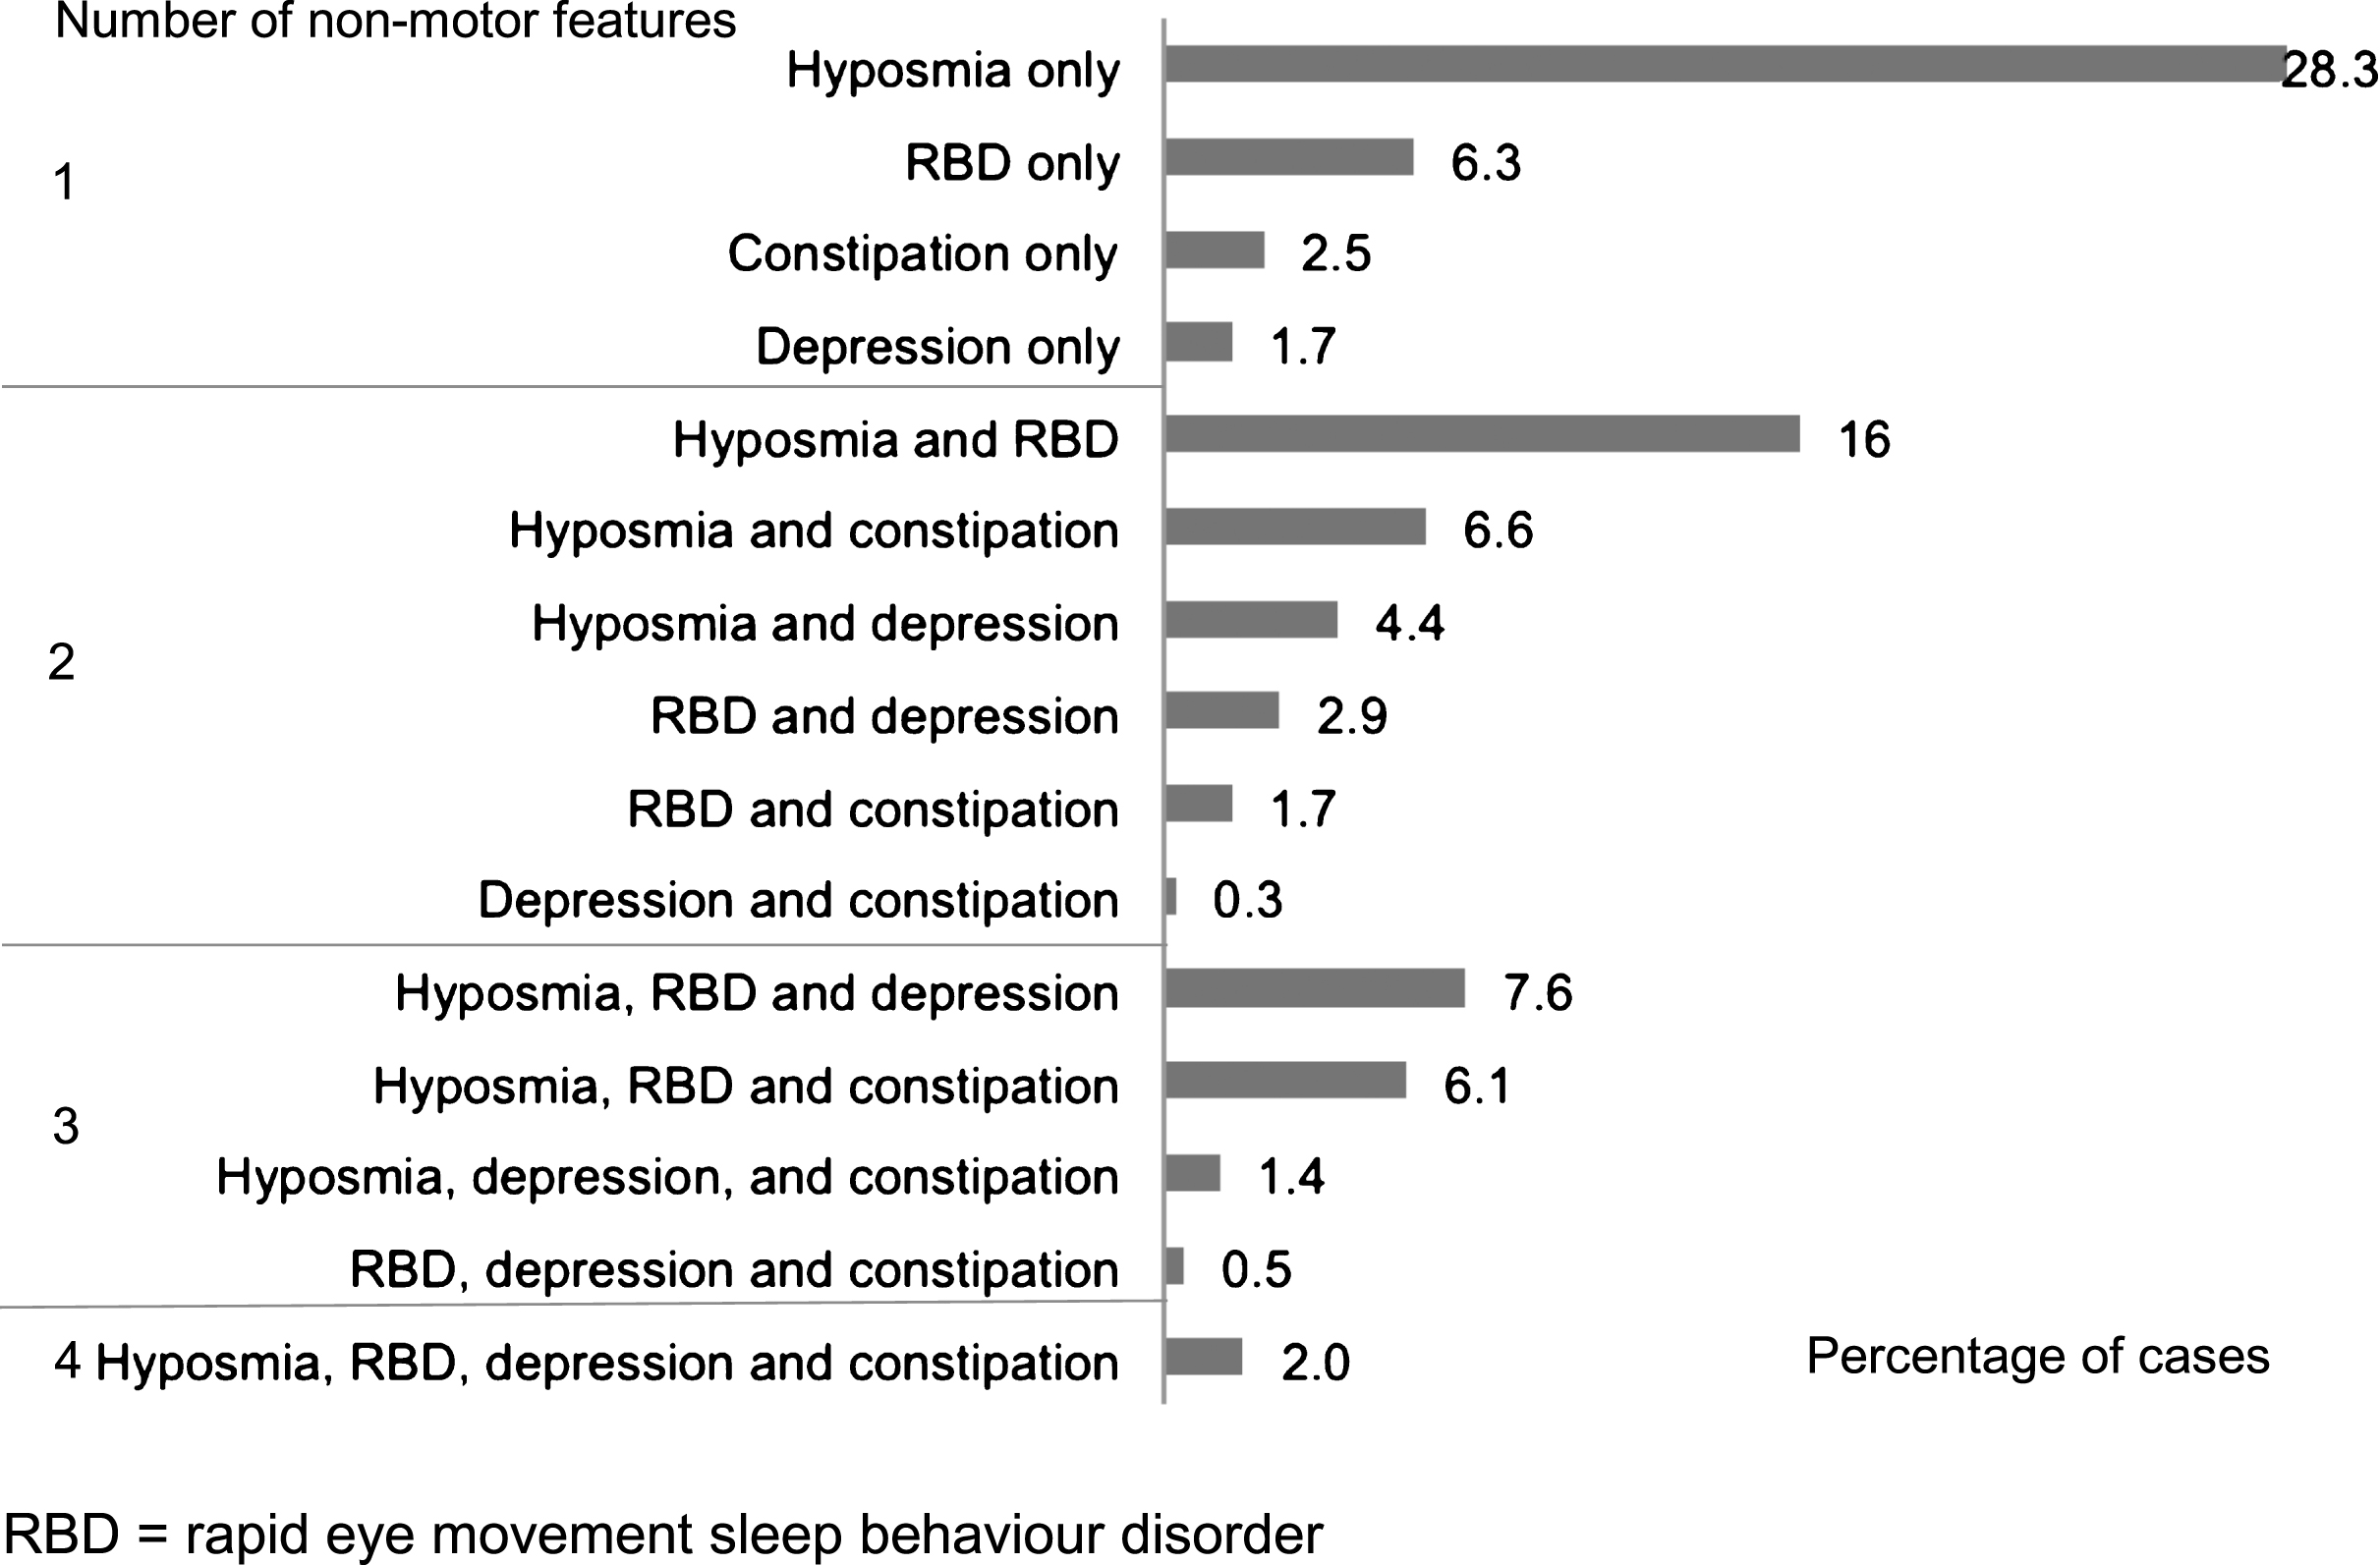
Table 1
Baseline demographic, motor and non-motor characteristics of 1719 recent onset Parkinson’s disease cases
| Characteristic | Result |
| Age in years | 68.6 (8.1) |
| Male sex | 1125 (65.5%) |
| Disease duration in years | 1.3 (0.9) |
| NMSS total | 31.6 (25.4) |
| Non-motor feature | |
| Hyposmia | 1041 (72.2%) |
| RBD | 694 (43.3%) |
| Constipation | 358 (21.5%) |
| Depression | 364 (22.1%) |
| Smoking | |
| Current | 60 (4.0%) |
| Never | 509 (33.8%) |
| Previous | 582 (38.6%) |
| Passive | 356 (23.6%) |
| Family history | |
| One member affected | 264 (15.5%) |
| >1 member affected | 65 (3.8%) |
| UPDRS 3 | 22.7 (12.2) |
| Motor subtype | |
| TD | 740 (47.2%) |
| PIGD | 626 (39.9%) |
| Indeterminate | 201 (12.8%) |
| Hoehn &Yahr stage, median (IQR) | 2 (1-2) |
| MoCA | |
| Normal | 1154 (73.0%) |
| MCI | 195 (12.3%) |
| Dementia | 231 (14.6%) |
| Antiparkinson medication (current) | |
| Drug naïve | 167 (9.7%) |
| Levodopa | 1102 (64.3%) |
| Dopamine agonist | 520 (30.3%) |
| MAOB Inhibitor | 415 (24.2%) |
| LEDD | 294 (206) |
| Dopamine imaging performed | 403 (27.8%) |
Data are mean (standard deviation) or number (percentage) unless otherwise stated. NMSS = non motor symptom scale, RBD = rapid eye movement sleep behaviour disorder, UPDRS 3 = Movement Disorder Society unified Parkinson’s disease rating scale part 3, TD = tremor dominant, PIGD = postural instability gait difficulty, IQR = interquartile range, MoCA = Montreal cognitive assessment, MCI = mild cognitive impairment, MAOB = monoamine oxidase type B, LEDD = levodopa equivalent daily dose.
Table 2
Clinical correlates in 1324 recent onset Parkinson’s disease cases with data on all four non-motor features according to the number of key non-motor features
| Variable | Number of non-motor features | ||||||
| None n = 154 (11.6%) | One n = 513 (38.8%) | Two n = 425 (32.1%) | Three n = 205 (15.5%) | Four n = 27 (2.0%) | Unadjusted p-value | Adjusted p-value | |
| Age | 69.9 (7.6) | 68.4 (8.3) | 67.6 (7.7) | 67.7 (8.0) | 67.1 (7.6) | 0.032 | 0.019a |
| Male Sex | 101 (65.6%) | 322 (62.8%) | 282 (66.4%) | 137 (66.8%) | 20 (74.1%) | 0.60 | 0.55b |
| Disease duration | 1.2 (0.9) | 1.3 (0.9) | 1.4 (0.9) | 1.4 (1.0) | 1.6 (0.9) | 0.23 | 0.16c |
| UPDRS 3 | 19.5 (10.8) | 21.7 (12.1) | 21.5 (11.4) | 25.2 (11.6) | 28.2 (10.0) | <0.001 | <0.001d |
| Motor subtype | |||||||
| TD | 87 (61.3%) | 260 (53.4%) | 179 (44.8%) | 71 (36.4%) | 10 (40.0%) | ||
| PIGD | 41 (28.9%) | 174 (35.7%) | 164 (41.0%) | 98 (50.3%) | 13 (52.0%) | <0.001 | <0.001d |
| Indeterminate | 14 (9.9%) | 53 (10.9%) | 57 (14.3%) | 26 (13.3%) | 2 (8.0%) | 0.050 | 0.036d |
| MoCA | |||||||
| Normal | 109 (78.4%) | 386 (80.4%) | 284 (72.6%) | 135 (69.6%) | 16 (64.0%) | 0.007 | <0.001d |
| MCI | 15 (10.8%) | 46 (9.6%) | 58 (14.8%) | 27 (13.9%) | 3 (12.0%) | ||
| Dementia | 15 (10.8%) | 48 (10.0%) | 49 (12.5%) | 32 (16.5%) | 6 (24.0%) | ||
| NMSS Total | 17.0 (12.1) | 23.9 (18.0) | 33.2 (22.7) | 49.4 (30.9) | 60.6 (33.1) | <0.001 | <0.001d |
| Dopamine imaging performed | 46 (34.6%) | 121 (27.3%) | 108 (30.2%) | 47 (26.7%) | 8 (33.3%) | 0.47 | 0.14d |
Data are mean (standard deviation) or number (percentage). UPDRS 3 = Movement Disorder Society unified Parkinson’s disease rating scale, TD = tremor dominant, PIGD = postural instability gait difficulty, MoCA = Montreal cognitive assessment, MCI = mild cognitive impairment, NMSS = non motor symptom scale. aAdjusted for disease duration and sex, bAdjusted for age and disease duration, cAdjusted for age and sex, dAdjusted for age, sex and disease duration.
Table 3
Clinical correlates in 513 recent onset Parkinson’s disease with complete case data and only one non-motor feature
| Variable | Hyposmia only n = 375 (73.1%) | RBD only n = 83 (16.2%) | Constipation only n = 33 (6.4%) | Depression only n = 22 (4.3%) | Unadjusted p-value | Adjusted p-value |
| Age | 67.3 (7.8) | 70.4 (7.9) | 73.6 (9.3) | 70.1 (10.9) | <0.001 | <0.001a |
| Male Sex | 234 (62.4%) | 51 (61.4%) | 26 (78.8%) | 11 (50.0%) | 0.17 | 0.19b |
| Disease duration | 1.3 (0.9) | 1.4 (0.9) | 1.5 (0.9) | 1.2 (1.0) | 0.42 | 0.54c |
| UPDRS 3 | 20.6 (11.3) | 23.4 (12.7) | 25.1 (15.7) | 27.6 (15.1) | 0.008 | 0.073d |
| Motor subtype | ||||||
| TD | 200 (56.0%) | 37 (48.1%) | 13 (41.9%) | 10 (45.5%) | ||
| PIGD | 116 (32.5%) | 34 (44.2%) | 16 (51.6%) | 8 (36.4%) | 0.11 | 0.32d |
| Indeterminate | 41 (11.5%) | 6 (7.8%) | 2 (6.5%) | 4 (18.2%) | 0.64 | 0.62d |
| MoCA | ||||||
| Normal | 289 (82.1%) | 60 (80.0%) | 26 (81.3%) | 11 (52.4%) | 0.008 | 0.006d |
| MCI | 36 (10.2%) | 3 (4.0%) | 4 (12.5%) | 3 (14.3%) | ||
| Dementia | 27 (7.7%) | 12 (16.0%) | 2 (6.3%) | 7 (33.3%) | ||
| NMSS Total | 20.9 (14.9) | 26.7 (17.6) | 28.2 (15.8) | 58.0 (30.8) | <0.001 | <0.001d |
| Dopamine imaging performed | 85 (26.3%) | 18 (25.7%) | 11 (35.5%) | 7 (35.0%) | 0.60 | 0.34d |
Data are mean (standard deviation) or number (percentage). UPDRS 3 = Movement Disorder Society unified Parkinson’s disease rating scale, TD = tremor dominant, PIGD = postural instability gait difficulty, MoCA = Montreal cognitive assessment, MCI = mild cognitive impairment, NMSS = non motor symptom scale. aAdjusted for disease duration and sex, bAdjusted for age and disease duration, cAdjusted for age and sex, dAdjusted for age, sex and disease duration.
Table 4
Proportion and clinical characteristics of recent onset Parkinson’s disease patients with complete case data identified by four different screening algorithms
| Hyposmia and/or family history [3] | Hyposmia in enriched cohort (50% family history) [4] | Hyposmia and/or RBD and/or depression [6] | Hyposmia and RBD [5] | |||||||||
| Yes n = 1182 (79.0%) | No n = 315 (21.0%) | Adjusted p-value | Yes n = 422 (70.6%) | No n = 176 (29.4%) | Adjusted p-value | Yes n = 1414 (90.6%) | No n = 146 (9.4%) | Adjusted p-value | Yes n = 432 (31.9%) | No n = 922 (68.1%) | Adjusted p-value | |
| Age | 67.5 (7.8) | 70.7 (7.9) | <0.001a | 67.5 (7.9) | 70.1 (7.9) | <0.001a | 68.0 (7.9) | 70.6 (8.1) | <0.001a | 67.3 (7.5) | 68.6 (8.1) | 0.001a |
| Male Sex | 764 (64.6%) | 215 (68.3%) | 0.40b | 273 (64.7%) | 112 (63.6%) | 0.54b | 915 (64.7%) | 103 (70.5%) | 0.23b | 312 (72.2%) | 571 (61.9%) | <0.001b |
| Disease duration | 1.4 (0.9) | 1.3 (0.9) | 0.29c | 1.4 (0.9) | 1.3 (0.9) | 0.080c | 1.4 (0.9) | 1.3 (0.9) | 0.34c | 1.4 (0.9) | 1.3 (0.9) | 0.007c |
| UPDRS 3 | 22.3 (12.0) | 22.1 (12.0) | 0.19d | 21.4 (11.5) | 23.3 (13.0) | 0.15d | 22.7 (12.3) | 20.3 (11.6) | 0.003d | 22.8 (11.5) | 21.8 (11.9) | 0.17d |
| Motor subtype | ||||||||||||
| TD | 523 (48.2%) | 148 (50.9%) | 182 (46.3%) | 83 (52.2%) | 593 (45.4%) | 77 (57.0%) | 167 (41.4%) | 449 (51.7%) | ||||
| PIGD | 424 (39.0%) | 111 (38.1%) | 0.27d | 160 (40.7%) | 60 (37.7%) | 0.20d | 545 (41.7%) | 44 (32.6%) | 0.004d | 176 (43.7%) | 326 (37.5%) | 0.001d |
| Indeterminate | 139 (12.8%) | 32 (11.0%) | 0.32d | 51 (13.0%) | 16 (10.1%) | 0.18d | 168 (12.9%) | 14 (10.4%) | 0.13d | 60 (14.9%) | 94 (10.8%) | 0.002d |
| MoCA | ||||||||||||
| Normal | 817 (74.8%) | 220 (75.9%) | 0.069d | 303 (75.9%) | 120 (75.5%) | 0.46d | 957 (72.9%) | 106 (79.7%) | 0.003d | 287 (71.0%) | 660 (77.5%) | 0.001d |
| MCI | 138 (12.6%) | 26 (9.0%) | 51 (12.8%) | 21 (13.2%) | 162 (12.3%) | 15 (11.3%) | 59 (14.6%) | 95 (11.2%) | ||||
| Dementia | 137 (12.6%) | 44 (15.2%) | 45 (11.3%) | 18 (11.3%) | 193 (14.7%) | 12 (9.0%) | 58 (14.4%) | 97 (11.4%) | ||||
| NMSS Total | 32.5 (26.1) | 27.3 (21.0) | 0.005d | 33.0 (24.3) | 31.6 (26.4) | 0.82d | 34.0 (26.4) | 17.7 (12.5) | <0.001d | 40.2 (28.7) | 26.9 (21.5) | <0.001d |
| Dopamine imaging performed | 281 (27.9%) | 89 (32.5%) | 0.004d | 114 (31.2%) | 47 (30.1%) | 0.65d | 329 (27.4%) | 44 (34.4%) | 0.008d | 111 (30.2%) | 231 (29.1%) | 0.72d |
Data are mean (standard deviation) or number (percentage). UPDRS 3 = Movement Disorder Society unified Parkinson’s disease rating scale part 3, TD = tremor dominant, PIGD = postural instability gait difficulty, MoCA = Montreal cognitive assessment, MCI = mild cognitive impairment, NMSS = non motor symptom scale. aAdjusted for disease duration and sex, bAdjusted for age and disease duration, cAdjusted for age and sex, dAdjusted for age, sex and disease duration.


