
Transcriptomic Profiling of Extracellular RNAs Present in Cerebrospinal Fluid Identifies Differentially Expressed Transcripts in Parkinson’s Disease
Abstract
Background: Parkinson’s disease (PD) is a debilitating neurological disorder for which prognostic and diagnostic biomarkers are lacking. Cerebrospinal fluid (CSF) is an accessible body fluid that comes into direct contact with the central nervous system (CNS) and acts as a nuclease-free repository where RNA transcripts shed by brain tissues can reside for extended periods of time.
Objective: We studied the RNA species present in the CSF of PD patients to identify novel diagnostic biomarkers.
Methods: Small volumes of CSF from 27 PD patients and 30 healthy age- and sex-matched controls were used for RNA extraction followed by next-generation sequencing (RNA-seq) using the Illumina platform. CSF contains a number of fragmented RNA species that were individually sequenced and analyzed. Comparing PD to control subjects, we observed a pool of dysregulated sequencing tags that were further analyzed and validated by quantitative real-time PCR (qRT-PCR).
Results: A total of 201 differentially expressed sequencing tags (DETs), including 92 up-regulated and 109 down-regulated DETs were identified. We validated the following DETs by real time PCR in the patient samples: Dnmt1, Ezh2, CCR3, SSTR5,PTPRC, UBC, NDUFV2, BMP7, SCN9, SCN9 antisense (AC010127.3), and long noncoding RNAs AC079630 and UC001lva.4 (close to the LRRK2 gene locus), as potential PD biomarkers.
Conclusions: The CSF is a unique environment that contains many species of RNA. Our work demonstrates that CSF can potentially be used to identify biomarkers for the detection and tracking of disease progression and evaluation of therapeutic outcomes.
INTRODUCTION
Parkinson’s disease (PD) is the second most prevalent neurodegenerative disease worldwide, with rates expecting to double in the next 15 years [1]. Despite many efforts to more accurately diagnose and understand PD pathophysiology, diagnosis is primarily clinical and can only be confirmed at autopsy [2, 3]. Therefore, there is a need for sensitive and specific biomarkers to diagnose PD at early stages, enabling clinicians to monitor disease progression and develop therapeutic approaches to assess response to existing and future treatments.
Genome-wide expression analyses using next generation sequencing (NGS) technology have proven valuable for identifying biological processes in neurodegenerative diseases [2]. Next generation RNA sequencing (RNA-seq) provides sequence information and measures the abundance of RNA molecules present at any particular time in a specific cell, tissue or organ. RNA sequencing does not rely on a priori knowledge of transcripts and provides accurate and comprehensive data. For these reasons, NGS is currently being applied to profile extracellular RNA from the peripheral biofluids of patients with neurological diseases, central nervous system (CNS) tumors, or traumatic brain injury for biomarker discovery [4]. Cerebrospinal fluid (CSF) is in close proximity to the main site of PD pathology and since there is no barrier between CSF and the brain, CSF is an optimal source of biomarkers for neurodegenerative disorders [5]. Recent work using CSF and serum/plasma from deceased PD patients with a complete pathological assessment shows that the profiling of these readily obtainable cell-free peripheral fluids provides a true reflection of cellular alterations that result in disease pathology [6, 7].
Despite the collection of multiple large data sets, these approaches to date have not produced clinically useful PD biomarkers. This can be attributed in part to small sample volumes and samples with fragmented RNAs in low abundance that make downstream RNA sequencing challenging.
Here, we report a methodology to purify and perform next generation RNA sequencing to identify extracellular RNA transcripts in CSF. Our data demonstrate that CSF contains a diversity of fragmented RNA species, including several RNAs that are dysregulated in PD patients. We optimized a method to use small volumes (300μl) of CSF for RNA-seq using the Illumina platform, followed by target validation utilizing quantitative real-time PCR (qRT-PCR). These findings provide a framework for developing a PD-specific RNA biomarker panel and provide methodological advances that can be applied to other neurological disorders for early detection and assessment of treatment response.
MATERIALS AND METHODS
Human CSF samples
Frequency matching was used to recruit 27 PD patients and 30 age- and sex-matched healthy controls at the Pacific Northwest Udall Center of Excellence for Parkinson’s Disease Research (PANUC) and the Alzheimer’s Disease Research Center (ADRC) at the University of Washington (UW) and Veterans Affairs (VA) Puget Sound Health Care System (Seattle, Washington, USA) as previously described [8–10]. All subjects underwent the following evaluations: medical history, physical and neurological examinations, laboratory tests, and neuropsychological assessments. The inclusion and exclusion criteria for study subjects have been previously described [8–11]. Briefly, PD patients met UK PD Society Brain Bank clinical diagnostic criteria for PD [12], except that having “more than one affected relative” was not considered an exclusion criterion. Control subjects were the patients’ spouses or community volunteers in good health. They had no signs or symptoms suggesting cognitive impairment or neurological disease; all had a Mini Mental Status Exam (MMSE) score between 28 and 30, a Clinical Dementia Rating (CDR) score of 0, and New York University paragraph recall scores (immediate and delayed) of >6. All procedures were performed in strict compliance with guidelines for human experimentation and all participants underwent detailed informed consent procedures. Subjects provided consent in writing in accordance with procedures approved by the institutional review boards at the UW and VA Puget Sound Health Care System.
CSF was collected by lumbar puncture as previously described [9]. Similar sample collection protocols and quality control procedures were followed at all participating centers, in particular, the use of polypropylene collection and storage tubes, rapid separation into single use aliquots, and freezing of CSF samples, to minimize potential site variability. De-identified samples were aliquoted and stored at –80°C, coded as group “A” or “B”, and then transferred to the University of Miami for RNA analysis. The UW CSF data dictionary is shown in Supplementary Table 1.
Library preparation of the CSF transcriptome and sequencing
Library preparation was optimized to achieve successful sequencing runs from low input RNA by scaling up reverse transcription and PCR reaction volumes without increasing PCR amplification cycles. Extracted RNA was between 550 t0 3600 picograms as shown in Supplementary Figure 1. We utilized NEB-based directional RNA-Seq (Ipswich, MA, USA) sample preparation kit to prepare all libraries. End repair of cDNA libraries was performed and 5’ and 3’ adaptors were ligated, sequentially. Eluted cDNA was enriched and remaining RNA products were digested with USER excision and PCR amplification. During enrichment, each sample was indexed with one unique index primer from a set of 12 different index primers for Illumina multiplex sequencing. RNA was reverse transcribed to synthesize first strand cDNA, followed by a purification step, using Agencourt RNA Clean XP beads (Beckman Coulter, Brea, CA, USA). Second strand cDNA synthesis was performed and libraries were amplified (12 cycles), followed by purification using 1.8 X Agencourt AMPure beads (Beckman Coulter, Brea, CA, USA). Finally, three uniquely indexed libraries were pooled and sequenced on a HigSeq2000 Illumina sequencer. A quality control assessment was performed, using the Bowtie software package by estimating genome coverage, percent alignment and nucleotide quality. Raw sequencing data was transformed to FastQ format and stored on a dedicated server. All raw sequencing data and corresponding codes are uploaded onto the Parkinson’s Disease Biomarker Program database (PDBP) Data Management Resource (PDBP DMR) (http://pdbp.ninds.nih.gov) and are freely available to registered users.
Sequencing read processing and genome mapping
Genome mapping was performed using the Spliced Transcripts Alignment to Reference (STAR) software [13], based on the latest available versions of STAR 2.1.3 and the most recent human transcriptome (reference hg19) downloaded from the UCSC database (Santa Cruz, CA, USA). Transcript assembly was processed and counts per million (CPM) values for each aligned sequence (known and novel) were determined. To ensure that reads were indeed novel, we applied an initial filter based on expression levels to eliminate low abundance single-exon transcripts to avoid mislabeling of genomic DNA contaminated reads.
RNA sequencing analysis and identification of differentially expressed transcripts
A trimming algorithm based on Trim Galore software (Babraham Institute, Babraham, United Kingdom) was used to trim reads for adapter removal. EdgeR [14], a Bioconductor software package for differential expression analysis of replicated count data, was used to correct for multiple testing (false discovery rate (FDR) cutoff of <0.1) and for the identification of differentially expressed transcripts based on CPM values [14].
Functional annotation and pathway analysis of differentially expressed transcripts (DETs)
Kyoto Encyclopedia of Genes and Genomes (KEGG) pathway enrichment analysis of DETs was performed using the Database for Annotation Visualization and Integrated Discovery (DAVID) online analytical tools [15–17]. Protein-protein interaction networks of DETs were constructed via the search tool for the retrieval of interacting genes/proteins (STRING; http://www.stringdb.org/) and the similarity between the PPI networks and the KEGG pathways were calculated via EnrichNet [18, 19].
Quantitative real time PCR (qRT-PCR) validation of RNA-seq data
The cDNA synthesis protocol is described in Supplementary Figure 2. The majority of RNA in the CSF is short in length, most likely the result of RNA fragmentation. We synthesized cDNA and utilized SYBR green-based qRT-PCR reactions with transcript-specific forward primers and a universal PCR (reverse) primer (Supplementary Table 3) that anneals to the 5’ end of the tagged cDNA (Supplementary Figure 3). Small CSF sample volumes limited qRT-PCR gene validation to a subset of candidate sequencing tags; therefore 21 transcripts (Supplementary Table 3) were selected for validation based on their relevance to known PD genes in the PPI analysis.
We performed Sanger sequencing to validate the specificity of qRT-PCR products. Raw data was normalized to the geometric mean of the 18 S gene that met the criteria of having similar expression between sample groups. Relative expression was compared between PD and control groups using the student’s t-test. All measurements were performed in triplicate and data were analyzed using the ΔCt method. Statistical analyses were performed using SPSS 21 for Mac OSX (IBM, Armonk, NY, USA).
RESULTS
High-throughput sequencing of the CSF transcriptome
We analyzed RNA transcripts from the CSF of 27 PD patients and 30 controls. CSF RNA-seq data were analyzed using STAR to align reads to the human genome, generating an average of 84×106 paired-end reads that aligned to the reference human genome as well as to annotated genes. The average number of trimmed reads was 81×106 per sample, of which 82.7% aligned to the human reference genome (UCSC_hg19) (Supplementary Table 2). Our analysis focused on RNA fragments that were reproducibly present in at least 65% of samples in each group and CPM >1. After filtering, a total of 3521 fragmented transcripts were detected: protein-coding (2862 transcripts; 81.3% of total transcripts), non-coding RNAs (458 transcripts; 13% of total transcripts) and pseudo genes (201 transcripts; 5.7% of total transcripts, Supplementary Table 4).
Differentially expressed transcripts (DETs) in the CSF of PD patients
Differential expression analysis was performed using p < 0.05 to identify a total of 467 DETs between PD patients and controls. Using p-value cutoffs of p < 0.001, 0.01 < p < 0.001 and 0.01 < p < 0.05 as shown in the volcano plot narrowed down the list of DETs to 207, 103 and 157, respectively (Fig. 1).
Differential expression analysis of CPM values using p < 0.05, FDR <0.1 and |log2 FC|>1 as cutoff criteria produced a total of 201 transcripts differentially expressed between PD patients and controls. Among these DETs, 92 transcripts were upregulated and 109 transcripts were downregulated in PD patients. Of the 201 DETs, 142 (70.6%) were related to protein-coding transcripts (Supplementary Table 5). Interestingly, non-coding RNA and pseudo genes are more abundant (29.4% vs 18.1% ; p = 0.001, Relative Risk = 1.8, 95% CI: 1.34 –2.41) in DETs as compared to non-DETs. Protein-coding transcripts are present in a lower proportion in DETs as compared to non-DETs (70.6% vs 81.9% , Fig. 2).
Functional annotation clustering of differentially expressed transcripts
To determine the relationship between differentially expressed transcripts identified in RNA-seq to relevant PD processes and pathways, gene ontology (GO) and pathway enrichment analyses were performed using DAVID online tools. We considered significantly enriched genes as those with the following criteria: p-value <0.05, functional categories with the highest classification stringency and enrichmentscore >1.
Based on the cutoff criteria of |log2 FC|>1, p < 0.05 and FDR <0.1, we screened 201 DETs. Up-regulated transcripts were mostly enriched for chromatin regulators, while down-regulated transcripts were significantly enriched for protein-tyrosine phosphatases, endoplasmic reticulum membrane proteins, and genes that regulate phosphorylation, dephosphorylation and phospholipase activity (Table 1). Details of functional annotation clustering in up and down-regulated DETs are shown in Supplementary Tables 6 and 7.
Construction of protein-protein interaction (PPI) networks
We mapped 201 DETs to the STRING database (the hub protein was selected according to the node degree) and screened for significant interactions (>0.7). These relationships were integrated to construct interaction networks among interacting proteins (Fig. 3) and the similarity between PPI networks and KEGG pathways were calculated via EnrichNet [18, 19]. This analysis detected the following proteins: EZH2, DNMT1, NDUFV2, MAPK11, CCR3, LPAR1, SSTR5, PTPRC, and BMP7 that interact with known PD genes PARK7, LRRK2, and SNCA. Although these three PD transcripts were not in our DETs, because of their direct interaction with our DETs, were added to the module (Fig. 3) as these protein-coding genes play an important role in the pathological process of Parkinson’s disease.
Validation of CSF sequencing
Target transcripts included 19 genes from the PPI network (Fig. 3) and two non-coding RNAs that are differentially expressed. The differential expression observed in RNA-seq between the two groups was validated in 13 out of 17 transcripts (76%) by qRT-PCR (Table 2). Our comparison of RNA-Seq and qRT-PCR showed good agreement in both the direction and magnitude of fold change for candidate transcripts. Log2 fold changes of these transcripts in qRT-PCR correlated with RNA-seq (p = 0.01, r2 = 0.65). AC010127.3 is an antisense RNA to SCN9a that is down-regulated in qRT-PCR while SCN9a is significantly up-regulated. UC001lva.4 (p = 0.01, Log2FC = –1.6) and AC079630 (p = 0.001, Log2FC = –6.72) are two lncRNAs on the LRRK2 locus that are significantly down-regulated in qRT-PCR while the LRRK2 gene itself is not significantly altered in expression. NDUFV2 and LRPPRC (mitochondrial biogenesis and maintenance factors), are both significantly down-regulated.
DISCUSSION
Our RNA-seq data and bioinformatics pipeline suggest that extracellular RNAs might be detectable in CSF and their presence and differential expression can be monitored to identify Parkinson’s disease-related extracellular RNAs. We observed higher frequency of non-coding RNAs in the CSF of PD patients compared to controls corroborating previous reports that various ncRNA species perform essential functions in the regulation of gene expression during neural development, plasticity, and aging [20, 21]. Several ncRNAs are implicated in PD [22] and other CNS diseases. Specifically, long noncoding RNAs (lncRNAs) are abundantly transcribed and highly expressed in the brain [25]. Recent evidence suggests lncRNAs play important roles in neurodegenerative diseases, specifically PD [26] and some reports suggest a link between LRRK2 and transcriptional control via non-coding RNAs [27, 28]. While we did not observe significant changes in LRRK2, we identified two lncRNAs (UC001lva.4 and AC079630), located on the LRRK2 locus, that are down-regulated in PD patients compared to controls. These findings are in line with previous reports that cite no significant changes in gene expression patterns between LRRK2 mutation carriers and either neurologically normal controls or idiopathic PD patients [27, 29]. Our findings also highlight the need to characterize these novel lncRNAs from the famous LRRK2 locus.
DNA methyltransferase 1 (Dnmt1) is an important chromatin regulator that is downregulated in PD patients. Alterations in Dnmt1 levels might directly impact DNA methylation status and therefore, transcription. In support of our findings, a previous study detected a significant reduction in nuclear Dnmt1 levels in human postmortem brain tissue from PD and dementia with Lewy bodies (DLB) patients as well as in the brains of α-synuclein transgenic mice models [30].
We identified protein tyrosine phosphatase, receptor type, C (PTPRC) to be down-regulated in PD patients, a finding that is in line with previous studies showing PTPRC down-regulation in the blood cells of PD patients [31]. Mitochondrial proteome genes are also potential candidates for PD association studies. NADH dehydrogenase (ubiquinone) flavoprotein 2 (NDUFV2) is one of the core nuclear-encoded subunits in human mitochondrial complex I and defects in this subunit have been associated with PD [32, 33]. Our results confirmed previous reports and showed that NDUFV2 and another mitochondrial biogenesis and maintenance factor, LRPPRC, were both downregulated in PD patients. These mitochondrial genes have recently been linked to PD pathogenesis and require further research [34].
Bone morphogenetic protein 7 (BMP7) was down-regulated in PD patients. Reports suggest that BMP7 has neuroprotective and neuroreparative effects against 6-hydroxydopamine(6-OHDA) lesioning of the nigrostriatal dopamine pathway in an animal model of PD, making BMP7 another interesting and relevant potential PD biomarker [35]. CCR3 was also differentially expressed in PD patients. Whereas relatively few studies exist, CCR3 and CCR5 have been shown to be associated with microglial activation and regulation of the central nervous system, which could have Parkinson’s disease relevance [36, 37]. Interestingly, SCN9a was significantly up-regulated and its antisense transcript, AC010127.3, was significantly downregulated in qRT-PCR. Recent reports identify a link between SCN9A and the pathogenesis of pain in Parkinsonism and global motor delay [38, 39].
Overall, these candidate genes form an interesting picture of the transcripts present in the CSF. Validation of candidates of known importance in PD and PD-related pathways suggest that CSF transcriptome profiling holds promise for the identification of novel PD RNA biomarker discovery.
CONCLUSIONS
Cerebrospinal fluid contains a number of measurable RNA species that can be used to generate a CSF-RNA transcriptome. Analysis of these profiles from a small cohort of PD patients and controls resulted in the validation of several transcripts, including: Dnmt1, Ezh2, CCR3, SSTR5, PTPRC, UBC, NDUFV2, BMP7, SCN9, SCN9 antisense (AC010127.3) and two lncRNAs on LRRK2 (AC079630 and UC001lva.4) as potential PD diagnosis and treatment RNA biomarkers. These transcripts were mostly enriched in function for chromatin regulators, protein-tyrosine phosphatases, endoplasmic reticulum membrane proteins, and genes that regulate phosphorylation, dephosphorylation and phospholipase activity. The findings from future large-scale studies can be used to study gene candidates in a living cohort longitudinally to determine the most reliable RNA biomarkers for early PD detection, prediction of disease progression, as well as response to early intervention and clinical therapeutics over time. Future studies should also measure the presence of biomarker candidates in peripheral tissues to determine if there is a correlation between CSF and plasma biomarkers.
AUTHOR CONTRIBUTIONS
AH, RPF and RA conceived the study, performed experiments, wrote the manuscript and analyzed the data. EP, CZ, SCH and MS collected and characterized clinical samples. CW, JZ and MAF conceived the study, performed experiments and analyzed the data.
CONFLICT OF INTEREST
The authors have no conflicts of interest to report.
ACKNOWLEDGMENTS
NIH grants P50NS071674 supporting AH and part of MAF as well as sequencing costs, U01 NS082137 (to JZ), P50 NS062684 (PANUC), and P50 NIA AG05136 (to EP).
Appendices
The supplementary figure and tables are available in the electronic version of this article: http://dx.doi.org/10.3233/JPD-150737.
REFERENCES
[1] | de Lau LM , & Breteler MM ((2006) ) Epidemiology of Parkinson’s disease. Lancet Neurol, 5: , 525–535. |
[2] | Capurro A , Bodea LG , Schaefer P , Luthi-Carter R , & Perreau VM ((2014) ) Computational deconvolution of genome wide expression data from Parkinson’s and Huntington’s disease brain tissues using population-specific expression analysis. Front Neurosci, 8: , 441. |
[3] | Saracchi E , Fermi S , & Brighina L ((2014) ) Emerging candidate biomarkers for Parkinson’s disease: A review. Aging Dis, 5: , 27–34. |
[4] | Burgos KL , Javaherian A , Bomprezzi R , Ghaffari L , Rhodes S , Courtright A , Tembe W , Kim S , Metpally R , & Van Keuren-Jensen K ((2013) ) Identification of extracellular miRNA in human cerebrospinal fluid by next-generation sequencing. RNA, 19: , 712–722. |
[5] | Parnetti L , Castrioto A , Chiasserini D , Persichetti E , Tambasco N , El-Agnaf O , & Calabresi P ((2013) ) Cerebrospinal fluid biomarkers in Parkinson disease. Nat Rev Neurol, 9: , 131–140. |
[6] | Burgos K , Malenica I , Metpally R , Courtright A , Rakela B , Beach T , Shill H , Adler C , Sabbagh M , Villa S , Tembe W , Craig D , & Van Keuren-Jensen K ((2014) ) Profiles of extracellular miRNA in cerebrospinal fluid and serum from patients with Alzheimer’s and Parkinson’s diseases correlate with disease status and features of pathology. PloS One, 9: , e94839. |
[7] | Miller DB , & O’Callaghan JP ((2015) ) Biomarkers of Parkinson’s disease: Present and future. Metabolism, 64: , S40–S46. |
[8] | Cholerton BA , Zabetian CP , Quinn JF , Chung KA , Peterson A , Espay AJ , Revilla FJ , Devoto J , Watson GS , Hu SC , Edwards KL , Montine TJ , & Leverenz JB ((2013) ) Pacific Northwest Udall Center of excellence clinical consortium: Study design and baseline cohort characteristics. J Parkinsons Dis, 3: , 205–214. |
[9] | Shi M , Bradner J , Hancock AM , Chung KA , Quinn JF , Peskind ER , Galasko D , Jankovic J , Zabetian CP , Kim HM , Leverenz JB , Montine TJ , Ginghina C , Kang UJ , Cain KC , Wang Y , Aasly J , Goldstein D , & Zhang J ((2011) ) Cerebrospinal fluid biomarkers for Parkinson disease diagnosis and progression. Ann Neurol, 69: , 570–580. |
[10] | Mata IF , Shi M , Agarwal P , Chung KA , Edwards KL , Factor SA , Galasko DR , Ginghina C , Griffith A , Higgins DS , Kay DM , Kim H , Leverenz JB , Quinn JF , Roberts JW , Samii A , Snapinn KW , Tsuang DW , Yearout D , Zhang J , Payami H , & Zabetian CP ((2010) ) SNCA variant associated with Parkinson disease and plasma alpha-synuclein level. Arch Neurol, 67: , 1350–1356. |
[11] | Hong Z , Shi M , Chung KA , Quinn JF , Peskind ER , Galasko D , Jankovic J , Zabetian CP , Leverenz JB , Baird G , Montine TJ , Hancock AM , Hwang H , Pan C , Bradner J , Kang UJ , Jensen PH , & Zhang J ((2010) ) DJ-1 and alpha-synuclein in human cerebrospinal fluid as biomarkers of Parkinson’s disease. Brain, 133: , 713–726. |
[12] | Gibb WR , & Lees AJ ((1988) ) The relevance of the Lewy body to the pathogenesis of idiopathic Parkinson’s disease. J Neurol Neurosurg Psychiatry, 51: , 745–752. |
[13] | Dobin A , Davis CA , Schlesinger F , Drenkow J , Zaleski C , Jha S , Batut P , Chaisson M , & Gingeras TR ((2013) ) STAR: Ultrafast universal RNA-seq aligner. Bioinformatics, 29: , 15–21. |
[14] | Robinson MD , McCarthy DJ , & Smyth GK ((2010) ) edgeR: A Bioconductor package for differential expression analysis of digital gene expression data. Bioinformatics, 26: , 139–140. |
[15] | Huang da W , Sherman BT , & Lempicki RA ((2009) ) Systematic and integrative analysis of large gene lists using DAVID bioinformatics resources. Nat Protoc, 4: , 44–57. |
[16] | Huang da W , Sherman BT , & Lempicki RA ((2009) ) Bioinformatics enrichment tools: Paths toward the comprehensive functional analysis of large gene lists. Nucleic Acids Res, 37: , 1–13. |
[17] | Dennis G Jr , Sherman BT , Hosack DA , Yang J , Gao W , Lane HC , & Lempicki RA ((2003) ) DAVID: Database for Annotation, Visualization, and Integrated Discovery. Genome Biol, 4: , P3. |
[18] | Franceschini A , Szklarczyk D , Frankild S , Kuhn M , Simonovic M , Roth A , Lin J , Minguez P , Bork P , von Mering C , & Jensen LJ ((2013) ) STRING v9.1: Protein-protein interaction networks, with increased coverage and integration. Nucleic Acids Res, 41: , D808–D815. |
[19] | Glaab E , Baudot A , Krasnogor N , Schneider R , & Valencia A ((2012) ) EnrichNet: Network-based gene set enrichment analysis. Bioinformatics, 28: , i451–i457. |
[20] | Gstir R , Schafferer S , Scheideler M , Misslinger M , Griehl M , Daschil N , Humpel C , Obermair GJ , Schmuckermair C , Striessnig J , Flucher BE , & Huttenhofer A ((2014) ) Generation of a neuro-specific microarray reveals novel differentially expressed noncoding RNAs in mouse models for neurodegenerative diseases. RNA, 20: , 1929–1943. |
[21] | Mattick JS ((2011) ) The central role of RNA in human development and cognition. FEBS Lett, 585: , 1600–1616. |
[22] | Marz M , Ferracin M , & Klein C ((2015) ) MicroRNAs as biomarker of Parkinson disease? Small but mighty. Neurology, 84: , 636–638. |
[23] | Haramati S , Chapnik E , Sztainberg Y , Eilam R , Zwang R , Gershoni N , McGlinn E , Heiser PW , Wills AM , Wirguin I , Rubin LL , Misawa H , Tabin CJ , Brown R Jr , Chen A , & Hornstein E ((2010) ) miRNA malfunction causes spinal motor neuron disease. Proc Natl Acad Sci U S A, 107: , 13111–13116. |
[24] | Kim J , Inoue K , Ishii J , Vanti WB , Voronov SV , Murchison E , Hannon G , & Abeliovich A ((2007) ) A MicroRNA feedback circuit in midbrain dopamine neurons. Science, 317: , 1220–1224. |
[25] | Rinn JL , & Chang HY ((2012) ) Genome regulation by long noncoding RNAs. Ann Rev Biochem, 81: , 145–166. |
[26] | Soreq L , Guffanti A , Salomonis N , Simchovitz A , Israel Z , Bergman H , & Soreq H ((2014) ) Long non-coding RNA and alternative splicing modulations in Parkinson’s leukocytes identified by RNA sequencing. PLoS Comput Biol, 10: , e1003517. |
[27] | Dorval V , & Hebert SS ((2012) ) LRRK2 in transcription and translation regulation: Relevance for Parkinson’s disease. Front Neurol, 3: , 12. |
[28] | Liu Z , Lee J , Krummey S , Lu W , Cai H , & Lenardo MJ ((2011) ) The kinase LRRK2 is a regulator of the transcription factor NFAT that modulates the severity of inflammatory bowel disease. Nat Immunol, 12: , 1063–1070. |
[29] | Botta-Orfila T , Tolosa E , Gelpi E , Sanchez-Pla A , Marti MJ , Valldeoriola F , Fernandez M , Carmona F , & Ezquerra M ((2012) ) Microarray expression analysis in idiopathic and LRRK2-associated Parkinson’s disease. Neurobiol Dis, 45: , 462–468. |
[30] | Desplats P , Spencer B , Coffee E , Patel P , Michael S , Patrick C , Adame A , Rockenstein E , & Masliah E ((2011) ) Alpha-synuclein sequesters Dnmt1 from the nucleus: A novel mechanism for epigenetic alterations in Lewy body diseases. J Biol Chem, 286: , 9031–9037. |
[31] | Ahmed SS , Santosh W , Kumar S , & Christlet HT ((2009) ) Metabolic profiling of Parkinson’s disease: Evidence of biomarker from gene expression analysis and rapid neural network detection. J Biomed Sci, 16: , 63. |
[32] | Liu HY , Liao PC , Chuang KT , & Kao MC ((2011) ) Mitochondrial targeting of human NADH dehydrogenase (ubiquinone) flavoprotein 2 (NDUFV2) and its association with early-onset hypertrophic cardiomyopathy and encephalopathy. J Biomed Sci, 18: , 29. |
[33] | Hattori N , Yoshino H , Tanaka M , Suzuki H , & Mizuno Y ((1998) ) Genotype in the 24-kDa subunit gene (NDUFV2) of mitochondrial complex I and susceptibility to Parkinson disease. Genomics, 49: , 52–58. |
[34] | Gaweda-Walerych K , & Zekanowski C ((2013) ) The impact of mitochondrial DNA and nuclear genes related to mitochondrial functioning on the risk of Parkinson’s disease. Curr Genomics, 14: , 543–559. |
[35] | Harvey BK , Mark A , Chou J , Chen GJ , Hoffer BJ , & Wang Y ((2004) ) Neurotrophic effects of bone morphogenetic protein-7 in a rat model of Parkinson’s disease. Brain Res, 1022: , 88–95. |
[36] | Flynn G , Maru S , Loughlin J , Romero IA , & Male D ((2003) ) Regulation of chemokine receptor expression in human microglia and astrocytes. J Neuroimmunol, 136: , 84–93. |
[37] | Reale M , Greig NH , & Kamal MA ((2009) ) Peripheral chemo-cytokine profiles in Alzheimer’s and Parkinson’s diseases. Mini Rev Med Chem, 9: , 1229–1241. |
[38] | Meijer IA , Vanasse M , Nizard S , Robitaille Y , & Rossignol E ((2014) ) An atypical case of SCN9A mutation presenting with global motor delay and a severe pain disorder. Muscle Nerve, 49: , 134–138. |
[39] | Greenbaum L , Tegeder I , Barhum Y , Melamed E , Roditi Y , & Djaldetti R ((2012) ) Contribution of genetic variants to pain susceptibility in Parkinson disease. Eur J Pain, 16: , 1243–1250. |
Figures and Tables
Fig.1
Volcano plot of differentially expressed genes (DEGs) between PD patients and controls. Log2 fold change was plotted against the Edge R-generated p-value (-log base 10). Differential expression analysis using a p < 0.05 cutoff identified 467 DEGs between PD patients and controls. The gene list was cut to 207, 103 and 157 DEGs using cutoffs of p < 0.001, 0.01 < p < 0.001 and 0.01 < p < 0.05, respectively.
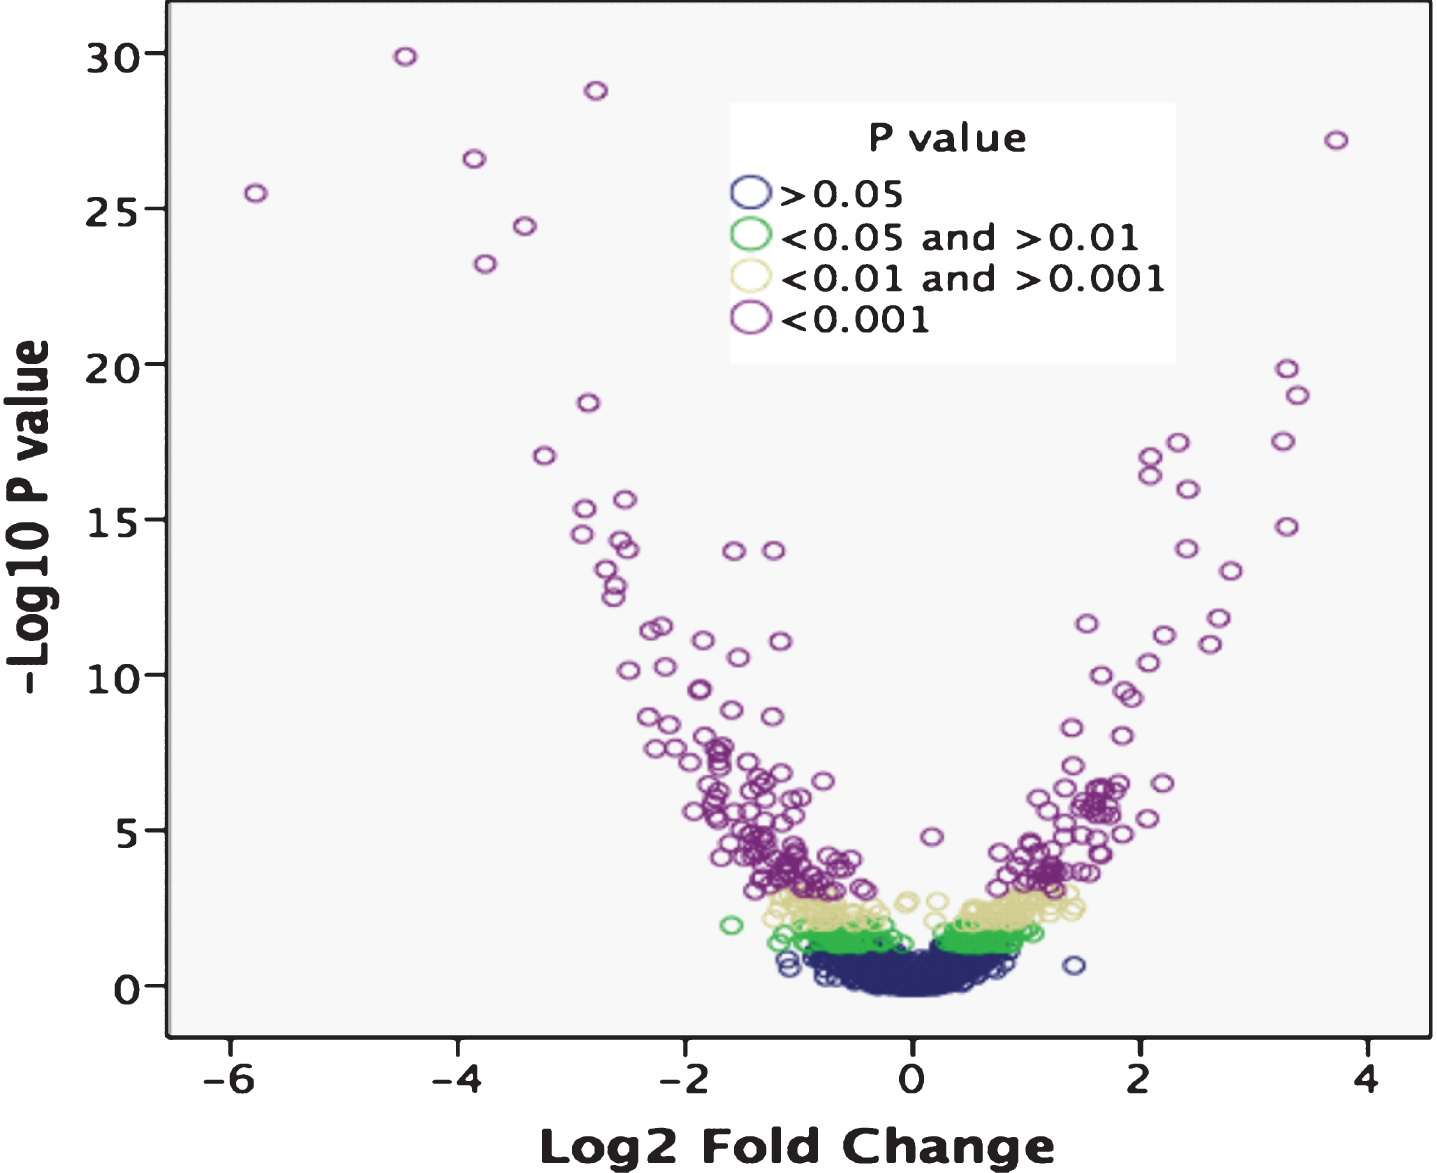
Fig.2
Comparison of the abundance of RNA species in differentially-expressed and non-differentially expressed genes. Various RNA types (x-axis) were plotted as a percentage showing the difference in abundance of each RNA species in the non-differentially expressed (blue) and differentially expressed (green) gene pools identified by RNA-seq in PD patients and controls using p < 0.05, FDR <0.1, and |log FC| >1 as cutoff criteria. DEGs had an overall higher proportion of non-coding RNA genes (29.4% vs 18.1% ; p = 0.001, relative risk = 1.8, 95% CI: 1.34–2.41) and lower proportion of protein-coding genes (70.6% vs 81.9%) than the non-DEGs. Also, DEGs had a higher proportion of miRNA genes (3% vs 0.2% ; p = 0.001, relative risk = 2.07, 95% CI: 1.08–3.97) compared to non-DEGs.
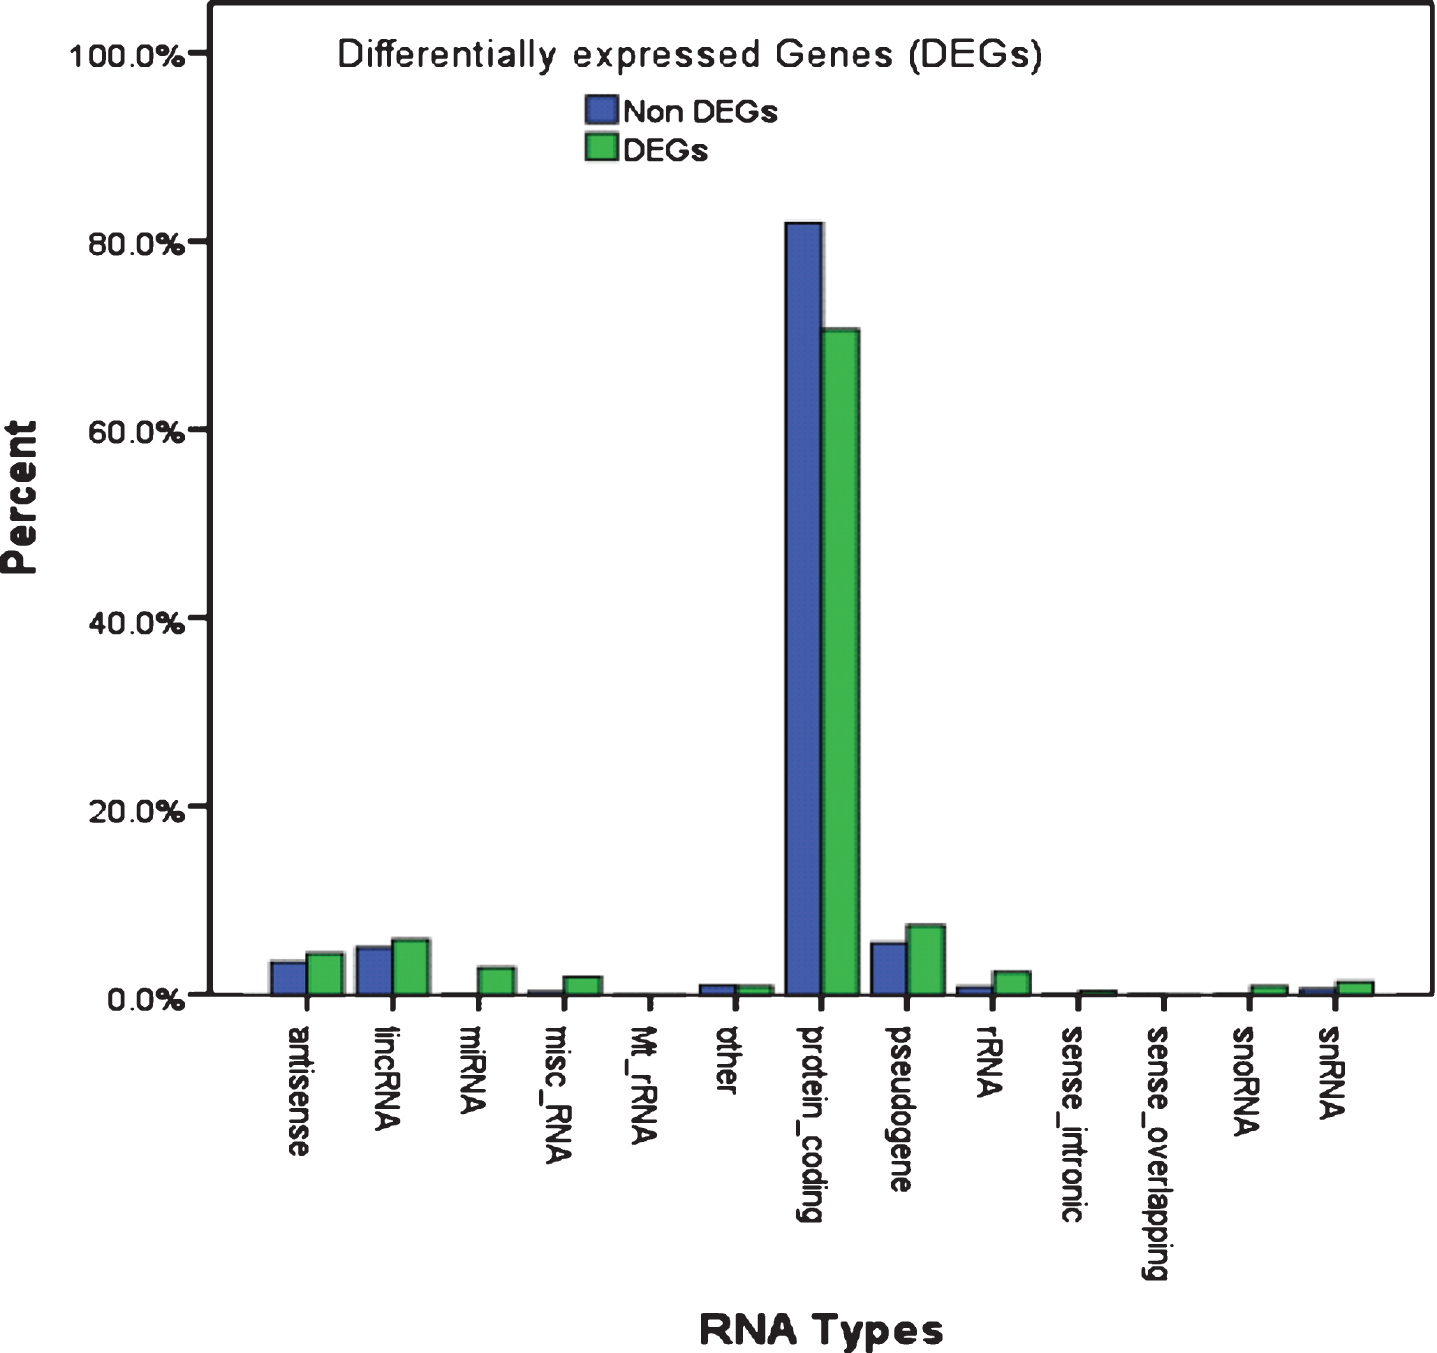
Fig.3
Protein-protein interaction (PPI) network was constructed from differentially expressed genes (DEGs) validated by quantitative real-time PCR. We mapped 201 DEGs to the STRING database (the hub protein was selected according to the node degree) and screened significant interactions with a score >0.7. Because of the close relationship between DEGs and known PD genes PARK7, LRRK2 and SNCA, these genes were added to the module to form a more complete network. Green arrows indicate up-regulated and red bars indicate down-regulated genes between PD patients and controls that were validated by quantitative real time PCR. AC010127.3 is an antisense RNA to SCN9a and UC001lva.4 and AC079630 are two lncRNAs on the LRRK2 gene that are all significantly down-regulated in CSF samples of PD patients as compared to controls. There is no significant difference in the expression of the other genes as measured by qRT-PCR.
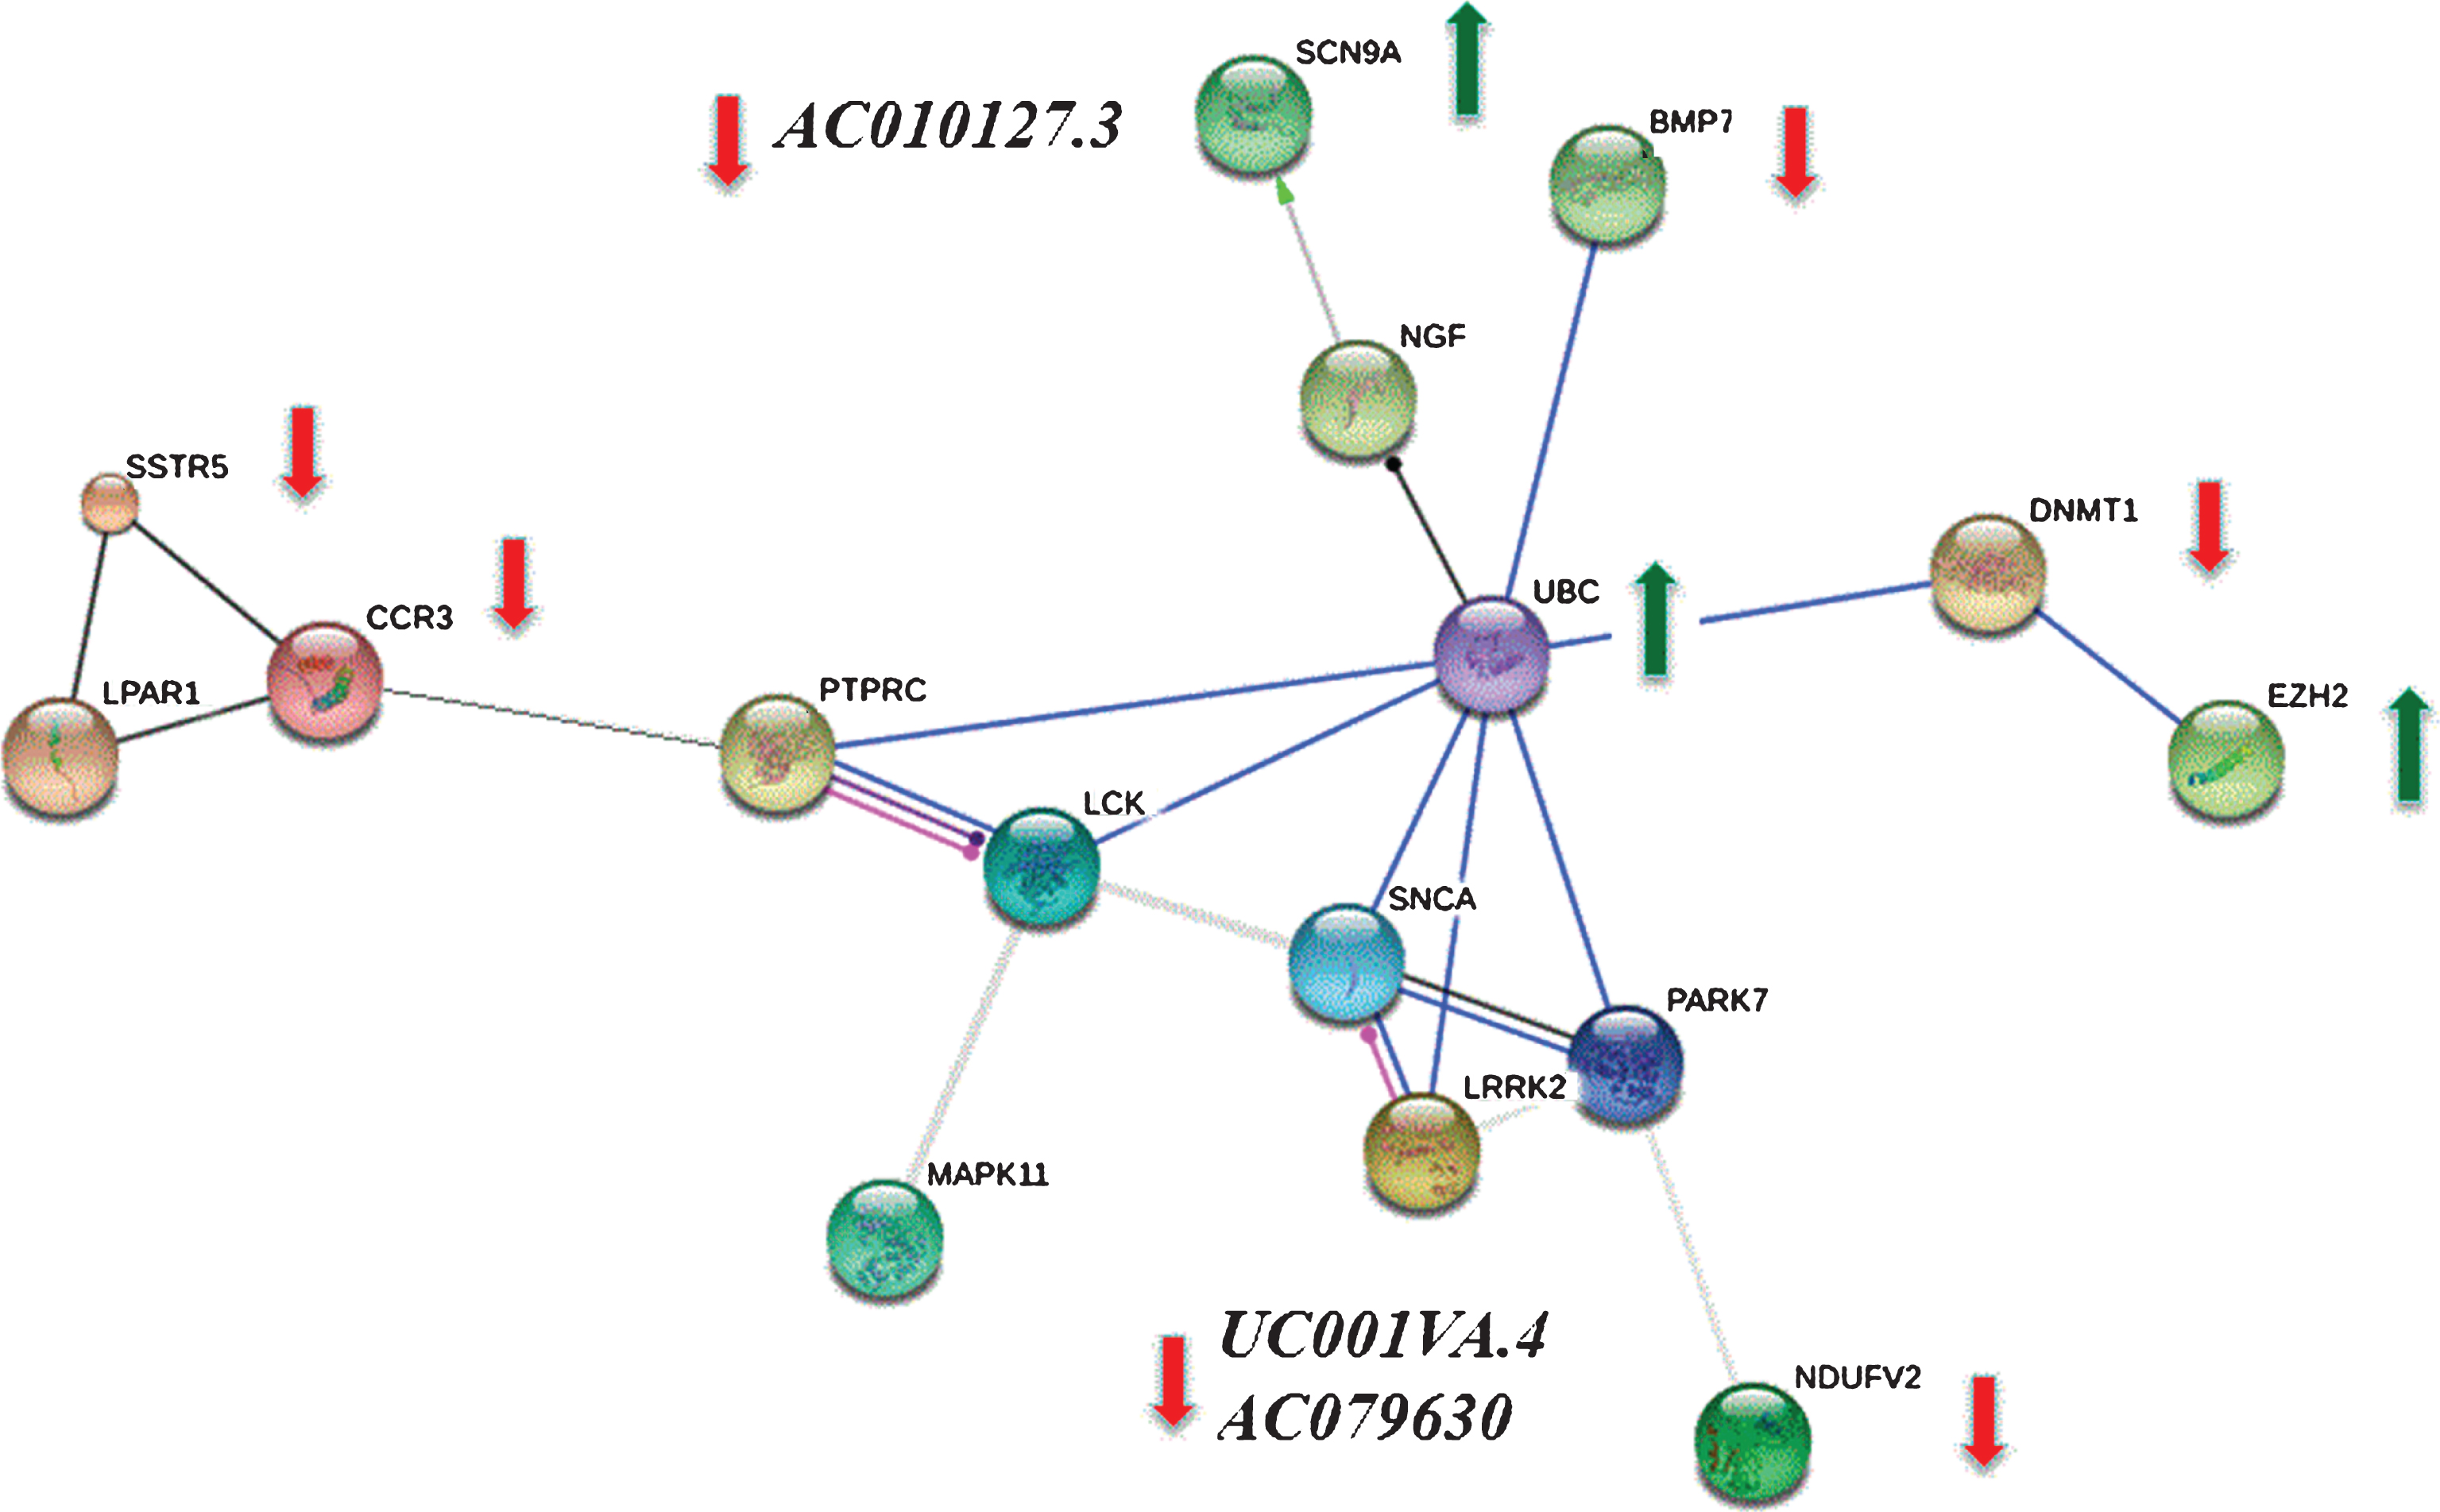
Table 1
Functional annotation clustering of differentially expressed genes
| Annotation Cluster | Enrichment Score | DEGs | p-value | GO |
| Chromatin regulator | 1.05 | DNMT1, H2AFY, EZH2, | 0.03 | 1903308 |
| RSF1 | ||||
| Dephosphorylation | 1.97 | PTPRC, PTPN4, PTPN23, | 0.02 | 0016311 |
| CDKN3 | ||||
| Protein-tyrosine | 1.64 | PTPRC, PTPN4, PTPN23 | 0.009 | IPR000242 |
| phosphatase | ||||
| Endoplasmic reticulum | 1.48 | SREBF1, VAPA, WFS1, | 0.02 | 0005789 |
| membrane | MRVI1, SEC24C | |||
| Regulation of | 1.26 | GRM4, PTPRC, YWHAG, | 0.04 | 0042325 |
| phosphorylation | LPAR1, CDKN3, BMP7 | |||
| Phospholipase activity | 1.17 | JMJD7, PLA2G4C, PLCXD2 | 0.04 | 0004620 |
Differential expression analysis of RNA-seq data identified 92 up- and 109 down-regulated DEGs (cutoff criteria: |log FC| >1, p < 0.05 and FDR <0.1). Functional annotation clustering using DAVID identified potential molecular processes affected by differential gene expression. Significantly enriched genes had the following criteria: p-value <0.05, functional categories with highest classification stringency and an enrichment score >1. Up-regulated genes were mostly enriched for genes involved in chromatin regulation, while down-regulated genes were mainly enriched for protein-tyrosine phosphatases, endoplasmic reticulum membrane proteins, and genes that regulate phosphorylation, dephosphorylation, and phospholipase activity.
Table 2
Quantitative real time PCR (qRT-PCR) validation of RNA-seq data
| Official gene | RNA Type | Log2 FC | Log2FC | p-value | p-value |
| symbol | qRT-PCR | RNA-seq | qRT-PCR | RNA-seq | |
| UBC | protein_coding | 4.8 | 0.37 | 0.01 | 0.16 |
| SSTR5 | protein_coding | –2.06 | –2.27 | 0.02 | 2.3E-08 |
| MAPK11 | protein_coding | –1.09 | 2.20 | 0.5 | 5.26E-12 |
| PTPRC | protein_coding | –1.75 | –1.84 | 0.18 | 9.37E-09 |
| PARK7 | protein_coding | –1.97 | 0.14 | 0.17 | 0.99 |
| NDUFV2 | protein_coding | –0.76 | –2.22 | 0.06 | 2.73E-12 |
| LRRK2 | protein_coding | –2.01 | –0.1 | 0.33 | 0.49 |
| LPAR1 | protein_coding | –1.23 | –1.74 | 0.14 | 2.32E-08 |
| EZH2 | protein_coding | 2.29 | 1.72 | 0.03 | 3.32E-06 |
| DNMT1 | protein_coding | –1.38 | 1.14 | 0.01 | 0.000255726 |
| CCR3 | protein_coding | –1.2 | –4.47 | 0.05 | 1.34E-30 |
| BMP7 | protein_coding | –1.84 | –2.79 | 0.01 | 1.68E-29 |
| AL356309.1 | miRNA | 0.37 | –2.62 | 0.72 | 1.35E-13 |
| AC010127.3 | antisense | –1.52 | –2.31 | 0.08 | 3.81E-12 |
| RP3-467N11.1 | antisense | –0.95 | –3.24 | 0.56 | 9.08E-18 |
| RP5-1051H14.2 | lincRNA | 1.36 | 2.68 | 0.4 | 1.5E-12 |
| CTD-2066L21.2 | lincRNA | –1.2 | –2.7 | 0.13 | 4.03E-14 |
We successfully confirmed the results of RNA-seq by qRT-PCR validation; the trend of fold changes (FC) in the two groups showed a 76% correlation between RNA-seq and qRT-PCR findings. Log2 fold changes (Log2FC) in qRT-PCR correlated with Log2FC in RNA-seq (p = 0.01, r2 = 0.65). The qRT-PCR and RNA-seq fold changes for four genes: PARK7, DNMT1, MAPK11 and AL356309.2 were not validated.

