
Sleep Dysfunction and EEG Alterations in Mice Overexpressing Alpha-Synuclein
Abstract
Background:
Sleep disruptions occur early and frequently in Parkinson’s disease (PD). PD patients also show a slowing of resting state activity. Alpha-synuclein is causally linked to PD and accumulates in sleep-related brain regions. While sleep problems occur in over 75% of PD patients and severely impact the quality of life of patients and caregivers, their study is limited by a paucity of adequate animal models.
Objective:
The objective of this study was to determine whether overexpression of wildtype alpha-synuclein could lead to alterations in sleep patterns reminiscent of those observed in PD by measuring sleep/wake activity with rigorous quantitative methods in a well-characterized genetic mouse model.
Methods:
At 10 months of age, mice expressing human wildtype alpha-synuclein under the Thy-1 promoter (Thy1-aSyn) and wildtype littermates underwent the subcutaneous implantation of a telemetry device (Data Sciences International) for the recording of electromyograms (EMG) and electroencephalograms (EEG) in freely moving animals. Surgeries and data collection were performed without knowledge of mouse genotype.
Results:
Thy1-aSyn mice showed increased non-rapid eye movement sleep during their quiescent phase, increased active wake during their active phase, and decreased rapid eye movement sleep over a 24-h period, as well as a shift in the density of their EEG power spectra toward lower frequencies with a significant decrease in gamma power during wakefulness.
Conclusions:
Alpha-synuclein overexpression in mice produces sleep disruptions and altered oscillatory EEG activity reminiscent of PD, and this model provides a novel platform to assess mechanisms and therapeutic strategies for sleep dysfunction in PD.
INTRODUCTION
Parkinson’s disease (PD), an incurable and debilitating neurodegenerative disease that currently affects over 4 million people worldwide [1], causes both motor and non-motor symptoms, including sleep disturbances [2, 3]. While the etiology remains largely unknown, sleep alterations can precede the onset of the characteristic motor signs by many years [4]. In particular, excessive daytime sleepiness and REM behavioral disorder have been linked to an increased risk of subsequently developing PD [5–7], suggesting that these changes are a fundamental aspect of the early pathology of the disease. Pathological alterations in alpha-synuclein, a protein genetically linked to PD, may provide an anatomical substrate for these early sleep alterations. Indeed, alpha-synuclein accumulates in the brainstem, a key brain region involved in sleep/wake activity, at pre-manifest stages of PD (Braak stages II and III) [8].
Our laboratory has extensively characterized a mouse model of alpha-synuclein overexpression under the Thy-1 promoter (Thy1-aSyn) [9]. These mice develop early and progressive motor and non-motor deficits in domains affected in PD and, by 14 months of age, a loss of striatal dopamine, together with L-dopa responsive motor deficits [8]. Kudo et al. have documented progressive alterations in circadian rhythms in this model [10]. Here, we report that these mice also show significant disruption of sleep/wake activity and alterations in EEG oscillations, starting months before the occurrence of striatal dopamine loss and L-dopa responsive motor deficits. These data indicate that alpha-synuclein overexpression is sufficient to induce sleep alterations in mice and identify the Thy1-aSyn mice as an experimental model for studying the mechanisms of sleep disruption and EEG alterations in pre-manifest PD as well as facilitating the testing of novel therapeutic strategies for this non-motor symptom that severely affects the quality of life of patients. Furthermore, EEG alterations can provide a highly translatable endpoint measure for preclinical studies of novel PD treatments.
MATERIALS AND METHODS
Animals
All animals were treated in accordance with the guidelines of the University of California Los Angeles – Institutional Animal Care and Use Committee. Food and water were provided ad libitum. Thy1-aSyn mice were developed by the laboratory of Dr. Eliezer Masliah at UCSD and maintained on a mixed C57BL/6-DBA/2 background [11]. The genotypes of all mice were determined by PCR amplification of tail DNA at 1 month of age and confirmed at the end of the study. No randomization of groups was required as mice were assigned based on genotype. Only male mice were used in this study because fluctuations in ovarian hormones due to the estrous cycle strongly influence sleep/wake activity [12].
Implantation of radiotelemetry transmitter and EEG/EMG electrodes
Male Thy1-aSyn mice (n = 9) and their wildtype (WT) littermates (n = 9) at 9.5–10.5 months of age underwent a single survival surgery to subcutaneously implant a telemetry device (Data Sciences International, St. Paul, MN). Mice were anesthetized with isoflurane and placed in a stereotaxic frame to fix the body in a prone position. The skin was incised with a sterile scalpel (2-3 cm incision) along the dorsal midline from the posterior margin of the eyes to a point midway between the scapulae. Using small, blunt-tipped, dissecting scissors, a subcutaneous pocket was formed along the animal’s dorsal flank for placement of a TL1M2-F20-EET transmitter (Data Sciences International, St. Paul, MN). The two leads for measuring EEGs were implanted epidurally. Using a handheld drill (0.9 mm micro drill bit) under aseptic conditions, two burr holes were made in the skull: the first at +1.0 mm anterior and 1.0 mm lateral to Bregma, the second 3.0 mm posterior and 3.0 mm lateral to Bregma on the contralateral side. The burr holes were then each fitted with a dental screw (00-96 X 1/16 inch), and an exposed portion of the two EEG leads were wrapped around the dental screws (one lead per screw) and secured with dental acrylic. The two EMG leads were placed in direct contact with the cervical trapezius muscle, approximately 1-2 mm apart along the same bundle of muscle fibers. The skin incision was closed using 5-0 nylon sutures. Animals were individually housed and allowed 7 days to recover.
EEG/EMG acquisition
After recovery from surgery, electroencephalograms (EEG) and electromyograms (EMG) were recorded continuously for 5 days from the freely moving animals. All recordings took place in a designated area with minimal noise or other background disturbances; furthermore, animals were housed within horizontal light-tight wooden cabinets equipped with fans that allowed for proper ventilation, temperature and humidity, and light timers to maintain a strict 12:12 h light/dark cycle. Animals were housed individually in standard plexiglass home cages on receiver plates (RPC1, DSI, MN) that sent the EEG and EMG waveform data via an exchange matrix (DSI, MN) to a computer installed with Dataquest ART 4.1 software (DSI, MN) set to a continuous sampling mode. The data were collected at a sampling rate of 250 Hz. The analog signal was converted to a digital signal and stored for future analysis. An experimenter that was unaware of animal genotype completed all surgical procedures and telemetry recordings.
Analysis of EEG and EMG data
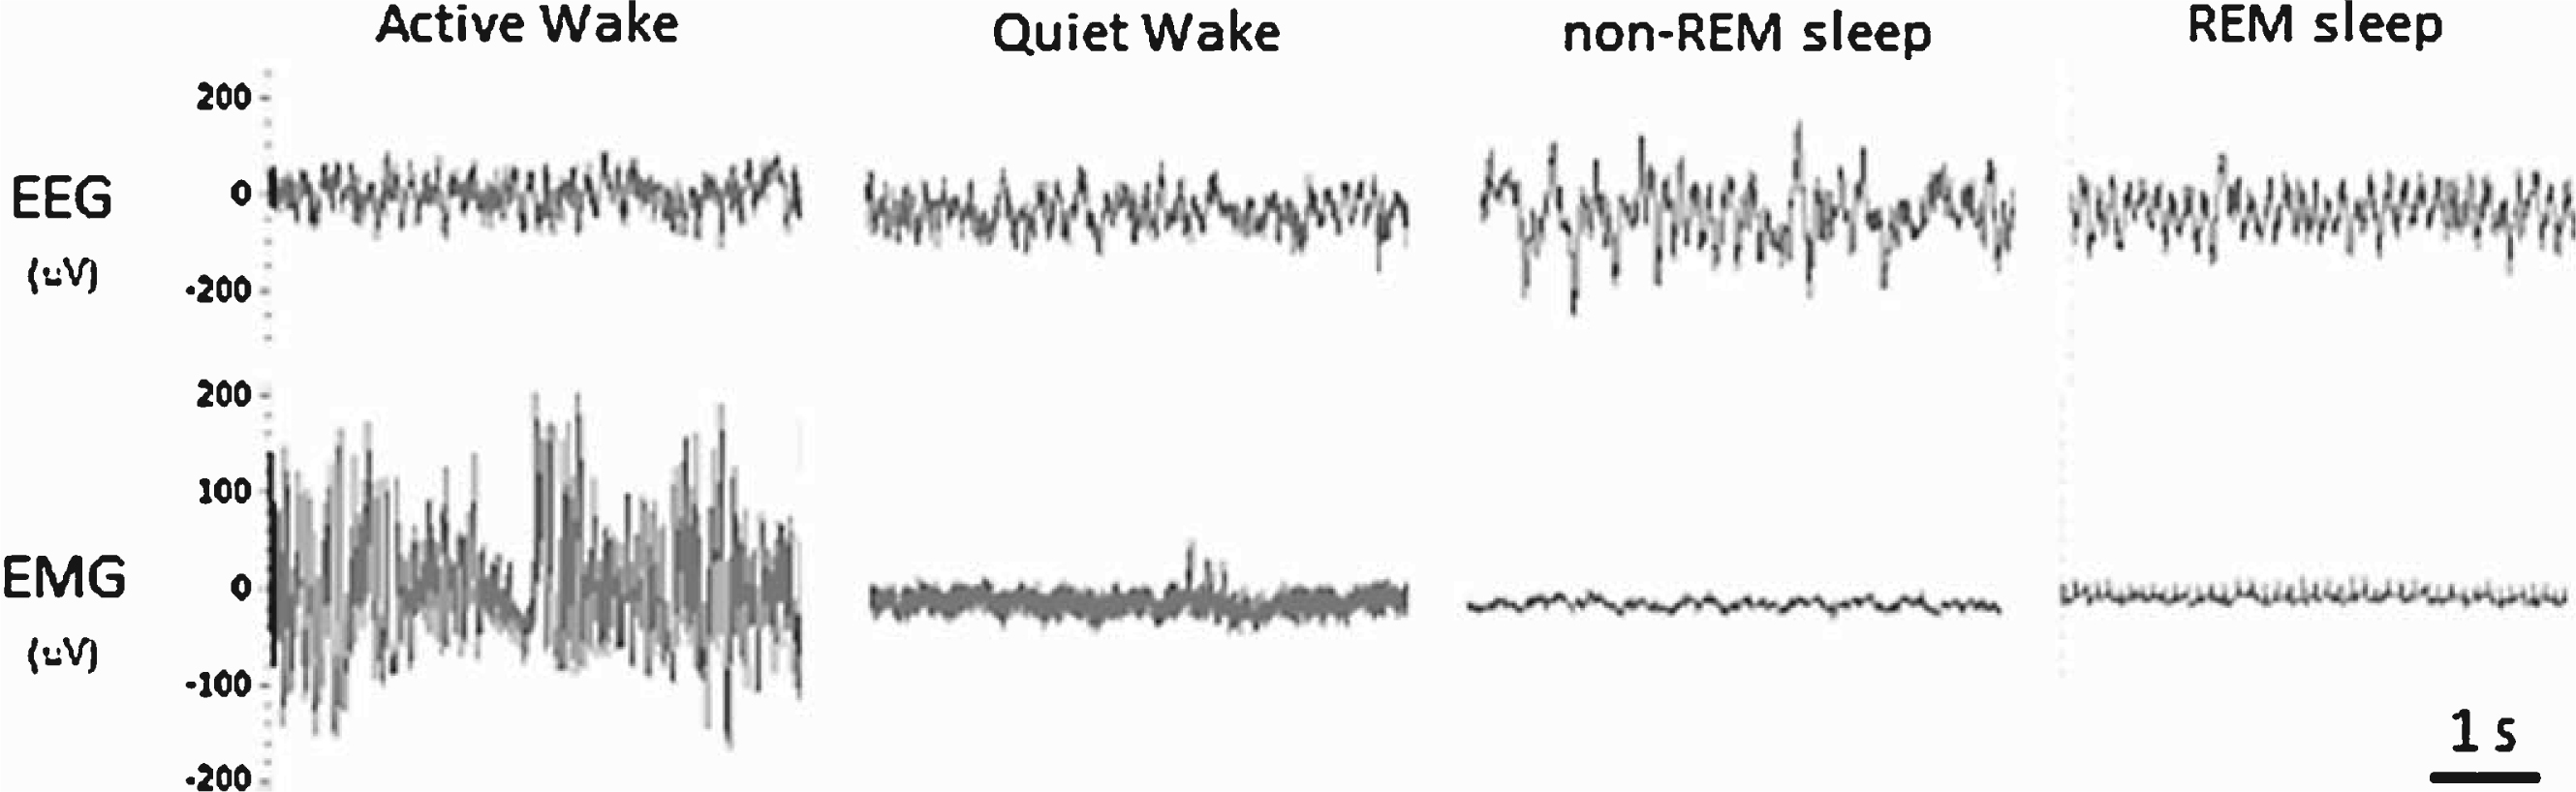
Previous studies have established that non-tethered EEG/EMG telemetry recordings can be reliably generated to assess vigilance states (wakefulness, non-REM sleep, REM sleep) in mice [13, 14]. Unlike humans, who are diurnal and exhibit consolidated sleep, mice are nocturnal and exhibit circadian intervals of activity/rest cycles. However, mice accumulate the majority of their wakefulness in the dark period (lights off) and the majority of their sleep in the light period (lights on); therefore, for clarity these phases will be referred to as the active and quiescent phases, respectively. One 24-h period (12-h light/dark cycle; day 3 out of 5 total days recorded) was manually scored using Neuroscore software (DSI, MN) into 10-sec epochs of wake, non-REM sleep, or REM sleep. Wakefulness was characterized by low-amplitude EEG with mixed high-frequency components combined with high-amplitude EMG. Whole-body movements detected by short transistor–transistor logic (TTL) pulses were automatically recorded from each transmitter and reported as counts per minute, providing a relative measure of activity (not an absolute measure of distance traveled). Thus, wake was further categorized into active wake (presence of a TTL pulse) and quiet wake (absence of a TTL pulse). Non-REM sleep was characterized by a relative increase in EEG amplitude consisting of mainly delta and theta frequency components combined with low-EMG tone. REM sleep was characterized by a low-amplitude theta-based EEG combined with muscle atonia and occasional muscle twitches (Fig. 1). Electrooculography was not used to classify REM sleep in this study. Lastly, the EEG/EMG signal quality obtained with the telemetry system/electrode placement enabled a trained analyst to confidently classify vigilance states with minimal artefacts (<0.1% of all recordings). All 10 sec-epochs for each stage of sleep were distributed into 2-h bins for each 12-h quiescent and active phase. To further explore changes in sleep/wake architecture, we calculated the number and mean duration of bouts for each vigilance state. These data were then averaged over 2-h intervals. Total sleep time (TST) was defined as the sum of the time spent in non-REM sleep and REM sleep over each 12-h period. Sleep efficiency was defined as the percentage of time spent in non-REM sleep and REM sleep out of each 12-h period. Sleep onset latency was defined as the average latency from wakefulness to non-REM sleep. Sleep fragmentation was defined as the number of arousals from non-REM sleep or REM sleep over each 12-h period. To access any differences in the EEG power spectrum between animals, we completed a FFT using the Neuroscore software to obtain the power density values for each frequency bin (delta = 1–4 Hz, theta = 4–8 Hz, alpha = 8–12 Hz, beta = 16–24 Hz, gamma = 25–50 Hz) within each vigilant state (wake, non-REM sleep, REM sleep). These data were then expressed as a percentage of the mean total power across all frequency bins and then averaged over the 12-h quiescent and active phase.
Fig.1
Representative examples of the EEG and EMG waveforms used for manually scoring the vigilant states of mice.
Statistics
The 12-h binned data used to compile Table 1 were analyzed with a two-tailed Student’s t-test. All other data were analyzed using a two-way, repeated measures ANOVA. For the vigilant state and sleep-wake bouts, the independent variables were defined as genotype and zeitgeber time (ZT). For the EEG power spectra data, the independent variables were defined as genotype and power band frequency. Multiple comparisons were analyzed with the Tukey test. A power analysis was performed to determine the required group size to detect either a 30% or a 50% drug effect (80% power, 5% alpha level) in future pre-clinical drug studies in Thy1-aSyn mice. Statistical tests were conducted using SigmaPlot Version 12.0, and values of p < 0.05 were considered significant.
Table 1
Summary of additional sleep parameters in Thy1-aSyn and WT mice for the active phase (grey) and the quiescent phase (white). Total sleep time (TST) was defined as the sum of the time spent in non-REM sleep and REM sleep over each 12-h period. Sleep efficiency was defined as the percentage of time spent in non-REM sleep and REM sleep out of each 12-h period. Sleep onset latency was defined as the average latency from wakefulness to non-REM sleep. Sleep fragmentation was defined as the number of arousals from non-REM sleep or REM sleep over each 12-h period. Data are expressed as the mean ± S.E.M. Data were analyzed using a two-tailed Student’s t-test (*p < 0.05, n = 9 WT, n = 9 Thy1-aSyn)
| Parameter | WT | Thy1-aSyn | p-value |
| Total sleep time (min) | 321.3±19.6 | 270.1±27.2 | 0.15 |
| Sleep efficiency (%) | 44.6±2.7 | 37.5±3.8 | 0.15 |
| Sleep onset latency (min) | 7.9±0.6 | 14.8±2.4* | 0.01 |
| Sleep fragmentation (bout #) | 145±10 | 86±11* | 0.001 |
| Total sleep time (min) | 400.1±20.3 | 455.0±17.4 | 0.06 |
| Sleep efficiency (%) | 55.6±2.8 | 63.2±2.4 | 0.06 |
| Sleep onset latency (min) | 5.8±0.6 | 4.9±0.6 | 0.31 |
| Sleep fragmentation (bout #) | 152±8 | 135±8 | 0.15 |
RESULTS
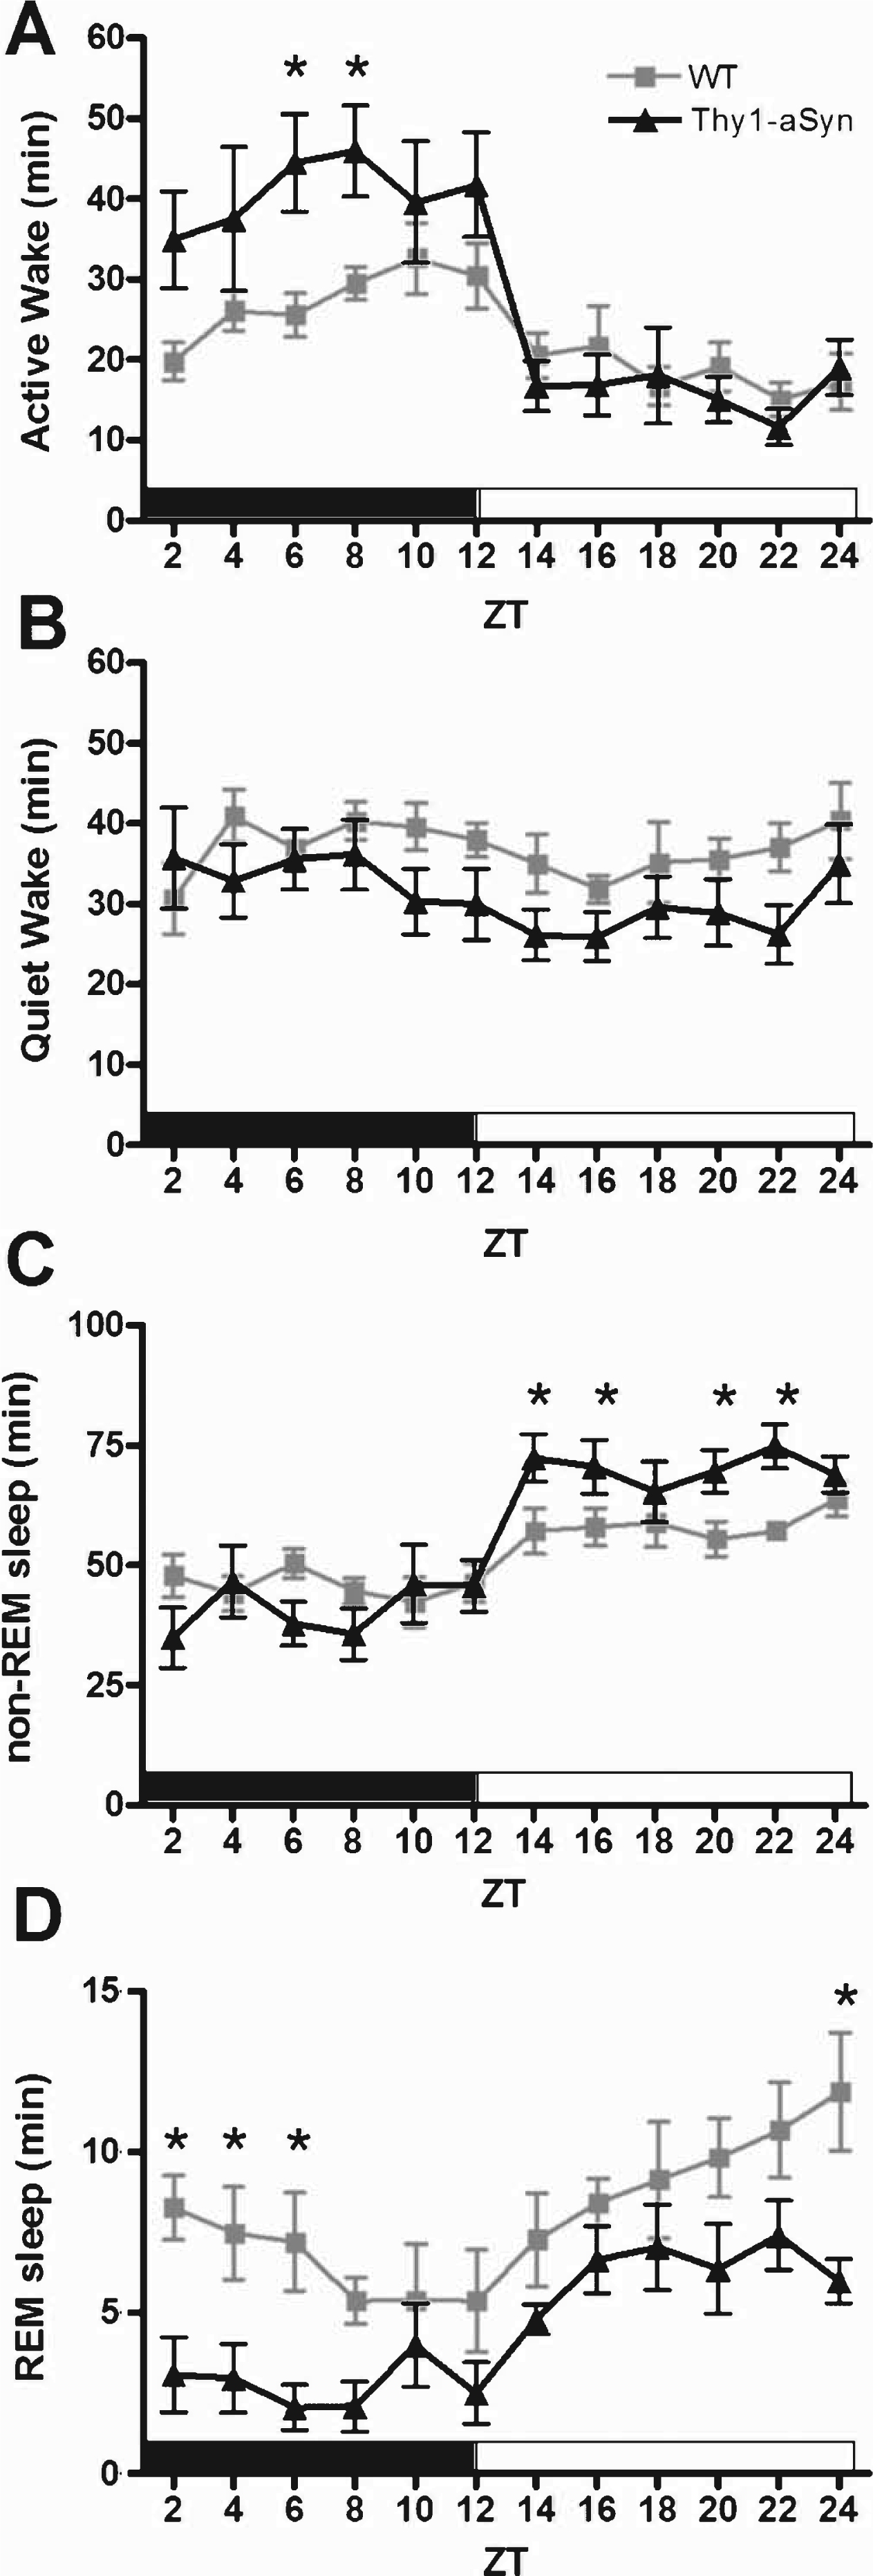
Mice exhibit regular intervals of activity-rest cycles throughout a 24-h period; however, they accumulate the majority of their wakefulness in the dark period and the majority of their sleep in the light period. Analysis of a 24-h period consisting of 12 h of dark (active phase) and 12 h of light (quiescent phase) revealed abnormalities in the sleep/wake activity of Thy1-aSyn mice when compared with WT littermates (Fig. 2). During the active phase, Thy1-aSyn mice spent significantly more time in Active Wake (Fig. 2A, F (1,16) = 6.3, p = 0.023) and less time in REM sleep (Fig. 2D, F (1,16) = 10.3, p = 0.005) when compared with controls. During the quiescent phase, Thy1-aSyn mice show a significant increase in the amount of time they spent in non-REM sleep (Fig. 2C, F (1,16) = 10.2, p = 0.006) and a significant decrease in the time spent in REM sleep (Fig. 2D, F (1,16) = 7.6, p = 0.014) when compared with WT littermates.
Fig.2
Sleep/wake activity of WT and Thy1-aSyn mice. The data are shown as the mean duration of time (min)±S.E.M. spent in Active Wake (A), Quiet Wake (B), non-REM sleep (C), and REM sleep (D) in 2-h bins for the active phase (black bar) and quiescent phase (white bar). Data were analyzed using a two-way, repeated measures ANOVA with Tukey’s multiple comparisons (*p<0.05, n = 9 WT, n = 9 Thy1-aSyn).
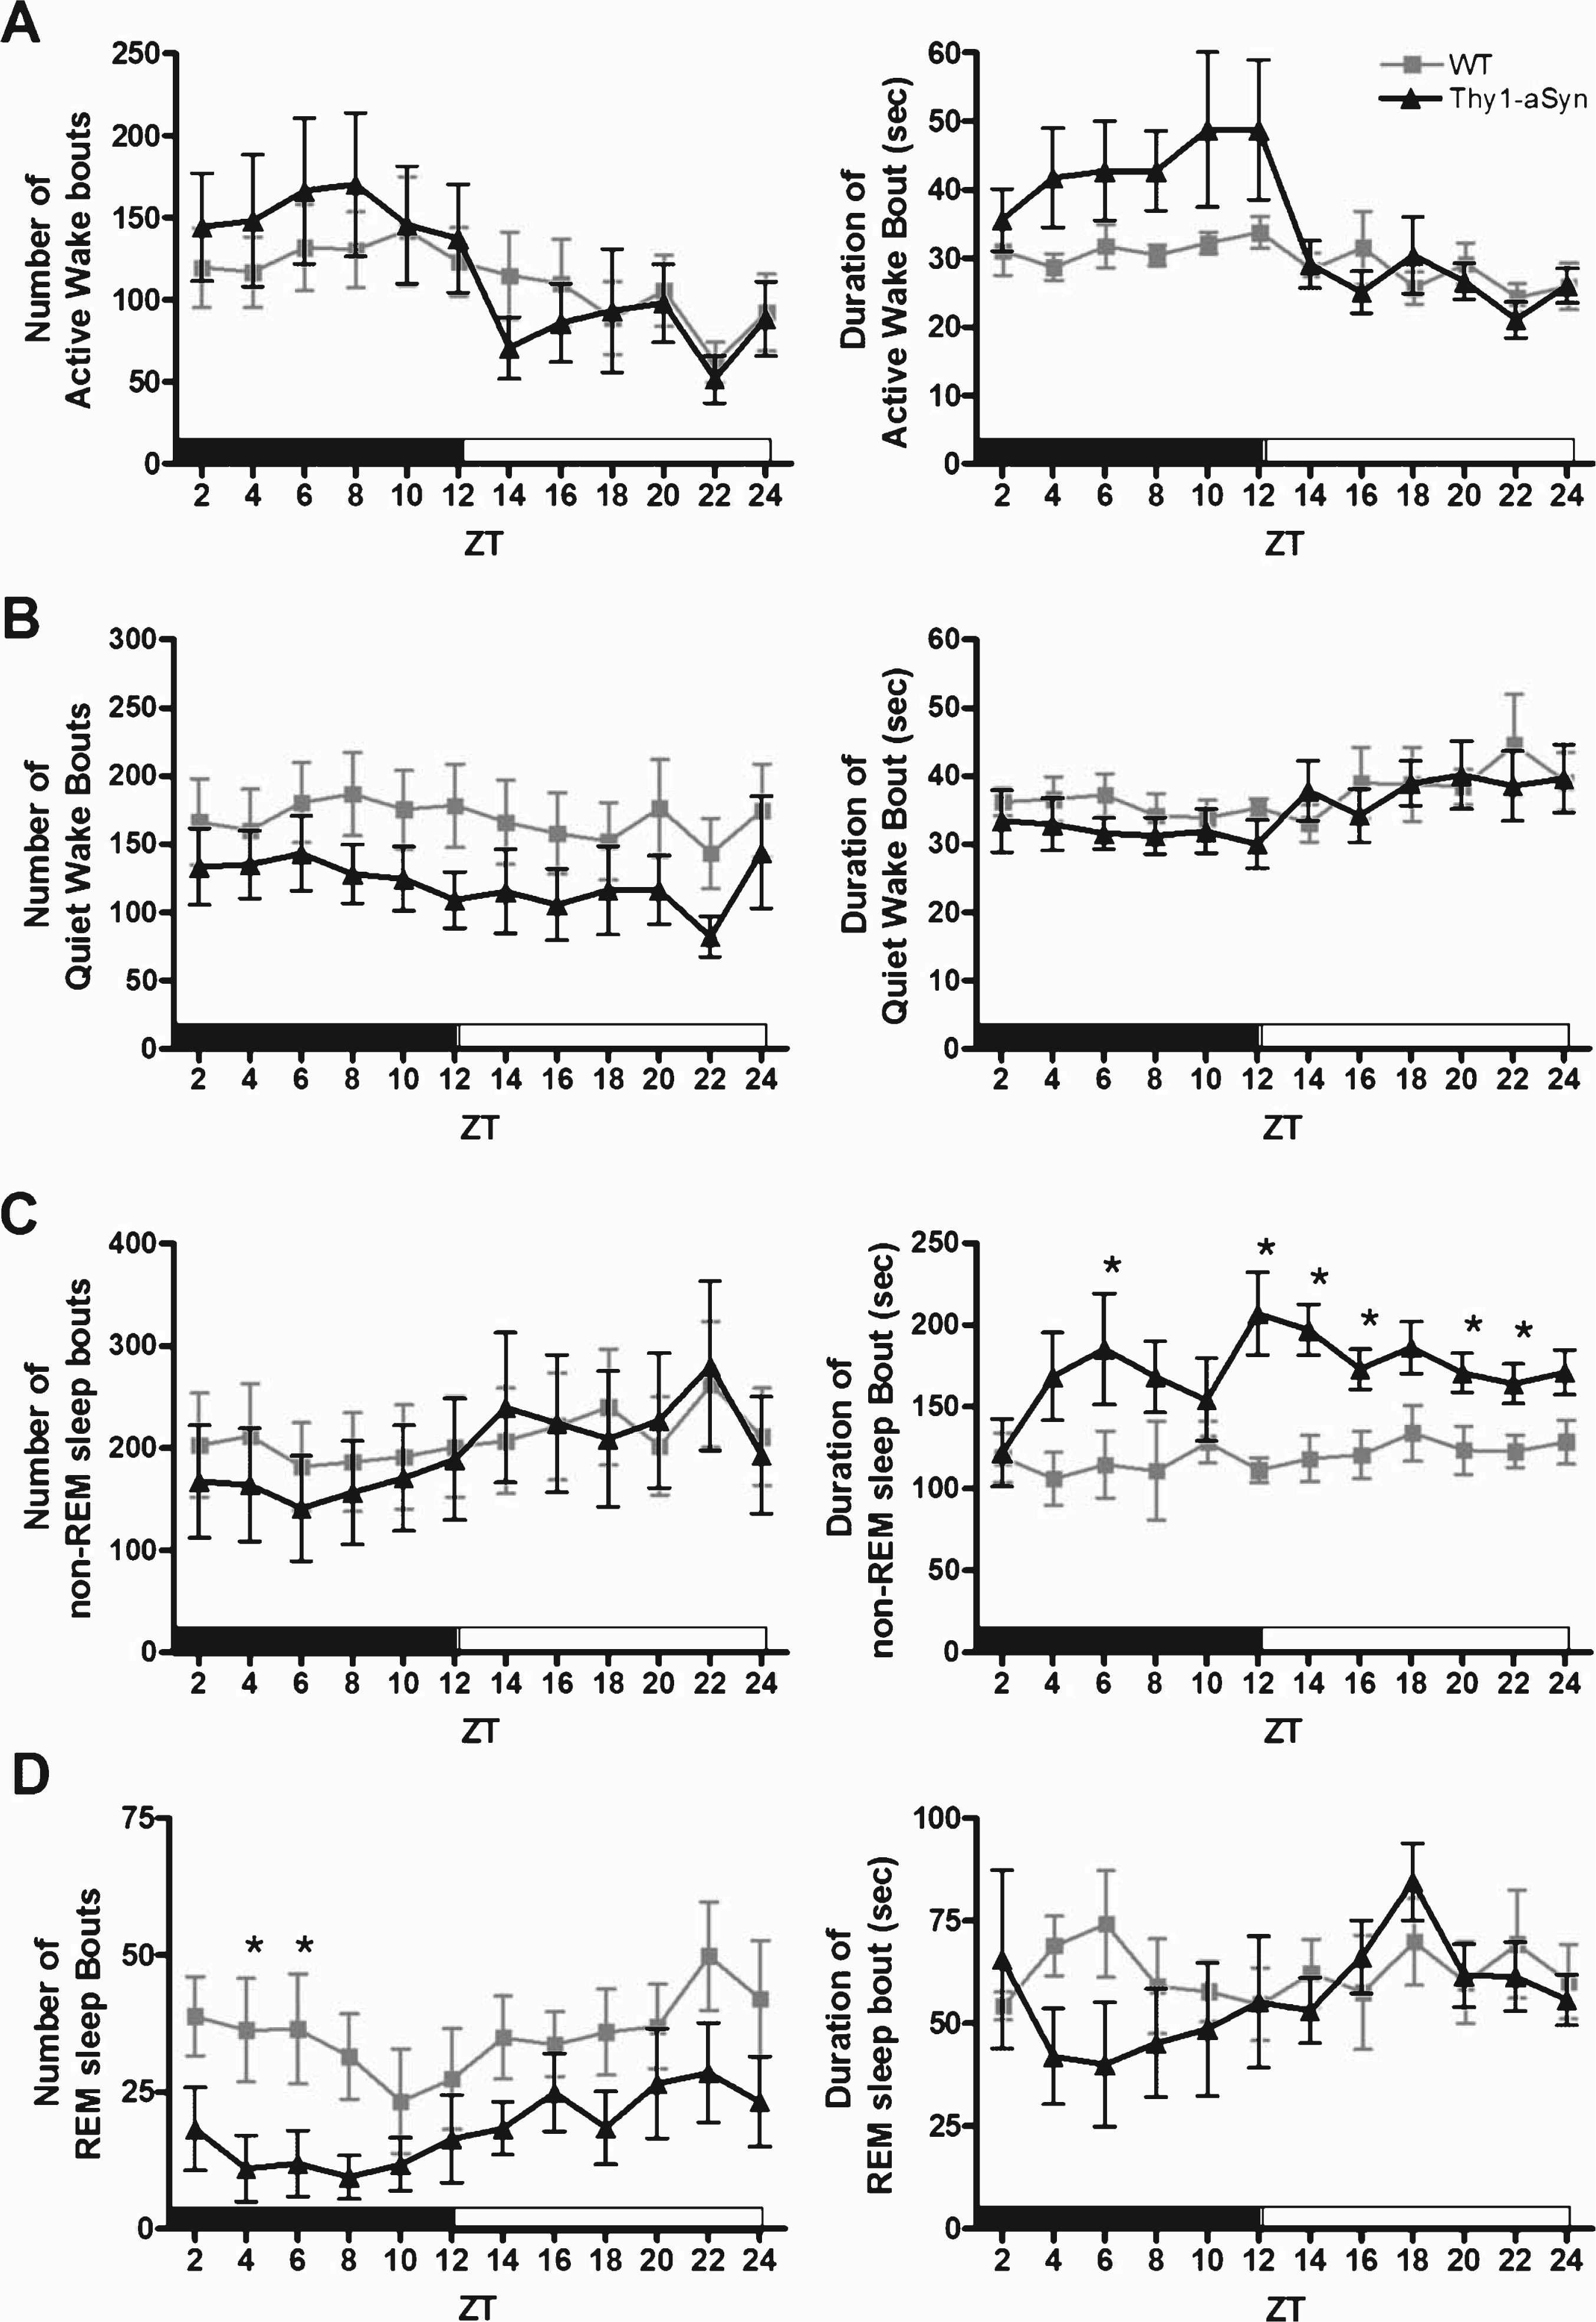
To further characterize the observed alterations in vigilant states, we analyzed the sleep/wake architecture of the mice (Fig. 3 and Table 1). In the active phase, there were no significant differences in the number of bouts or mean length for Active Wake (Fig. 3A, F (1,16) = 1.4, p = 0.25 and F (1,16) = 3.1, p = 0.099, respectively) or Quiet Wake (Fig. 3B, F (1,16) = 1.5, p = 0.24 and F (1,16) = 0.01, p = 0.91, respectively). However, Thy1-aSyn mice showed a significant increase in sleep onset latency (time spent in Active Wake and Quiet Wake before entering non-REM sleep) during the active phase when compared with WT mice (Table 1, p = 0.01). We found a significant increase in non-REM sleep bout length (Fig. 3C, F (1,16) = 11.4, p = 0.004); in addition, the Thy1-aSyn mice spent less time in REM sleep because of a significant decrease in the number of bouts (Fig. 3D, F (1,16) = 4.6, p = 0.047) without a significant decrease in bout length (Fig. 3D, F (1,16) = 3.2, p = 0.093). Analysis of sleep fragmentation also revealed a significant decrease in the number of awakenings from sleep in Thy1-aSyn mice when compared with their WT littermates (Table 1, p = 0.001). Taken together, these data show that during their active phase, Thy1-aSyn mice enter into bouts of REM sleep less often because of longer bout lengths of non-REM sleep when compared with WT mice. In the quiescent phase, the significant increase in non-REM sleep was also due to an increase in bout length (Fig. 3C, F (1,16) = 24.8, p < 0.001). There were no significant differences in the number of bouts or mean length for REM sleep (Fig. 3D, F (1,16) = 2.6, p = 0.13 and F (1,16) = 0.002, p = 0.96, respectively) in the quiescent phase between groups. Based on the general patterns of sleep architecture in Thy1-aSyn mice, their sleep dysregulation is not due to sleep fragmentation (i.e., increased number of awakenings or bouts of specific vigilant states), but rather due to a change in the overall time spent in each vigilant state (i.e., increase in mean bout length).
Fig.3
Sleep architecture of WT and Thy1-aSyn mice. The data are shown as the mean and S.E.M. of each sleep-wake bout (mean number of bouts and mean bout duration in seconds) for Active Wake (A), Quiet Wake (B), non-REM sleep (C), and REM sleep (D) in 2-h bins for the active phase (black bar) and quiescent phase (white bar). Data were analyzed using a two-way, repeated measures ANOVA with Tukey’s multiple comparisons (*p < 0.05, n = 9 WT, n = 9 Thy1-aSyn).
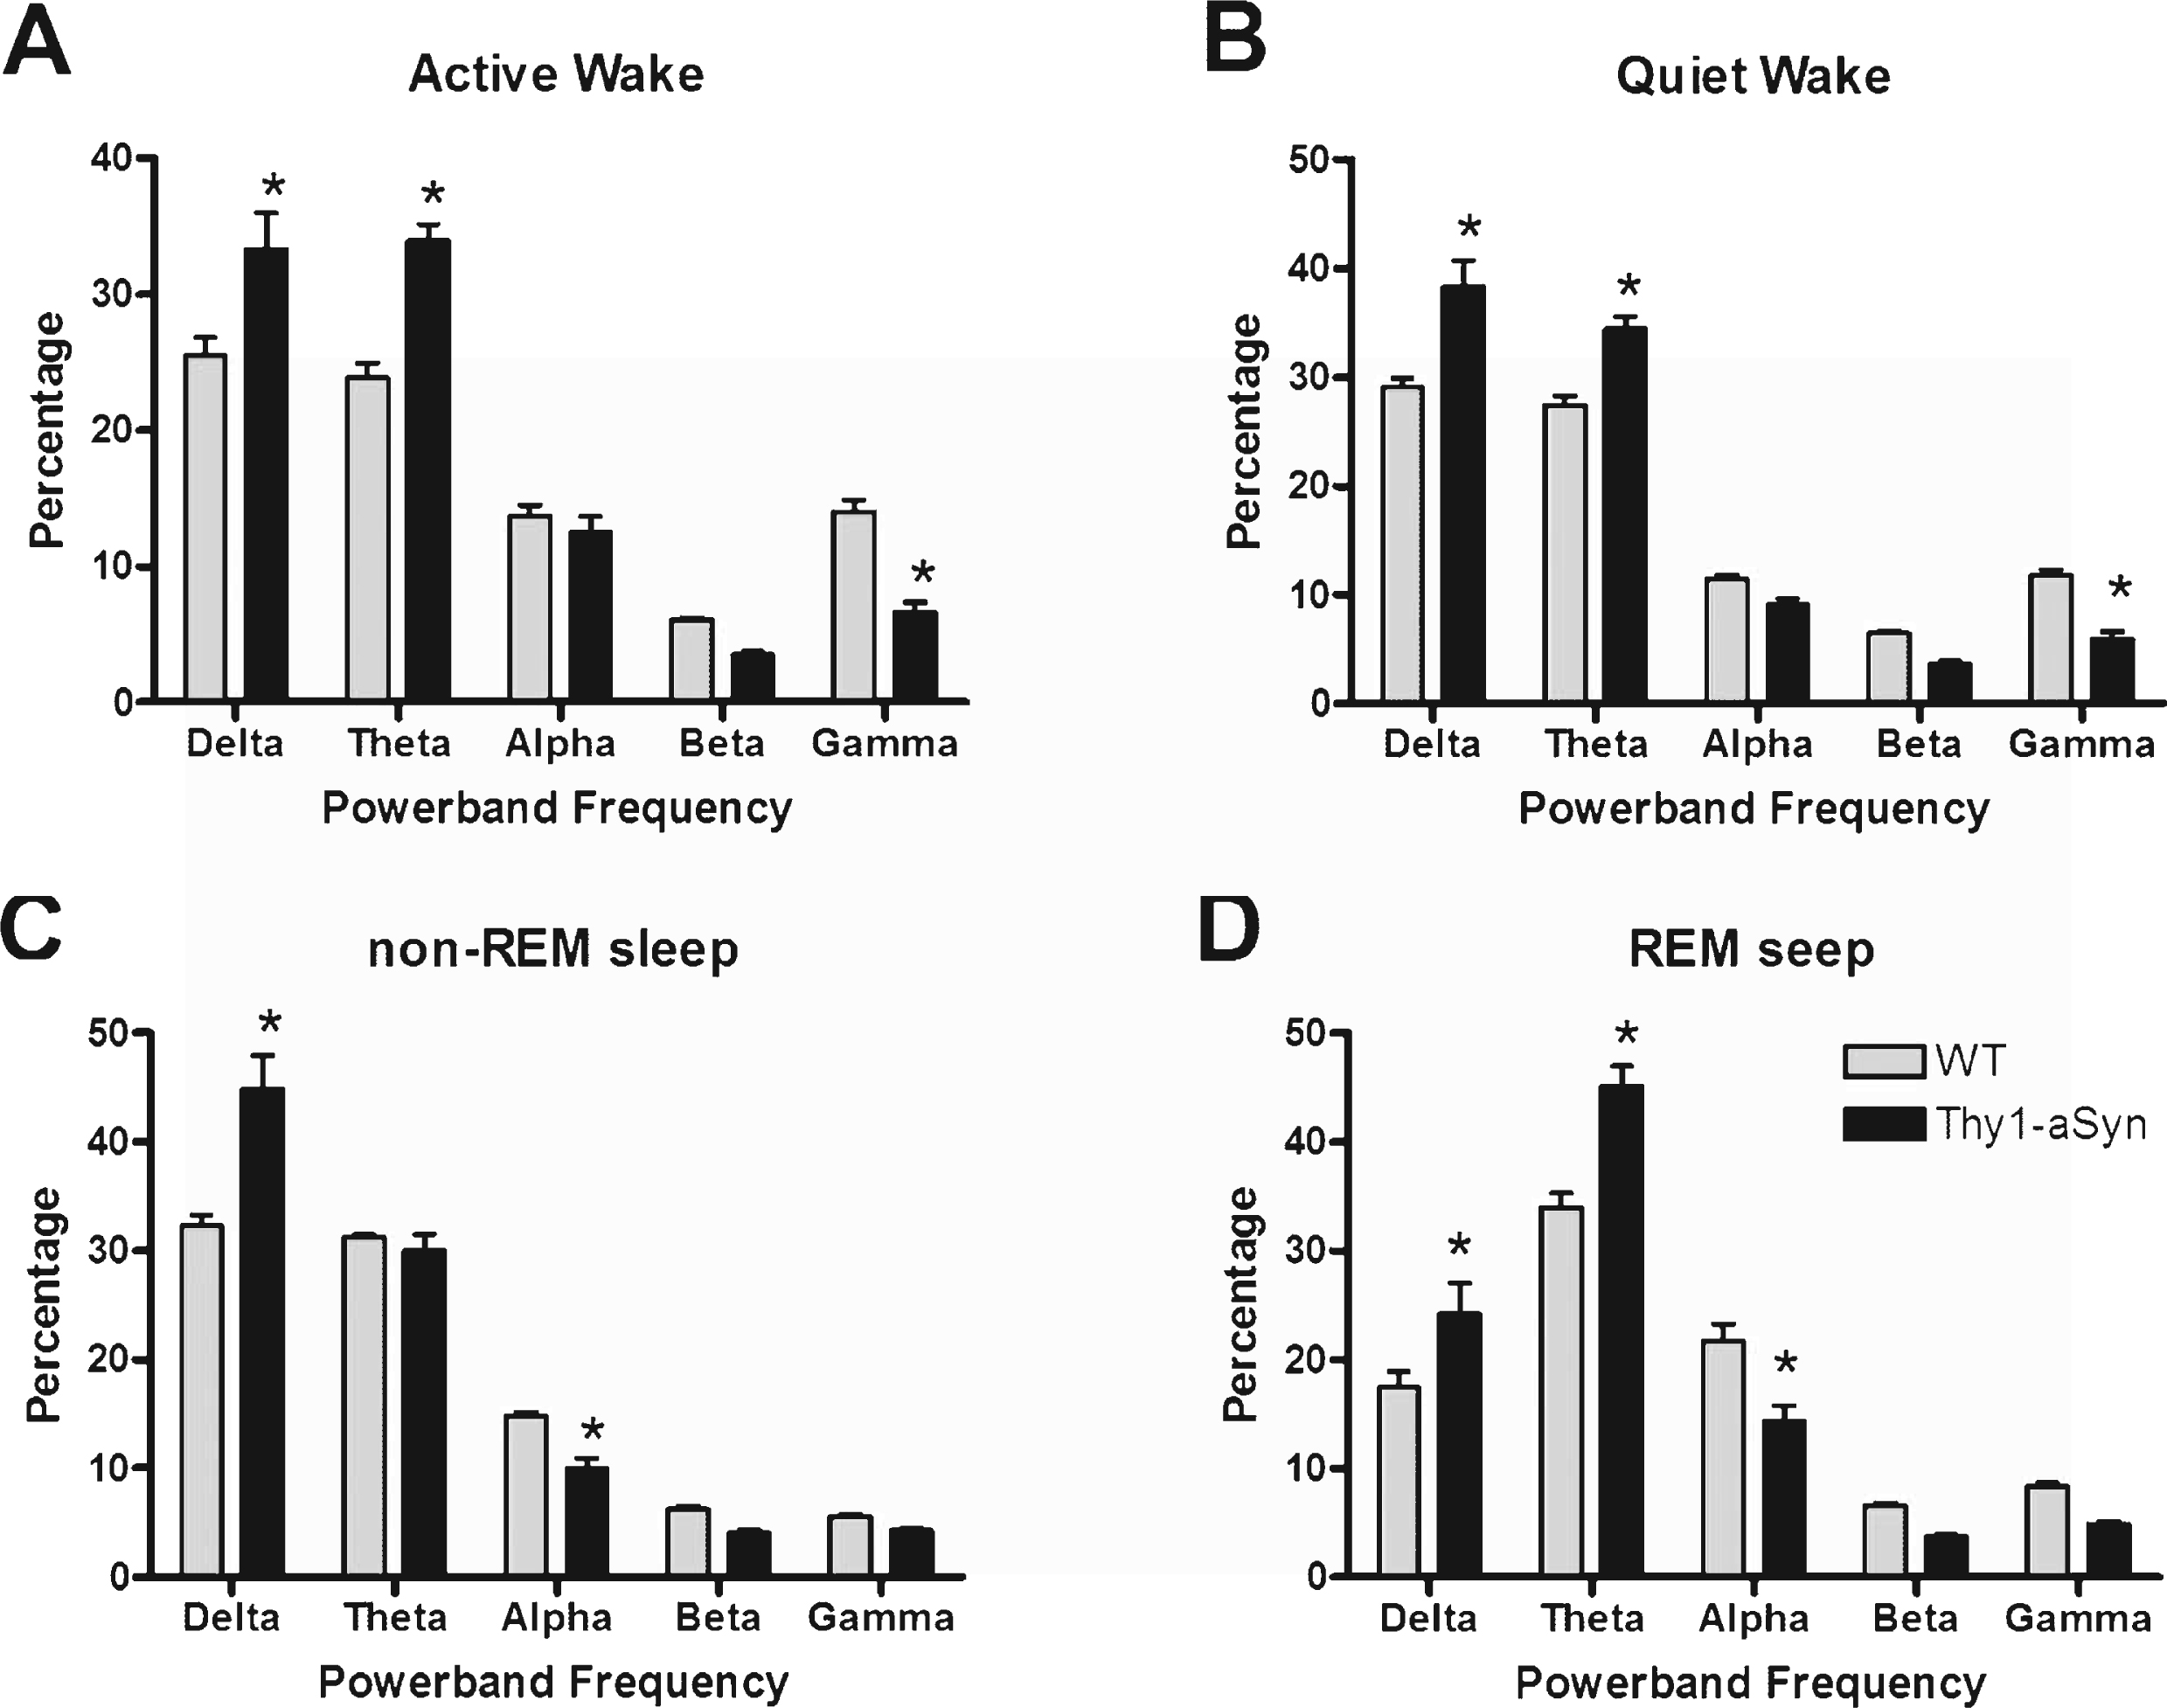
To access any differences in the EEG spectrum between animals, we examined the relative power density within each vigilant state. Generally, Thy1-aSyn mice show a shift in the density of their power spectra toward lower frequencies (Fig. 4). Thy1-aSyn mice show an increase in delta and theta power and a decrease in gamma power during bouts of either Active Wake (Fig. 4A, F (1,16) = 20.6, p = 0.0003) or Quiet Wake (Fig. 4B, F (1,16) = 23.2, p = 0.0002) when compared with WT littermates. During bouts of non-REM sleep, Thy1-aSyn mice show an increase in delta power and a decrease in alpha power (Fig. 4C, F (1,16) = 45.3, p < 0.0001) when compared with WT. During bouts of REM sleep, Thy1-aSyn mice show an increase in delta and theta power and a decrease in alpha power (Fig. 4D, F (1,16) = 56.1, p < 0.0001) when compared with WT littermates. The light cycle (i.e., whether the mouse was in its active phase or quiescent phase) did not influence the differences observed between groups. Taken together, these data show that Thy1-aSyn mice exhibit significant alterations in their general cortical EEG activity.
Fig.4
EEG power spectra densities of WT and Thy1-aSyn mice. The data were calculated as the percentage of each frequency bin out of the mean total power across all frequency bins. The results are shown as the mean and S.E.M. for the relative EEG power spectra densities for Active Wake (A), Quiet Wake (B), non-REM sleep (C), and REM sleep (D). Data were analyzed using a two-way, repeated measures ANOVA with Tukey’s multiple comparisons (*p < 0.05, n = 9 WT, n = 9 Thy1-aSyn).
Upon completion of this study, we conducted a power analysis to determine if the alterations in sleep/wake activity and power spectra data were robust enough for use as an endpoint measure in future pre-clinical studies of novel therapeutics (factorial ANOVA design, 80% power, 5% alpha level) (Table 2). We determined that the sample size needed to detect a genotype effect on the time spent in each vigilant state the study would vary between 2 and 16 mice, with the larger group needed to detect a change in time spent in quiet wake. Based on these data in Thy1-aSyn mice, the study would require between 2 and 10 mice per group to detect a 50% drug effect, and a group of 6 would be sufficient to detect a 30% drug effect on time spent in non-REM sleep. For the EEG power spectra data, detection of a genotype effect would require 3 to 11 mice per group except for the relative percentage of alpha, which would require an unpractical number of subjects. To detect a 50% drug effect on these data in Thy1-aSyn mice, the study would require groups of 3 to 12 mice, and a 30% drug effect could be observed for most measures with 14 or less mice.
Table 2
Power analyses of sleep/wake activity and EEG spectral parameters (factorial ANOVA design, alpha level of 0.05, 80% power)
| Parameter | Sample size for genotype effect | Sample size for 30% drug effect | Sample size for 50% drug effect |
| Sleep/Wake Activity | |||
| Time spent in Active Wake (min) | 14 | 28 | 10 |
| Time spent in Quiet Wake | 16 | 30 | 11 |
| Time spent in non-REM sleep | 10 | 6 | 2 |
| Time spent in REM sleep | 2 | 19 | 7 |
| EEG Spectra | |||
| Delta relative percentage | 11 | 8 | 4 |
| Theta relative percentage | 4 | 4 | 3 |
| Alpha relative percentage | 91 | 14 | 6 |
| Beta relative percentage | 3 | 11 | 5 |
| Gamma relative percentage | 3 | 29 | 12 |
DISCUSSION
Despite the frequency of sleep disorders in PD, few rodent models of the disease exhibit significant alterations in sleep/wake activity [15]. Here, we report that 9-10 month-old Thy1-aSyn accumulate less REM sleep over a 24-h period, and decreased REM sleep has been reported as a symptom of PD [16]. In addition, the alpha-synuclein overexpressing mice show a significant increase in non-REM sleep during the quiescent phase and an increase in active wake during the active phase. Our quantitative assessment of the sleep/wake activity supports recent work in the Thy1-aSyn mice that described deficits in circadian rhythms characterized by lower night-time activity with a greater fragmentation in wheel-running [10]. To our knowledge, this is the first report of altered sleep architecture in a mouse model of synucleinopathy. Mice overexpressing the A53T mutation of alpha-synuclein displayed an increase in activity and a decrease in estimated total sleep time; however, this study did not quantitatively access EEG/EMG activity to distinguish alterations in specific vigilant states [17]. Interestingly, two laboratories have recently published a quantitative assessment of sleep patterns and EEG disturbances in the R6/2 mouse model of Huntington’s disease. Kantor et al. found that the R6/2 mice exhibited a progressive fragmentation of wakefulness and increased REM sleep. In addition, abnormal gamma activity was found at an older age [18]. Fisher et al. findings also found an increase in sleep fragmentation. Of note, the increases in beta and gamma activity in the EEG of R6/2 mice developed prior to the symptomatic phase of the disease [19]. Based on this work and the findings from our current study, future longitudinal and quantitative analyses of EEG and sleep patterns in animal models of neurodegeneration will be a valuable tool for differentiating the specific mechanisms behind the pathogenesis of multiple diseases.
Similar to the R6/2 mice, the sleep alterations we have observed in the Thy1-aSyn mice occur months before these mice show deficits in striatal dopamine and hypoactivity [20]. Even though studies have shown that DA depletion significantly diminishes REM sleep [20, 21], the role of DA and DAergic nuclei (i.e., substantia nigra) in sleep/wake regulation remains unclear [22]. For example, an acute partial reduction ( 60%) of striatal DA levels can induce a decrease in REM sleep without significant changes in motor behavior [21], which is consistent with the development of sleep disruptions in PD patients prior to the presentation of motor symptoms. However, pathological studies strongly suggest that dopamine depletion may not be the only or even the primary culprit for sleep disturbances in PD. The occurrence of motor symptoms in PD is preceded by an extended pre-manifest phase, which likely corresponds to the progressive accumulation of alpha-synuclein pathology in peripheral and central neurons [7]. Sleep disturbances are one of the many non-motor deficits that may precede the onset of motor symptoms, and they may be related to pathology in brain regions involved in sleep regulation, such as the raphe nuclei, the locus coeruleus, and the pedunculopontine nucleus [23]. The Thy1-aSyn mice show proteinase K-resistant aggregates of alpha-synuclein from a young age in the locus coeruleus [23], which may be related to the neuronal dysfunction and sleep disorders we observed in these mice. Indeed, the brainstem, including the cholinergic pedunculopontine nucleus, is a key player in the initiation and maintenance of REM sleep [24, 25]. Furthermore, patients that underwent deep brain stimulation of this area display increased REM sleep [26, 27]. Further elucidation of the brain nuclei involved in the sleep deficits found in the Thy1-aSyn mouse model will help to advance our understanding and treatment of the earlier stages of PD.
Our EEG analysis also revealed significant alterations in the EEG power spectra of Thy1-aSyn mice, with a significant shift towards lower frequencies and a decrease in gamma activity. Previous EEG studies in PD patients have shown an increased incidence of abnormalities (i.e., slowing of the EEG) that may relate to memory deficits and cognitive dysfunction [28, 29], with a greater frequency of EEG slowing in patients with severe cognitive impairment [30]. Indeed, decreasing cognitive performance was associated with increases in delta and theta power, and decreases in alpha and gamma power in PD patients, whereas motor impairment correlated only with an increase in theta power [31]. However, a widespread slowing of oscillatory brain activity can already be observed in the pre-manifest phase of PD, long before any evidence of dementia, and may result from the degeneration of noradrenergic or serotonergic corticopetal projections arising in the brainstem [32]. Interestingly, the Thy1-aSyn mice show progressive, early cognitive deficits [33], and these deficits could be related to our EEG observations.
In conclusion, our data indicate that alpha-synuclein overexpression is sufficient to produce sleep disorders, a frequent and early symptom of PD. Furthermore, pervasive EEG power spectra anomalies point to widespread cortical and/or hippocampal network dysfunction in this model that is reminiscent of EEG slowing observed in patients. These results provide a new mouse model to elucidate the mechanisms of PD-related sleep dysfunction and develop more efficacious treatments, as indicated by the low number of animals needed to detect drug effects on many of the parameters assessed in the present study. Importantly, the high power to detect drug-induced modifications of our EEG findings will also provide an endpoint for preclinical studies in this mouse model that can be later translated to clinical studies in humans.
CONFLICT OF INTEREST
The authors have no conflict of interest to report.
ACKNOWLEDGMENTS
This work was supported by PHS grant P50 NS38367 (UCLA, Morris K. Udall Parkinson Disease Research Center of Excellence), the UCLA Training Program in Neural Repair (T32 NS07449) and a gift from Richard and Dana Pachulski.
REFERENCES
[1] | Dorsey ER , Constantinescu R , Thompson JP , Biglan KM , Holloway RG , Kieburtz K , Marshall FJ , Ravina BM , Schifitto G , Siderowf A , & Tanner CM ((2007) ) Projected number of people with Parkinson disease in the most populous nations, 2005 through 2030. Neurology, 68: , 384–386. |
[2] | Iranzo A ((2011) ) Sleep-wake changes in the premotor stage of Parkinson disease. J Neurol Sci, 310: , 283–285. |
[3] | Bassetti CL ((2011) ) Nonmotor disturbances in Parkinson’s disease. Neurodegener Dis, 8: , 95–108. |
[4] | Breen DP , Vuono R , Nawarathna U , Fisher K , Shneerson JM , Reddy AB , & Barker RA ((2014) ) Sleep and circadian rhythm regulation in early Parkinson disease. JAMA Neurol, 71: (5), 589–595. |
[5] | Arnulf I , Konofal E , Merino-Andreu M , Houeto JL , Mesnage V , Welter ML , Lacomblez L , Golmard JL , Derenne JP , & Agid Y ((2002) ) Parkinson’s disease and sleepiness: An integral part of PD. Neurology, 58: , 1019–1024. |
[6] | Abbott RD , Ross GW , White LR , Tanner CM , Masaki KH , Nelson JS , Curb JD , & Petrovitch H ((2005) ) Excessive daytime sleepiness and subsequent development of Parkinson disease. Neurology, 65: , 1442–1446. |
[7] | Dhawan V , Healy DG , Pal S , & Chaudhuri KR ((2006) ) Sleep-related problems of Parkinson’s disease. Age Ageing, 35: , 220–228. |
[8] | Braak H , Muller CM , Rub U , Ackermann H , Bratzke H , de Vos RA , & Del Tredici K ((2006) ) Pathology associated with sporadic Parkinson’s disease–where does it end? J Neural Transm Suppl, 89–97. |
[9] | Chesselet MF , Richter F , Zhu C , Magen I , Watson MB , & Subramaniam SR ((2012) ) A progressive mouse model of Parkinson’s disease: The Thy1-aSyn (“Line 61”) mice. Neurotherapeutics, 9: , 297–314. |
[10] | Kudo T , Loh DH , Truong D , Wu Y , & Colwell CS ((2011) ) Circadian dysfunction in a mouse model of Parkinson’s disease. Exp Neurol, 232: , 66–75. |
[11] | Rockenstein E , Mallory M , Hashimoto M , Song D , Shults CW , Lang I , & Masliah E ((2002) ) Differential neuropathological alterations in transgenic mice expressing alpha-synuclein from the platelet-derived growth factor and Thy-1 promoters. J Neurosci Res, 68: , 568–578. |
[12] | Baker FC , & Driver HS ((2007) ) Circadian rhythms, sleep, and the menstrual cycle. Sleep Med, 8: , 613–622. |
[13] | Tang X , & Sanford LD ((2002) ) Telemetric recording of sleep and home cage activity in mice. Sleep, 25: , 691–699. |
[14] | Morrow JD , & Opp MR ((2005) ) Sleep-wake behavior and responses of interleukin-6-deficient mice to sleep deprivation. Brain Behav Immun, 19: , 28–39. |
[15] | McDowell K , & Chesselet MF ((2012) ) Animal models of the non-motor features of Parkinson’s disease. Neurobiol Dis, 46: , 597–606. |
[16] | Adler CH , & Thorpy MJ ((2005) ) Sleep issues in Parkinson’s disease. Neurology, 64: , S12–S20. |
[17] | Rothman SM , Griffioen KJ , Vranis N , Ladenheim B , Cong W , Cadet J-L , Haran J , Martin B , & Mattson MP ((2013) ) Neuronal expression of familial Parkinson’s disease A53T α-synuclein causes early motor impairment, reduced anxiety and potential sleep disturbances in mice. J Parkinsons Dis, 3: , 215–229. |
[18] | Kantor S , Szabo L , Varga J , Cuesta M , & Morton AJ ((2013) ) Progressive sleep and electroencephalogram changes in mice carrying the Huntington’s disease mutation. Brain, 136: , 2147–2158. |
[19] | Fisher SP , Black SW , Schwartz MD , Wilk AJ , Chen TM , Lincoln WU , Liu HW , Kilduff TS , & Morairty SR ((2013) ) Longitudinal analysis of the electroencephalogram and sleep phenotype in the R6/2 mouse model of Huntington’s disease. Brain, 136: , 2159–2172. |
[20] | Lena I , Parrot S , Deschaux O , Muffat-Joly S , Sauvinet V , Renaud B , Suaud-Chagny MF , & Gottesmann C ((2005) ) Variations in extracellular levels of dopamine, noradrenaline, glutamate, and aspartate across the sleep–wake cycle in the medial prefrontal cortex and nucleus accumbens of freely moving rats. J Neurosci Res, 81: , 891–899. |
[21] | Dzirasa K , Ribeiro S , Costa R , Santos LM , Lin SC , Grosmark A , Sotnikova TD , Gainetdinov RR , Caron MG , & Nicolelis MA ((2006) ) Dopaminergic control of sleep-wake states. J Neurosci, 26: , 10577–10589. |
[22] | Monti JM , & Monti D ((2007) ) The involvement of dopamine in the modulation of sleep and waking. Sleep Med Rev, 11: , 113–133. |
[23] | Fernagut PO , Hutson CB , Fleming SM , Tetreaut NA , Salcedo J , Masliah E , & Chesselet MF ((2007) ) Behavioral and histopathological consequences of paraquat intoxication in mice: Effects of alpha-synuclein over-expression. Synapse, 61: , 991–1001. |
[24] | Shouse MN , & Siegel JM ((1992) ) Pontine regulation of REM sleep components in cats: Integrity of the pedunculopontine tegmentum (PPT) is important for phasic events but unnecessary for atonia during REM sleep. Brain Res, 571: , 50–63. |
[25] | Datta S , & Siwek DF ((1997) ) Excitation of the brain stem pedunculopontine tegmentum cholinergic cells induces wakefulness and REM sleep. J Neurophysiol, 77: , 2975–2988. |
[26] | Zweig RM , Jankel WR , Hedreen JC , Mayeux R , & Price DL ((1989) ) The pedunculopontine nucleus in Parkinson’s disease. Ann Neurol, 26: , 41–46. |
[27] | Amara AW , Watts RL , & Walker HC ((2011) ) The effects of deep brain stimulation on sleep in Parkinson’s disease. Ther Adv Neurol Disord, 4: , 15–24. |
[28] | Dushanova J , Philipova D , & Nikolova G ((2010) ) Beta and gamma frequency-range abnormalities in parkinsonian patients under cognitive sensorimotor task. J Neurol Sci, 293: , 51–58. |
[29] | Soikkeli R , Partanen J , Soininen H , Paakkonen A , & Riekkinen P Sr. , ((1991) ) Slowing of EEG in Parkinson’s disease. Electroencephalogr Clin Neurophysiol, 79: , 159–165. |
[30] | Morita A , Kamei S , & Mizutani T ((2011) ) Relationship between slowing of the EEG and cognitive impairment in Parkinson disease. J Clin Neurophysiol, 28: , 384–387. |
[31] | Olde Dubbelink KT , Stoffers D , Deijen JB , Twisk JW , Stam CJ , & Berendse HW ((2013) ) Cognitive decline in Parkinson’s disease is associated with slowing of resting-state brain activity: A longitudinal study. Neurobiol Aging, 34: , 408–418. |
[32] | Stoffers D , Bosboom JL , Deijen JB , Wolters EC , Berendse HW , & Stam CJ ((2007) ) Slowing of oscillatory brain activity is a stable characteristic of Parkinson’s disease without dementia. Brain, 130: , 1847–1860. |
[33] | Magen I , Fleming SM , Zhu C , Garcia EC , Cardiff KM , Dinh D , De La Rosa K , Sanchez M , Torres ER , Masliah E , Jentsch JD , & Chesselet MF ((2012) ) Cognitive deficits in a mouse model of pre-manifest Parkinson’s disease. Eur J Neurosci, 35: , 870–882. |

