
Aceneuramic Acid Extended Release Administration Maintains Upper Limb Muscle Strength in a 48-week Study of Subjects with GNE Myopathy: Results from a Phase 2, Randomized, Controlled Study
Abstract
Background: GNE Myopathy (GNEM) is a progressive adult-onset myopathy likely caused by deficiency of sialic acid (SA) biosynthesis.
Objective: Evaluate the safety and efficacy of SA (delivered by aceneuramic acid extended-release [Ace-ER]) as treatment for GNEM.
Methods: A Phase 2, randomized, double-blind, placebo-controlled study evaluating Ace-ER 3 g/day or 6 g/day versus placebo was conducted in GNEM subjects (n = 47). After the first 24 weeks, placebo subjects crossed over to 3 g/day or 6 g/day for 24 additional weeks (dose pre-assigned during initial randomization). Assessments included serum SA, muscle strength by dynamometry, functional assessments, clinician- and patient-reported outcomes, and safety.
Results: Dose-dependent increases in serum SA levels were observed. Supplementation with Ace-ER resulted in maintenance of muscle strength in an upper extremity composite (UEC) score at 6 g/day compared with placebo at Week 24 (LS mean difference +2.33 kg, p = 0.040), and larger in a pre-specified subgroup able to walk ≥200 m at Screening (+3.10 kg, p = 0.040). After cross-over, a combined 6 g/day group showed significantly better UEC strength than a combined 3 g/day group (+3.46 kg, p = 0.0031). A similar dose-dependent response was demonstrated within the lower extremity composite score, but was not significant (+1.06 kg, p = 0.61). The GNEM-Functional Activity Scale demonstrated a trend improvement in UE function and mobility in a combined 6 g/day group compared with a combined 3 g/day group. Patients receiving Ace-ER tablets had predominantly mild-to-moderate AEs and no serious adverse events.
Conclusions: This is the first clinical study to provide evidence that supplementation with SA delivered by Ace-ER may stabilize muscle strength in individuals with GNEM and initiating treatment earlier in the disease course may lead to better outcomes.
INTRODUCTION
GNE myopathy (GNEM) is a rare, severe, progressive, autosomal recessive myopathy caused by a mutation in the GNE gene blocking the biosynthesis of sialic acid, and so potentially treatable with sialic acid substrate supplementation. GNEM was previously known as hereditary inclusion body myopathy (HIBM), distal myopathy with rimmed vacuoles (DMRV), IBM2, or Nonaka Disease [1] and was independently identified due to its distinctive clinical presentation among distal myopathies. GNEM presents typically in early adulthood with distal muscle weakness in the legs resulting in foot drop [1]. GNEM causes a progressive loss of muscle strength resulting in a distinct pattern of profound weakness in several muscle groups of the lower and upper extremities. Weakness progresses from the ankle dorsiflexors (tibialis anterior) to include the ankle plantarflexors, hip flexors and extensors, hip adductors and abductors, and knee flexors, while the knee extensors remain relatively strong throughout the disease course (thus it was also termed quadriceps-sparing myopathy) [2]. GNEM patients begin losing muscle strength, often well before they are diagnosed [3, 4]. Although lower extremity weakness and foot drop frequently are the first symptoms that lead to diagnosis, there is evidence of significant upper extremity weakness early in the disease course. Progressive weakness leads to increasing disability. The end result for many patients is a loss of upper and lower extremity strength and function that necessitates the use of motorized wheelchairs for mobility and substantial supportive care for self-care activities within a 10–20 year period from diagnosis [5–8]. A natural history study of 24 ambulant and non-ambulant Japanese patients with GNEM confirmed above observations: lower extremity muscles including hip flexors, adductors and abductors, ankle dorsiflexors and plantarflexors, and knee flexors were more severely impaired at baseline than upper extremity muscle groups, while the knee extensors were relatively spared [9]. Ambulant and non-ambulant patients showed progression of the disease within a 1-year time frame, with deterioration in function being most prominent in the shoulder extensors and abductors and the knee flexors [9].
GNEM is caused by mutations in the GNE gene coding for a bifunctional enzyme called glucosamine (UDP-N-acetyl)-2-epimerase/N-acetylmannosamine kinase (GNE) [10]. GNE is the rate-controlling enzyme in the biosynthetic pathway of sialic acid (SA), a specialized charged sugar required for the glycosylation of proteins and lipids. The exact pathophysiologicmechanisms by which GNE mutations, and the presumed SA deficiency in the muscle, lead to GNEM disease have not been precisely demonstrated and have been debated. However, studies of SA or other substrate replacement in tissues and in mouse models suggest that SA deficiency due to the GNE defect is a key cause of the disease pathology [11–13].
Two laboratories have produced GNE myopathy mouse models. An initial report of a knock-in mouse model using the Persian Jewish founder mutation M743T showed the mice had severe neonatal kidney disease rather than muscle disease, perhaps due to the higher SA needs for mice leading to a more severe phenotype [11]. Administration of ManNAc (an intermediate in the SA biosynthesis pathway) to pregnant mice reduced the severity of the disease in this model [14]. Malicdan et al produced a different knock-in mouse model of GNEM using the common Japanese mutation D176V which, in contrast to the M743T knock-in mouse, expressed the same muscle phenotype as human GNEM [12]. Oral SA supplementation in this GNEM model was effective in increasing serum and tissue total SA levels and in preventing or reducing muscle pathology and loss of muscle function. The data also showed that even small increases in SA were associated with substantially reduced pathology and marked improvement in muscle disease, suggesting that there is threshold effect for SA deficiency. These data support that a deficiency of SA is a key factor in GNEM disease pathogenesis and that early continuous treatment, before progression leads to advanced disease, could prevent or reduce the magnitude of muscle damage [3, 12, 15]. Based on these observations in the animal models and the site of the basic biochemical defect, supplementation of SA was studied as potential therapy in the human disease.
In order to translate SA therapy to humans, the development of a clinically appropriate formulation was required. Orally administered SA is rapidly clearedfrom the circulation via the kidney, so the ability to drive significant muscle uptake might require a continuous elevated serum SA concentration to penetrate connective tissue and reach muscle cells. An extended release formulation of SA (aceneuramic acid extended release; Ace-ER) was developed to achieve steady blood levels over 10–12 hours and to allow for less frequent and practical clinical dosing. A Phase 1 PK and safety study of 26 subjects investigated 5 dose levels, up to 6 g, as a single dose followed by 7 days of repeat dosing administered three times per day (TID). Subjects treated at the 6 g dose level (2 g TID) achieved steady blood levels of free SA (∼0.3–0.5μg/ml over the 7th day, 24-hour cycle of dosing) that were approximately 3-fold higher than baseline levels and 2-fold higher than normallevels [16]. Ace-ER appeared well tolerated, with nosignificant side effects. This phase 1 study data supported further study of Ace-ER as a potential substrate supplementation therapy for GNEM. A Phase 2, randomized, placebo-controlled, double-blind, parallel-group study, with a cross-over treatment continuation period, was conducted to evaluate the efficacy and safety of Ace-ER in patients with GNEM. The purpose of the study was to provide the first exploratory evaluation of efficacy of Ace-ER across a number of possible outcomes measures including biochemistry, muscle strength, other clinical functional measures and patient-reported outcomes as well as the first evaluation of safety in a controlled setting.
METHODS
The study was performed at four clinical sites in the United States and Israel. The study was conducted in accordance with the International Conference on Harmonisation Good Clinical Practice guidelines, and with approvals from relevant regulatory authorities and ethics or institutional review boards at each site. The study was listed on clinicaltrials.gov (NCT01517880). All subjects signed informed consent before any study related procedures were performed. To be eligible for study participation, patients had to be between 18 and 65 years of age and provide documented diagnosis of GNEM (HIBM, DMRV or Nonaka disease) from previously confirmed mutations in the GNEgene. Additionally, all subjects were required to walk a minimum of 20 meters independently (orthoses and assistive devices were permitted and the design did not stratify for the assistive device usage, only for the 6MWT distance as explained below). At least 60% of subjects in the study were planned to be able to walk ≥200 meters during a 6-minute Walk Test (6MWT) administered at the Screening visit. An independent data monitoring committee was established to review the safety and tolerability of Ace-ER.
Study design
The study was conceived as a randomized, controlled study in order to allow for more objective evaluation of a series of possible clinical endpoints since this is the first formal long-term treatment study ever conducted in this disease. The strategy involved evaluating a series of endpoints spanning the treatment process from delivering SA to muscle, to improving muscle function, to clinical function and finally patient experience. As a Phase 2 study, the design was considered a “learn” Phase 2 study and not planned as a typical “confirm” Phase 3 study with single primary endpoint. Given this plan, a number of key clinical endpoints were defined instead as important to assessing whether an impact of SA on muscle disease was occurring (see statistical section). The endpoint variables included assay of SA in serum and muscle was to assess whether SA was reaching its target. Secondly, the effect of SA on upper and lower muscle strength was evaluated as an intermediate clinical endpoint that is particularly relevant and whose measurement is reproducible and so reliable in smaller studies. Finally a number of clinical endpoints were explored to establish whether functional impacts on upper or lower extremities were possible but the study was not powered for these assessments. Given the pilot study data showing substantial loss of lower extremity strength compared to upper extremity strength even in patients that can walk, we expected to need to evaluate upper and lower extremities separately, and the baseline strength data did validate this decision. In order to more accurately assess the patient experience, the clinician/patient reported outcome called the GNEM-functional activity scale (GNEM-FAS) was developed in the pilot study, and was verified as to its properties related to other clinical endpoints. This novel functional activity scale then allows the connection between changes in strength and changes in patient experience in normal functional settings.
Subjects qualifying for enrollment were stratified by distance walked during the 6MWT at the Screening visit (<200 meters or ≥200 meters) and randomized 1:1:1 to the three groups: placebo, 6 g/day, or 3 g/day Ace-ER (Fig. 1) for 24 weeks. The total daily dose was divided into three oral doses taken with meals in the morning, evening, and at bedtime; the tablets were coated and provided in blister pack cards to assure comparability between placebo and active drug and for tracking compliance. After the initial 24-week placebo-controlled period, placebo subjects began treatment with the 6 g/day (henceforth termed 0/6 g/day group) or the 3 g/day (henceforth termed 0/3 g/day group) with the dose pre-assigned as part of the initial randomization process. Subjects originally assigned to 6 g/day or 3 g/day Ace-ER continued on their same dose for an additional 24 weeks (henceforth termed 6/6 g/day or 3/3 g/day groups, respectively) (Fig. 1). The randomization schedule for the initial start and placebo cross-over was developed by an independent third party; the Sponsor, investigators, and subjects were blinded to the randomization treatment assignments. At week 24, select Sponsor representatives were unblinded to analyze and report the data for the first 24 weeks. Investigators, patients and the Sponsor medical monitor remained blinded for the full 48 weeks of the study. This design allowed for a placebo-controlled comparison at 24 weeks and a longer-term comparison at 48 weeks between the 3 g/day and 6 g/day dose groups. The design also allowed for the evaluation of the effect of crossing over from placebo to either 3 g/day or 6 g/day Ace-ER.
In the absence of other randomized, controlled trials in GNEM from which to estimate a treatment effect size, the sample size of 45 patients (n = 15 per treatment group) was estimated from analogous studies in Myotonic dystrophy in which a sample size of n = 10 per arm was sufficient to detect differences between groups [17, 18].
Biochemical and pathologic evaluations
SA was evaluated in serum (free SA only) and urine (free and total SA). All SA levels (both free and total) were assessed by a third party laboratory (Intertek, Benicia, CA, USA) using a validated method of liquid chromatography/ tandem mass spectroscopy (LC/MS/MS). Creatine kinase levels were evaluated as a potential measure of muscle disease severity although previous data suggest that CK levels are not markedly elevated in GNEM. Muscle biopsies were performed in the upper and the lower extremity of each subject at Baseline, Week 24, and Week 48. Needle muscle biopsy sampling was performed to obtain a minimum of 20 mg of tissue to assess pathology and sialylation status. Target muscles with adequate bulk for sampling were selected for each subject based on a review of the MRI scan performed at the Screening visit. Of note, the vastus lateralis (quadriceps femoris) in the lower extremity and deltoid in the upper extremity were selected most frequently due to the lack of sufficient muscle bulk in preferred but more affected muscle groups, including the gastrocnemius, the biceps femoris and the triceps and biceps brachii.
Biopsy samples were split into two specimens to allow for pathology and biochemistry evaluations. Pathology assessment was performed by Therapath, LLC, New York, NY, USA using sections from snap frozen, mounted samples stained with hematoxylin and eosin, modified Gomori trichrome, Mendell modification Congo red staining, and acid phosphatase. Stained specimens were scored for inclusion bodies, atrophic/abnormal myofibrils, acid phosphatase, and amyloid by blinded raters at the pathology laboratory. Biochemistry specimens were snap frozen and later assayed for free and total SA levels using the same LC/MS/MS method as described for serum SA after appropriate tissue preparation.
Clinical evaluations
During the Phase 1 study of Ace-ER (ClinicalTrials.gov identifier NCT01359319), a noninterventional pilot study was conducted in a subset of Phase 1 subjects to assess the feasibility and appropriateness of various measures of muscle strength and mobility in ambulatory GNEM patients to facilitate the design of this Phase 2 study.
The choice of endpoints was intended to cover a range of functions and both the upper and lower extremity as both are significantly impacted, with the lower extremity showing substantially more advanced disease at baseline.
Muscle strength was evaluated by a licensed, trained physical therapist using a dynamometer to record the maximal voluntary isometric contraction. Upper extremity muscle groups tested included the shoulder abductors, elbow flexors and extensors, and gross grip. Lower extremity muscle groups tested included hip flexors and extensors, hip abductors and adductors, and knee flexors and extensors. The highest value obtained from three tests was recorded in kilograms. Measurements were taken bilaterally and reported as the bilateral average. Gross grip was measured with the Hydraulic Hand Dynamometer [B&L Engineering, Santa Ana, CA, USA]. All other muscle groups were tested using the microFET 2 hand held dynamometer (HHD) [Hoggan Scientific, LLC, Salt Lake City, UT, USA]. To increase the sensitivity for the detection of changes in muscle strength, individual muscle groups were combined into two composite assessments of muscle strength, one for the upper extremity and one for the lower extremity. The upper extremity composite (UEC) comprises the sum, in kilograms, of the bilateral average of raw strength values for gross grip, shoulder abductors, elbow flexors, and elbow extensors. The lower extremity composite (LEC) comprises the sum, in kilograms, of the bilateral average of strength values in hip flexors, hip extensors, hip adductors, hip abductors, and knee flexors. Due to the quadriceps-sparing feature of GNEM, the knee extensors results were not included in the pre-defined LEC, but were analyzed independently. The distal muscle groups in the lower leg, particularly the tibialis anterior and gastrocnemius, that are measured by ankle dorsiflexion and ankle plantarflexion, were also not included in composite score because accurate assessments of strength could not be measured using the dynamometer in several patients due to the advanced disease in these muscle groups. Individual raw muscle scores were used to calculate percent of predicted normal values. Physical therapists at each site underwent a training program to standardize the administration of the HHD and functional performancemeasures.
A series of performance tests were administered to assess the impact of changes in muscle strength on upper and lower extremity function. Assessments included measures of walking ability and speed (6MWT and gait speed ([GS] test), stair climbing speed (timed stair climb [SC] test), ability to transfer from sitting to standing (a modified 30-second sit-to-stand [STS] test) and arm reaching ability (1-kg weighted arm lift [WAL] test). Clinician- and patient-reported outcomes (ClinRO and PRO) were also evaluated to assess the impact of changes in strength and physical function on quality of life and the ability to perform activities of daily living affected by GNEM. The GNEM-FAS is a novel, disease-specific instrument developed as a clinician-administered measure of physical function in ambulatory adult patients with GNEM [19]. The instrument development process for the GNEM-FAS was initiated in the above-mentioned pilot study through the conduct of semi-structured interviews with patients to determine the impact of their weakness and mobility restrictions on daily function. The GNEM-FAS instrument was validated in the current study for that population. Daily activities are assessed using 25 items related to mobility (reflecting lower extremity function; 10 items), upper extremity function (8 items) and self-care (7 items). Examples of activities assessed include sitting, standing, walking, and climbing stairs; cutting food with utensils; opening doors; reaching overhead; and dressing and bathing. Subject performance levels for the 25 activities are rated on a response scale of ‘4 = no limitations’ to ‘0 = unable, or requires MAX assistance of person’. The scale is completed based on clinical observation and patient response during an interview conducted by a trained evaluator. Two self-report patient questionnaires, the Individual Neuromuscular Quality of Life questionnaire (INQoL) [20] and the Inclusion Body Myositis Functional Rating Scale (IBMFRS) [21], were administered to assess patient quality of life and functional status, respectively.
Imaging and electrophysiology
Bilateral distal and proximal leg and bilateral shoulder MRIs were performed with Axial T1 weighted and STIR T2 weighted scans for all exams. T1 weighted images from Screening and Week 24 were evaluated by a neurologist (P.B.S.) blinded to test sequence using a 5-point ordinal rating scale based on the extent of fatty infiltration visible on the muscle images: 1 = normal, 2 = slightly abnormal, 3 moderately abnormal, 4 = severely abnormal, 5 = end stage. A total of 14 muscle groups were evaluated bilaterally with a score assigned to each group. The 6 proximal leg muscle groups evaluated included: gluteals, the long head of the biceps femoris, semimembranosis and semitendinosis, quadriceps, adductors, and sartorius. The 4 distal leg muscle groups included the anterior compartment, lateral compartment, deep posterior compartment, and superficial posterior compartment. The 4 upper extremity muscle groups evaluated included the deltoid, latissimus dorsi, rotators, and subscapularis.
Electrical impedance myography (EIM) is an experimental, noninvasive measure of electrical impedance characteristics of individual muscles or groups of muscles and was included as an exploratory noninvasive evaluation for muscle electrophysiology. A pilot evaluation in GNEM patients did show abnormalities by the EIM (unpublished data) which supported the use of this novel technology in the clinical study. To conduct EIM on a given muscle, a hand-held device is placed on the skin directly over the main body of the muscle, and the probe emits a high-frequency, low-intensity electrical current and records the resulting voltage patterns (previously Convergence Medical Devices, now Skulpt Health, Davie, FL, USA; [22]. EIM was conducted at the US study sites only. Bilateral measurements were taken from the lateral deltoid, posterior deltoid, biceps, triceps, quadriceps, tibialis anterior, gastrocnemius, and biceps femoris. For each muscle, the 53 kHz phase data were recorded and used for EIM analysis.
Safety evaluations
Safety was assessed using physical and neurological examinations, vital signs, medical history, clinical laboratory analyses, and reporting of Adverse Events (AEs). Routine biochemical serum assessments and ECG were also performed for safety monitoring.
Statistical analyses for the 24 and 48 week efficacy assessments
This Phase 2 study was the first to assess the efficacy of Ace-ER and therefore was not powered to detect change in the various clinical outcome measures. A primary endpoint was not declared; however, key clinical efficacy measures were prospectively identified in the statistical analysis plan and limited to 6 endpoints without adjustment for multiple comparisons: muscle group strength measured by dynamometry (UEC and LEC scores), 6MWT, GS test, the WAL test, and the GNEM-FAS. All patients with any post-dose data were included in the intent-to-treat (ITT) efficacy analysis at Weeks 24 and 48. UEC and LEC were determined for patients assessed at Week 24 and for patients assessed at Week 48; no imputation was done for patients who dropped out prior to those assessments. Performance based clinical endpoints were analyzed using the general estimator equation (GEE) approach that incorporated all data points collected during the study using categorical time to refine the estimate of change at the final analysis time point, as prospectively defined in the statistical analysis plan. Two primary comparisons for efficacy were conducted: at Week 24 each Ace-ER group was compared with placebo; at Week 48, the 6/6+0/6 g/day group (henceforth termed combined 6 g/day group) was compared to the 3/3+0/3 g/day group (henceforth termed combined 3 g/day group). A secondary analysis comparing those subjects treated with 6 g/day and 3 g/day for 48 weeks was also conducted. In an effort to further evaluate the treatment effect of Ace-ER over 48 weeks, an additional analysis was conducted comparing changes in UEC and LEC scores for the highest dose exposure group (6/6 g/day) to the lowest dose exposure group (0/3 g/day). The GNEM-FAS, IBMFRS, and INQoL were assessed from Baseline to Week 24 and Baseline to Week 48 (ANCOVA for primary pre-specified statistical analysis; GEE for secondary post-hoc statistical analysis). Free SA levels (Baseline to Week 24 and Baseline to Week 48) were assessed using ANCOVA, with Baseline SA level as covariate. CK was evaluated by comparing the change from baseline at Week 24 between the 6 g/day or 3 g/day groups and placebo. Descriptive analyses for biochemical and pathologic measures were also performed.
RESULTS
Subject population
Forty-seven subjects were randomized and received double-blind study drug (Fig. 1). Of the 14 subjects assigned to the placebo group, 9 were randomized to cross over to 6 g/day dosing and 5 to cross over to 3 g/day dosing at Week 24. A single subject in the 3 g/day group discontinued due to an AE of transient, mildly abnormal liver enzymes but was subsequently determined to have a prior history of intermittent elevated liver function test results. All other subjects completed the study and enrolled in a long-term, open-label extension study.
The mean age of subjects was 39.7 years at the time of enrollment with the majority being female (62%) and of Persian Jewish decent (60% ; Table 1). The enrolled subjects had disease onset at a mean age of 27.6 years; most subjects used orthoses (60%) and about 50% used assistive devices for walking. It is important to note that there was a concern that patients could fall and be injured during the performance of the 6MWT, which might have occurred had the support tools not been allowed. Muscle weakness was profound at baseline in the lower extremity with a mean of approximately 23% of normal predicted strength as measured by dynamometry. The upper extremity muscle groups had more residual strength but were also substantially affected with a mean of approximately 44% of normal predicted values (Table 1, lower rows). The knee extensors were the strongest muscle group tested in this cohort (57% of normal predicted values) consistent with the quadriceps-sparing feature of this disease. In the enrolled population, 33/47 (70%) of the subjects could walk ≥200 m (Table 1).
Biochemical and pathological results
The baseline mean serum free SA level was 0.17μg/ml (SD 0.03) for the study population and was similar across the treatment groups. Dose-dependent increases in serum free SA were observed by Week 6 after Ace-ER treatment, reaching a peak at Week 12 and then stabilizing (Fig. 2). At Week 48 the mean serum free SA level in subjects treated with 6 g/day for 48 weeks was 0.42μg/ml (SD 0.18), representing a 2.6-fold mean increase from baseline values.
At baseline, the mean serum CK concentration for the study population was 378.8 U/L (range, 88–1530 U/L), which was above the normal reference limit (211 U/L for females; 294 U/L for males). At Week 24, serum CK levels were decreased from baseline by approximately 10% in the 6 g/day group (–26.9 U/L, SD 113.1) relative to an increase of more than 10% in the placebo group (+38.6 U/L, SD 107.8) with the difference showing a trend toward significance (p = 0.097). The 3 g/day group had CK values midway between those of the placebo and 6 g/day groups, indicative of a dose-dependent response at Week 24. At Week 48, CK values were similarly decreased in both the combined 6 g/day and 3 g/day groups to levels consistent with the reduction observed with the 6 g/day dose at Week 24.
Needle biopsies of muscles in the lower and upper extremities were conducted in nearly all subjects at Baseline, Week 24, and Week 48. Baseline pathology scores in the deltoid and quadriceps were relatively low with only a few subjects having any measurable pathology (data not shown). The few biopsy samples collected from the gastrocnemius had significant fatty infiltration and mixed fibrous tissue and were difficult to assess for biochemistry or pathology. The viable gastrocnemius and biceps brachii samples collected had more significant pathology but difficulties in consistently obtaining repeat samples with residual viable muscle tissue, at post-treatment time points, made the analysis inconclusive.
Muscle free SA levels at Baseline were substantially and significantly reduced by 72–85% in the quadriceps, deltoid, and gastrocnemius compared with normal muscles of the same type (Chan et al, in preparation). Levels of free SA in the muscle groups of the viable biopsies were <0.1μg per μmol creatine, whereas normal muscles had ∼0.2 to 0.5μg SA per μmol creatine. An alternate calculation of free SA relative to protein content provided a consistent result. Total SA was significantly lower by 32% and 36% , respectively, in the quadriceps and deltoid of GNEM subjects compared with normal tissue; total SA levels in the gastrocnemius did not appear reduced, although the specimens had significant fatty infiltration, which limited interpretation. Contamination of biochemical specimens with small amounts of other fibrous tissue could not be ruled out in these specimens and may contribute to the larger variability. After treatment at 24 weeks, there was no consistent verifiable pattern of change in muscle free SA. At Week 48, muscle free SA levels assessed in the quadriceps increased in the 6/6 g/day group compared with the 3/3 g/day group (mean difference of +0.0458μg/μmol creatine; p = 0.053, representing a 74% increase over baseline in the 6/6 g/day group). Changes in total SA were not demonstrated and may be attributed to variability and the minimal differences between total SA in GNEM samples as compared to normal, both of which reduce the power for detection of change.
Results for muscle strength assessments
Upper extremity strength assessment
In the placebo-controlled phase of the study, a dose-dependent response for the upper extremity composite (UEC) score was established, (Fig. 3, left panel) achieving statistically significant differences between the 6 g/day group and placebo group at Week 24 (LS mean difference [CI] +2.33 kg [0.1, 4.6]; p = 0.040; Table 2). The 3 g/day group lost UEC strength to an extent similar in magnitude to the placebo group at Week 24 (LS mean difference [CI] +0.59 kg [–1.7, 2.9], p = 0.62). Stabilization of upper extremity strength was further demonstrated at Week 48 and reached statistical significance when the combined 6 g/day group was compared to the combined 3 g/day group (Fig. 3, right panel LS means) with a LS mean difference of +3.46 kg (CI [1.2, 5.8]; p = 0.0031; Table 2). The additional analysis conducted comparing changes in UEC score for the highest dose exposure group (6/6 g/day; n = 15) to the lowest dose exposure group (0/3 g/day; n = 5) showed that at Week 48, the LS means difference between groups in UEC muscle strength was +4.82 kg; p = 0.0042.
In a pre-specified subgroup analysis (6MWT: ≥200 m distance at Screening visit) conducted at Week 24, the magnitude of the difference in UEC strength between the 6 g/day and placebo treatment groups was +3.1 kg (p = 0.040), 33% larger than the difference observed in the total study population. At Week 48, a larger difference within the pre-specified subgroup was also observed with a 36% increase in the difference measured in the total study population when comparing the combined 6 g/day group and combined 3 g/day group, with more robust statistical significance (LS mean difference [CI] of +4.7 kg [2.1, 7.3]; p = 0.0005; Table 2).
Individual upper extremity muscles were evaluated for change in muscle strength and reported as absolute strength (kg) and percent of normal predicted values (Table 3). At Week 24 (left side of Table 3), when the 6 g/day and placebo treatment groups were compared, grip (+4.8% of normal predicted value), elbow flexors (+2.1%), and elbow extensors (+4.37%) each contributed to the difference in UEC values. At Week 48,all four upper extremity muscle groups (grip, elbow flexors and extensors, and shoulder abductors) contributed to the difference in UEC (combined 6 g/day versus combined 3 g/day treatment groups) (range of increase in percent predicted change of 1.69% –6.30% ; Table 3).
Lower extremity strength assessment
The mean change from baseline in the LEC is shown in Fig. 4 (upper left panel), and depicts an increase at the 6 g/day and 3 g/day dose levels relative to placebo in a pattern similar to the dose-dependent response to Ace-ER treatment observed in UEC at Week 24. The LEC increases of +1.1 kg and +1.5 kg in the 6 g/day and 3 g/day treatment groups, respectively, from placebo, were relatively small and were not statistically significant (Table 2). In contrast to upper extremity muscle strength, lower extremity muscle strength did not decline in placebo-treated subjects during the initial 24-week treatment period. The lack of decline in LEC in the full cohort is likely related to the magnitude of the baseline weakness observed in the lower extremity, particularly in the subgroup who walked <200 m at Screening. In the pre-specified subgroup analysis for subjects who walked ≥200 m at Screening, the 6 g/day and 3 g/day groups showed larger changes at Week 24 compared to the overall group of +2.2 and +2.7 kg, respectively, but did not reach statistical significance (Table 2).
At Week 48, increased LEC values were observed in the 6 g/day and 3 g/day treatment groups when reported as changes in the arithmetic mean (Fig. 4, upper left panel). Corrections for differences between treatment groups in baseline lower extremity muscle strength were made using the LS means calculation. Using this analysis method to adjust for the baseline differences, the change from baseline for the 6 g/day group remained higher than the 3 g/day group (Fig. 4, upper right panel), although statistical significance was not achieved (+1.3 kg [–2.5–5.1; p = 0.5; Table 2). Of note, when comparing the highest (6/6 g/day; n = 15) and lowest (0/3 g/day; n = 5) dose exposure groups over 48 weeks, the high dose group that received 6 g/day throughout the 48 weeks retained more LE muscle strength than the subjects who received placebo then 3 g/day (+3.37 kg; p = 0.16). Evaluation of each lower extremity muscle group comprising the LEC score did not show any distinct trends in individual muscle group strength with several muscle groups contributing to the observed LEC change (Table 3).
At Week 24, the change from baseline in quadriceps (knee extensors) strength showed a similar pattern to LEC scores with the 6 g/day group having greater strength than the 3 g/day and placebo groups, although statistical significance was not achieved. At Week 48, the difference between groups was small and did not reach significance, but still retained the dose-dependent pattern observed at Week 24 (Table 2, Fig. 4, upper right panel). In the pre-specified subgroup of subjects who walked ≥200 m at Screening, the difference between the 6 g/day and the 3 g/day dose groups and placebo were both statistically significant at Week 24 (for the 6 g/day group = +3.3 kg [0.06–6.6]; p = 0.046; Table 2). At Week 48, the difference between the combined 6 g/day and combined 3 g/day groups was minimal; however, the pattern of response may suggest that both doses have some activity (Table 2; Fig. 4, lower right panel).
Results for other clinical measures
There were no statistically significant changes in walking-related tests at Weeks 24 or 48 (6MWT, GS, and SC) and the results showed fairly consistent values over time (Table 4). The WAL test and the STS test showed a modest improvement at Week 48 in the 6 g/day group that trended toward significance for the combined 6 g/day or 6/6 g/day groups, respectively (Table 4).
Results for clinician- and patient-reported outcome measures
GNEM-FAS scores capture changes in perceived physical functioning associated with the performance of activities of daily living based on clinical observation and interview. At Week 24, the changes in domain and total scores were too small to discern a difference between treatment groups. However, after 48 weeks of treatment, changes from baseline in GNEM-FAS scores were consistent with the maintenance of strength, as measured by dynamometry, in subjects in the combined 6 g/day group, relative to the decline in strength observed in the combined 3 g/day groups (Table 5). In the primary pre-specified ANCOVA analysis, the combined 6 g/day (6/6+0/6 g/day) versus the combined 3 g/day (3/3+0/3 g/day) comparison showed a trend toward a difference for the GNEM-FAS total score (p = 0.086), the mobility domain score (p = 0.087), and the upper extremity domain score (p = 0.096). A post-hoc analysis, using the more powerful GEE method that incorporated all responses collected during the study demonstrated statistically significant differences between treatment groups for GNEM-FAS total score which was driven by the mobility and upper extremity function domains (p = 0.024–0.051; Table 5). These results were supported by similar dose-dependent positive statistical trends when comparing the combined 6 g/day group with the combined 3 g/day group at Week 48 in two patient-reported outcome instruments, the IBMFRS and INQoL (data not shown).
Results for MRI and EIM evaluations
MRI scores using T1 weighted images showed substantial compartment-specific pathology and advanced atrophy with fibrous/fatty replacement in the biceps femoris, gastrocnemius, and tibialis anterior muscle (Fig. 5). The MRIs were scored by a blinded neurologist familiar with GNE myopathy (P.B.S.) to evaluate fatty infiltration using a 5-point scale with 1 representing normal appearance of muscle and 5 representing end stage muscle disease. Figure 5 shows a score of 5 at the top panel indicating end-stage muscle disease in the biceps femoris and scores of approximately 4 (severely abnormal) in the middle and bottom images of the hip adductor and the semimembranosus/ semitendinosus, respectively. The degree of destruction in the distal leg muscles was pronounced with individual scores ranging from 2.9 in the deep posterior compartment to 4.8 in the anterior compartment. The extent of damage in the proximal leg musculature was more variable with individual muscle scores ranging from 1.7 in the quadriceps, which is consistent with the relative sparing of this muscle group to 4.1 in the hip adductors and semimembranosus/semitendinosus. In the upper extremity, individual muscle scores ranged from 1.3–2.4 indicating less pathology than the lower extremities, although there was evidence of mild fatty infiltration. No change was observed in MRI scores from Baseline to Week 24. MRI was not conducted at Week 48.
EIM showed statistically significant and dose-dependent changes in impedance patterns at Week 24 compared with Baseline in the 6 g/day dose group with a lesser effect observed in the 3 g/day group, and little change in the placebo group (data not shown).
Safety
Ace-ER appeared well tolerated and there were no serious adverse events (SAEs) during 48 weeks of treatment. Overall, there was no apparent relationship between the proportion of subjects experiencing treatment emergent AEs (TEAEs) and Ace-ER dose. The TEAEs experienced by subjects in the study were predominately mild to moderate in severity and not unexpected for this subject population. Procedural pain and headache were the most common TEAEs (Table 6). Procedural pain was related to the muscle biopsies performed. The incidence of headache was 40% , 28% , 56% , and 60% for the 6/6 g/day, 3/3 g/day, 0/6 g/day, and 0/3 g/day treatment groups, respectively over the 48 weeks of the study. Of note, diarrhea was also reported in the Ace-ER treatment groups during the first 24 weeks of the study (6 g/day; 26.7% and 3 g/day; 33.3%) with no report of diarrhea either in the placebo-treated group and only one additional subject with diarrhea (in the 6/6 g/day group) in the second 24 weeks of the study, which included placebo subjects initiating Ace-ER treatment. No clinically significant changes in routine biochemical safety tests (serum glucose, liver enzymes, and blood count) were observed during the trial other than the one subject that discontinued due to elevated liver enzymes.
DISCUSSION
GNEM is a progressive, debilitating myopathy affecting both the upper and lower extremities that currently has no approved therapy. Functional activities are eventually limited by the progressive muscle weakness, resulting in increased disability and caregiver dependence. The current study showed that SA oral supplementation with Ace-ER tablets increased serum free SA by 2.6 fold at the 6 g/day dose. This increase in SA was associated with a statistically significant increase in upper extremity muscle strength that was apparent at 24 weeks relative to placebo and sustained over the longer 48 weeks of treatment when compared to the minimally effective 3 g/day dose. In fact, the mean change from baseline in UEC, reflecting upper extremity strength, remained positive at all study time points when 6 g/day Ace-ER was administered.
UEC strength in the placebo and 3 g/day treated subjects declined during the early part of the study, confirming a lack of a placebo effect. Following cross-over to 6 g/day at Week 24, upper extremity muscle strength in the original placebo-treated group stabilized and began to improve in the second 24 weeks. These positive results were supported by an even larger difference between the 6 g/day dose and placebo in the subgroup of patients able to walk ≥200 m at Screening.
The effect of Ace-ER therapy on muscle strength in the lower extremity muscle groups had a similar dose-dependent pattern of response with greater LEC scores in the 6 g/day group, although statistical significance was not achieved. The decline in upper extremity strength observed for the placebo group in the first 24 weeks of treatment was not observed in the lower extremities for the placebo or 3 g/day groups, which likely prevented the analysis from reaching statistical significance. The lack of decline in LEC may be attributed to the severely compromised lower extremity muscle strength in these subjects at the start of the study, indicating the subjects had little muscle strength left to lose during the treatment period. At Baseline, lower extremity strength was approximately 23% of predicted normal as compared with approximately 44% of predicted normal in the upper extremity. Given the substantial replacement of muscle tissue with fibrous tissue and fat in the later stages of the disease, the potential for any treatment to recover muscle tissue and restore muscle strength is limited. Some evidence of improvement in lower extremity strength with Ace-ER was observed in the quadriceps, the least affected muscle group in GNEM, in the 70% of subjects that walked ≥200 m in the 6MWT.
Physical functioning data from the GNEM-FAS suggested that the magnitude of the differences in strength observed in the 6 g/day dose group after 48 weeks of treatment were detectable by patient and clinician report, as evidenced by changes in GNEM-FAS Mobility and Upper Extremity domain scores. Baseline GNEM-FAS scores correlated well with the IBMFRS and the INQoL questionnaires, showing a consistency of response among these outcome measures. Given the small sample size, short duration of the study, and limited statistical power to detect change, the GNEM-FAS data support the clinical meaningfulness of the observed treatment changes in muscle strength to these GNEM patients.
Other clinical measures provided only limited support for the observed changes in muscle strength. No improvement or decline was observed for any of the treatment groups in the tests of walking speed and ability. This finding was not surprising given the magnitude of the response observed in lower extremity strength for active drug and the lack of decline in the placebo group. It is important to note that braces (ankle foot orthotics [AFO’s]) and walking devices (cane, crutches, etc.) were allowed during the performance of the 6MWT and GS tests, which may have hampered the ability to measure the impact of changes in muscle strength on ambulation. The majority of subjects who required orthoses/walking devices for the performance of the 6MWT walked less than 200 meters at Screening, which was accounted for as part of the randomization. It is also notable that the percent predicted values for maximum speed were lower than for comfortable speed. This suggests that subjects are unable to increase their speed due to either lack of ability (near absent hip flexor strength and use of AFOs) or fear of falls or both. However, the GNEM-FAS assessment showed positive relative changes in the mobility domain score (reflective of the lower extremities) at Week 48 that were consistent with the stabilization of strength observed by subjects in the combined 6 g/day group. The STS test, which relies heavily on the quadriceps, showed a trend towards improvement and provides support for the observed changes in quadriceps strength. The WAL test also showed a trend towards improvement in treated subjects. In summary, efficacy results were inconclusive for the additional functional testing, including 6MWT, GS, STS, and WAL. It is worth noting that the study was not powered to demonstrate treatment effects within these clinical outcome assessments.
The electrophysiolgic measure of impedance did show a change in the multiple muscles studied but the meaning of EIM changes is less certain. The changes observed were dose-dependent which suggests a real change in electrophysiological properties of the muscle during treatment with 6 g/day Ace-ER but the direction and magnitude of the change are difficult to interpret without further study. This method is novel but could potentially provide a noninvasive approach to studying more muscles for changes in electrophysiology than traditional needle-based electromyography.
No serious adverse events were reported. The adverse events observed were generally mild to moderate in severity with headache and some GI symptoms related to drug reported in some subjects. The main AE in this study (procedural pain) was related to the needle muscle biopsy. In general the data suggest that Ace-ER may be safe and well tolerated at these doses over the 48 week period of study.
This study has some limitations stemming mostly from the lack of natural history studies in GNE myopathy, although a decrease in muscle strength has been observed in an ongoing natural history study that was similar to placebo loss in the current study, albeit in a different population of GNEM patients (data not shown; ClinicalTrials.gov identifier NCT01784679). Many of the outcome measures were not validated for this condition, although a formal psychometric validation has been performed and submitted as a dossier for regulatory review and manuscript for publication. Preliminary validation data for the GNEM-FAS have been presented in an abstract form [19]. In addition, based on the pilot study data, outcome measures including HHD, 6MWT, sit-to-stand test, weighted arm lift test, and walking speed test (gait speed) were chosen for inclusion, in addition to the development and use of the GNEM-FAS. The length of the placebo-controlled phase of the trial may have been too short to show greater preservation of strength because of the apparent slow rate of progression in some of the patients with this chronic adult onset myopathy. The cohort of studied patients is clinically heterogeneous as evidenced by the broad range of walking test distances observed during the 6MWT at Screening. We believe that these facts may be masking a larger effect. The use of a heterogeneous genotypic status seems less limiting as the end stage product of the pathway was utilized overcoming a theoretical barrier of sialic acid supplementation to the cells.
In summary, this is the first evidence in humans that SA supplementation may affect the progression of muscle weakness in GNEM. This phase 2 study included subjects at various stages of the disease including those that were advancing to a wheelchair-bound state. The findings suggest that initiating treatment earlier in the disease course may lead to better outcomes, particularly given the better response of subjects with longer walking distances in the 6MWT (≥200 meters) at Screening. Also the length of study (48 weeks) in a relatively small group (46 subjects) may have not been optimal may have masked some of the effects, but was planned for practical reasons. The hypothesis that earlier treatment could improve efficacy is supported by the preventative benefit observed in the mouse model work [12].
To verify these results, an international randomized, double-blind, placebo-controlled Phase 3 study in GNEM subjects is underway.
CONFLICTS OF INTERESTS
Dr. Argov is now an active consultant for Ultragenyx Pharmaceutical, starting after the end of this study and is also BioBlast Pharma Chief Medical Officer.
Drs. Skrinar, Ahmed, Koutsoukos, Kakkis, and Julia Martinisi are employees and shareholders of Ultragenyx Pharmaceutical Inc., the study sponsor.
Dr. Lau reports: Contracted research with Ultragenyx, Shire, Genzyme, Pfizer, Amicus, Glaxo Smith Kline; Biomarin, consulting relationship with Biomarin, Shire, Pfizer, Genzyme; Advisory Boards for Shire, Pfizer, NTSAD, and APBDF.
Dr. Caraco reports: Served as the Principle Investigator at the Hadassah University Hospital, Jerusalem, Israel.
Dr. Pestronk reports: Travel expenses & honoraria paid by The Myositis Association; Receives revenue related to antibody patent licenses from Athena; Owns stock in Johnson & Johnson; Directs the Washington University Neuromuscular Clinical Laboratory which performs antibody testing; Receives research support from the NIH, Muscular Dystrophy Association, Neuromuscular Research Fund; Insmed, Knopp, Cytokinetics, Biogen Idec, ISIS, Genzyme, GSK, Sanofi & Ultragenyx.
Dr. Shieh reports: Served as an ad hoc consultant for Novartis, BioMarin Pharmaceuticals, Catalyst Pharmaceuticals, PTC Therapeutics, Sarepta Therapeutics, Marathon Pharmaceuticals, Cytokinetics, Biogen, and Ultragenyx.
ACKNOWLEDGMENTS
This study was funded by Ultragenyx Pharmaceutical, Incorporated. The authors would like to thank Edward Berkhoff for assisting with preparation of the manuscript.
REFERENCES
[1] | Nishino I , Carrillo-Carrasco N , Argov Z . GNE myopathy: Current update and future therapy. Journal of Neurology, Neurosurgery, and Psychiatry. (2015) ;86: (4):385–92. |
[2] | Argov Z , Yarom R . “Rimmed vacuole myopathy” sparing the quadriceps: A unique disorder in iranian jews. J Neurol Sci. (1984) ;64: (1):33–43. |
[3] | Huizing M , Krasnewich DM . Hereditary inclusion body myopathy: A decade of progress. Biochim Biophys Acta. (2009) ;1792: (9):881–887. |
[4] | Argov Z , Mitrani-Rosenbaum S . Hereditary inclusion body myopathy and other rimmed vacuolar myopathies. Handbook of Clinical Neurology. (2007) ;86: :243–253. |
[5] | Sunohara N , Nonaka I , Kamei N , Satoyoshi E . Distal myopathy with rimmed vacuole formation. A follow-up study. Brain: A Journal of Neurology. (1989) ;112: (Pt 1):65–83. |
[6] | Nonaka I . Distal myopathies. Current Opinion in Neurology. (1999) ;12: (5):493–499. |
[7] | Nonaka I , Murakami N , Suzuki Y , Kawai M . Distal myopathy with rimmed vacuoles. Neuromuscular Disorders: NMD. (1998) ;8: (5):333–337. |
[8] | Nonaka I , Noguchi S , Nishino I . Distal myopathy with rimmed vacuoles and hereditary inclusion body myopathy. Curr Neurol Neurosci Rep. (2005) ;5: (1):61–65. |
[9] | Mori-Yoshimura M , Oya Y , Yajima H , Yonemoto N , Kobayashi Y , Hayashi YK , et al. GNE myopathy: A prospective natural history study of disease progression. Neuromuscular Disorders: NMD. (2014) ;24: (5):380–386. |
[10] | Eisenberg I , Avidan N , Potikha T , Hochner H , Chen M , Olender T ,et al. The UDP-N-acetylglucosamine 2-epimerase/N-acetylmannosamine kinase gene is mutated in recessive hereditary inclusion body myopathy. NatGenet. (2001) ;29: (1):83–87. |
[11] | Galeano B , Klootwijk R , Manoli I , Sun M , Ciccone C , Darvish D , et al. Mutation in the key enzyme of sialic acid biosynthesis causes severe glomerular proteinuria and is rescued by N-acetylmannosamine. The Journal of Clinical Investigation. (2007) ;117: (6):1585–1594. |
[12] | Malicdan MC , Noguchi S , Hayashi YK , Nonaka I , Nishino I . Prophylactic treatment with sialic acid metabolites precludes the development of the myopathic phenotype in the DMRV-hIBM mouse model. Nat Med. (2009) ;15: (6):690–695. |
[13] | Yonekava T , Malicdan MC , Cho A , Hayashi YK , Nonaka I , Mine T , et al. Sialyllactose ameliorates myopathic phenotypes in symptomatic GNE myopathy model mice. Brain. (2014) ;137: :2670–2679. |
[14] | Niethamer TK , Yardeni T , Leoyklang P , Ciccone C , Astiz-Martinez A , Jacobs K , et al. Oral monosaccharide therapies to reverse renal and muscle hyposialylation in a mouse model of GNE myopathy. Molecular Genetics and Metabolism. (2012) ;107: (4):748–755. |
[15] | Broccolini A , Gidaro T , Morosetti R , Mirabella M . Hereditary inclusion-body myopathy: Clues on pathogenesis and possible therapy. Muscle Nerve. (2009) ;40: (3):340–349. |
[16] | Kakkis E , Maurer M , Shah P , Donikyan M , Ahmed R . Poster: UX001-CL101 - A Phase 1 Study to Evaluate the Safety and Pharmacokinetics of Single and Repeat Doses of Sialic Acid Extended-Release (SA-ER) Tablets in Patients with Hereditary Inclusion Body Myopathy (HIBM). World Muscle Society; Perth, Australia, (2012) . |
[17] | Hebert L , Remec J , Saulnier J , Vial C , Puymirat J . The use of muscle strength assessed with handheld dynamometers as a non-invasive biological marker in myotonic dystrophy type 1 patients: A multicenter study. BMC Musculoskelet Disord. (2010) ;11: (72):1–9. |
[18] | Mathieu J , Boivin H , Richards CL . Quantitative motor assessment in myotonic dystrophy. Can J Neurol Sci. (2003) ;30: (2):129–136. |
[19] | Skrinar A , Argov Z , Caraco Y , Kolodny E , Lau H , Pestronk A , et al. Abstract: GNE myopathy functional activity scale (GNEM-FAS): Development of a disease-specific instrument for measuring function and independence. Neuromuscular Disorders. (2013) ;23: :738. |
[20] | Vincent KA , Carr AJ , Walburn J , Scott DL , Rose MR . Construction and validation of a quality of life questionnaire for neuromuscular disease (INQoL). Neurology. (2007) ;68: (13):1051–1057. |
[21] | Jackson CE , Barohn RJ , Gronseth G , Pandya S , Herbelin L , Muscle Study G. Inclusion body myositis functional rating scale: A reliable and valid measure of disease severity. Muscle Nerve. (2008) ;37: (4):473–476. |
[22] | Rutkove SB . Electrical impedance myography: Background, current state, and future directions. Muscle Nerve. (2009) ;40: (6):936–946. |
Figures and Tables
Fig.1
Study design and subject disposition. The randomized, double-blind, controlled study design and subject flow are shown. After stratification and randomization, the three groups received 24 weeks of treatment. At Week 24, 9 placebo subjects crossed over to 6 g/day to form a 24 subject combined 6 g/day group and 5 placebo subjects crossed over to the 3 g/day group to form a 23 subject combined 3 g/day group. The combined groups received an additional 24 weeks of treatment for a total of 48 weeks of exposure.
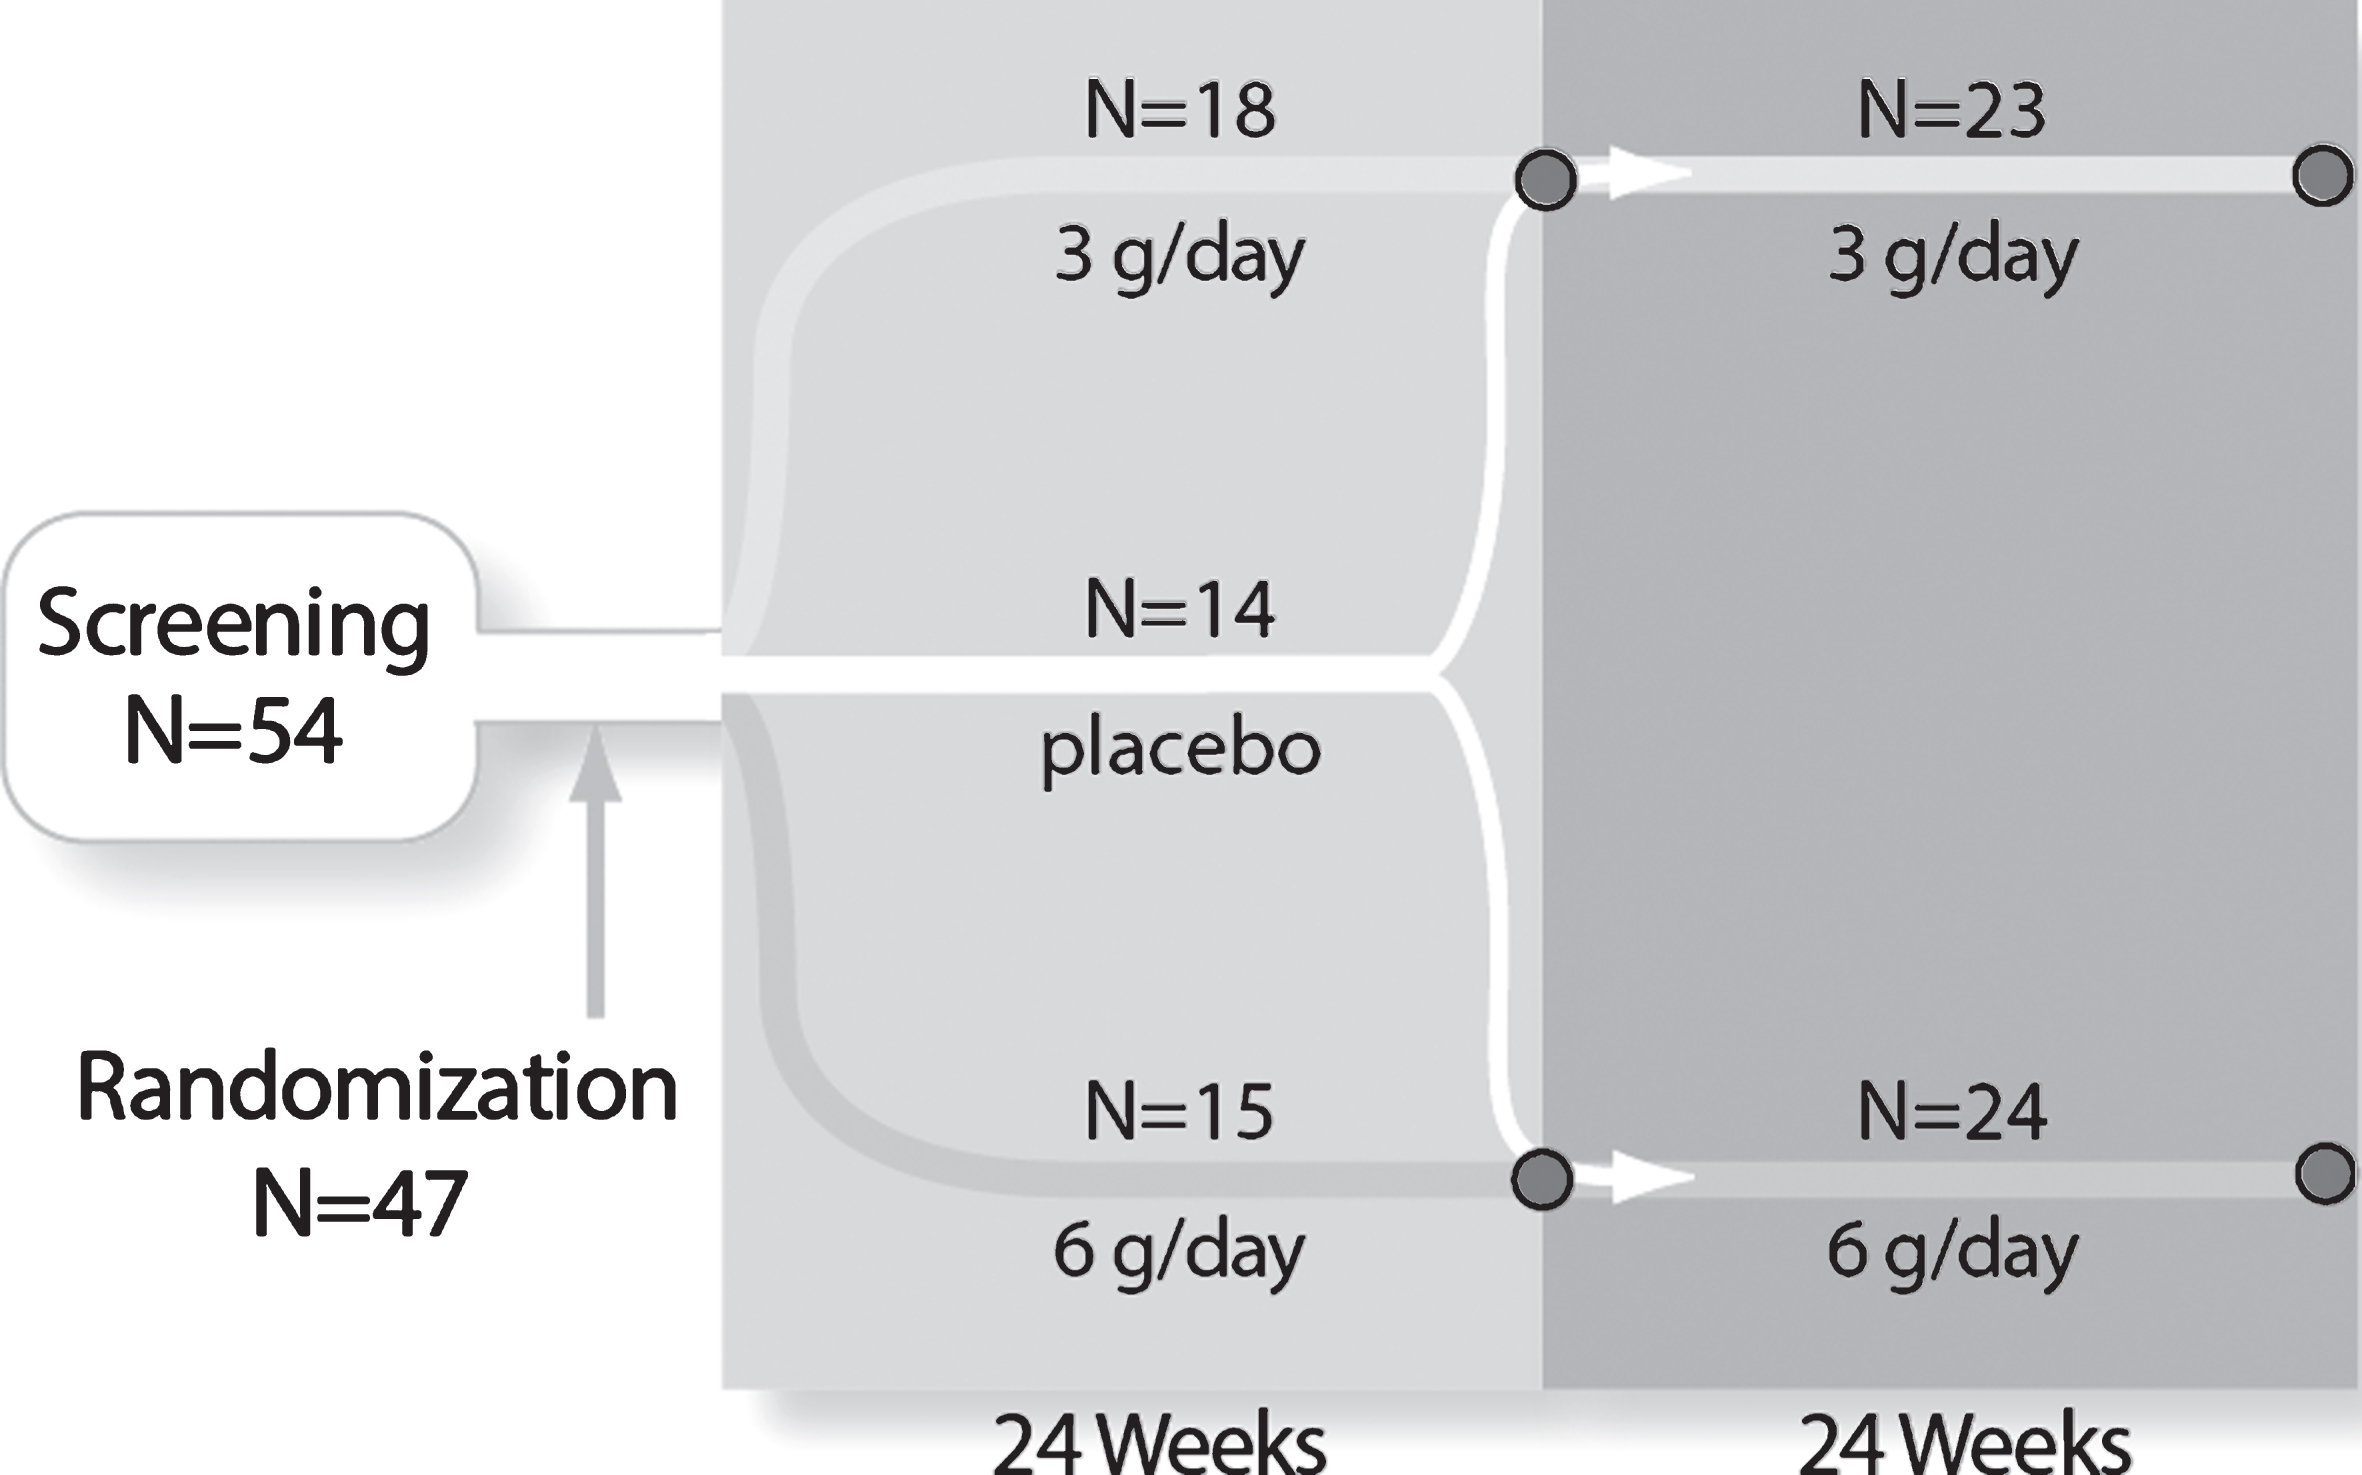
Fig.2
Dose-dependent Increases in Mean (±SE) Free SA Levels in Serum. Serum free SA levels were measured by LS/MS/MS and are presented as the mean change (±SE) from baseline in μg/mL. Dose dependent increases in SA were observed over time. At 24 weeks, the placebo groups crossed over to the 6 g/day and 3 g/day groups (designated as 0/6 g/day and 0/3 g/day, respectively).
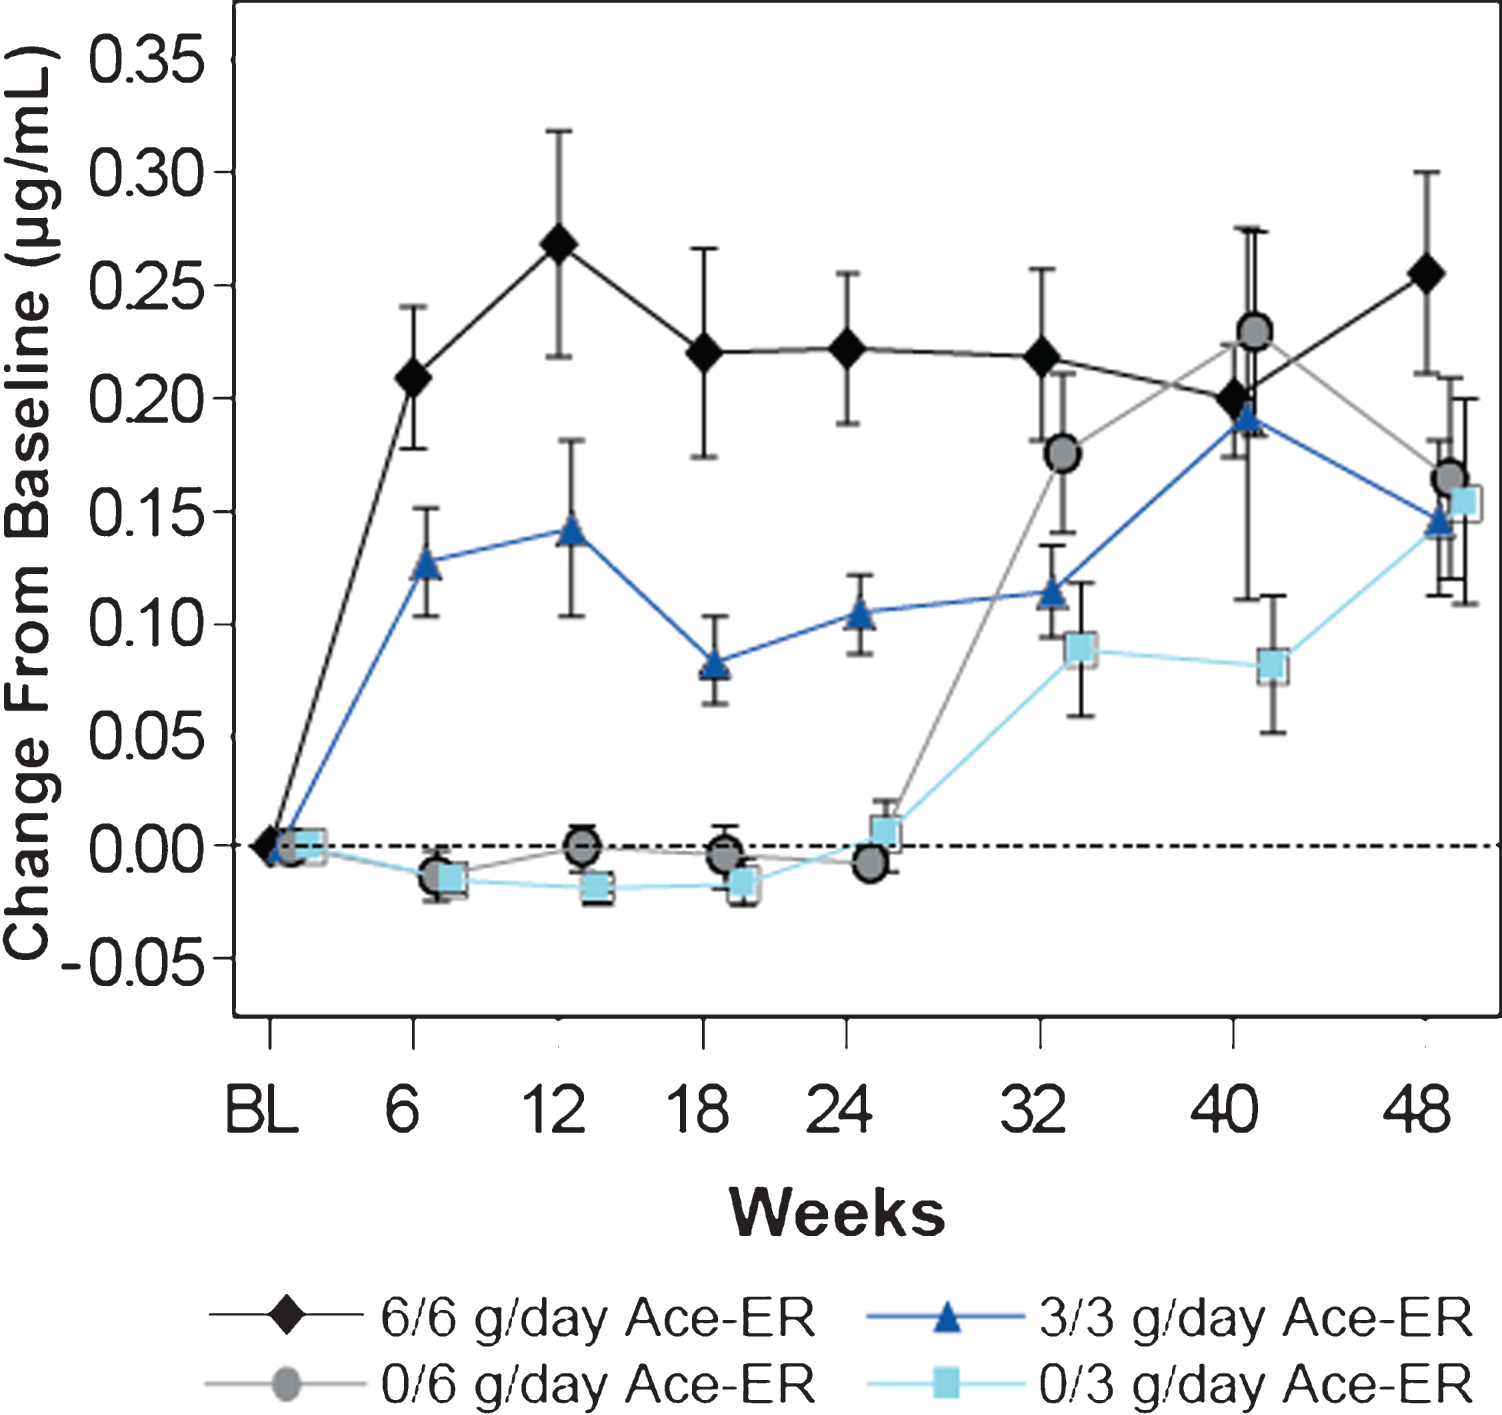
Fig.3
Upper Extremity Composite (UEC) Strength over 48 Weeks UEC muscle strength change from baseline in kg is shown. On the left panel, the arithmetic means (±SE) are shown for the data collected. On the right panel, the least squares (LS) means are shown from the GEE model for the 48 week comparison of the combined 6 g/day group versus the combined 3 g/day group as shown.
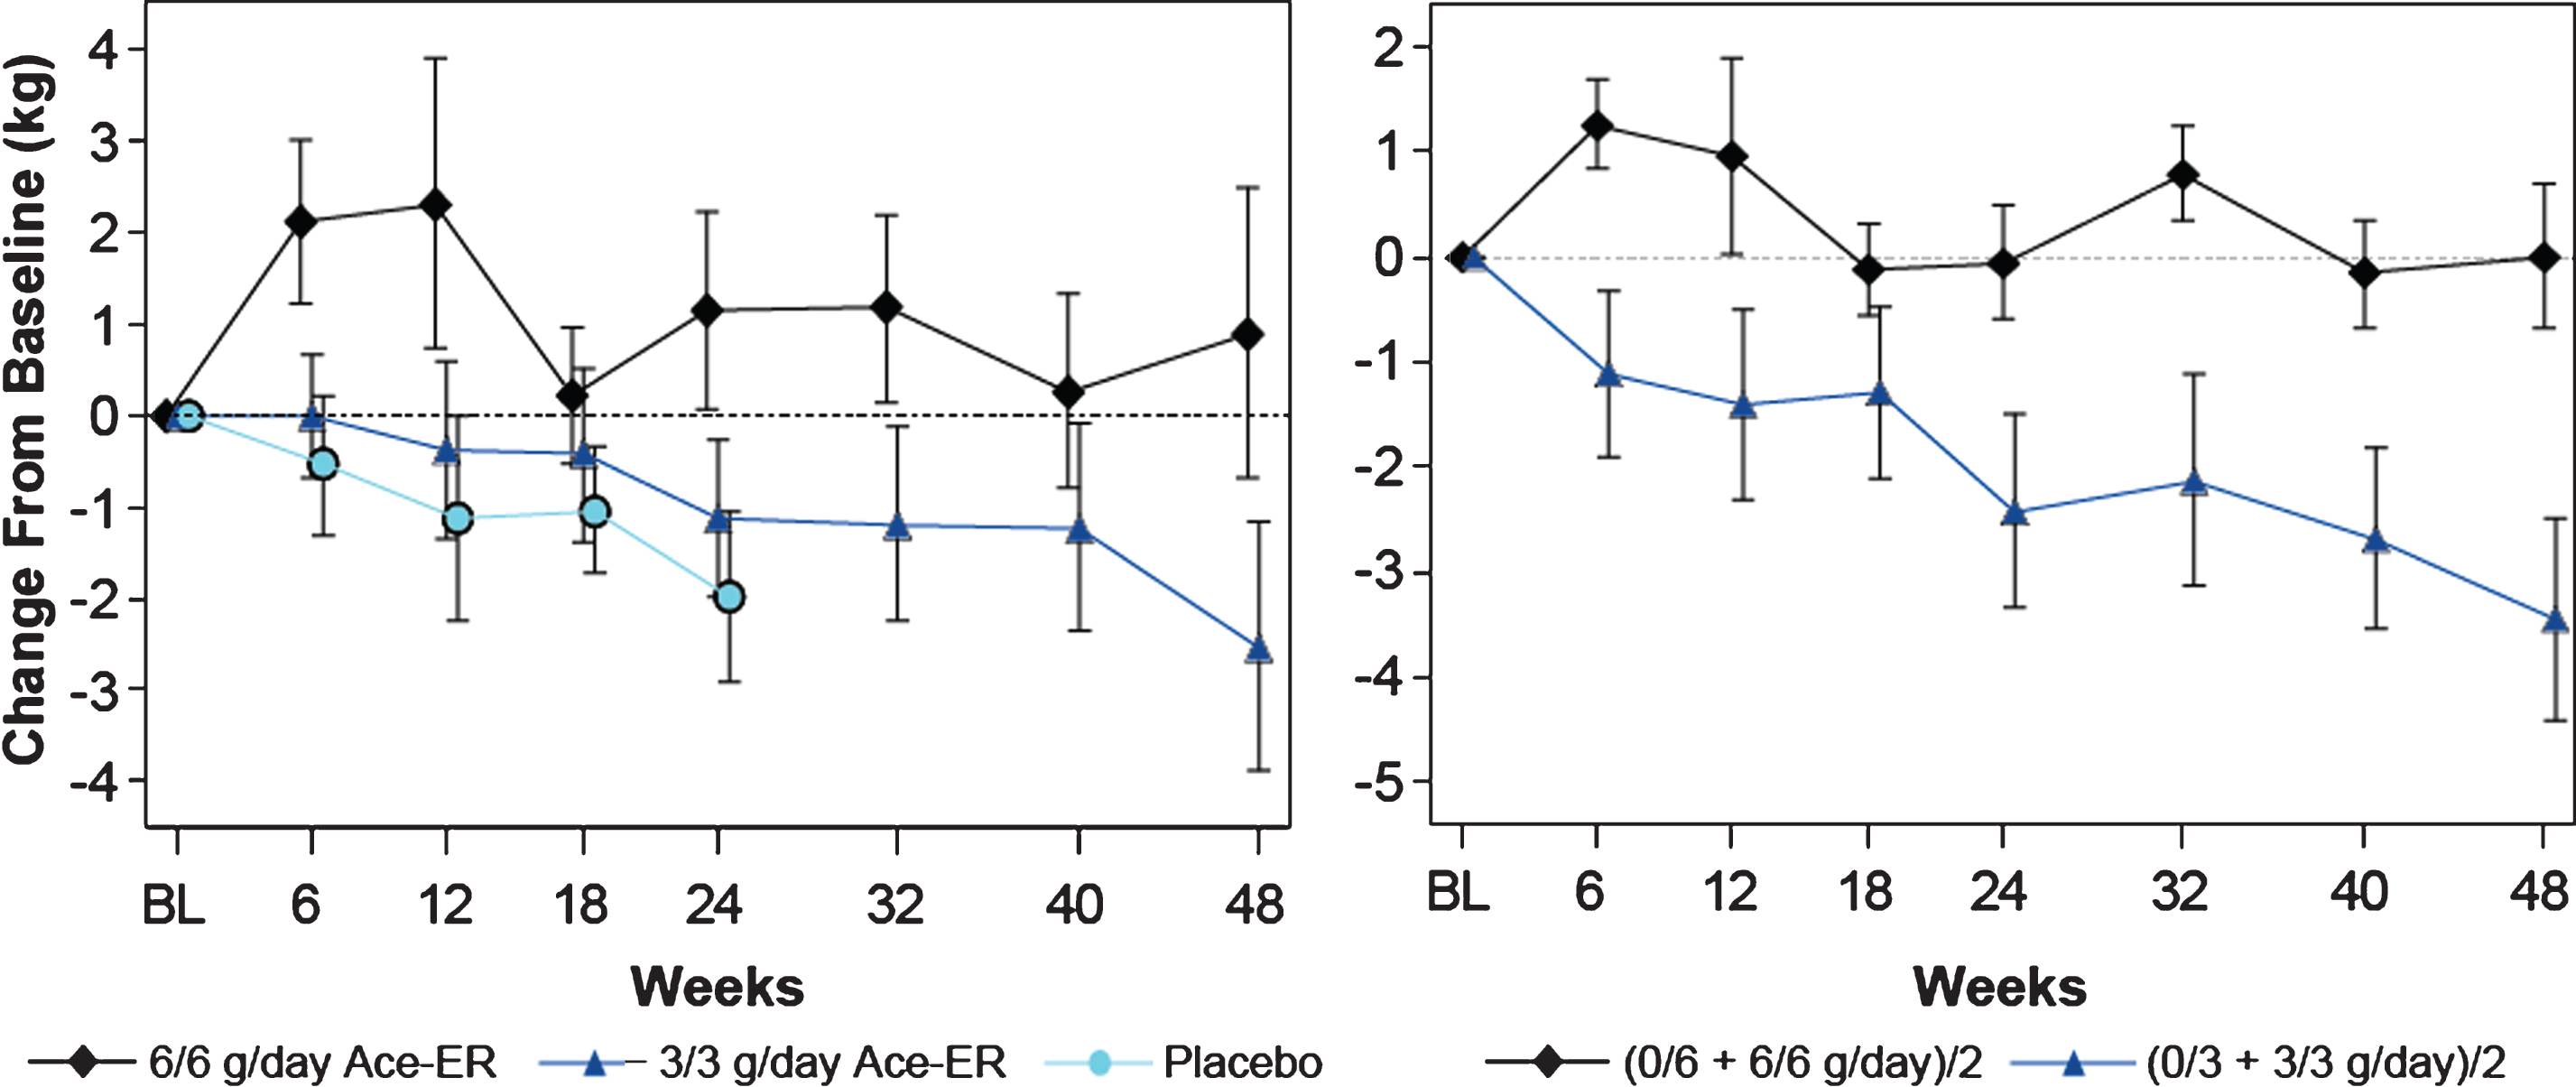
Fig.4
Lower Extremity Composite (Upper) and Quadriceps (Lower) Muscle Strength. LEC muscle strength in kg over the 48-week period is shown. The top panels represent the LEC, and the lower two panels depict the quadriceps data (knee extensors). The graphs of the arithmetic means (±SE) for the original 6 g/day, 3 g/day and placebo groups are shown in the left vertical pair. On the right vertical pair are the LS means graphs calculated using the GEE model for the combined 6 g/day versus combined 3 g/day groups analysis.
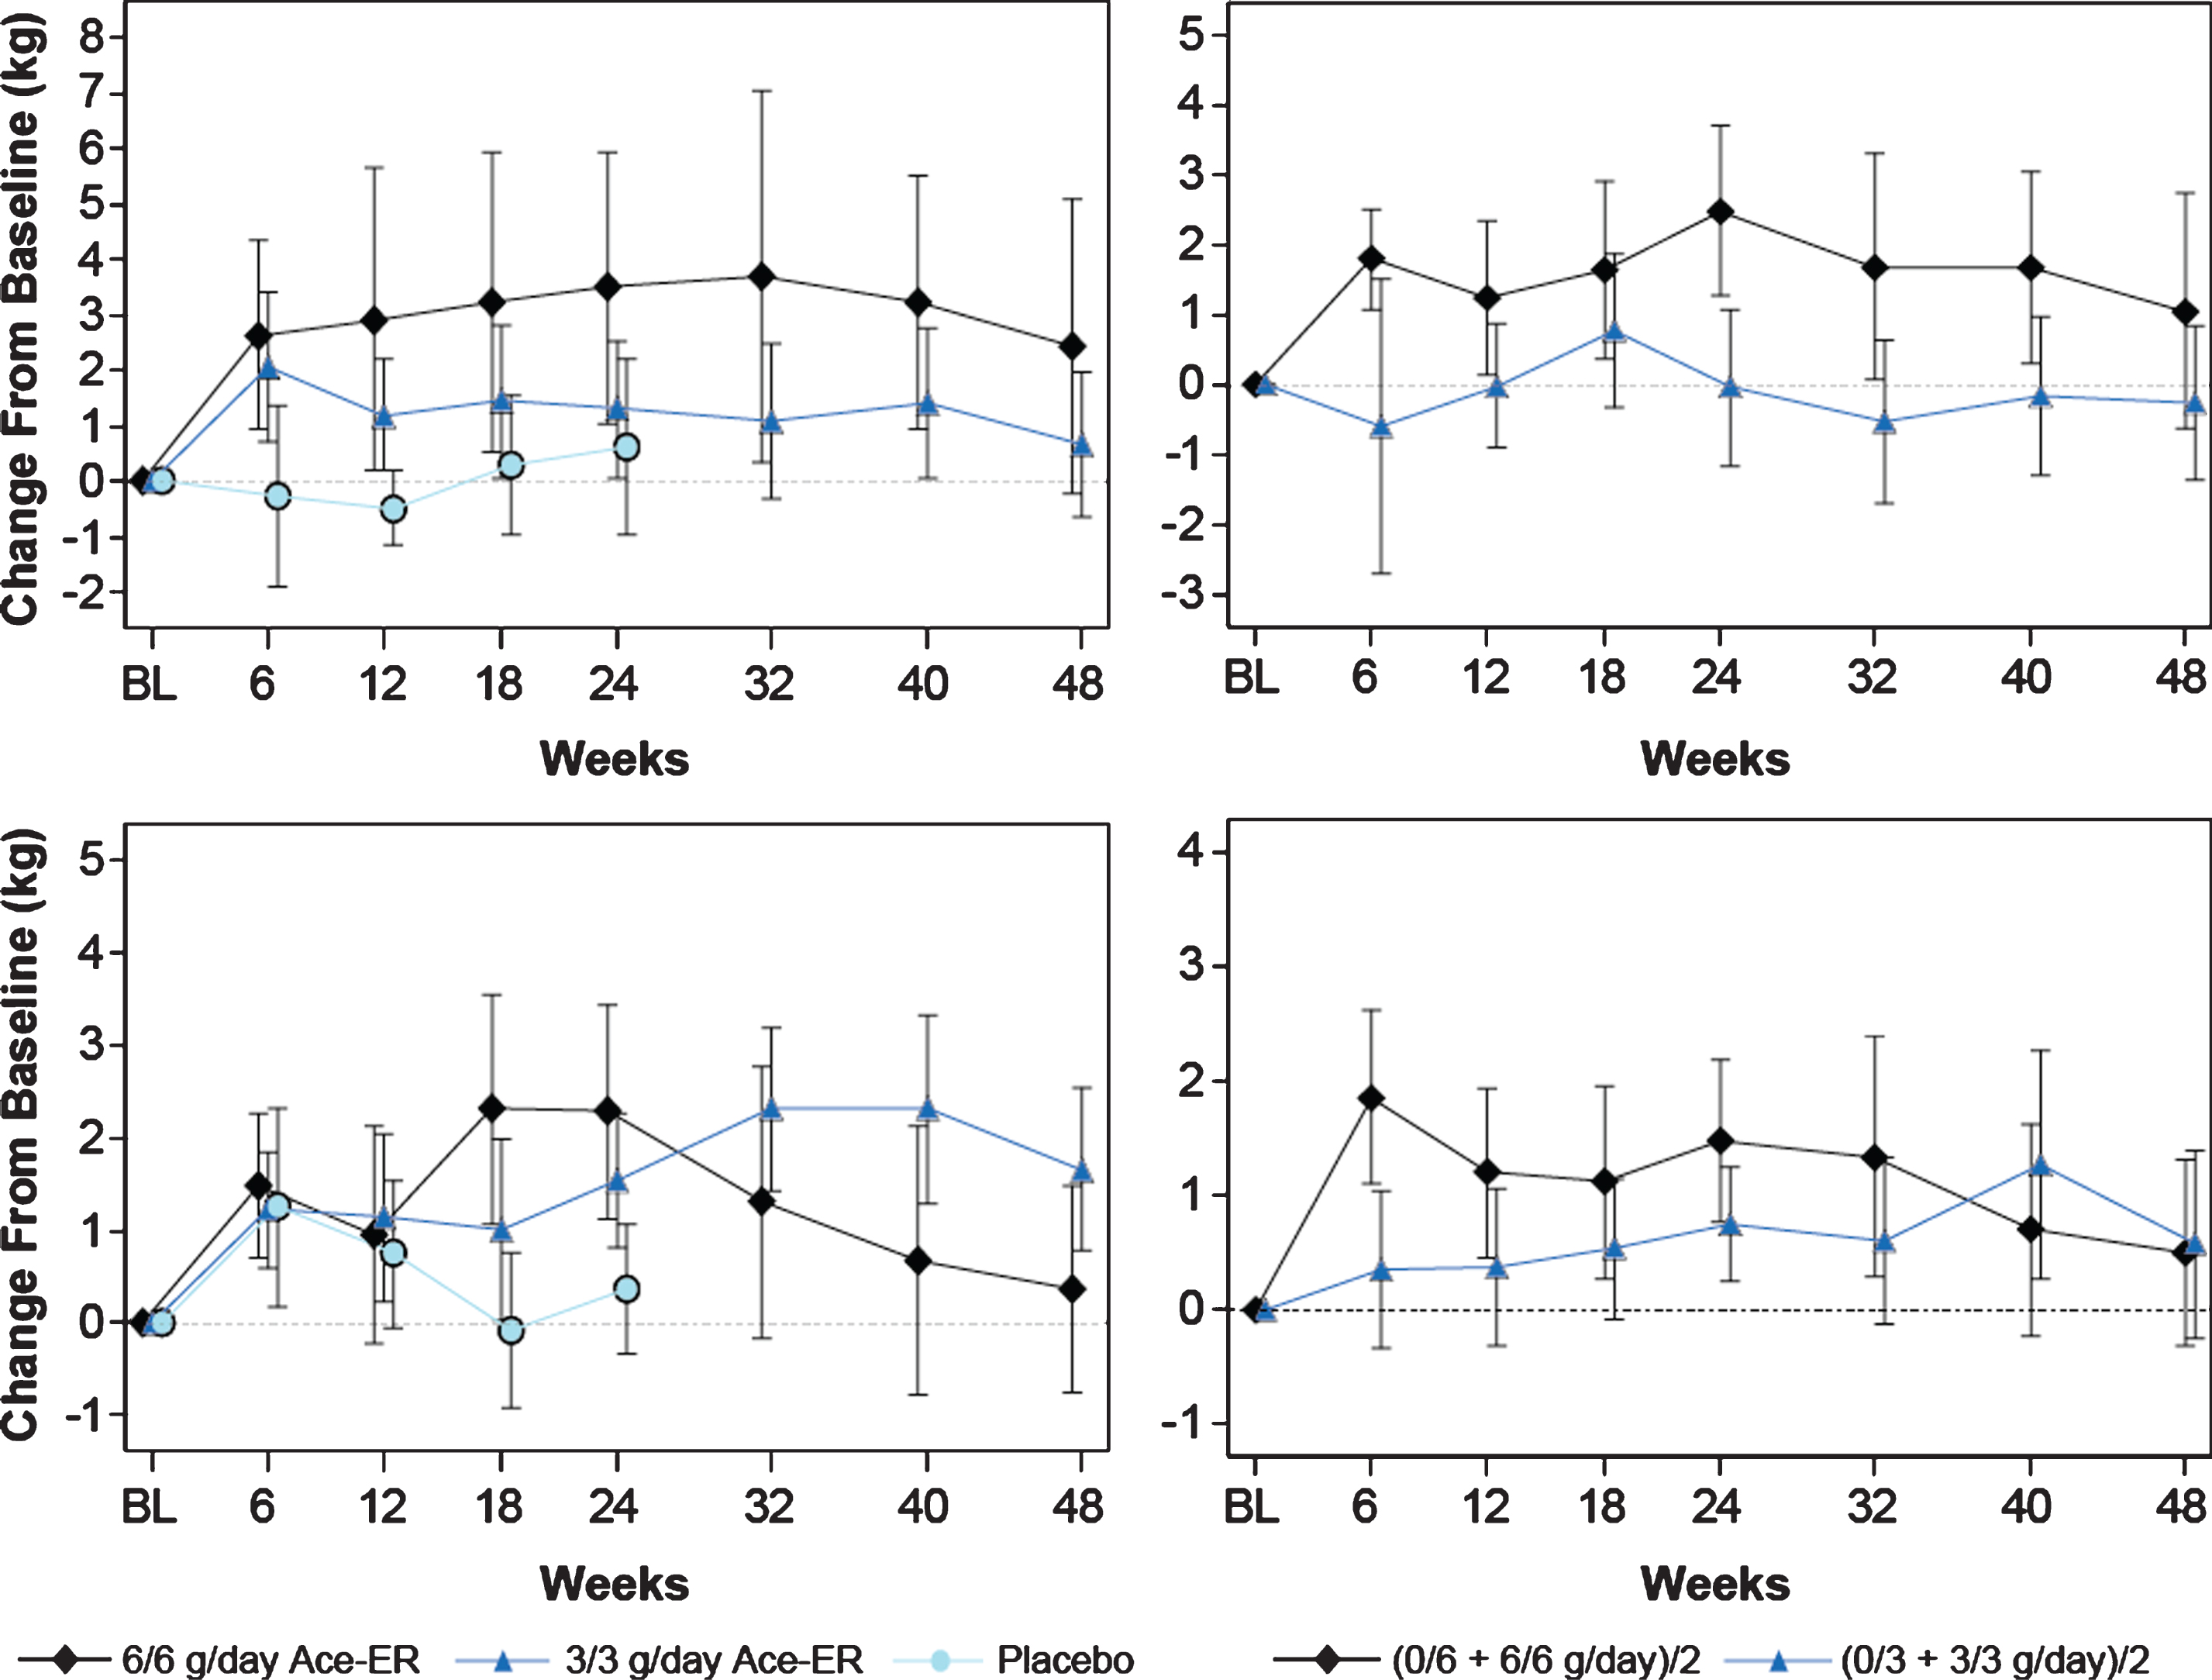
Fig.5
MRI (T1 weighted) Scans of Example Subject Lower Extremities Cross-sectional T1 weighted MRI scans of muscle groups of the upper leg of 3 selected GNEM subjects. The top panel shows the severity and specificity of destruction in the posterior compartment of the thigh compared with the quadriceps and had a score of 5. The two lower panels show substantial disease with scores in the 3 range. The mean scores for the key muscles in this posterior part of the thigh ranged from 3.8 to 4.1 for the overall population.
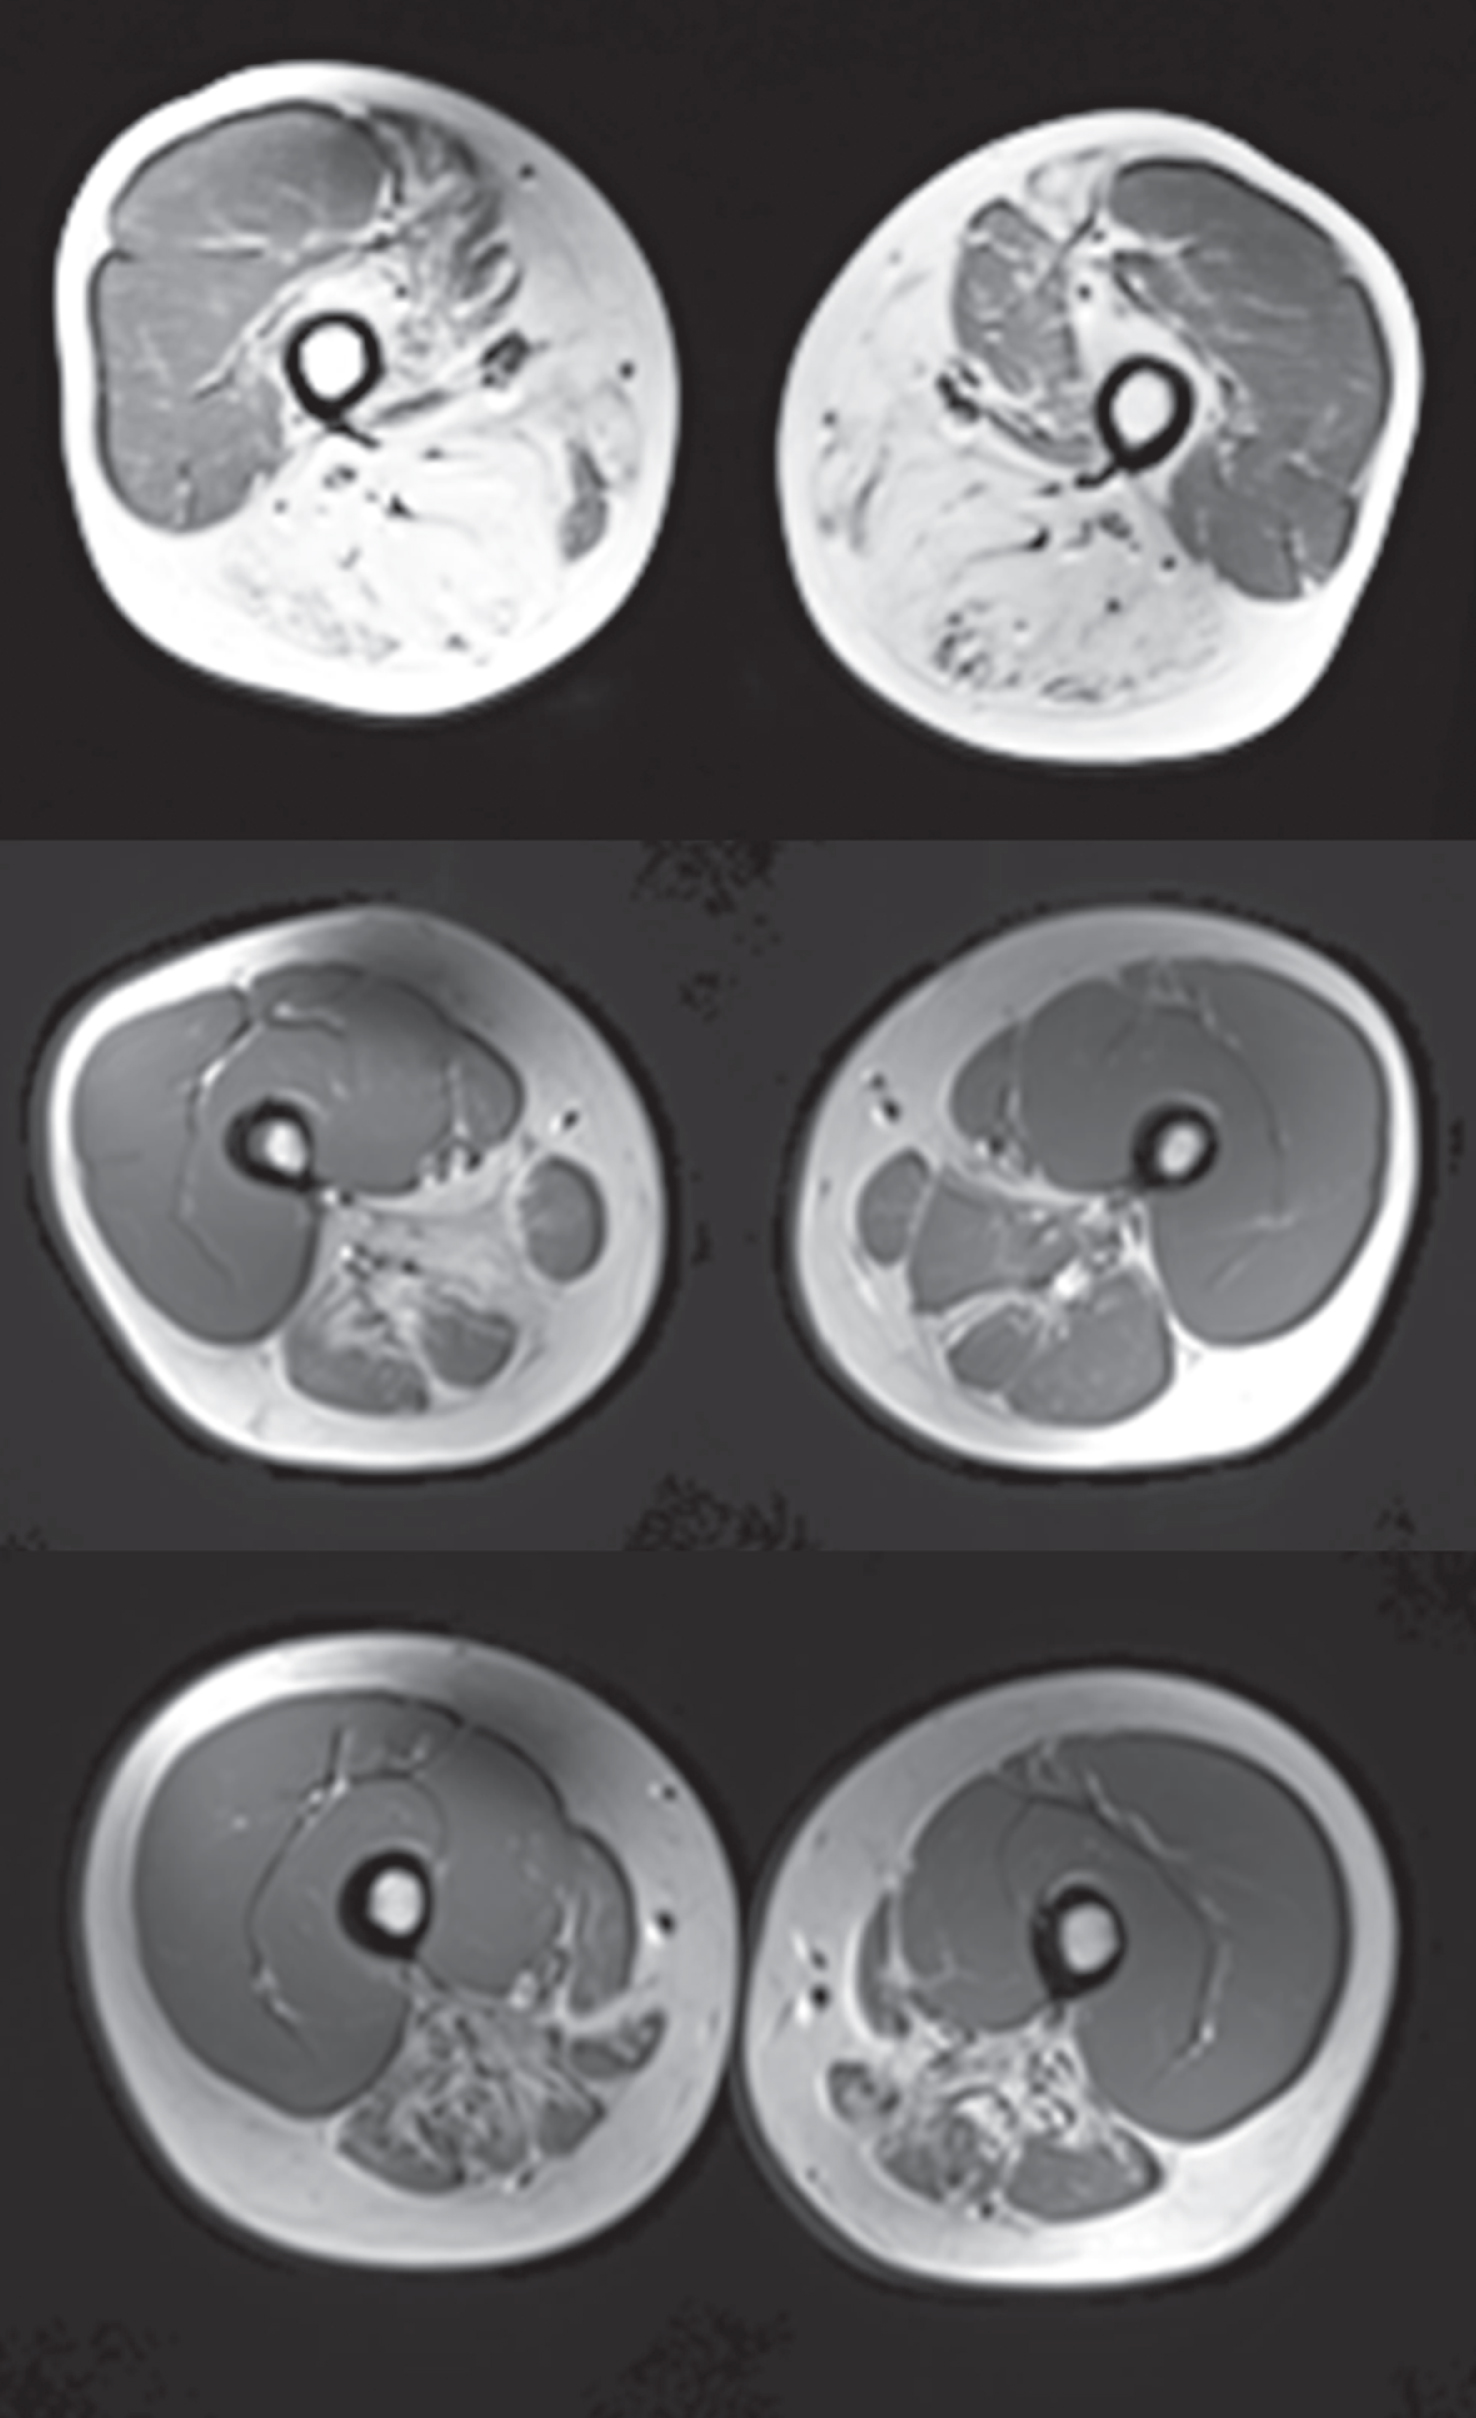
Table 1
Patient demographics, disease history, and baseline muscle strength
| Category and Statistic | 6 g/day | 3 g/day | Placebo | Total |
| N = 15 | N = 18 | N = 14 | N = 47 | |
| Age (y) | ||||
| Mean (SD) | 42.8 (8.86) | 40.7 (12.71) | 35.3 (7.39) | 39.7 (10.42) |
| Median (min, max) | 43.0 (27, 57) | 38.5 (18, 64) | 33.0 (23, 47) | 38.0 (18, 64) |
| Sex –n (%) | ||||
| Male | 6 (40.0) | 9 (50.0) | 3 (21.4) | 18 (38.3) |
| Female | 9 (60.0) | 9 (50.0) | 11 (78.6) | 29 (61.7) |
| Descent –n (%) | ||||
| Persian Jewish | 10 (66.7) | 10 (55.6) | 8 (57.1) | 28 (59.6) |
| Asian | 1 (6.7) | 4 (22.2) | 4 (28.6) | 9 (19.1) |
| European | 1 (6.7) | 3 (16.7) | 2 (14.3) | 6 (12.8) |
| Other | 3 (20.0) | 1 (5.6) | 0 | 4 (8.5) |
| Randomization Strata –n (%) | ||||
| Screening 6MWT <200 m | 4 (26.7) | 6 (33.3) | 4 (28.6) | 14 (29.8) |
| Screening 6MWT ≥200 m | 11 (73.3) | 12 (66.7) | 10 (71.4) | 33 (70.2) |
| Age at symptom onset (y) | ||||
| Mean (SD) | 27.1 (7.11) | 28.7 (9.25) | 26.6 (6.71) | 27.6 (7.79) |
| Median (min, max) | 27.0 (13, 38) | 26.5 (9, 50) | 26.0 (18, 45) | 27.0 (9, 50) |
| Orthotic Use n (%) | 10 (66.7) | 13 (72.2) | 5 (35.7) | 28 (59.6) |
| Mean age (SD) | 37.2 (8.47) | 35.0 (10.72) | 30.6 (6.77) | 35.0 (9.33) |
| Median age(min, max) | 38.5 (25, 48) | 34.0 (17, 58) | 30.0 (20, 37) | 34.5 (17, 58) |
| Walking Device Use n (%) | 5 (33.3) | 12 (66.7) | 7 (50.0) | 24 (51.1) |
| Mean age (SD) | 39.6 (9.71) | 41.8 (11.85) | 32.6 (8.90) | 38.6 (10.99) |
| Median age (min, max) | 42.0 (26, 52) | 45.0 (27, 62) | 31.0 (22, 46) | 38.5 (22, 62) |
| Wheelchair/Scooter Use n (%) | 2 (13.3) | 5 (27.8) | 4 (28.6) | 11 (23.4) |
| Mean age (SD) | 30.0 (5.66) | 44.0 (11.4) | 33.0 (7.66) | 37.5 (10.64) |
| Median age (min, max) | 30.0 (26, 34) | 50.0 (28, 54) | 31.0 (27, 43) | 35.0 (26, 54) |
| Baseline Percent Predicted | ||||
| HHD Upper Muscle Strength | ||||
| Gross Grip Strength | 52.80 (27.78) | 40.57 (19.30) | 44.05 (24.53) | 45.51 (23.87) |
| Elbow Flex | 50.68 (28.61) | 43.24 (20.46) | 45.05 (21.77) | 46.15 (23.41) |
| Elbow Extensors | 46.93 (26.93) | 39.16 (18.64) | 37.73 (16.20) | 41.21 (20.96) |
| Shoulder Abductors | 48.38 (27.78) | 38.64 (15.86) | 40.79 (16.53) | 42.39 (20.57) |
| Upper Extremity | 50.37 (24.08) | 40.57 (15.36) | 42.54 (18.13) | 44.28 (19.36) |
| Baseline Percent Predicted HHD | ||||
| Lower Extremity Muscle Strength | ||||
| Hip Flexors | 14.36 (13.75) | 4.61 (6.81) | 7.41 (9.56) | 8.64 (10.92) |
| Hip Extensors | 34.69 (21.46) | 25.91 (16.87) | 26.73 (16.35) | 28.96 (18.35) |
| Hip Abductors | 56.15 (23.12) | 43.76 (21.22) | 52.63 (18.44) | 50.35 (21.33) |
| Hip Adductors | 24.21 (16.99) | 12.69 (8.93) | 24.66 (14.60) | 19.93 (14.52) |
| Knee Flexors | 22.39 (25.41) | 10.86 (13.63) | 16.48 (16.63) | 16.21 (19.16) |
| Lower Extremity | 28.78 (16.62) | 18.30 (10.98) | 23.49 (11.76) | 23.19 (13.68) |
| Baseline Percent Predicted HHD | ||||
| Quadriceps Muscle Strength | ||||
| Knee Extensors | 61.25 (14.36) | 56.34 (13.86) | 54.93 (15.05) | 57.49 (14.31) |
Table 2
Upper Extremity Composites (UEC), Lower Extremity Composites (LEC), and the quadriceps over 24 and 48 weeks of study
| Week 24 Treatment Comparisons | Week 48 Treatment Comparisons | |||||
| 6 g/day Ace-ER (N = 15) | 3 g/day Ace-ER (N = 18) | 6/6 + 0/6 g (N = 24) | ||||
| vs Placebo (N = 14) | vs Placebo (N = 14) | vs. 3/3 + 0/3 g (N = 23) | ||||
| LS means difference | P-Value | LS means difference | P-Value | LS means difference | P-Value | |
| (95% CI) | (95% CI) | (95% CI) | ||||
| All Subjects | ||||||
| UEC (kg) | +2.33 (0.11, 4.55) | 0.040 | +0.59 (–1.74, 2.92) | 0.62 | +3.46 (1.17, 5.75) | 0.0031 |
| LEC (kg) | +1.06 (–3.04, 5.17) | 0.61 | +1.52 (–2.34, 5.38) | 0.44 | +1.31 (–2.49, 5.10) | 0.50 |
| Quadriceps (kg) | +1.65 (–0.91, 4.21) | 0.21 | +1.22 (–0.65, 3.09) | 0.20 | –0.07 (–2.32, 2.18) | 0.95 |
| ≥200 Meter 6MWT Subgroup | ||||||
| UEC (kg) | +3.10 (0.14, 6.06) | 0.040 | +2.07 (–1.10, 5.23) | 0.20 | +4.69 (2.06, 7.33) | 0.0005 |
| LEC (kg) | +2.20 (–3.51, 7.91) | 0.45 | +2.68 (–2.05, 7.41) | 0.27 | +1.36 (–3.68, 6.40) | 0.60 |
| Quadriceps (kg) | +3.31 (0.06, 6.56) | 0.046 | +2.48 (–0.01, 4.97) | 0.05 | –0.33 (–3.23, 2.57) | 0.82 |
CI = confidence interval; HHD = hand-held dynamometry; LS = least squares; Ace-ER = sialic acid-extended release. Individual muscle group scores are comprised of the averages of the left- and right-side data. The Ace-ER comparisons are based on the LS means and CI derived from the GEE model.
Table 3
Individual muscle comparison for the UEC, LEC, and quadriceps
| HHD | Score | Week 24 Treatment Comparisons | Week 48 Treatment Comparisons | ||
| 6 g/day Ace-ER (N = 15) | 3 g/day Ace-ER (N = 18) | 6/6 + 0/6 g Ace-ER (N = 24) | 6/6 g Ace-ER (N = 15) | ||
| vs Placebo (N = 14) | vs Placebo (N = 14) | vs 3/3 + 0/3 g (N = 23) | vs 3/3 g (N = 18) | ||
| LS means | LS means | LS means | LS means | ||
| difference (95% CI) | difference (95% CI) | difference (95% CI) | difference (95% CI) | ||
| Upper Extremity Composite | |||||
| UEC (kg) | +2.33 (0.11, 4.55)* | +0.59 (–1.74, 2.92) | +3.46 (1.17, 5.75)** | +2.82 (–0.75, 6.39) | |
| Upper Extremity Muscle Groups | |||||
| Grip | Force (kg) | +1.51 (0.42, 2.60) | +0.14 (–1.23, 1.51) | +0.82 (–0.66, 2.29) | +1.47 (–0.66, 3.59) |
| % Predicted | +4.80 (1.45, 8.15) | +0.64 (–3.034, 4.31) | +2.50 (–1.71, 6.71) | +3.47 (–1.79, 8.73) | |
| Elbow Flexors | Force (kg) | +0.54 (–0.25, 1.34) | +0.52 (0.04, 1.00) | +0.63 (–0.20, 1.46) | +0.32 (–0.97, 1.60) |
| % Predicted | +2.06 (–1.95, 6.07) | +3.03 (0.74, 5.33) | +2.37 (–1.60, 6.34) | –0.78 (–7.11, 5.56) | |
| Elbow Extensors | Force (kg) | +0.80 (–0.11, 1.71) | +0.45 (–0.24, 1.15) | +0.24 (–0.35, 0.83) | +0.40 (–0.50, 1.30) |
| % Predicted | +4.37 (–0.70, 9.44) | +3.31 (–0.95, 7.56) | +1.69 (–1.60, 4.98) | +1.77 (–3.15, 6.69) | |
| Shoulder Abductors | Force (kg) | +0.32 (–0.55, 1.19) | –0.07 (–0.91, 0.78) | +1.31 (0.47, 2.16) | +1.00 (–0.17, 2.16) |
| % Predicted | +0.67 (–4.82, 6.17) | –0.42 (–5.64, 4.81) | +6.30 (1.37, 11.22) | +3.55 (–3.13, 10.22) | |
| Lower Extremity Composite | |||||
| LEC (kg) | +1.06 (–3.04, 5.17) | +1.52 (–2.34, 5.38) | +1.31 (–2.49, 5.10) | –0.25 (–4.33, 3.83) | |
| Lower Extremity Muscle Groups | |||||
| Hip Abductors | Force (kg) | +0.53 (–1.10, 2.17) | +1.29 (–0.29, 2.87) | –0.47 (–2.20, 1.25) | –0.54 (–2.76, 1.68) |
| % Predicted | +0.94 (–5.21, 7.10) | +5.62 (–2.22, 13.47) | –1.95 (–9.62, 5.72) | –4.37 (–14.50, 5.76) | |
| Hip Adductors | Force (kg) | –0.22 (–1.20, 0.76) | +0.12 (–0.84, 1.07) | +0.44 (–0.72, 1.61) | –0.23 (–1.22, 0.77) |
| % Predicted | –0.61 (–4.79, 3.57) | +0.43 (–3.81, 4.67) | +2.47 (–3.08, 8.03) | –1.22 (–5.60, 3.17) | |
| Hip Extensors | Force (kg) | +1.43 (–0.73, 3.59) | –0.07 (–1.85, 1.71) | +1.60 (–0.16, 3.36) | +0.89 (–1.31, 3.08) |
| % Predicted | +3.15 (–3.33, 9.63) | –0.18 (–5.58, 5.22) | +4.64 (–0.75, 10.04) | +1.33 (–5.10, 7.75) | |
| Hip Flexors | Force (kg) | –0.27 (–1.66, 1.13) | –0.40 (–1.31, 0.52) | +0.04 (–1.02, 1.11) | –0.31 (–1.09, 0.47) |
| % Predicted | –0.60 (–3.21, 2.02) | –1.03 (–3.04, 0.99) | +0.23 (–1.81, 2.26) | –0.49 (–2.30, 1.32) | |
| Knee Flexors | Force (kg) | +0.32 (–0.38, 1.01) | +0.15 (–0.45, 0.76) | +0.11 (–0.49, 0.70) | 0.49 (–0.20, 1.18) |
| % Predicted | +1.58 (–1.47, 4.64) | +0.53 (–2.39, 3.45) | +0.92 (–1.66, 3.51) | +2.35 (–0.83, 5.52) | |
| Quadriceps | |||||
| Knee Extensors | Force (kg) | +1.65 (–0.91, 4.21) | +1.22 (–0.65, 3.09) | –0.07 (–2.32, 2.18) | –1.43 (–4.12, 1.25) |
| % Predicted | +4.30 (–0.95, 9.55) | +4.10 (0.04, 8.16) | –0.64 (–5.88, 4.60) | –4.39 (–10.73, 1.96) | |
*P = 0.040; **P = 0.0031 CI = confidence interval; HHD = hand-held dynamometry; LS = least squares; Ace-ER = sialic acid-extended release; Individual muscle group scores are comprised of the averages of the left- and right-side data. The Ace-ER comparisons are based on the LS means and CI derived from the GEE model.
Table 4
Evaluation of other clinical endpoints at week 24 and week 48
| Lower/Upper Extremity | Week 24 Treatment Comparisons | Week 48 Treatment Comparisons | ||||||
| Functional Endpoints | ||||||||
| 6 g/day Ace-ER (N = 15) | 3 g/day Ace-ER (N = 18) | 6/6 + 0/6 g/day Ace-ER (N = 24) | 6/6 g/day Ace-ER (N = 15) | |||||
| vs Placebo (N = 14) | vs Placebo (N = 14) | vs 3/3 + 0/3 g/day Ace-ER (N = 23) | vs 3/3 g/day Ace-ER (N = 18) | |||||
| LS means | p-value | LS means | p-value | LS means | p-value | LS means | p-value | |
| difference | difference | difference | Difference | |||||
| (95% CI) | (95% CI) | (95% CI) | (95% CI) | |||||
| 6MWT (m) | +0.53 | 0.95 | –6.65 | 0.44 | +2.41 | 0.78 | –2.80 | 0.78 |
| (–16.45, 17.52) | (–23.70, 10.39) | (–14.30, 19.12) | (–22.88, 17.28) | |||||
| Gait Speed: Comfortable Gait (cm/sec) | +0.64 | 0.90 | –5.19 | 0.33 | +1.51 | 0.65 | +3.03 | 0.29 |
| (–9.48, –10.76) | (–15.70, 5.32) | (–5.03, 8.06) | (–2.56, 8.62) | |||||
| Gait Speed Maximum Gait (cm/sec) | +1.65 | 0.76 | –6.16 | 0.23 | +2.01 | 0.59 | +4.37 | 0.22 |
| (–8.86, 12.16) | (–16.21, 3.89) | (–5.24, 9.26) | (–2.65, 11.38) | |||||
| Stair Climb Test | –2.14 | 0.25 | –2.03 | 0.30 | –2.42 | 0.41 | –5.02 | 0.38 |
| (–5.79, 1.51) | (–5.83, 1.78) | (–8.15, 3.31) | (–16.14, 6.10) | |||||
| Sit-to-stand Test | +0.92 | 0.28 | +0.25 | 0.80 | +1.84 | 0.086 | +1.32 | 0.22 |
| (–0.76, 2.61) | (–1.67, 2.17) | (–0.26, 3.93) | (–0.80, 3.44) | |||||
| Weighted Arm-lift Test | –0.59 | 0.80 | +0.35 | 0.89 | +2.37 | 0.41 | +2.90 | 0.076 |
| (–5.19, 4.01) | (–4.45, 5.14) | (–3.23, 7.98) | (–0.31, 6.10) | |||||
Abbreviations: 6MWT = six minute walk test; CI = confidence interval; cm = centimeters; LS = least squares; m = meters; Ace-ER = sialic acid extended release; sec = seconds. Treatment comparisons are based on the LS means and CI derived from the GEE model.
Table 5
Comparison of changes from baseline in GNEM-FAS scores at week 48
| Ace-ER Treatment Group | LS Means Difference (95% CI) | |||||||||
| GNEM-FAS Score | 6/6 g | 3/3 g | 0/6 g | 0/3 g | 6/6+0/6 g | p-value | 6/6 g vs. 3/3 g | p-value | ||
| N = 15 | N = 18 | N = 9 | N = 5 | vs 3/3+0/3 g | ANCOVA | GEE | ANCOVA | GEE | ||
| Total | –2.73 | –5.47 | –1.33 | –6.00 | +4.03 | 0.086 | 0.024 | +3.09 | 0.22 | 0.24 |
| (–0.60, 8.66) | (–1.87, 8.05) | |||||||||
| Mobility | –0.07 | –2.53 | –1.0 | –1.6 | +1.77 | 0.087 | 0.032 | +2.67 | 0.017 | 0.0087 |
| (–0.27, 3.81) | (0.50, 4.85) | |||||||||
| Upper Extremity | –0.33 | –1.35 | –0.11 | –2.40 | +1.86 | 0.096 | 0.051 | +1.37 | 0.25 | 0.28 |
| (–0.34, 4.05) | (–1.00, 3.73) | |||||||||
| Self-care | –2.33 | –1.59 | –0.22 | –2.00 | +0.71 | 0.40 | 0.30 | –0.57 | 0.53 | 0.53 |
| (–0.96, 2.37) | (–2.35, 1.22) | |||||||||
Abbreviations: ANCOVA = analysis of covariance; CI = confidence interval; GEE = generalized estimating equation; GNEM-FAS = GNE myopathy-functional activities scale.
Table 6
TEAEs occurring in 3 or more patients in any dose group in the placebo-controlled phase (First 24 Weeks) or overall study (48 Weeks)
| Placebo-controlled Phase | Overall Study | ||||||
| Week 0–24 | Week 0–48 | ||||||
| Ace-ER | Ace-ER | Placebo | Ace-ER | Ace-ER | Ace-ER | Ace-ER | |
| 6 g/day (N = 15) | 3 g/day (N = 18) | (N = 14) | 6/6 g/day (N = 15) | 3/3 g/day (N = 18) | 0/6 g/day (N = 9) | 0/3 g/day (N = 5) | |
| TEAE Preferred term | Subjects with Events, n (%) | ||||||
| Procedural pain | 6 (40.0) | 8 (44.4) | 4 (28.6) | 13 (86.7) | 13 (72.2) | 5 (55.6) | 3 (60.0) |
| Headache | 5 (33.3) | 4 (22.2) | 5 (35.7) | 6 (40.0) | 5 (27.8) | 5 (55.6) | 3 (60.0) |
| Arthralgia | 2 (13.3) | 7 (38.9) | 4 (28.6) | 6 (40.0) | 7 (38.9) | 1 (11.1) | 3 (60.0) |
| Back pain | 2 (13.3) | 5 (27.8) | 4 (28.6) | 4 (26.7) | 7 (38.9) | 3 (33.3) | 2 (40.0) |
| Fatigue | 3 (20.0) | 3 (16.7) | 2 (14.3) | 5 (33.3) | 6 (33.3) | 2 (22.2) | 3 (60.0) |
| Diarrhoea | 4 (26.7) | 6 (33.3) | 0 | 5 (33.3) | 6 (33.3) | 0 | 0 |
| Influenza like illness | 2 (13.3) | 2 (11.1) | 3 (21.4) | 4 (26.7) | 3 (16.7) | 1 (11.1) | 2 (40.0) |
| Musculoskeletal pain | 1 (6.7) | 2 (11.1) | 3 (21.4) | 3 (20.0) | 4 (22.2) | 2 (22.2) | 1 (20.0) |
| Myalgia | 4 (26.7) | 1 (5.6) | 2 (14.3) | 5 (33.3) | 2 (11.1) | 1 (11.1) | 2 (40.0) |
| Nasal congestion | 3 (20.0) | 2 (11.1) | 2 (14.3) | 5 (33.3) | 3 (16.7) | 1 (11.1) | 1 (20.0) |
| Nasopharyngitis | 1 (6.7) | 1 (5.6) | 4 (28.6) | 1 (6.7) | 4 (22.2) | 3 (33.3) | 2 (40.0) |
| Flatulence | 3 (20.0) | 2 (11.1) | 2 (14.3) | 4 (26.7) | 3 (16.7) | 1 (11.1) | 1 (20.0) |
| Pain in extremity | 3 (20.0) | 2 (11.1) | 4 (28.6) | 3 (20.0) | 2 (11.1) | 1 (11.1) | 3 (60.0) |
| Abdominal pain | 3 (20.0) | 3 (16.7) | 1 (7.1) | 4 (26.7) | 3 (16.7) | 1 (11.1) | 0 |
| Hypoaesthesia | 1 (6.7) | 2 (11.1) | 0 | 1 (6.7) | 2 (11.1) | 0 | 0 |
| Contusion | 3 (20.0) | 2 (11.1) | 2 (14.3) | 3 (20.0) | 3 (16.7) | 2 (22.2) | 0 |
| Dyspepsia | 1 (6.7) | 2 (11.1) | 2 (14.3) | 1 (6.7) | 4 (22.2) | 0 | 3 (60.0) |
| Oropharyngeal pain | 0 | 1 (5.6) | 3 (21.4) | 2 (13.3) | 1 (5.6) | 2 (22.2) | 3 (60.0) |
| Fall | 2 (13.3) | 2 (11.1) | 2 (14.3) | 2 (13.3) | 3 (16.7) | 1 (11.1) | 1 (20.0) |
| Nausea | 1 (6.7) | 1 (5.6) | 2 (14.3) | 2 (13.3) | 3 (16.7) | 1 (11.1) | 1 (20.0) |
| Anxiety | 0 | 0 | 1 (7.1) | 2 (13.3) | 3 (16.7) | 1 (11.1) | 0 |
| Cough | 0 | 0 | 3 (21.4) | 1 (6.7) | 2 (11.1) | 2 (22.2) | 1 (20.0) |
| Dizziness | 1 (6.7) | 4 (22.2) | 1 (7.1) | 1 (6.7) | 4 (22.2) | 0 | 1 (20.0) |
| Muscular Weakness | 0 | 3 (16.7) | 0 | 0 | 3 (16.7) | 0 | 0 |
| Rash | 0 | 2 (11.2) | 1 (7.1) | 2 (13.3) | 3 (16.7) | 0 | 1 (20.0) |
| Depression | 0 | 1 (5.6) | 2 (14.3) | 0 | 3 (16.7) | 2 (22.2) | 0 |
| Rhinorrhoea | 1 (6.7) | 0 | 1 (7.1) | 3 (20.0) | 1 (5.6) | 1 (11.1) | 0 |

