
Brain Alterations in Aged OVT73 Sheep Model of Huntington’s Disease: An MRI Based Approach
Abstract
Background:
Huntington’s disease (HD) is a fatal neurodegenerative autosomal dominant disorder with prevalence of 1 : 20000 that has no effective treatment to date. Translatability of candidate therapeutics could be enhanced by additional testing in large animal models because of similarities in brain anatomy, size, and immunophysiology. These features enable realistic pre-clinical studies of biodistribution, efficacy, and toxicity.
Objective and Methods:
Here we non-invasively characterized alterations in brain white matter microstructure, neurochemistry, neurological status, and mutant Huntingtin protein (mHTT) levels in cerebrospinal fluid (CSF) of aged OVT73 HD sheep.
Results:
Similar to HD patients, CSF mHTT differentiates HD from normal sheep. Our results are indicative of a decline in neurological status, and alterations in brain white matter diffusion and spectroscopy metric that are more severe in aged female HD sheep. Longitudinal analysis of aged female HD sheep suggests that the decline is detectable over the course of a year. In line with reports of HD human studies, white matter alterations in corpus callosum correlates with a decline in gait of HD sheep. Moreover, alterations in the occipital cortex white matter correlates with a decline in clinical rating score. In addition, the marker of energy metabolism in striatum of aged HD sheep, shows a correlation with decline of clinical rating score and eye coordination.
Conclusion:
This data suggests that OVT73 HD sheep can serve as a pre-manifest large animal model of HD providing a platform for pre-clinical testing of HD therapeutics and non-invasive tracking of the efficacy of the therapy.
INTRODUCTION
Huntington’s disease (HD) was first described in 1872 and continues to be relentlessly handed down from generation to generation in an autosomal dominant fashion [1]. HD patients develop classical movement disorder phenotypes (ataxia and chorea) that are proceeded by years of profound depression, cognitive and psychiatric disease [2]. HD patients also experience a generalized metabolic disruption in the central nervous system (CNS) and systemically [3–9]. Death occurs approximately 10–15 years after onset of symptoms. HD is caused by a trinucleotide repeat expansion in exon 1 of the HTT gene (≥40 CAG repeats) and is characterized by loss of medium spiny neurons in the striatum and pyramidal neurons of layers 5 and 6 of the motor cortex [10, 11]. Damage later extends to most areas of brain including the thalamus and cerebellum [12–18]. Aggregation of the expanded mutant Huntingtin protein (mHTT) in the brain results in cellular dysfunction, and the rate of aggregation is directly proportional to the uninterrupted CAG repeat length [19–22]. Additionally, the CAG repeat expansion affects splicing of exon 1, leading to retention of intron 1 and production of two aberrant transcripts (2.7 and 7.3 kb), which may also contribute to the pathogenesis of HD [23].
The number of candidate therapies for HD is increasing worldwide, and there is still considerable controversy over whether it is safe to completely silence HTT in the brain [24–26]. Recent evidence in patients treated by antisense oligonucleotides (ASO) to HTT showed lack of effect (Wave Life Sciences ASO, Roche ASO Tominersen with every 16-week dosing) or toxicity (with every 8-week dosing of Tominersen) [27, 28]. Huntingtin protein interacts with > 200 proteins [29–31] and has a multitude of functions in the cell including chemical signaling, axonal transport of vesicles and organelles [32, 33], transcriptional regulation, and anti-apoptotic activity [34–37]. It is unlikely that neurons remain healthy long term in the absence of the normal protein [25, 26, 38, 39].
It remains unclear if the negative readouts from the recent clinical trials are due to HTT knockdown or are a result of toxicity inherent to ASO chemistry in the diseased HD brain. Regardless, these data point to a need for testing therapies in a large animal model of HD, to better understand efficacy and disease related toxicities. Although rodent models of HD mimic some neuropathological and metabolic features of human HD, their brain anatomy and size differ from humans which limits their usefulness for evaluation of therapeutic outcomes and translation to the human brain [40, 41]. This highlights the need for the development and further characterization of large animal models of HD with anatomical similarities to human brain [42–44]. Also, clinically relevant non-invasive biomarkers and neurological outcome measures used in the assessment of therapeutic efficacy in patients can be applied to large animal HD models. As examples, neurological deterioration has been captured using the Unified Huntington’s Disease Rating Scale (UHDRS) and more recently the composite UHDRS (cUHDRS), which assesses motor and cognitive function, behavioral abnormalities, and functional capacity [45]. mHTT in cerebrospinal fluid was among the biochemical readouts used in the aforementioned clinical trials, as it is able to distinguish between control and HD. These assessments can be adapted to large animal models.
At the time of clinical diagnosis, significant degeneration and brain atrophy is present in HD patients; therefore, therapeutic intervention before onset of clinical symptoms is of great importance [18]. The autosomal dominant inheritance pattern of HD allows for the study of pre-manifest HD in patients with affected family members. In pre-HD patients, noninvasive neuroimaging revealed abnormalities in brain volume, neurochemistry (magnetic resonance spectroscopy; MRS) and microstructure of brain (diffusion tensor imaging: DTI), which are detectable years before onset of clinical symptoms [46–51]. Additionally, these MRI metrics correlate with clinical scores (cUHDRS) of disease progression [48, 49, 51]. These sensitive neuroimaging metrics could facilitate tracking of the disease progression in pre-HD patients enrolled in future clinical trials.
To enable therapeutic testing in a large animal of HD, we applied the same clinical metrics used in HD patients to the OVT73 HD sheep model. The OVT73 HD sheep express a full-length human huntingtin cDNA encoding 73 polyglutamine repeats, exhibit huntingtin-positive inclusions without obvious neuronal loss and develop deficits in circadian behavior [5, 44, 52–54]. Here we report that 7–10-year-old HD sheep recapitulate disease similar to pre-HD patients including neurological impairments, presence of mHTT in CSF, and MRI based neurochemical and microstructural alterations.
MATERIALS AND METHODS
Animals and tissue collection
Sheep were maintained at the South Australian Research and Development Institute (SARDI) in accordance with the SARDI/PIRSA Animal Ethics Committee (Approval number 19/02). Animals are kept in large paddocks typical for South Australian farming conditions in mixed control/transgenic groups of similar ages with male cohorts separate from female. A total of 62 aged-matched sheep consist of 17 males (7 HD transgenic, 10 normal) and 45 females (28 transgenic, 17 normal) were used in this study. Males were sacrificed at 7 years of age and females were sacrificed at either 9 or 10 years of age. A group of sheep (5 transgenic female, 4 normal female) were studied twice at 9 year and 10 years of age for the longitudinal study. Cerebrospinal fluid (CSF) and blood samples were collected from all sheep at the time of imaging. For sheep in the longitudinal study, an additional blood and CSF collection was also performed one year before the humane endpoint. Sheep were euthanized using 150 mg/kg sodium pentobarbital overdose. Brain, spinal cord and peripheral tissues were collected for storage at either –80°C or in 10% neutral-buffered formalin. Sheep genotypes were confirmed by PCR amplification of genomic DNA (DNeasy Blood and Tissue Kit; Qiagen, Valencia, CA, USA), extracted from liver, using primers described in [53].
Neurological examination
Standard veterinary neurological examinations including gait, proprioception, and strabismus (loss of eye coordination) assessments were performed on aged-matched transgenic and control male (7 years old) and female sheep (9 and 10 years old). The neurological exams were scored using discrete numbers from 1 to 5 with increasing scores as the response worsens. However, the clinical rating score is calculated by taking the average of all scores, therefore, clinical rating scores contain decimal numbers.
Measurement of mHTT in CSF
Measurement of mHTT was performed by Evotec SE (Hamburg, Germany) using single molecule counting (SMC) assay on CSF collected from control and transgenic sheep in longitudinal study (HD female, n = 5; normal female, n = 4). Evotec’s SMCxPro assay 142 (utilizing antibody combination 2B7/ MW1) was performed with CSF in dilution ratios of 1 : 2 in artificial CSF (aCSF; supplemented with 1% Tween-20 and complete protease inhibitor), applying 150μl of diluted CSF per well for analysis. Technical triplicates of each sample were analyzed for expanded mutant HTT levels by SMCxPro assay 142. HTT levels per sample (in fM) were calculated in reference to the standard curve (using recombinant protein HTT-Q73, a large fragment of 1-573 aa of human HTT, as a standard for assay 142) and analysis was done with 5PL-fit for the dilution curve by GraphPad PRISM software. Measurements were performed in technical triplicates. Several samples were below LOD (for the normal control) and thus not quantifiable.
T1-weighted MRI acquisition
A total of 62 aged-matched sheep consisting of 17 males (7 transgenic, 10 normal) and 45 females (28 transgenic, 17 normal) underwent 3T magnetic resonance imaging (MRI) (Siemens Magnetom Skyra, Siemens Healthcare, Erlangen, Germany) and T1-wieghted images were collected. Before imaging, sheep were pre-medicated with dexmedetomidine (15μg/kg). Sheep were anesthetized using isoflurane administered via a face mask followed by intubation. During MRI anesthesia was maintained by isoflurane gas (1–3%). Age-matched transgenic and normal males and females were imaged simultaneously. Males were imaged at 7 years of age. Females were imaged at either 9 or 10 years of age. For the longitudinal study, five transgenic and 4 normal females were imaged at both 9 and 10 years of age. T1-weighted images were acquired using the following sequence parameters: repetition time (TR)=2360 ms, echo time (TE)=2.78 ms, inversion time (TI)=1190 ms, 3 signal averages, voxel size of 0.6X0.6X0.6 mm3 and were used for structural identification and a template for the MRS voxel positioning and DTI image registration.
MRS and analysis
MR spectra were obtained using single-voxel spectroscopy method in right striatum following shimming. Scan parameters included 9X9X15 mm3 voxel size, repetition time (TR)=2170 ms, echo time (TE)=30 ms, 144 signal averages and spectral bandwidth was 1200 Hz. The LCModel basis set for Philips was used for analysis (https://www.s-provencher.com/pages/lcmodel.shtml). Standard deviations higher than 30% were excluded. The examined metabolites include: tNAA (summed N-acetylaspartate [NAA] and N-acetylaspartylglutamate [NAAG], neuronal integrity marker), tCr (summed creatine [Cr] and phosphocreatine [PCr], brain energy metabolism and potential gliosis marker), tCho (predominantly glycerophosphocholine [GPC] and phosphocholine [PCh], marker of neuronal membrane turnover), Glu+Gln (glutamate [Glu], glutamine ([Gln], neurotransmission), glutathione ([GSH], oxidative status), and myo-inositol ([Ins], gliosis marker). Each metabolite concentration in the transgenic and normal cohort was normalized to the average of that metabolite concentration in the normal sheep cohort collected at the same time point. The percentage of difference of average normalized concentration of each metabolite between transgenic and control group was calculated and plotted. For longitudinal MRS study, spectra of five transgenic and 4 normal female sheep were acquired at both 9 and 10 years of age, and concentrations were normalized to average of concentrations of normal females in the longitudinal study for that age. The normalized metabolite concentration for 9 and 10 years of age were plotted.
DTI and analysis
Diffusion images were acquired using a 2D EPI diffusion sequence. DTI data were collected at b-value of 1000 s/mm2 with 256 diffusion directions, diffusion mode of MDDW and diffusion scheme of Bipolar. DTI was acquired, at two different voxel sizes. Seven-year-old males, a group of 9-year-old females and sheep in the longitudinal study were imaged using the sequence with voxel size of 2.5X2.5X2.5 mm3, TR = 3000 ms, TE = 87 ms. To acquire data at higher resolution, a group of 9-year-old females and 10-year-old females were imaged using the sequence with voxel size of 2X2X2 mm3, TR = 3000 ms, TE = 99 ms. Transgenic and normal sheep DTI data were grouped and compared based on the voxel size and gender. The diffusion images were processed using the DSI Studio software package (June 22, 2016 version, http://dsi-studio.labsolver.org) using tract-based analysis method. Quality of images were inspected before analysis and any image affected by motion or any other artifact was rejected. In DSI-studio, diffusion MR images were converted into SRC file. A brain mask was then conformed onto the source image and the mask was adjusted by alteration of a threshold to select the brain tissue precisely. Adjustment of the mask was completed based upon an individual basis and included removing external fragments as well as smoothing and dilating the mask as necessary. Upon finalizing the mask, the image was reconstructed into a FIB file using the DTI reconstruction method. Regions in motor, parietal and occipital cortices, corpus clausum, rostral and caudal internal capsule and midbrain were defined. To draw the ROIs, voxels were selected manually to include the white matter within the target structure. A deterministic fiber-tracking algorithm was used within DSI Studio, and a seeding region was placed at whole brain in addition to the ROI. Within each region a maximum of 10,000 tracts were analyzed with fiber length min/max of 30/300 mm, 60° angular threshold and 1 mm step size. DTI scalars including fractional anisotropy (FA), apparent diffusion coefficient (ADC), axial diffusivity (AD) and radial diffusivity (RD) were calculated.
Statistical analysis and power analysis
Graphpad Prism 8.0 (GraphPad Software, San Diego, CA) was used for statistical analysis. Significant difference was defined as p < 0.05. Clinical rating scores for neurological deficits were analyzed by Mann Whitney tests, and effect was determined by a Hodges-Lehmanm test. Neurological scores compared by sex (Fig. 1B, HD vs. normal and male vs. female) were analyzed using two-way multiple comparison ANOVAs following with appropriate post-hoc analysis using Bonferroni’s and t-tests. To perform statistical analysis on DTI scalars and MRS, we tested for Gaussian distribution of each group of sheep using D’Agostino and Pearson test. 7-year-old males and 9-year-old females did not follow Gaussian distribution, therefore, to compare HD sheep vs. age/sex matched control sheep, non-parametric Kruskal-Wallis test followed by Dunn’s test was performed. 10-year-old HD sheep followed Gaussian distribution, therefore, to compare them with their age/sex matched control sheep one-way ANOVA was used followed by Dunn’s test. Statistical comparison of slopes of lines connecting DTI scalars of 9- to 10- year-old sheep was done using non-parametric Kruskal-Wallis test followed by Dunn’s test due to non-Gaussian distribution of slopes (tested by D’Agostino and Pearson test). To perform correlation analysis, Normal distribution of data was investigated using D’Agostino and Pearson test. Correlation analysis for data with normal distribution was performed using Pearson test. For non-normal distribution, Spearman correlation analysis was used. A two-tailed p-value determined the significance of correlation. Power analysis was performed using the sample size calculator (ClinCalc.com) where two independent groups with continuous mean were used to determine the sample size (Alpha 0.05, Power 80%). Effect size was calculated by dividing the difference of the means of two group by standard deviation.
Fig. 1
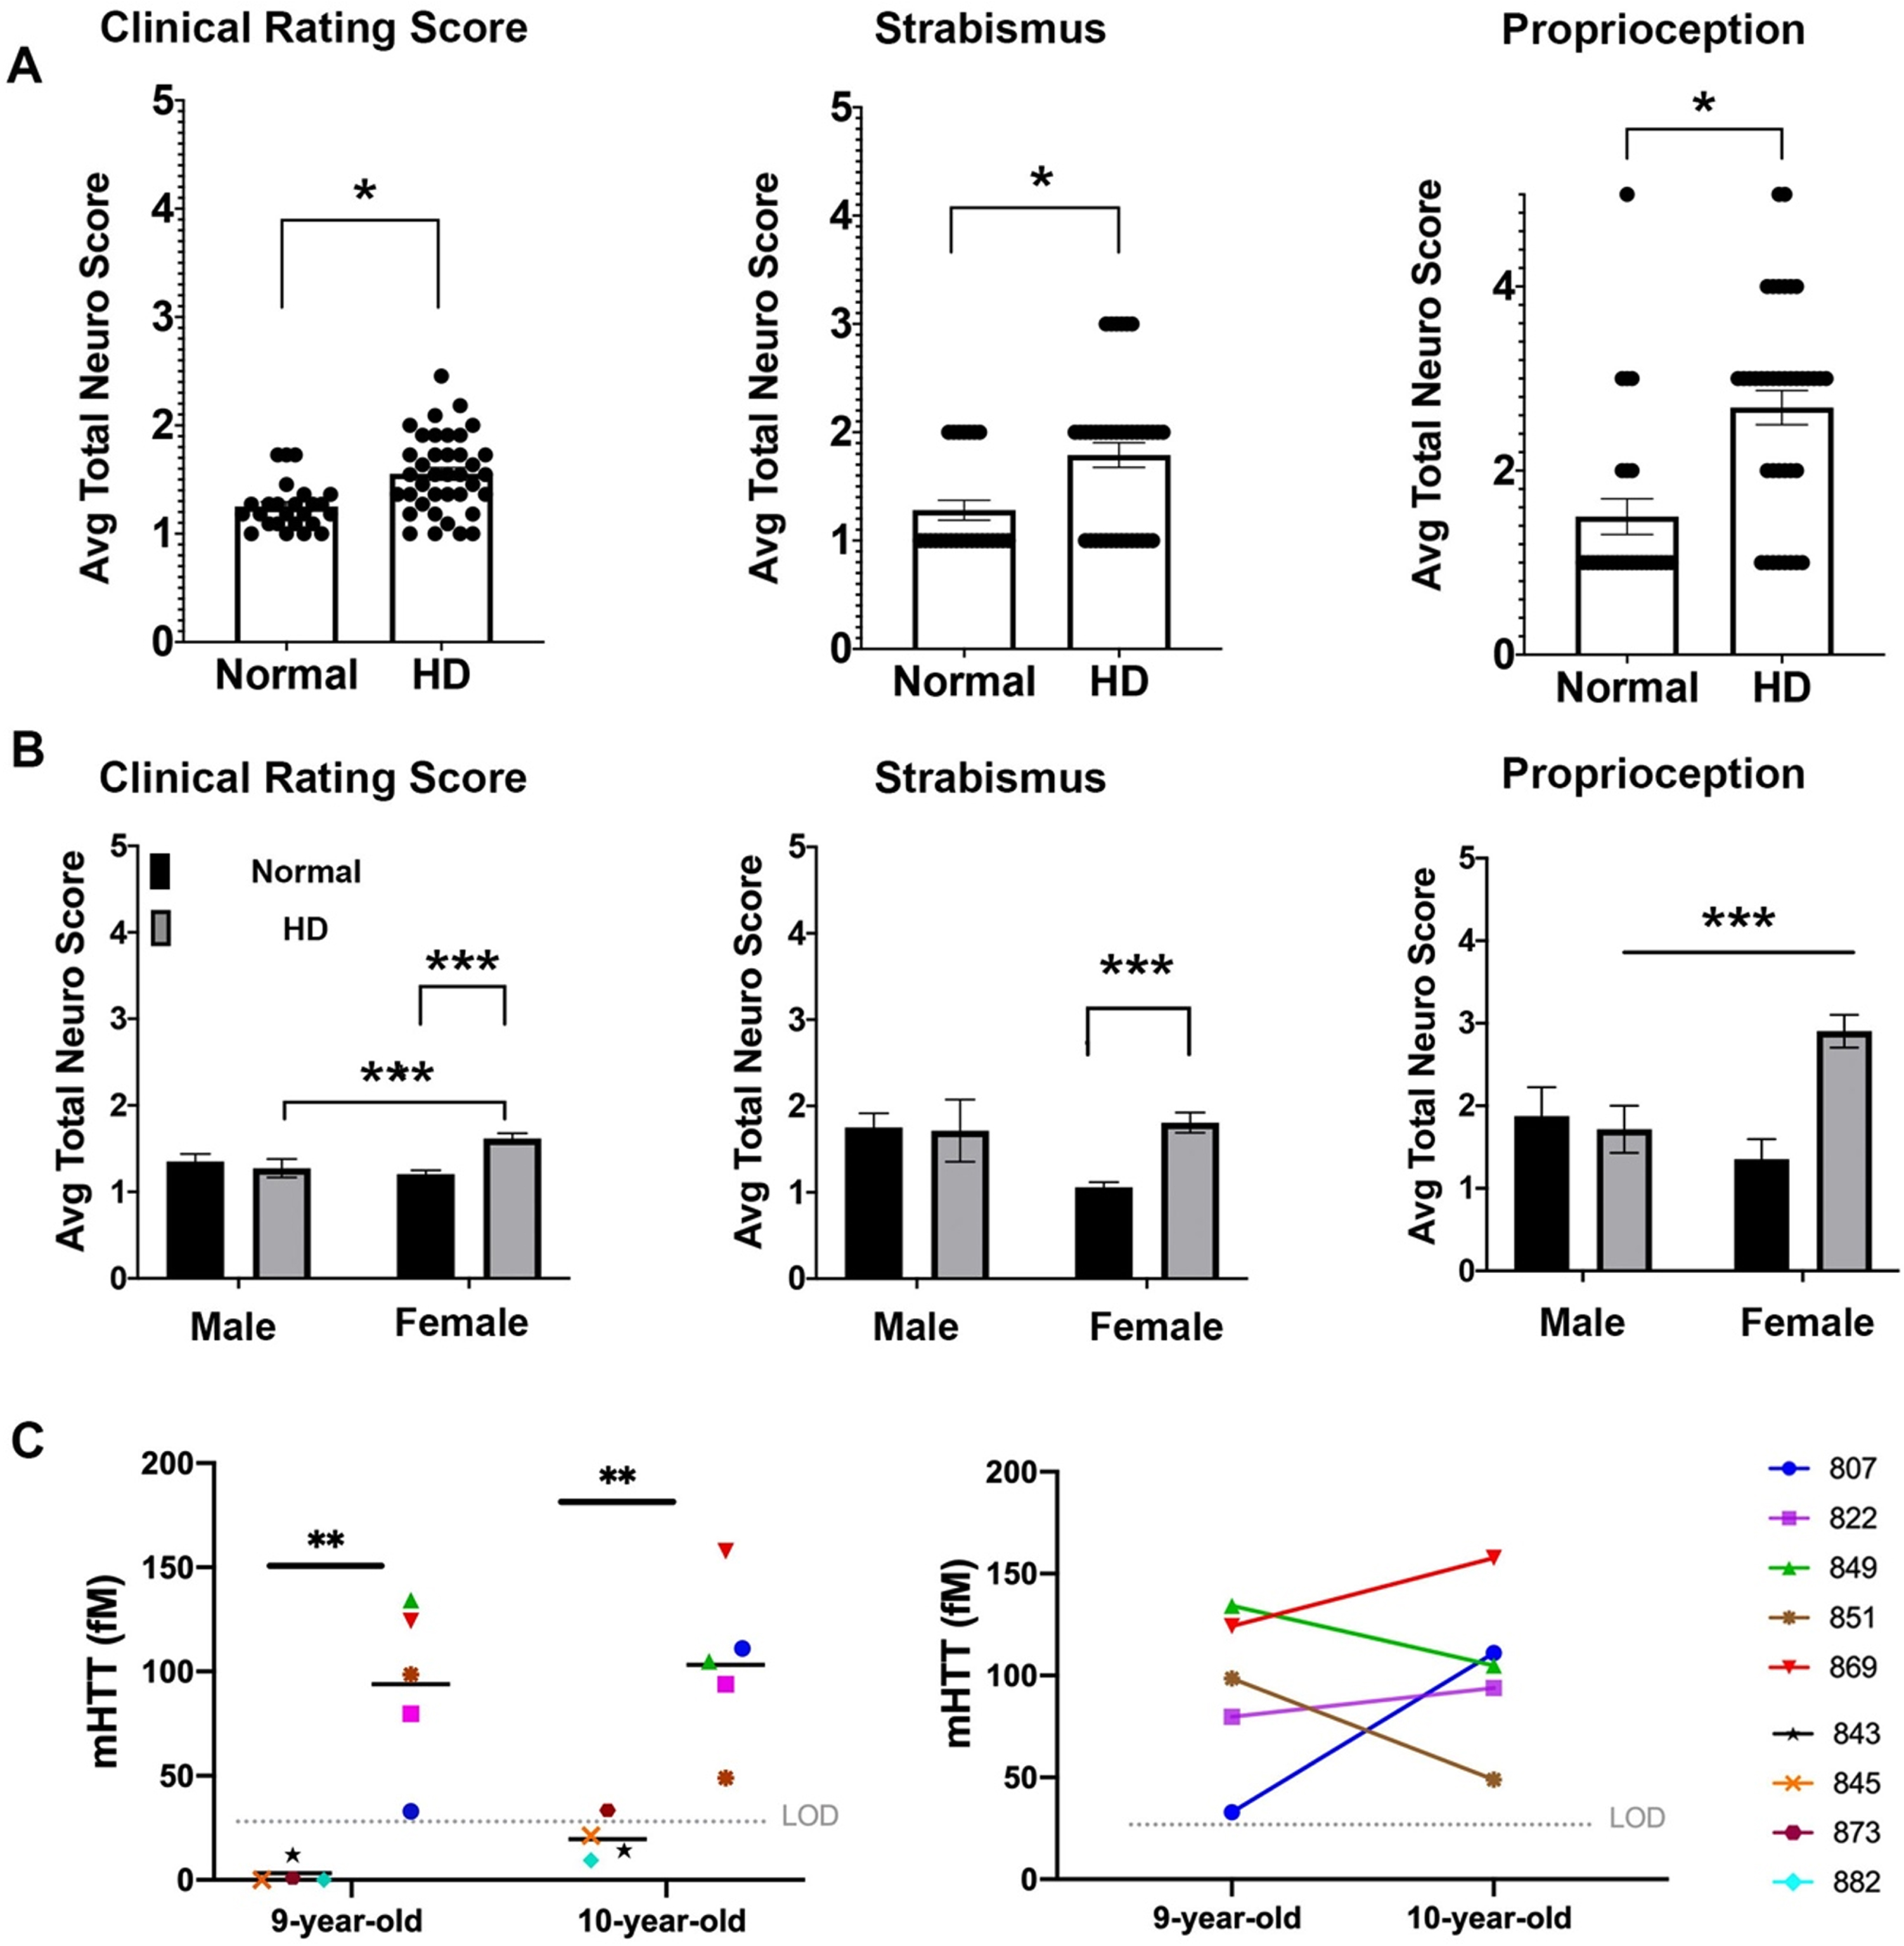
Neurological deficits of HD sheep. Neurological response of sheep described by scoring from 1 to 5. Normal score is 1 and scores increase as responses worsen. A) Clinical rating scores of HD male and female were significantly higher than normal sheep. In particular, HD sheep showed significant deficit in strabismus and proprioception (*p < 0.05). (HD total n = 38, normal total n = 25, HD females n = 31, HD males n = 7, normal females n = 17, normal males n = 8). B) HD females showed sever signs of neurological deficit as compared to males (***p < 0.001). C) Cerebrospinal mHTT levels in females sampled at 9 and 10 years of age (HD n = 5, normal controls n = 4). mHTT levels for normal sheep was below the limit of detection (left, **p < 0.006). Three HD females showed an increase in mHTT level from 9 to 10 years of age (right).
RESULTS
Neurological impairment noted in HD sheep
To assess neurological status of the HD sheep, standard veterinary neurological exams were performed on HD (n = 7 male, n = 28 female) and normal sheep (n = 10 male, n = 17 female) [55]. The neurological exam was consolidated to parameters with abnormalities exhibited by the HD sheep that inform on eye coordination, proprioceptive deficits, gait, and postural changes. These parameters were then aggregated in a clinical rating scale (1 to 5; normal = 1 with increasing scores as the response worsens). The clinical rating score of the HD sheep is significantly higher (p < 0.05) as compared to normal sheep (Fig. 1A). This score can be subdivided into the following parameters: HD sheep exhibit difficulties in maintaining their eye coordination while their head is lifted (strabismus, p < 0.05) and they have reduced correction of their hind limbs when legs are crossed over each other while standing (proprioception, p < 0.05). The gait and postural scores are not different than normal control animals. The clinical signs were more predominant in HD females (Fig. 1B) as compared to normal females and HD male sheep (p = 0.001 and p < 0.001 respectively, interaction score 0.0068 (clinical rating score)). Strabismus score was significantly higher in HD female than normal female sheep (p = 0.0007). HD female sheep scored significantly higher on proprioception compared to normal female sheep (p < 0.001) and HD males (p = 0.383) (interaction score = 0.0076, column score = 0.028); however, male sheep were 7 years old and female sheep were 9 and 10 years old. Therefore, significant decline of clinical rating scores and proprioception in HD female as compared to HD males could be, in part, driven by age differences (Fig. 1B).
Mutant huntingtin concentrations in CSF correlates with neurological scores
To determine the concentrations of mutant huntingtin (mHTT) in CSF of HD sheep and investigate change over a year, CSF of female HD sheep (n = 5) and normal female sheep (n = 4) were sampled and analyzed at 9 and 10 years of age. The mHTT concentrations at both time points were significantly higher than normal, where normal levels remained in lower limit of detection except one 10-year-old normal sheep (Fig.1C-left, p < 0.006). This discrepancy is attributed to assay variability. Three HD sheep showed an increase in mHTT level, and two HD sheep showed a decrease over the course of one year (Fig.1C-right). Levels of mHTT for sheep in longitudinal study summarized in Supplementary Table 1.
Microstructural changes in HD males and females indicate white matter alterations
To assess the microstructural changes of white matter in HD sheep model, diffusion tensor imaging (DTI) was performed on HD sheep (n = 7 male, n = 28 female) and normal sheep (n = 10 male, n = 17 female). The female cohort was subdivided into two groups due to changes in the DTI acquisition voxel sizes between years; where one group of 9-year-old female sheep were imaged at voxel size 2.5 mm and another group of 10-year-old females were imaged at voxel size 2 mm. DTI scalars were calculated in seven ROIs of brain including motor, occipital and parietal cortices, rostral and caudal internal capsule (Fig. 2A), corpus callosum and mid brain (data not shown). Our results demonstrate that directionality of water diffusion along the axon in white matter, represented by fraction of anisotropy (FA, Fig. 2B), trends towards a reduction throughout the HD sheep brain compared to age-matched controls (1% –9% reduction of FA; Supplementary Figure 1).
Fig. 2
DTI scalars in HD and 7-year-old control male sheep (HD n = 7, normal n = 10) and 9-year-old female sheep (HD n = 8, normal n = 7) and 10-year-old female sheep (HD n = 17, normal n = 10). A) DTI scalars were calculated in regions of interest (ROIs; colored on MRI images) located in rostral and caudal internal capsule, motor cortex, parietal, and occipital cortex. B) HD males and females showed trends towards a reduction in the directionality of water diffusion in white matter along the axon (FA) as compared to control sheep. HD males and females showed significant increase or trends toward increased water diffusion in (C) all directions of white matter (ADC) and (D) throughout the white matter boundaries perpendicular to the axon (RD) as compared to control sheep (*p < 0.05; **p < 0.01; ***p < 0.001). M and F in the title of X axis represent male and female sheep respectively.
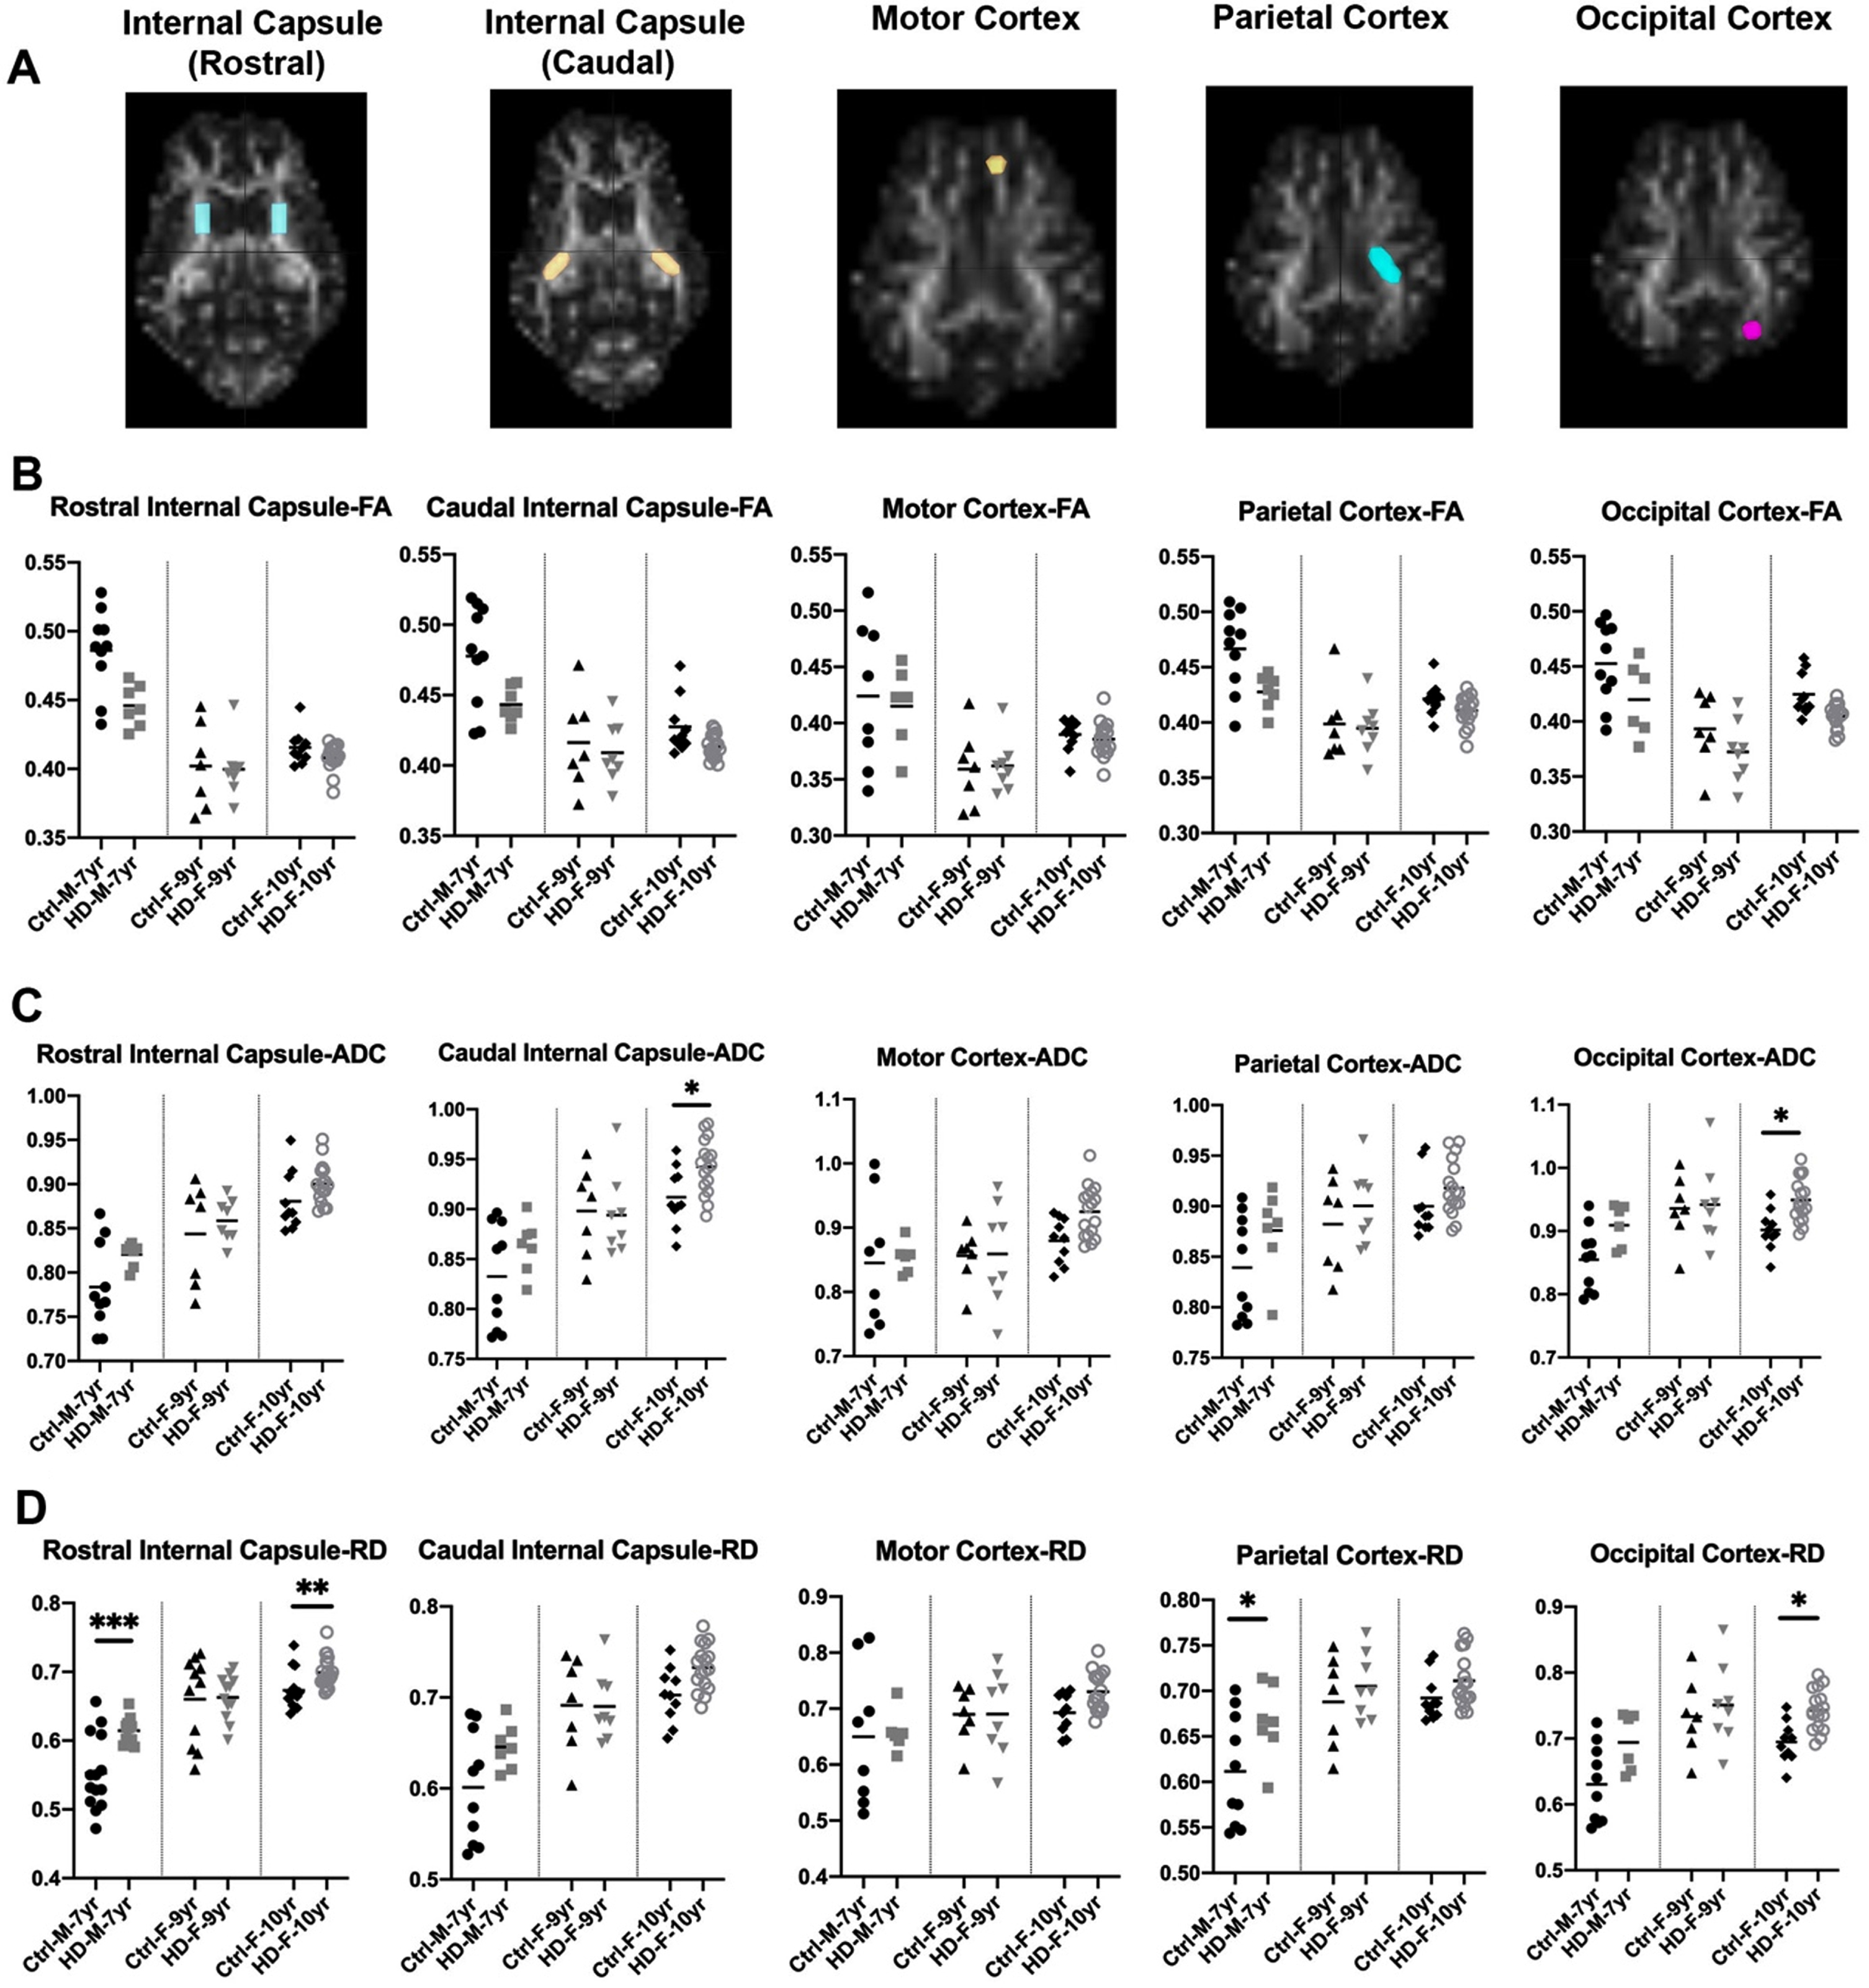
To better evaluate loss of boundaries and organization of white matter in HD sheep model, additional three DTI scalars were calculated that describe overall diffusivity (ADC), diffusion parallel to (AD; data not shown) and perpendicular (RD) to the axonal white matter (Fig. 2C, D). Overall water diffusion in white matter, represented by ADC, trends towards an increase in all directions throughout the HD white matter compared to age-matched controls (1% –20% increase in ADC; Supplementary Figure 1). Significant increases in ADC in caudal internal capsule and occipital cortex of 10-year-old female HD sheep (p < 0.05) was noted (Fig. 2C). HD sheep trend towards increased water diffusivity throughout the white matter boundaries (perpendicular to the axon), represented by RD, as compared to age-matched controls (1% –25% increase in RD; Supplementary Figure 1). This increase is significant in the rostral internal capsule (p < 0.001) and the parietal cortex of HD males (p < 0.05), and rostral internal capsule (p < 0.05) and occipital cortex of 10-year-old HD females (p < 0.05), shown in (Fig. 2D). A significant increase was noted in water diffusion along the white matter (AD) in corpus callosum of 7-year-old rams (p < 0.05) and motor (p < 0.01) and occipital cortex (p < 0.02) of 10-years-old HD females (data not shown). Water diffusion in the corpus callosum (ADC, RD) and midbrain was not statistically different between HD and normal sheep (data not shown).
HD sheep white matter shows longitudinal disease worsening
Figure 3 evaluates disease progression over time. DTI was conducted on HD females (n = 4) and age-matched normal females (n = 3) over a course of one-year. Figure 3 shows the DTI scalars (FA, ADC, RD) of individual HD and normal sheep. Normalized DTI scalar values in control sheep remained around 1±0.1 over course of one year (Fig. 3B–D bottom; n = 3). Directionality of water diffusion in white matter (FA) in 9-year-old HD females (Fig. 3B top, n = 4) suggest a decrease in FA in three of the HD females over a year. Water diffusion in all directions in white matter (ADC) over a year increased for majority of nine-year-old HD females as compared to controls in (Fig. 3C top). An increase in diffusivity through the white matter tracts (RD), was noted in the majority of nine-year-old HD females in the selected regions (Fig. 3D top) over a year when compared to controls. The same trend was observed for diffusivity along the white matter tracts (AD) (data not shown).
Fig. 3
DTI scalars calculated longitudinally in HD (n = 4; purple, top panel) and control females (n = 3; bottom panel) at 9 years of age and again at 10 years of age. A) DTI scalars were calculated in regions of interest (ROIs) located in rostral and caudal internal capsule, motor, parietal and occipital cortex. B) Directionality of water diffusion along the axon in white matter (FA) decreased in females from 9 to 10 years of age (top; in red, green, purple, and blue) compared to normal controls (bottom; in orange, maroon and black). B) Similarly, water diffusion increased in all directions of white matter (ADC; C) and throughout the white matter boundaries (RD; D) over one year. DTI scalars for control sheep remained 1±0.1.
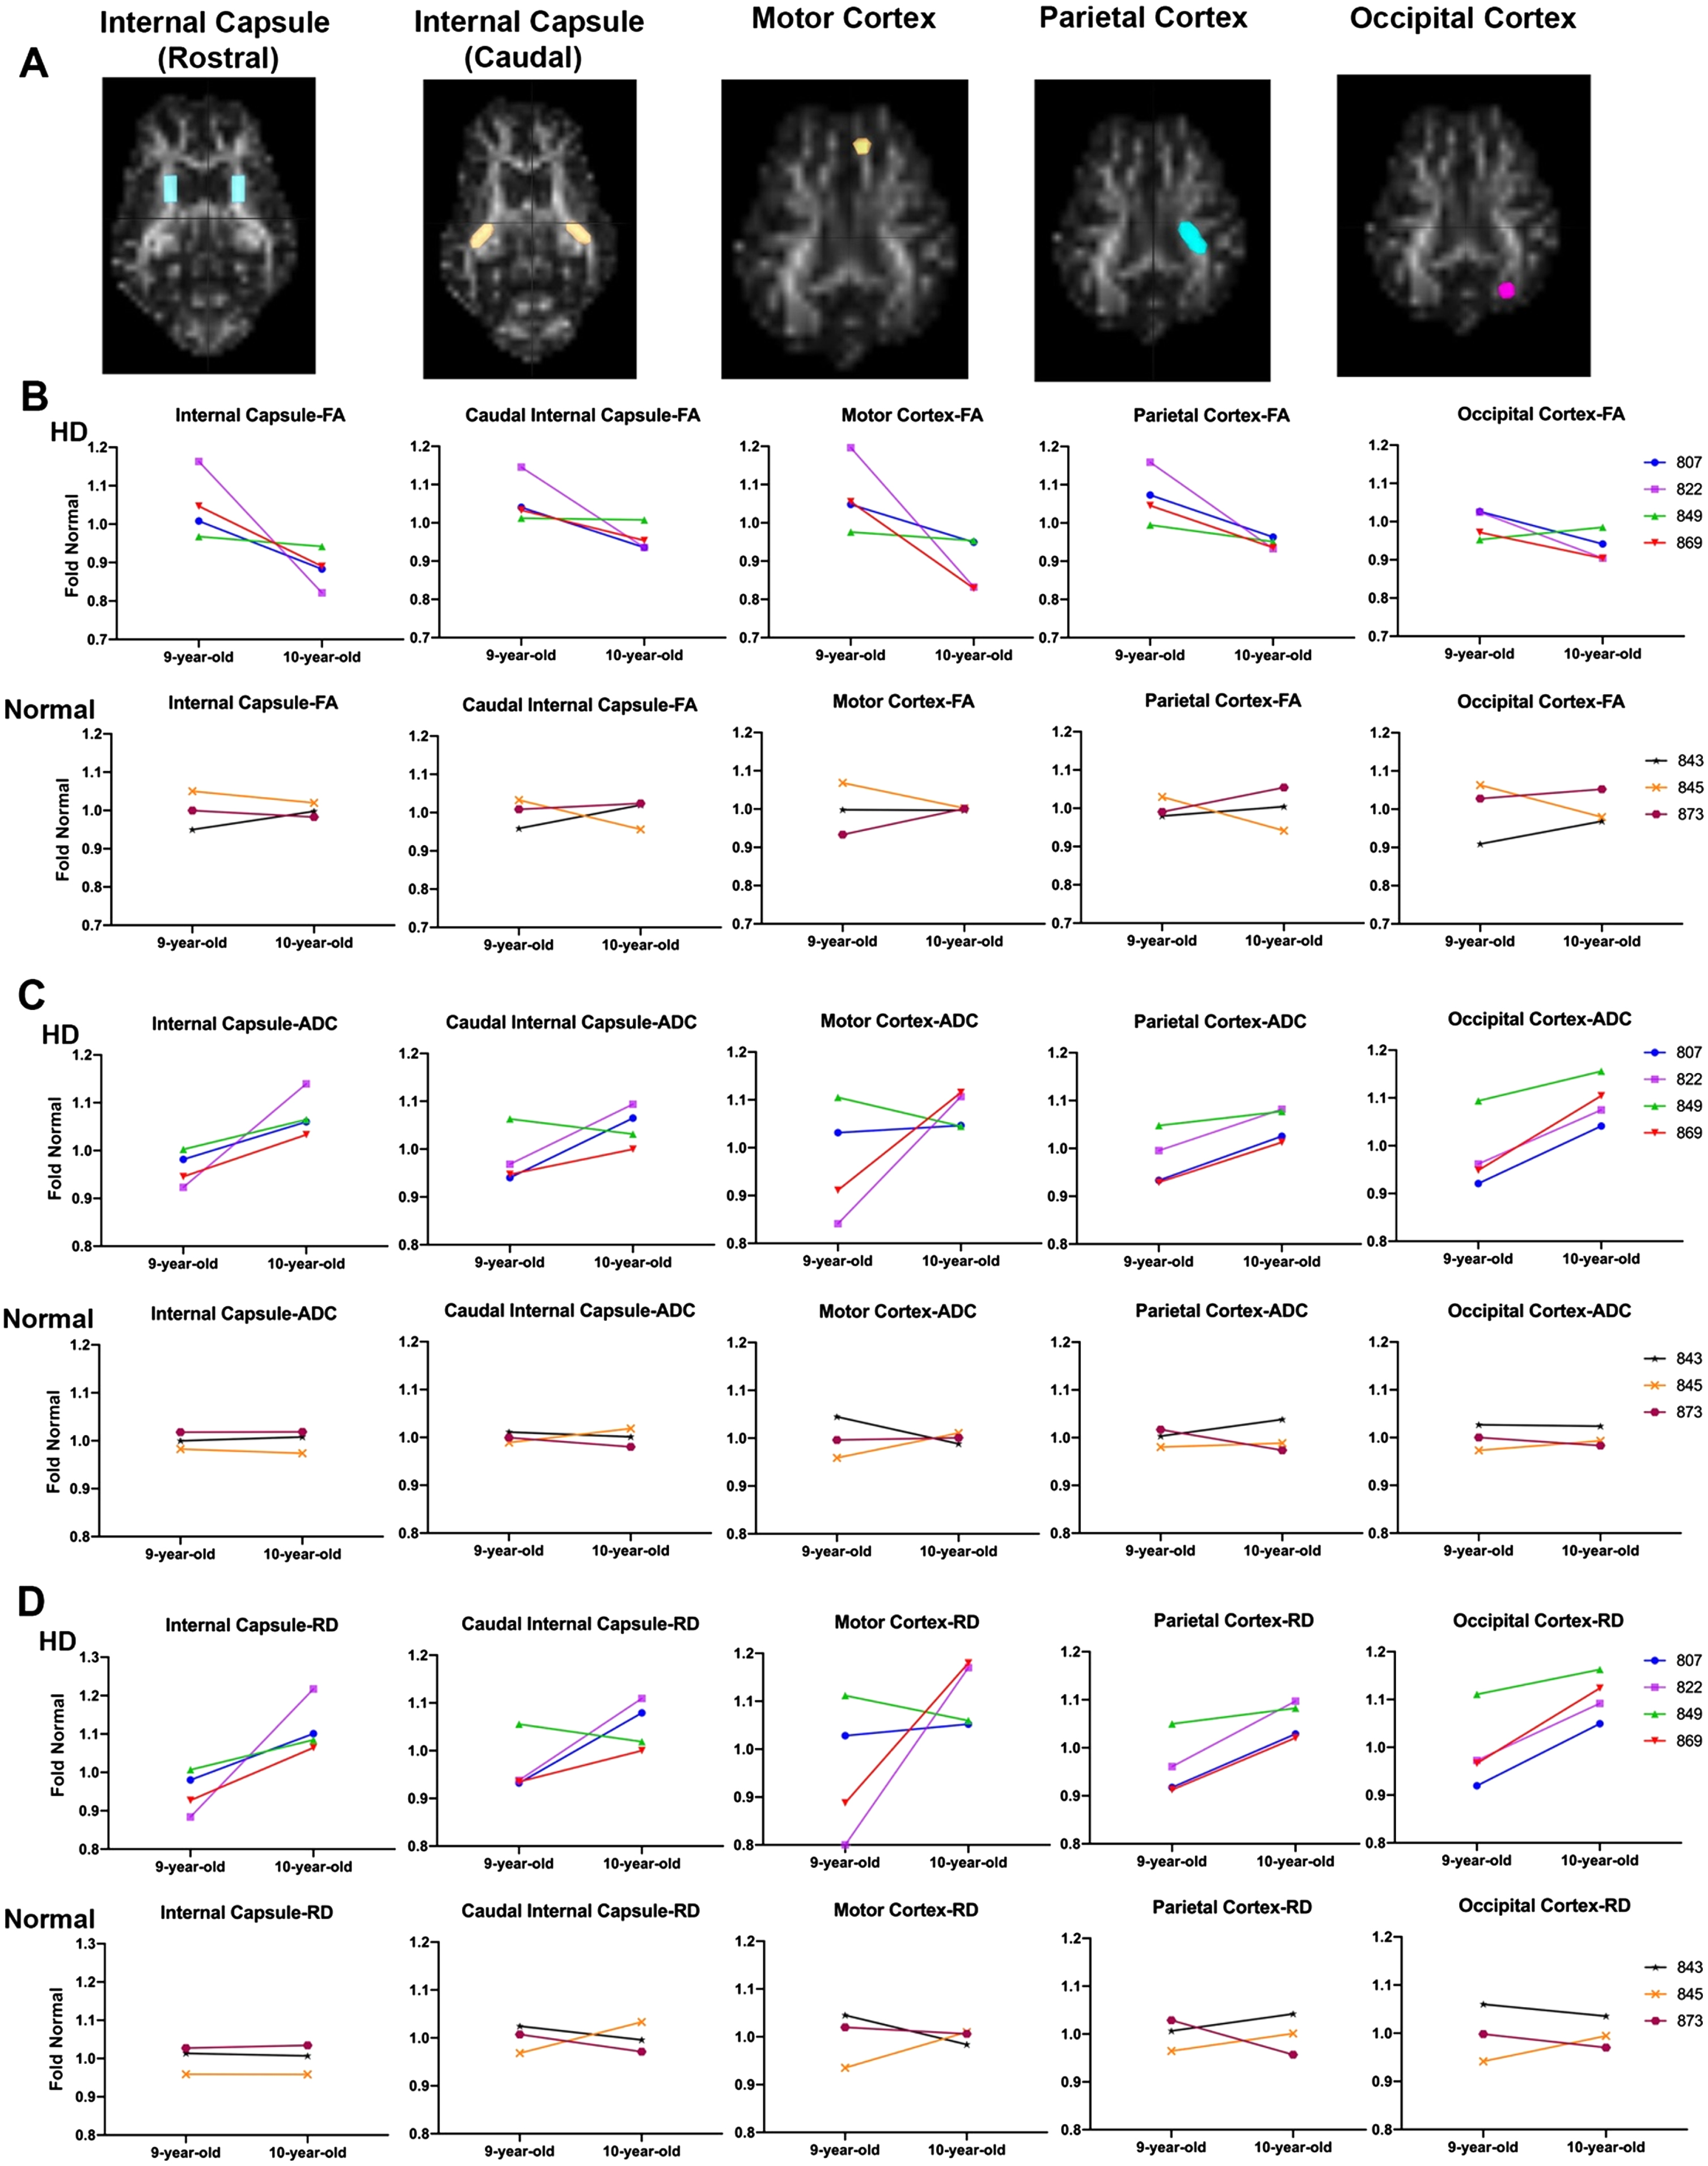
Comparison of the slopes of lines connecting fold normal of DTI scalars from 9 to 10 years in HD and normal sheep indicates a significant difference between HD and normal controls in RD, calculated in rostral internal capsule region (Fig. 3D, p < 0.046). This is best appreciated in comparing the slopes of fold normal of DTI scalars from 9 to 10 years. The slope measured longitudinally in individual HD sheep varies in severity across animals, but animals with the most significant DTI scalar change tend to represent it across brain regions. For example, HD sheep 822 (Fig. 3-shown in purple) shows maximum change in all DTI scalars calculated in the rostral and caudal internal capsule as well as the cortices (maximum decrease in FA and maximum increase in ADC and RD). On the other hand, HD sheep 849 (Fig. 3, shown in green) shows the minimum change in all DTI scalars calculated in rostral and caudal internal capsule and cortices. No statistical difference in slope differences was noted across other brain regions.
White matter changes in HD males and females correlates with mHTT levels and neurological scores
mHTT in CSF of HD females at 9-and 10-years of age (n = 4, each time point) nearly correlates with DTI scalars in the occipital cortex of HD sheep (Fig. 4A). This includes trends towards significance for correlation of mHTT in CSF with directionality of water diffusion (FA) in occipital cortex (r = –0.7030, p = 0.0518), overall diffusivity (ADC) in occipital cortex (r = 0.5968, p = 0.1183) and diffusion throughout the white matter boundaries (RD) of occipital cortex (r = 0.6458, p = 0.0836).
Fig. 4
Correlation of DTI scalars with mHTT levels in CSF and neurological scores. A) mHTT levels in CSF of HD females (n = 5) sampled at 9 and 10 years of age nearly correlates with directionality of water diffusion (FA), overall diffusivity (ADC), and diffusion through the white matter boundaries (RD) of occipital cortex. Occipital cortex-FA showed significant correlation with clinical rating score in B) males (n = 7) and females (n = 25) combined and C) 10-year-old females. D–F) DTI scalars (ADC, RD, AD) calculated in corpus callosum of 10-year-old females (n = 17) showed significant correlation with gait scores. M and F in the legends represent male and female sheep respectively.
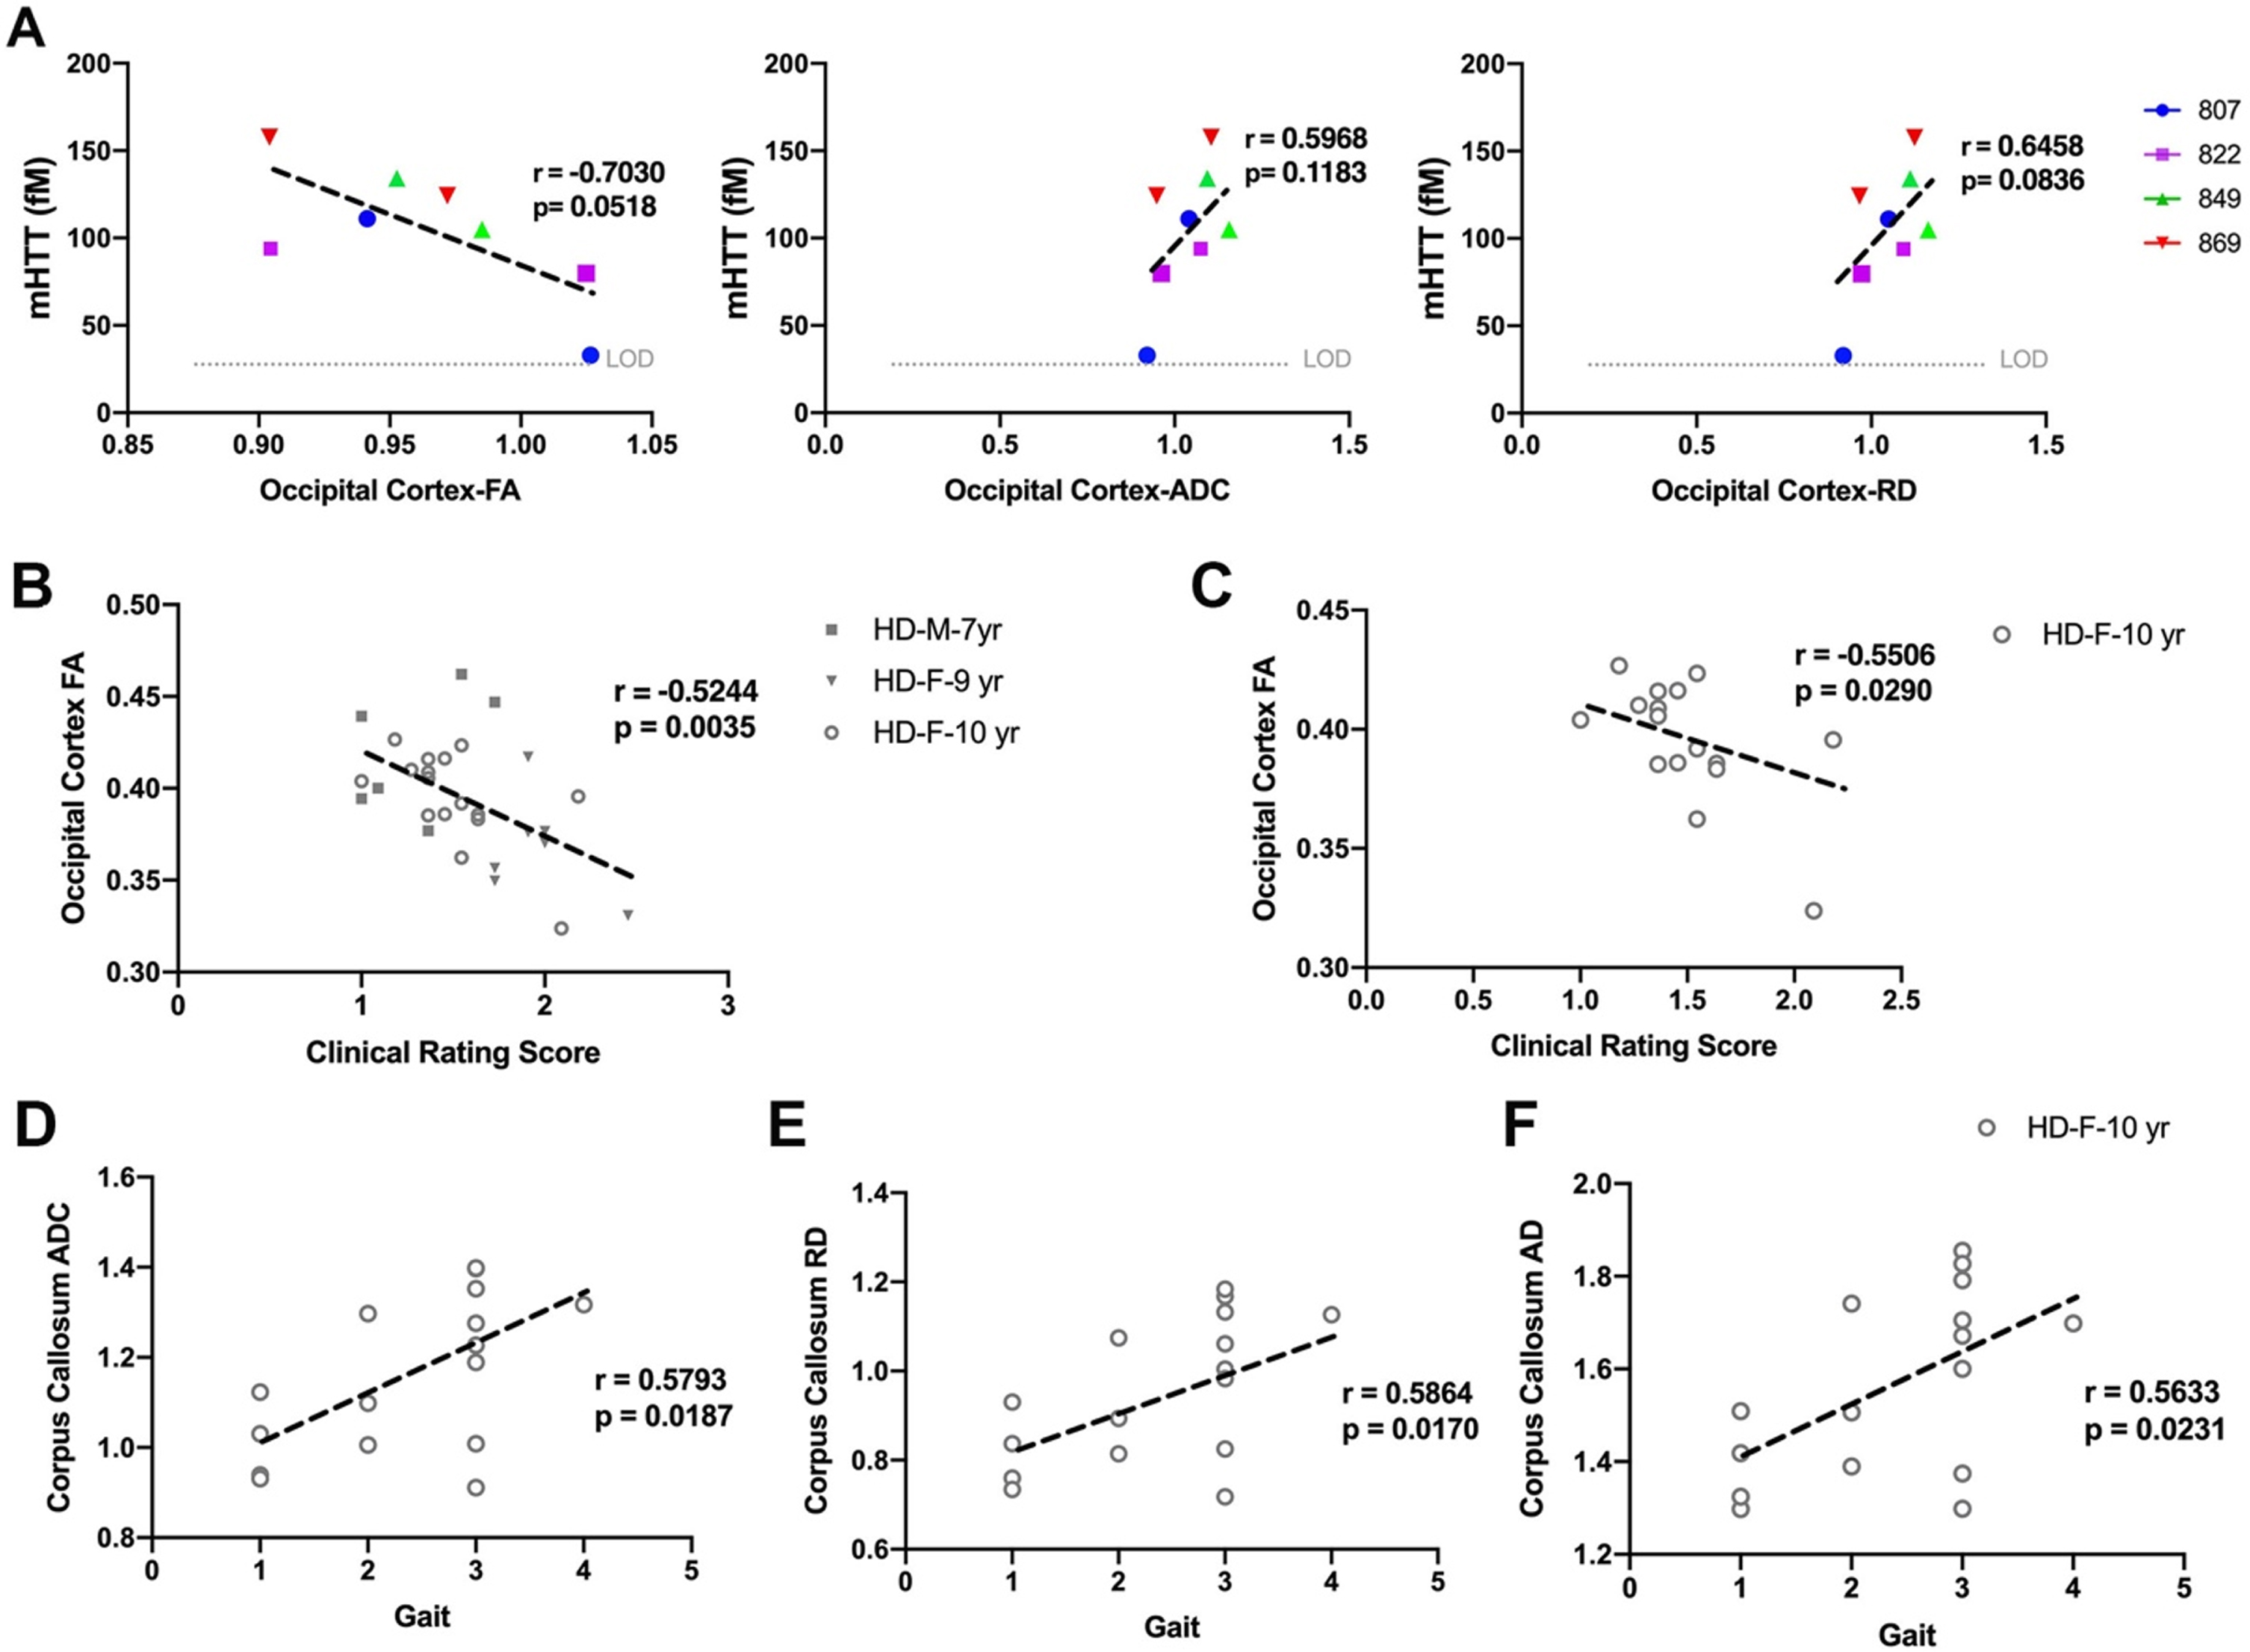
DTI scalars calculated in white matter of HD males and HD females, showed significant correlation with neurological scores (Fig. 4B–F). The decrease in directionality of water diffusion in occipital cortex (FA) of HD males and HD females showed significant correlation with clinical rating scores (Fig. 4B, r = –0.5244, p = 0.0035). Decreased directionality of water diffusion through the white matter boundaries (FA) in occipital cortex of 10-year-old HD females significantly correlated with their clinical rating scores (Fig. 4C, r = –0.5506, p = 0.0290). Corpus callosum of 10-year-old HD sheep showed correlation of ADC, RD, and AD with gait scores (Fig. 4D–F, ADC: r = 0.5793, p = 0.0187; RD: r = 0.5864, p = 0.0170; AD: r = 0.5633, p = 0.0231).
Changes in brain metabolites of HD sheep indicate disease condition and correlates with neurological scores
To assess the neuro-chemical status of HD sheep brain, MRS spectra were obtained from striatum of 9- and 10- years old HD females (n = 28), age-matched normal females (n = 17), 7-year-old HD males (n = 7), and age-matched normal males (n = 10). The position of voxel located in the right striatum of sheep and a summary of the changes in metabolite concentration (%) of HD females compared to control is shown in Supplementary Figure 2A and 2B. Brain metabolite concentrations in 9-year-old HD females (Fig. 5A top, n = 5) showed longitudinal increase in gliosis (Ins) and decrease in neuronal health (NAA, NAA+NAAG) as compared to age-matched normal females (Fig. 5A bottom, n = 4) over a year. Two HD females showed an increase in markers of demyelination (GPC+PCh) from 9-to 10-years of age (Fig. 5A top, n = 5).
Fig. 5
Change in metabolite concentration of HD sheep. A) Top row shows metabolite concentration of individual HD females (n = 5) sampled at 9 and 10 years of age illustrating increases in gliosis marker (Ins), decrease in neuronal health marker (NAA, NAA+NAAG) over 1 year. Two HD sheep showed increase in marker of demyelination (GPC+PCh). Bottom row shows metabolite concentrations of control females (n = 4) sampled at 9 and 10 years of age. Metabolite concentrations are normalized to the mean metabolite concentration in normal sheep. Marker of energy metabolism (Cr+PCr) for all the HD males (n = 7) and HD females (n = 25) showed significant correlation with (B) clinical rating score and (C) strabismus. mHTT levels in CSF of HD females (n = 5) sampled at 9 and 10 years of age showed negative association with (D) marker of energy metabolism (Cr+PCr) and (E) marker of neuronal health (NAA+NAAG). M and F in the legends represent male and female sheep respectively.
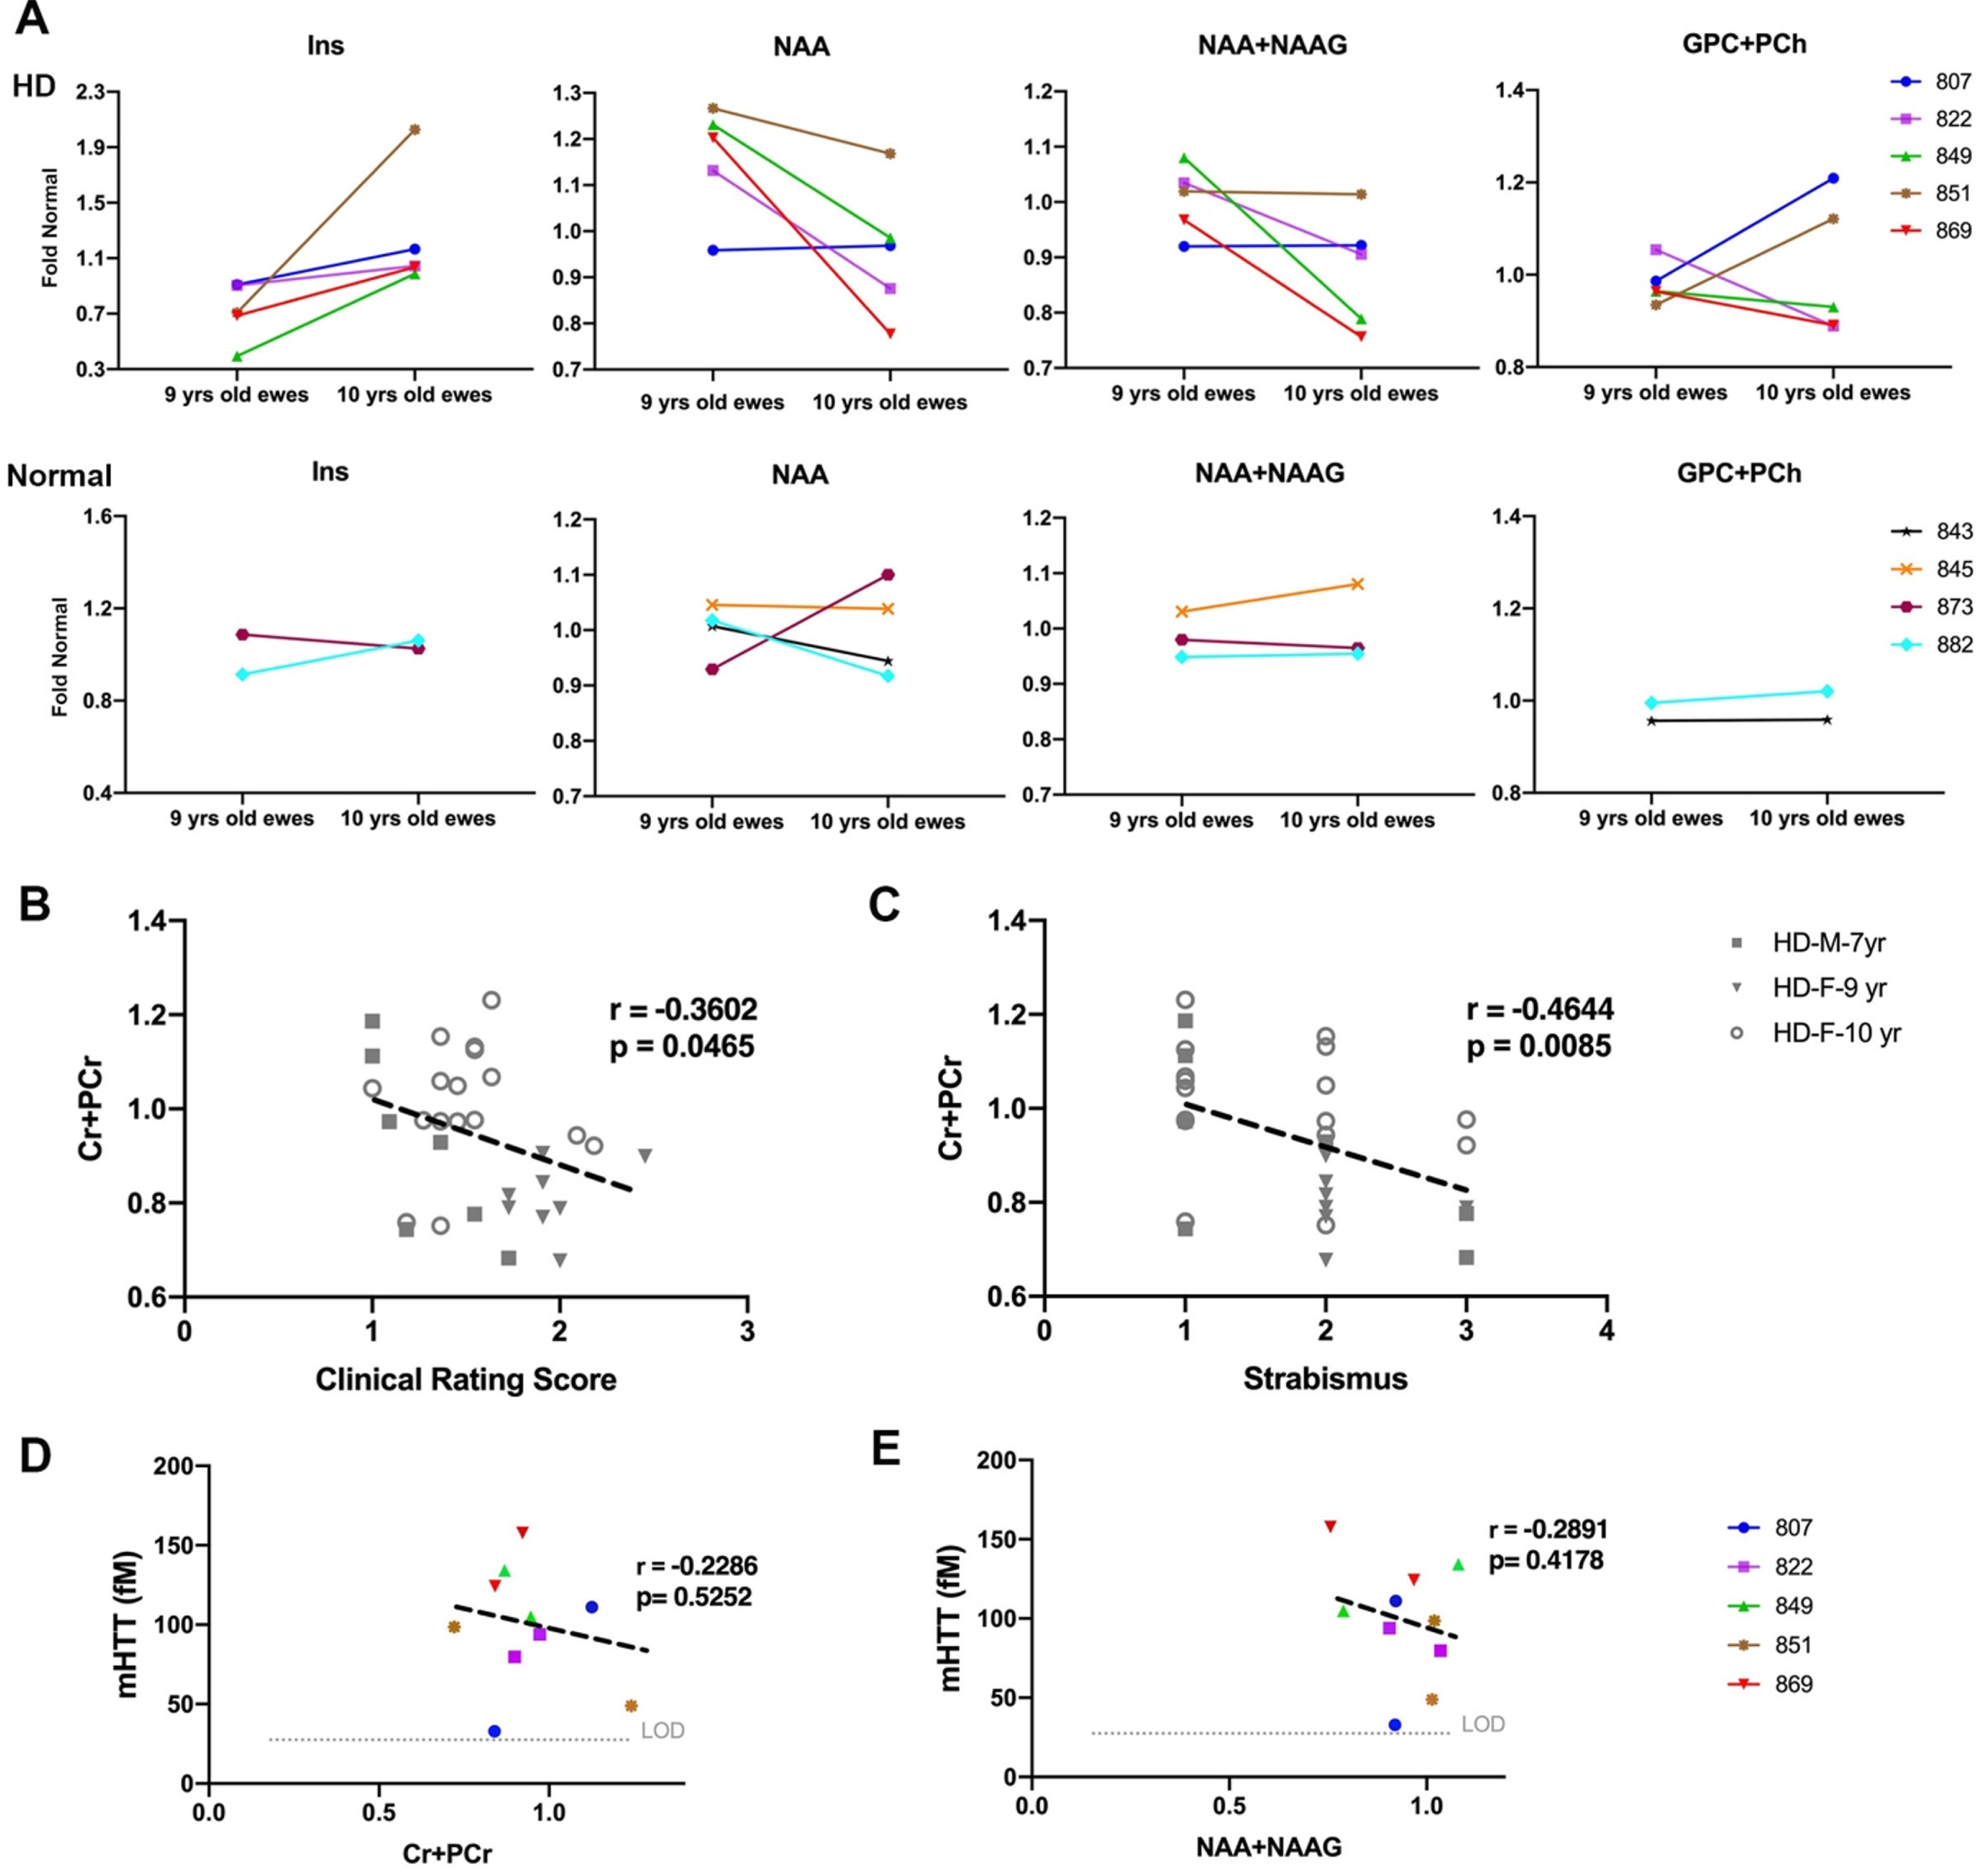
To evaluate correlation of metabolite concentrations with neurological scores and mHTT, correlation analysis was performed (Fig. 5B–E). For all the HD males and HD females in the study, marker of energy metabolism (Cr+PCr) showed a significant correlation with clinical rating scores (Fig. 5B, r = –0.3602, p = 0.0465) and strabismus (Fig. 5C, r = –0.4644, p = 0.0085). No significant correlation was noted between metabolite concentrations of 10-year-old female and neurological scores. Levels of mHTT in CSF showed negative association with Cr+PCr (Fig. 5D; r = –0.2286, p = 0.5252) and NAA+NAAG (Fig. 5E; r = –0.2891, p = 0.4178).
White matter changes and brain metabolite concentrations show correlations
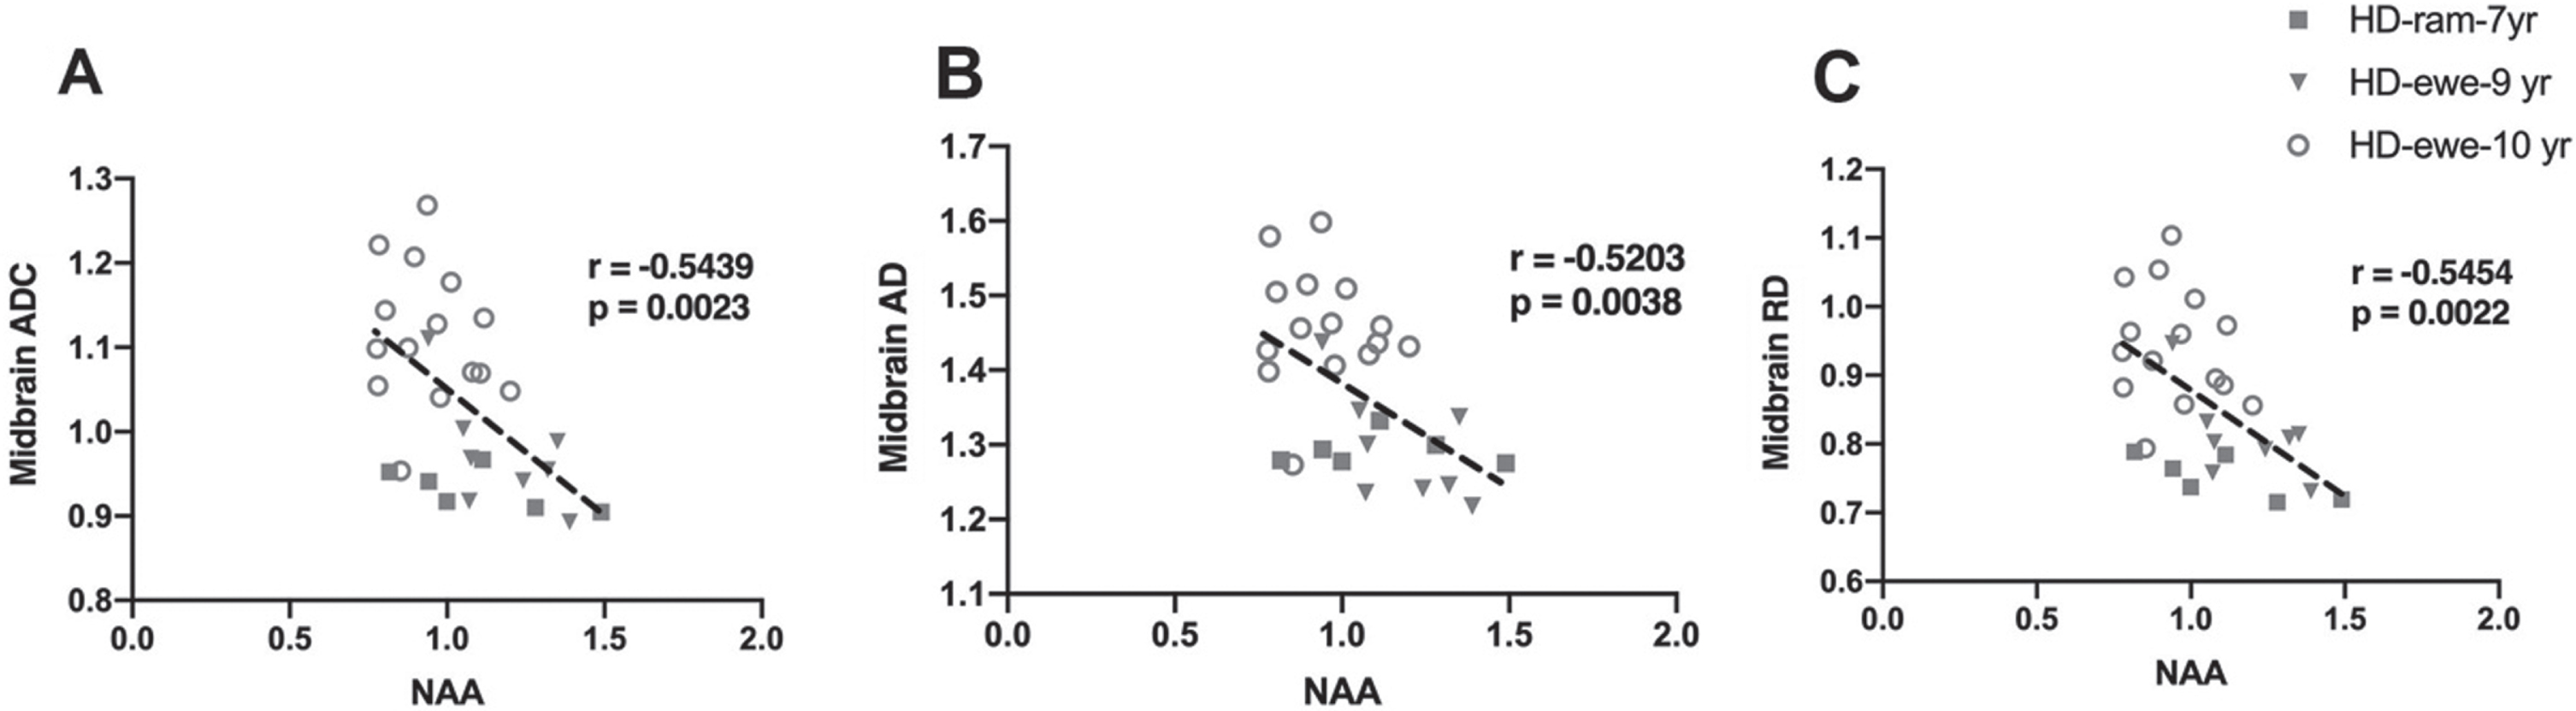
To evaluate the relationship of white matter changes in different regions of brain with MRS metabolite concentrations in the striatum, correlation analysis was performed for HD sheep (Fig. 6). Overall diffusivity (ADC), diffusion parallel (AD), and perpendicular (RD) to axonal white matter in midbrain showed significant correlation with marker of neuronal health (NAA) for all HD sheep in the study, regardless of sex (Fig. 6A ADC: r = –0.5439, p = 0.0023; Fig. 6B AD: r = –0.5203, p = 0.0038; Fig. 6C RD: r = –0.5454, p = 0.0022).
Fig. 6
Correlation of DTI scalars with brain metabolites concentrations. A–C) Midbrain ADC, AD, and RD significantly correlated with NAA for HD males (n = 7) and HD females (n = 25).
DISCUSSION
This study characterizes changes in neurological behavior, mHTT levels in CSF, white matter microstructure, and brain metabolite concentrations of aged HD males and females as compared to their age- and sex-matched controls. White matter alterations have been reported at different stages of HD progression in animal models and HD patients as well as postmortem patients [14, 41, 43, 51, 56–61]. These alterations are detected years before clinical onset of HD using non-invasive MRI techniques and shown to correlate with clinical measures [48, 59, 62]. Interpreting DTI alterations in the HD brain solely based on the quantified changes in directionality and diffusivity is not sufficient and results need to be interpreted in light of other clinical measures. Studies in pre-HD and HD patients reported decreased FA and increased ADC and RD in various regions of white matter compared to healthy controls; however, not all pre-HD comparisons were statistically different from controls [51, 57, 58]. In line with this, regions of white matter studied in HD male and female sheep in this study showed similar changes with similar levels of significance as pre-HD, suggesting that the sheep model may serve as a large animal model to further study white matter changes observed in the pre-HD brain. Studies of contribution of sex on progression of HD suggests that slightly more severe phenotype and faster rate of progression is present in women in motor and functional domains [63–65]. In this study, HD females showed significant worsening in proprioception, strabismus and overall clinical rating scores as compared to HD males. However, age-related differences may be at play and cannot be ruled out, as male and female groups are not age-matched and exhibit a 2–3-year difference. Further studies in age- and sex-matched cohorts are needed to address this question.
Reports from an HD-CSF study indicate that mHTT in CSF is the earliest detectable change in HD prior to changes in caudate volume and total motor score [66, 67]. The mHTT concentration in CSF reflects brain levels, increases by disease progression, and can accurately distinguish between HD mutation carriers and controls [67–69]. mHTT levels in CSF was used in the first phase I/II clinical trial of a huntingtin-lowering therapy, the intrathecally administered antisense oligonucleotide HTTRx/RG6042, to demonstrate huntingtin lowering (NCT02519036). Currently, two recruiting clinical trials have listed CSF mHTT as an outcome measure (NCT04000594 and NCT04120493). In line with HD clinical trials, mHTT was used as an outcome measure in preclinical HD sheep studies. We observed in female HD sheep that mHTT in CSF differentiated HD from normal controls similar to human studies. Interestingly, a report of longitudinal measurement of mHTT levels in CSF of pre-HD and manifest HD patients revealed a decrease of mHTT levels in a few HD patients [70]. Likewise, an increase in CSF mHTT in three HD females and a decrease in two HD females was noted over the course of 1 year. We hypothesize that the decrease in mHTT levels of the two HD female sheep in this study may recapitulate that reported in HD patients and stems from inherent longitudinal sampling variability of CSF mHTT. Reports from premanifest and early/mid manifest HD individuals showed significant correlations of several motor and cognitive measures with CSF mHTT protein levels [67–69]. In this study the correlations of CSF mHTT levels with neurological scores were not statistically significant, which could be result of small number of HD females (n = 5) that were analyzed for measurement of CSF mHTT levels.
Performance deficits in cognitive tasks involving a visual component have been reported in both pre- and early HD [49, 71–73]. Although visual deficits and degeneration of occipital lobe are not considered as hallmarks of HD, cumulative evidence from HD patient studies suggests that occipital regions are affected by HD at early stages [18, 57, 60, 71, 74, 75]. Additionally, atrophy of occipital cortex in pre- and manifest HD is reported [18, 50, 60, 71, 76, 77]. Associations between reduced occipital cortex thickness or grey matter volume and poorer performance on tasks with visual component is found in pre-HD and early HD patients [71, 78]. While decreased neuronal function at rest was present in associative visual cortices in manifest HD, postmortem studies have found a marked reduction in number of neurons in the occipital cortex [60, 61]. Similarly in this study, both HD male and female sheep showed abnormalities in DTI parameters in the occipital cortex that correlated with strabismus suggesting that this region of the brain may be affected to a greater degree in HD sheep. mHTT levels in CSF trended towards significance in correlation with DTI scalars measured in the occipital cortex of HD females where CSF mHTT levels increased along with alterations in directionality and diffusivity of white matter of occipital cortex of HD females.
Motor dysfunction is a common feature of HD, and in HD sheep we observed significant abnormalities in proprioception. We believe this is in part due to differences in brain organization that prevents extrapyramidal basal nuclear lesions in ungulates from resulting in movement disorders or gait propulsion abnormalities [55, 79]. In HD patients, significant correlations were reported between motor symptoms and mean diffusivity in the corpus callosum [80]. In line with this, we found significant correlation of DTI scalars (FA, ADC, AD, RD) calculated in corpus callosum with gait (proprioceptive ataxia).
Some studies have interpreted the increase in RD as indicator of myelin breakdown [58, 62, 81]. Myelin damage has been reported in human in pre-HD and HD brain [58, 82, 83]. In this study, in addition to increased RD in white matter of males and females, we found a trend towards an increase in the marker of demyelination (GPC+PCh) in HD females as compared to controls. These DTI and MRS findings might be an indicator of myelin damage in aged HD male and female sheep. Brain metabolite concentrations of HD females showed the same trends observed in pre-HD and HD patients [84–88], although these changes are not significant in HD sheep. As mentioned above, many of the metabolite changes reported in pre-HD patients are not significantly different from healthy controls [87]. Although previous reports of pre- and HD patients indicated the correlation of tNAA with disease burden score, this was not observed in the HD sheep. A trend towards a reduction in tNAA was noted in the HD sheep, and this discrepancy may be overcome with increased power. Interestingly in both male and female HD sheep we found significant correlation of marker of energy and metabolism (Cr+PCr) with the total clinical rating score and strabismus [84].
This study illustrates clear correlations between the DTI findings and other measures, but significant statistical difference in DTI scalars between normal and HD sheep was not achieved in the most of the analyzed brain regions. We believe this is due to low powering of the cohorts. We estimated sample size and effect size for DTI analysis based on the sheep data in this study for future study planning. Considering that regions of brain are affected differently by HD, the sample size and effect size varies by region. For brain regions that difference in DTI measure between HD and normal sheep was strongly significant (p < 0.01, p < 0.001), sample size of 12 sheep (n = 6 per group) with effect size of 1.49 was estimated (example: occipital cortex ADC-female sheep). For brain regions that show the trend in absence of significance or show weak significant difference (p < 0.05) between HD and normal sheep, sample size was in range of 50 sheep (25 per group) and effect size became in range of 0.7–0.8 (example: parietal cortex ADC male sheep, caudal internal capsule female sheep).
In summary, clinical translation of efficacious therapies in rodent models of HD requires additional testing in large animals that have closer similarities in CNS and immunophysiology to humans [89]. Here in OVT73 sheep model of HD, we showed significant correlation of MRI findings with decline in proprioception, gait, strabismus, and clinical rating scores similar to what is reported for HD patients. Although HD human studies reported significant correlation of mHTT levels with MRI findings, we did not achieve significance in this study, which could stem from analysis of CSF mHTT in a small number of sheep. These findings could be used to non-invasively assess efficacy of candidate therapeutics to modify the course of HD progression in pre-manifest sheep model of HD.
ACKNOWLEDGMENTS
The authors acknowledge the facilities and scientific and technical assistance of the National Imaging Facility, a National Collaborative Research Infrastructure Strategy (NCRIS) capability, at the South Australian Health & Medical Research Institute (SAHMRI). The authors would like to thank Dr. David Howland (CHDI) for his comments and helpful insight. This work was supported in part by the CHDI Foundation and BioMarin Inc.
CONFLICT OF INTEREST
The authors have no conflict of interest to report. Charles A. O’Neill is an employee of BioMarin Pharmaceutical Inc. and Sundeep Chandra was previously employed by BioMarin Pharmaceutical Inc. which has an active therapeutic development program for Huntington’s disease.
SUPPLEMENTARY MATERIAL
[1] The supplementary material is available in the electronic version of this article: https://dx.doi.org/10.3233/JHD-220526.
REFERENCES
[1] | Huntington G . On chorea. Medical and Surgery Reporter. (1872) ;26: :320–1. |
[2] | Rosenblatt A . Neuropsychiatry of Huntington’s disease. Dialogues Clin Neurosci. (2007) ;9: (2):191–7. |
[3] | Patassini S , Begley P , Xu J , Church SJ , Reid SJ , Kim EH , et al. Metabolite mapping reveals severe widespread perturbation ofmultiple metabolic processes in Huntington’s disease human brain. Biochim Biophys Acta. (2016) ;1862: (9):1650–62. |
[4] | Antonini A , Leenders KL , Spiegel R , Meier D , Vontobel P , Weigell-Weber M , et al. Striatal glucose metabolism and dopamine D2receptor binding in asymptomatic gene carriers and patients withHuntington’s disease. Brain. (1996) ;119: (Pt 6):2085–95. |
[5] | Handley RR , Reid SJ , Brauning R , Maclean P , Mears ER , Fourie I , et al. Brain urea increase is an early Huntington’s diseasepathogenic event observed in a prodromal transgenic sheep model andHD cases. Proc Natl Acad Sci U S A. (2017) ;114: (52):E11293–e302. |
[6] | Underwood BR , Broadhurst D , Dunn WB , Ellis DI , Michell AW , Vacher C , et al. Huntington disease patients and transgenic mice have similarpro-catabolic serum metabolite profiles. Brain. (2006) ;129: (Pt4):877–86. |
[7] | Mochel F , Benaich S , Rabier D , Durr A . Validation of plasma branched chain amino acids as biomarkers in Huntington disease. Arch Neurol. (2011) ;68: (2):265–7. |
[8] | Mochel F , Charles P , Seguin F , Barritault J , Coussieu C , Perin L , et al. Early energy deficit in Huntington disease: identification ofa plasma biomarker traceable during disease progression. PLoS One. (2007) ;2: (7):e647. |
[9] | Seong IS , Ivanova E , Lee JM , Choo YS , Fossale E , Anderson M , et al. HD CAG repeat implicates a dominant property of huntingtin inmitochondrial energy metabolism. Hum Mol Genet. (2005) ;14: (19):2871–80. |
[10] | Gusella JF , Wexler NS , Conneally PM , Naylor SL , Anderson MA , Tanzi RE , et al. A polymorphic DNA marker genetically linked toHuntington’s disease. Nature. (1983) ;306: (5940):234–8. |
[11] | Reiner A , Albin RL , Anderson KD , D’Amato CJ , Penney JB , Young AB . Differential loss of striatal projection neurons in Huntington disease. Proc Natl Acad Sci U S A. (1988) ;85: (15):5733–7. |
[12] | Vonsattel JP , Myers RH , Stevens TJ , Ferrante RJ , Bird ED , Richardson EP , Jr. . Neuropathological classification of Huntington’s disease. J Neuropathol Exp Neurol. (1985) ;44: (6):559–77. |
[13] | Waldvogel HJ , Kim EH , Tippett LJ , Vonsattel JP , Faull RL . The neuropathology of Huntington’s disease. Curr Top Behav Neurosci. (2015) ;22: :33–80. |
[14] | de la Monte SM , Vonsattel JP , Richardson EP , Jr , Morphometric demonstration of atrophic changes in the cerebral cortex, white matter, and neostriatum in Huntington’s disease. J Neuropathol Exp Neurol. (1988) ;47: (5):516–25. |
[15] | Reiner A , Deng YP . Disrupted striatal neuron inputs and outputs in Huntington’s disease. CNS Neurosci Ther. (2018) ;24: (4):250–80. |
[16] | Rüb U , Hoche F , Brunt ER , Heinsen H , Seidel K , Del Turco D , et al. Degeneration of the cerebellum in Huntington’s disease (HD):possible relevance for the clinical picture and potential gateway topathological mechanisms of the disease process. Brain Pathol. (2013) ;23: (2):165–77. |
[17] | Vonsattel JP , Keller C , Cortes Ramirez EP . Huntington’s disease –neuropathology. Handb Clin Neurol. (2011) ;100: :83–100. |
[18] | Tabrizi SJ , Langbehn DR , Leavitt BR , Roos RA , Durr A , Craufurd D , et al. Biological and clinical manifestations of Huntington’sdisease in the longitudinal TRACK-HD study: cross-sectional analysisof baseline data. Lancet Neurol. (2009) ;8: (9):791–801. |
[19] | Hatters DM . Protein misfolding inside cells: the case of huntingtin and Huntington’s disease. IUBMB Life. (2008) ;60: (11):724–8. |
[20] | Scherzinger E , Sittler A , Schweiger K , Heiser V , Lurz R , Hasenbank R , et al. Self-assembly of polyglutamine-containing huntingtinfragments into amyloid-like fibrils: implications for Huntington’sdisease pathology. Proc Natl Acad Sci U S A. (1999) ;96: (8):4604–9. |
[21] | DiFiglia M , Sapp E , Chase KO , Davies SW , Bates GP , Vonsattel JP , et al. Aggregation of huntingtin in neuronal intranuclear inclusionsand dystrophic neurites in brain. Science. (1997) ;277: (5334):1990–3. |
[22] | Wright GEB , Black HF , Collins JA , Gall-Duncan T , Caron NS , Pearson CE , et al. Interrupting sequence variants and age of onset inHuntington’s disease: clinical implications and emerging therapies. Lancet Neurol. (2020) ;19: (11):930–9. |
[23] | Sathasivam K , Neueder A , Gipson TA , Landles C , Benjamin AC , Bondulich MK , et al. Aberrant splicing of HTT generates thepathogenic exon 1 protein in Huntington disease. Proc Natl Acad SciU S A. (2013) ;110: (6):2366–70. |
[24] | Pfister EL , Zamore PD . Huntington’s disease: silencing a brutal killer. Exp Neurol. (2009) ;220: (2):226–9. |
[25] | Rodan LH , Cohen J , Fatemi A , Gillis T , Lucente D , Gusella J , et al. A novel neurodevelopmental disorder associated with compoundheterozygous variants in the huntingtin gene. Eur J Hum Genet. (2016) ;24: (12):1826–7. |
[26] | Lopes F , Barbosa M , Ameur A , Soares G , de Sa J , Dias AI , et al. Identification of novel genetic causes of Rett syndrome-likephenotypes. J Med Genet. (2016) ;53: (3):190–9. |
[27] | Kwon D . Failure of genetic therapies for Huntington’s devastates community. Nature. (2021) ;593: (7858):180. |
[28] | Kingwell K . Double setback for ASO trials in Huntington disease. Nat Rev Drug Discov. (2021) ;20: (6):412–3. |
[29] | Harjes P , Wanker EE . The hunt for huntingtin function: interaction partners tell many different stories. Trends Biochem Sci. (2003) ;28: (8):425–33. |
[30] | Li SH , Li XJ . Huntingtin-protein interactions and the pathogenesis of Huntington’s disease. Trends Genet. (2004) ;20: (3):146–54. |
[31] | Kaltenbach LS , Romero E , Becklin RR , Chettier R , Bell R , Phansalkar A , et al. Huntingtin interacting proteins are genetic modifiers ofneurodegeneration. PLoS Genet. (2007) ;3: (5):e82. |
[32] | Caviston JP , Holzbaur EL . Huntingtin as an essential integrator of intracellular vesicular trafficking. Trends Cell Biol. (2009) ;19: (4):147–55. |
[33] | Hilditch-Maguire P , Trettel F , Passani LA , Auerbach A , Persichetti F , MacDonald ME Huntingtin: an iron-regulated protein essential for normal nuclear and perinuclear organelles. Hum Mol Genet. (2000) ;9: (19):2789–97 . |
[34] | Leavitt BR , Guttman JA , Hodgson JG , Kimel GH , Singaraja R , Vogl AW , et al. Wild-type huntingtin reduces the cellular toxicity of mutanthuntingtin in vivo. Am J Hum Genet. (2001) ;68: (2):313–24. |
[35] | Rigamonti D , Bauer JH , De-Fraja C , Conti L , Sipione S , Sciorati C , et al. Wild-type huntingtin protects from apoptosis upstream ofcaspase-3. J Neurosci. (2000) ;20: (10):3705–13. |
[36] | Rigamonti D , Sipione S , Goffredo D , Zuccato C , Fossale E , Cattaneo E . Huntingtin’s neuroprotective activity occurs via inhibition of procaspase-9 processing. J Biol Chem. (2001) ;276: (18):14545–8. |
[37] | Ho LW , Brown R , Maxwell M , Wyttenbach A , Rubinsztein DC . Wild type Huntingtin reduces the cellular toxicity of mutant Huntingtin in mammalian cell models of Huntington’s disease. J Med Genet. (2001) ;38: (7):450–2. |
[38] | Mehler MF , Petronglo JR , Arteaga-Bracho EE , Gulinello ME , Winchester ML , Pichamoorthy N , et al. Loss-of-huntingtin in medial and lateralganglionic lineages differentially disrupts regional interneuron andprojection neuron subtypes and promotes Huntington’sdisease-associated behavioral, cellular, and pathological hallmarks. J Neurosci. (2019) ;39: (10):1892–909. |
[39] | Dietrich P , Johnson IM , Alli S , Dragatsis I . Elimination of huntingtin in the adult mouse leads to progressive behavioral deficits, bilateral thalamic calcification, and altered brain iron homeostasis. PLoS Genet. (2017) ;13: (7):e1006846. |
[40] | Steventon JJ , Trueman RC , Ma D , Yhnell E , Bayram-Weston Z , Modat M , et al. Longitudinal in vivo MRI in a Huntington’s diseasemouse model: Global atrophy in the absence of white mattermicrostructural damage. Sci Rep. (2016) ;6: :32423. |
[41] | Gatto RG , Ye AQ , Colon-Perez L , Mareci TH , Lysakowski A , Price SD , et al. Detection of axonal degeneration in a mouse model ofHuntington’s disease: comparison between diffusion tensor imagingand anomalous diffusion metrics. Magma. (2019) ;32: (4):461–71. |
[42] | Weiss AR , Liguore WA , Domire JS , Button D , McBride JL . Intra-striatal AAV2.retro administration leads to extensive retrograde transport in the rhesus macaque brain: implications for disease modeling and therapeutic development. Sci Rep. (2020) ;10: (1):6970. |
[43] | Meng Y , Jiang J , Bachevalier J , Zhang X , Chan AW . Developmental whole brain white matter alterations in transgenic Huntington’s disease monkey. Sci Rep. (2017) ;7: (1):379. |
[44] | Jacobsen JC , Bawden CS , Rudiger SR , McLaughlan CJ , Reid SJ , Waldvogel HJ , et al. An ovine transgenic Huntington’s disease model. Hum Mol Genet. (2010) ;19: (10):1873–82. |
[45] | Unified Huntington’s Disease Rating Scale: reliability and consistency. Huntington Study Group Mov Disord. (1996) ;11: (2):136–42. |
[46] | Stoffers D , Sheldon S , Kuperman JM , Goldstein J , Corey-Bloom J , Aron AR . Contrasting gray and white matter changes in preclinical Huntington disease: an MRI study. Neurology. (2010) ;74: (15):1208–16. |
[47] | Jech R , Klempír J , Vymazal J , Zidovská J , Klempírová O , Ruzicka E , et al. Variation of selectivegray and white matter atrophy in Huntington’s disease. Mov Disord. (2007) ;22: (12):1783–9. |
[48] | Estevez-Fraga C , Scahill RI , Durr A , Leavitt BR , Roos RAC , Langbehn DR , et al. Composite UHDRS correlates with progression of imagingbiomarkers in Huntington’s disease. Mov Disord. (2021) ;36: (5):1259–64. |
[49] | Paulsen JS , Long JD , Ross CA , Harrington DL , Erwin CJ , Williams JK , et al. Prediction of manifest Huntington’s disease with clinical andimaging measures: a prospective observational study. Lancet Neurol. (2014) ;13: (12):1193–201. |
[50] | Tabrizi SJ , Scahill RI , Owen G , Durr A , Leavitt BR , Roos RA , et al. Predictors of phenotypic progression and disease onset inpremanifest and early-stage Huntington’s disease in the TRACK-HDstudy: analysis of 36-month observational data. Lancet Neurol. (2013) ;12: (7):637–49. |
[51] | Dumas EM , van den Bogaard SJ , Ruber ME , Reilman RR , Stout JC , Craufurd D , et al. Early changes in white matter pathways of thesensorimotor cortex in premanifest Huntington’s disease. Hum BrainMa. (2012) ;33: (1):203–12. |
[52] | Handley RR , Reid SJ , Patassini S , Rudiger SR , Obolonkin V , McLaughlan CJ , et al. Metabolic disruption identified in theHuntington’s disease transgenic sheep model. Sci Rep. (2016) ;6: :20681. |
[53] | Reid SJ , Patassini S , Handley RR , Rudiger SR , McLaughlan CJ , Osmand A , et al. Further molecular characterisation of the OVT73 transgenicsheep model of Huntington’s disease identifies cortical aggregates. J Huntingtons Dis. (2013) ;2: (3):279–95. |
[54] | Morton AJ , Rudiger SR , Wood NI , Sawiak SJ , Brown GC , McLaughlan CJ , et al. Early and progressive circadian abnormalities in Huntington’sdisease sheep are unmasked by social environment. Hum Mol Genet. (2014) ;23: (13):3375–83. |
[55] | de Lahunta A , Glass E . Veterinary Neuroanatomy and Clinical Neurology, 3rd Edition: Saunders; 2009. 544 p. |
[56] | Gregory S , Cole JH , Farmer RE , Rees EM , Roos RA , Sprengelmeyer R , et al. Longitudinal diffusion tensor imaging shows progressivechanges in white matter in Huntington’s disease. J Huntingtons Dis. (2015) ;4: (4):333–46. |
[57] | Phillips OR , Joshi SH , Squitieri F , Sanchez-Castaneda C , Narr K , Shattuck DW , et al. Major superficial white matter abnormalities inHuntington’s disease. Front Neurosci. (2016) ;10: :197. |
[58] | Phillips O , Squitieri F , Sanchez-Castaneda C , Elifani F , Caltagirone C , Sabatini U , et al. Deep white matter in Huntington’s disease. PLoS One. (2014) ;9: (10):e109676. |
[59] | Poudel GR , Stout JC , Domínguez DJ , Churchyard A , Chua P , Egan GF , et al. Longitudinal change in white matter microstructure inHuntington’s disease: The IMAGE-HD study. Neurobiol Dis. (2015) ;74: :406–12. |
[60] | Coppen EM , Grond JV , Hafkemeijer A , Barkey Wolf JJH , Roos RAC . Structural and functional changes of the visual cortex in early Huntington’s disease. Hum Brain Mapp. (2018) ;39: (12):4776–86. |
[61] | Rüb U , Seidel K , Vonsattel JP , Lange HW , Eisenmenger W , Götz M , et al. Huntington’s disease (HD): neurodegeneration of Brodmann’sprimary visual area 17 (BA17). Brain Pathol. (2015) ;25: (6):701–11. |
[62] | Rosas HD , Wilkens P , Salat DH , Mercaldo ND , Vangel M , Yendiki AY , et al. Complex spatial and temporally defined myelin and axonaldegeneration in Huntington disease. Neuroimage Clin. (2018) ;20: :236–42. |
[63] | Zielonka D , Marinus J , Roos RA , De Michele G , Di Donato S , Putter H , et al. The influence of gender on phenotype and disease progressionin patients with Huntington’s disease. Parkinsonism Relat Disord. (2013) ;19: (2):192–7. |
[64] | Zielonka D , Stawinska-Witoszynska B . Gender differences in non-sex linked disorders: insights from Huntington’s disease. Front Neurol. (2020) ;11: :571. |
[65] | Chu EM , O’Neill M , Purkayastha DD , Knight C . Huntington’s disease: a forensic risk factor in women. J Clin Mov Disord. (2019) ;6: :3. |
[66] | Wijeratne PA , Young AL , Oxtoby NP , Marinescu RV , Firth NC , Johnson EB , et al. An image-based model of brain volume biomarker changes inHuntington’s disease. Ann Clin Transl Neurol. (2018) ;5: (5):570–82. |
[67] | Byrne LM , Rodrigues FB , Johnson EB , Wijeratne PA , De Vita E , Alexander DC , et al. Evaluation of mutant huntingtin andneurofilament proteins as potential markers in Huntington’s disease. Sci Transl Med. (2018) ;10: (458). |
[68] | Southwell AL , Smith SE , Davis TR , Caron NS , Villanueva EB , Xie Y , et al. Ultrasensitive measurement of huntingtin protein incerebrospinal fluid demonstrates increase with Huntington diseasestage and decrease following brain huntingtin suppression. Sci Rep. (2015) ;5: :12166. |
[69] | Wild EJ , Boggio R , Langbehn D , Robertson N , Haider S , Miller JR , et al. Quantification of mutant huntingtin protein in cerebrospinalfluid from Huntington’s disease patients. J Clin Invest. (2015) ;125: (5):1979–86. |
[70] | Rodrigues FB , Byrne LM , Tortelli R , Johnson EB , Wijeratne PA , Arridge M , et al. Mutant huntingtin and neurofilament light havedistinct longitudinal dynamics in Huntington’s disease. Sci Transl Med. (2020) ;12: (574). |
[71] | Johnson EB , Rees EM , Labuschagne I , Durr A , Leavitt BR , Roos RA , et al. The impact of occipital lobe cortical thickness on cognitivetask performance: an investigation in Huntington’s disease. Neuropsychologia. (2015) ;79: (Pt A):138–46. |
[72] | Tabrizi SJ , Scahill RI , Owen G , Durr A , Leavitt BR , Roos RA , et al. Predictors of phenotypic progression and disease onset inpremanifest and early-stage Huntington’s disease in the TRACK-HDstudy: analysis of 36-month observational data. Lancet Neurol. (2013) ;12: (7):637–49. |
[73] | Say MJ , Jones R , Scahill RI , Dumas EM , Coleman A , Santos RC , et al. Visuomotor integration deficits precede clinical onset inHuntington’s disease. Neuropsychologia. (2011) ;49: (2):264–70. |
[74] | Tabrizi SJ , Reilmann R , Roos RA , Durr A , Leavitt B , Owen G , et al. Potential endpoints for clinical trials in premanifest and earlyHuntington’s disease in the TRACK-HD study: analysis of 24 monthobservational data. Lancet Neurol. (2012) ;11: (1):42–53. |
[75] | Wu D , Faria AV , Younes L , Mori S , Brown T , Johnson H , et al. Mappingthe order and pattern of brain structural MRI changes usingchange-point analysis in premanifest Huntington’s disease. Hum Brain Mapp. (2017) ;38: (10):5035–50. |
[76] | Rosas HD , Salat DH , Lee SY , Zaleta AK , Pappu V , Fischl B , et al. Cerebral cortex and the clinical expression of Huntington’s disease:complexity and heterogeneity. Brain. (2008) ;131: (4):1057–68. |
[77] | Wolf RC , Sambataro F , Vasic N , Baldas EM , Ratheiser I , BernhardLandwehrmeyer G , et al. Visual system integrity and cognition inearly Huntington’s disease. Eur J Neurosci. (2014) ;40: (2):2417–26. |
[78] | Gómez-Ansón B , Alegret M , Muñoz E , Monté GC , Alayrach E , Sánchez A , et al. Prefrontal cortex volume reductionon MRI in preclinical Huntington’s disease relates to visuomotorperformance and CAG number. Parkinsonism Relat Disord. (2009) ;15: (3):213–9. |
[79] | Howland D , Ellederova Z , Aronin N , Fernau D , Gallagher J , Taylor A , et al. Large animal models of Huntington’s disease: what we havelearned and where we need to go next. J Huntingtons Dis. (2020) ;9: (3):201–16. |
[80] | Bohanna I , Georgiou-Karistianis N , Sritharan A , Asadi H , Johnston L , Churchyard A , et al. Diffusion tensor imaging in Huntington’sdisease reveals distinct patterns of white matter degenerationassociated with motor and cognitive deficits. Brain Imaging Behav. (2011) ;5: (3):171–80. |
[81] | Di Paola M , Luders E , Cherubini A , Sanchez-Castaneda C , Thompson PM , Toga AW , et al. Multimodal MRI analysis of the corpus callosumreveals white matter differences in presymptomatic and earlyHuntington’s disease. Cereb Cortex. (2012) ;22: (12):2858–66. |
[82] | Bourbon-Teles J , Bells S , Jones DK , Coulthard E , Rosser A , Metzler-Baddeley C . Myelin breakdown in human Huntington’s disease: multi-modal evidence from diffusion MRI and quantitative magnetization transfer. Neuroscience. (2019) ;403: :79–92. |
[83] | Johnson EB , Parker CS , Scahill RI , Gregory S , Papoutsi M , Zeun P , et al. Altered iron and myelin in premanifest Huntington’s Diseasemore than 20 years before clinical onset: Evidence from thecross-sectional HD Young Adult Study. E Bio Medicine. (2021) ;65: :103266. |
[84] | Sturrock A , Laule C , Decolongon J , Dar Santos R , Coleman AJ , Creighton S , et al. Magnetic resonance spectroscopy biomarkers inpremanifest and early Huntington disease. Neurology. (2010) ;75: (19):1702–10. |
[85] | Sturrock A , Laule C , Wyper K , Milner RA , Decolongon J , Dar Santos R , et al. A longitudinal study of magnetic resonance spectroscopyHuntington’s disease biomarkers. Mov Disord. (2015) ;30: (3):393–401. |
[86] | Graham SF , Kumar PK , Bjorndahl T , Han B , Yilmaz A , Sherman E , et al. Metabolic signatures of Huntington’s disease (HD): (1)H NMR analysisof the polar metabolome in post-mortem human brain. Biochim BiophysActa. (2016) ;1862: (9):1675–84. |
[87] | van den Bogaard SJ , Dumas EM , Teeuwisse WM , Kan HE , Webb A , Roos RA , et al. Exploratory 7-Tesla magnetic resonance spectroscopy inHuntington’s disease provides in vivo evidence for impairedenergy metabolism. J Neurol. (2011) ;258: (12):2230–9. |
[88] | Adanyeguh IM , Monin ML , Rinaldi D , Freeman L , Durr A , Lehéricy S , et al. Expanded neurochemical profile in the early stage ofHuntington disease using proton magnetic resonance spectroscopy. NMRBiomed.10./nbm. (1002) ;31: (3):3880. |
[89] | Miniarikova J , Evers MM , Konstantinova P . Translation of microRNA-based Huntingtin-lowering therapies from preclinical studies to the clinic. Mol Ther. (2018) ;26: (4):947–62. |

