
Simulation study on energy conservation performance for integrated external louver facades
Abstract
The authors previously proposed integrated-facade-systems comprising different types of external louvers integrated with buckling restraint braces. The systems can be applied to both new and existing buildings, paying attention to the building’s appearance, upgraded structural performance and indoor environment. The authors have studied indoor daylight conditions with louver facades and a research paper was published in this journal (Misawa, Hikone, Nakamura, Iwamoto, Iwata, 2014). This research study reports on the energy conservation performance of louver facades and proposes an External Shading Coefficient (ESC) for external louver systems. Situations with five external louver facades and no louvers, facing three facade orientations (East, South and West) are examined. The year-round ESC is simulated every hour using Radiance software for transient solar radiation calculations. Furthermore, by using the proposed ESC, case studies for typical Japanese offices are carried out to verify reduction effects on the annual thermal load and electrical energy consumption of an air source heat pump for each louver set-up. Simulation results are calculated in hourly increments using TRNSYS software; the results show that both thermal loads and electrical energy consumption are reduced regardless of louver types and facade orientations when integrated external louver facades are installed.
1Introduction
In recent years, it is becoming increasingly important not only to replace buildings, but also to renovate and improve the performance of existing buildings. This is particularly true in Japan, where building lives are short, and it is expected that extending a building’s use can reduce materials consumption for new construction, waste from demolition, and CO2 emissions. Furthermore, there are existing buildings that do not satisfy the latest earthquake-resistance standards and that have to be refurbished. In this situation, structural reinforcements are often added in front of the building’s facades, as it is appropriate to focus on the building’s exterior skin for anti-seismic strengthening. However, many of those reinforcements are designed only from the perspective of structural performance, and they have a negative effect on the overall appearance of the building and its surrounding environment. Because the facade is an important aspect that contributes to the urban landscape aesthetics, as well as influences the energy consumption of the building, an integrated design of seismic reinforcement with the facade is preferred.
An integrated louver facade is a solution that addresses issues of appearance, structural performance and energy consumption. It consists of louvers and Buckling-Restrained-Braces (BRB), and can be applied in new construction and in refurbishment (Takeuchi, Koyano, & Iwata, 2005).Figure 1 shows the BRB configuration. This BRB is the same as in the authors’ previous research (Kaneki, Hikone, Yamashita, & Iwata, 2008; Takeuchi, Koyano, Yasuda, Yuasa, & Iwata, 2006a; Takeuchi, Yasuda, Yuasa, Okayama, Miyazaki, & Iwata, 2006b), however, the summary is described again in the following sections. The BRB has two main components. One is a cross-shaped steel plate and the other is a steel mortar plank, which serves to keep the core steel plate from buckling. The BRB is a structural element that manages both tension and compression forces. Generally, bracing elements used for structural retrofit are usually ‘X’ or ‘V’ shaped because they are designed only to take tension forces. However, a diagonally arranged bracing system is possible when BRBs are installed. Hence BRBs have the potential to integrate with facade elements as diagonally arranged louvers, camouflaging BRBs as a structural intervention. BRBs do not need to be installed in all the diagonal louver elements. One or two are deployed in one beam and one pillar span, as required for structural performance. As reinforcing elements, BRBs require minimal materials, just core steel plates and steel mortar planks; therefore, they can readily harmonize with facade components. For this reason, it is possible for BRBs to become an aesthetic and environmental feature like external louvers, in addition to being structural elements. This study supports BRBs as multipurpose environmental devices/structural elements and proposes diagonally arranged louvers as one of the options for integrated external louver facades.
Figures 2 and 3 show the components and the environmental appearance of facades. External louvers reduce energy consumption by shading windows and external walls from the sun in summer and by allowing the solar radiation to penetrate into the room in winter. They also improve illuminance distribution, remove glare by blocking high brightness areas, and improve the indoor thermal environment.
The authors have studied the arrangement of the louvers and the position of the BRBs, and assessed them from the point of view of appearance, structure, indoor daylight influence and cost (Nakamura, Hikone, Misawa, Iwamoto, & Iwata, 2010).
Although previous research has been conducted on the shading effects of louvers in front of windows, especially in summer, there are few studies considering year-round shading effects of louver facades covering both windows and external walls. There is also little research that demonstrates the effects of louver types and building orientations. For refurbishment, it is necessary to apply a new facade in various arbitrary orientations, because louver and BRB installation is based on existing facades. Therefore, to reduce thermal loads, it is important to understand the impact of the louvers’ arrangement and the building’s orientation on the shading effect and to conduct an assessment based on year-round environmental changes.
This study quantifies over time the shading effects for different building orientations and louver arrangements, and assesses the amount of solar radiation reduction throughout summer (from June to September) and winter (from December to March). The study proposes a method to represent the louvers’ shading effect in a simulation of annual thermal load and energy consumption of an air source heat pump (ASHP), using TRNSYS. This study goes further, and compares simulation results on an office building with different orientations and louver arrangements.
2Outline of daylight simulation
The method and results of solar radiation simulation are the same as in the authors’ previous research (Kubo, Hikone, Misawa, Sato, Fukazawa, Iwamoto, & Iwata, 2011); however, the summary is provided again in the following sections. Proposed External Shading Coefficient (ESC) in section 2.3 is different from Solar Heat Gain Coefficient. Louver facades are installed not only outside of windows but also external walls. In this research, it is necessary to consider solar shading effects of louver facades for windows and external walls. The ESC is a ratio of solar radiation reaching windows and external walls of louver facades. After the ESC calculation, the cumulative amount of solar radiation of louver facades is calculated using the ESC. Figure 10 in section 3.2 shows the results of the cumulative amount of solar radiation of louver facades. These are calculated by thermal simulation using TRNSYS software. Heat gains from windows and external walls (transmission, absorption and reflection), were calculated with integrated tools in TRNSYS software.
2.1Radiance set-up condition
Radiance, a software program for analyzing lighting environment, was used to simulate the annual amount of daylight. Figure 4 shows the flow of the simulation. As the Monte Carlo method is used to calculate inter-reflection, more accurate results are expected to be obtained by increasing the number of daylight rays. Therefore, the number of daylight rays was set to the maximum value allowed in the program, at 4,096, and the number of reflections was set at eight (8), also the highest level allowed in the program. Additionally, other parameters were set to the maximum allowable level in each setting range. Reflectivity was set at 68.8%, which was the same value used in the authors’ previous daylight research (Misawa, Hikone, Nakamura, Iwamoto, & Iwata, 2014).
2.2Application of all sky Model-R
Radiance implements CIE-standard-clear-sky, CIE-standard-overcast-sky, intermediate sky, and uniform sky. Igawa proposed the All Sky Model-R as a sky-model that expresses a time-oriented luminance distribution in the sky (Igawa, Matsuzawa, & Koga, 2004). This study used the All Sky Model-R to obtain the sky radiance distribution, and reflected the result into Radiance (Yoshizawa, Kobayashi, Inanuma, & Takeda, 2005). To set climate conditions for the All Sky Model-R, the Expanded AMeDAS Meteorological Data in standard years (from 1981 to 2000) was used. Figure 5 shows the result for an overcast sky (3rd, January 12:00) and a clear sky (11th, January 12:00).
2.3External shading coefficient
This study suggests and introduces an ESC in order to define the shading effect of louver facades to universally calculate thermal loads. Figure 6 shows the method for measuring the effect of external shading. Daylight measurement points were arranged in a matrix at intervals of 20 mm on an external wall and a window with dimensions of 950 mm wide by 1.800 mm high. The ESC is defined in Formula (1) in which ‘LO’ represents the amount of daylight that reaches the outside surface of the non-louvered facade, and ‘LR’ expresses that with louver facades. Note that, in this study, the calculation did not consider any temperature rise of the louver facades due to the solar radiation and re-emission to the indoor space.
(1)
Louver members were installed in the same positions as with structures for anti-seismic reinforcement, and the distance between the window/external wall and louver members was set at 200 mm as shown in Fig. 6.
2.4Louver outline
Figure 7 shows the arrangement of the louvers. Based on the size of the BRB, the regular size of louver members was set to 100 mm thick by 250 mm deep. The size of the unit was determined by the distance between columns, 4.5 m, and the floor height, 3.8 m. Louver members were assembled in frames giving five types: horizontal, vertical, right-up diagonal, right-down diagonal, and ‘bound’. To maintain the view from the interior, each louver’s opening rate was set to approximately 75%.
The ‘bound louver facades’ proposed by the authors are attached randomly to a frame that is fitted between the columns of an existing building for anti-seismic reinforcement. The random alignment of louver members is intended to effectively block solar radiation from all orientations. The authors proposed the geometry of the ‘bound louver facade’ by studying a prototype that was made to optimize the constructability of the facade, the transportability of a unit, and the number of joints between the louver members (Takeda, Hikone, Misawa, & Iwata, 2010). In the integrated louver design, BRBs can be louvers as well as reinforcements, creating ‘integral types’ of diagonal and ‘bound’ louver facades. However, horizontal and vertical louvers cannot be BRBs; they are called ‘separated types’ and cannot offer bracing. In this study, ‘separated types’ were made without BRBs, and the same opening rate was used in the frames to compare the shading effect of each louver arrangement. Figure 8 shows the concept of ‘opening rate’. It was calculated using the external dimensions of the unit area, excluding the louver member and the frame width.
3Calculated result of the amount of solar radiation
3.1Hourly fluctuation of the ESC
The ESC is zero when windows and external walls are entirely covered by louvers and is 1 when windows and external walls have no louvers. The ESC before dawn and after sunset is 1, because there is no solar radiation.
Figure 9 shows the average values of calculated ESC against time between 5 a.m. and 6 p.m. in summer (from June to September) and in winter (from December to March). The ESC did not change for eastward orientation in the afternoon nor west-facing before noon, since direct solar radiation did not reach the building surface in those cases and only global radiation was measured. It is assumed that when windows and external walls do not receive direct solar radiation, the external shading effect is not determined by the louver’s arrangement, but by its opening rate.
Horizontal louver facades achieved a minimum-shading coefficient in summer for south-facing surfaces; however, they may not be appropriate for east and west-facing surfaces. Some shading against incident solar radiation was expected in winter, as the ESC is larger in winter than summer. It was observed that in southerly orientations, the values did not change much with time, and the ESC tended to be large in winter, just as in east and west orientations.
For vertical louver facades, little change was observed in summer for east and west orientations. In winter, values tended to change widely depending on time of day. South-facing surfaces had a large change of shading values around noon especially in winter, and it is suspected that the thermal load would increase during the insolation cycle.
For diagonal louver facades, the ESC was relatively small for right-up direction in east-facing direction and by right-down in west-facing. In south, the effectiveness of the louvers switched from right-down to right-up around noon.
ESC value change behaviour for bound louver facades was identical to that for diagonal ones, and transitioned between characteristics associated with right-up and right-down types. It was confirmed that the bound louver facades are comparable to other types of louver facades in their shading effect.
Overall, in summer there was a smaller difference between different louver arrangements compared to winter. In winter, the ESC showed larger values generally when the solar altitude was low and solar radiation was expected to reach the indoor space. Additionally, all the types of louver facades showed large changes over time and a large difference was observed between different louver arrangements in winter.
3.2Comparison of the amount of solar radiation
In order to compare the amount of solar radiation transmitted, the authors simulated the amount of vertical global radiation in each orientation and for each instant of time in a Tokyo Standard Year. Then using the values, the cumulative amount of solar radiation was calculated by multiplying the ESC by these values. Figure 10 shows the cumulative amount of solar radiation in six cases: in one case the facade has no louvers, while in the other cases the facade has five different arrangements of louvers. Summer (from June to September) and winter (from December to March) cases are covered.
For eastward orientations, all louver arrangements had a greater solar radiation reduction effect in summer compared with winter. In summer, horizontal louver facades reduced the solar radiation by 66%, the largest amount of reduction; vertical louver facades reduced the solar radiation by 62%, diagonal and bound louver facades reduced it by 55%. In winter, the diagonal (right-down) louver facades reduced solar radiation by 47%, the lowest reduction value, and the vertical louver facades reduced it by 66%. Horizontal louver facades reduced solar radiation by 60% and the diagonal (right-up) and bound louver facades reduced it by 50%.
In south-facing situations, all louver arrangements demonstrated less reduction in summer than in winter. In summer, the horizontal louver facades achieved the largest reduction of 66%, while the vertical louver facades achieved 62% and the diagonal/bound louver facades 55%. In winter, the diagonal (right-down) louver facades showed the lowest reduction effect of 47%, while the vertical louver facades reduced solar radiation by 66%, the horizontal louver facades, 60%, and the diagonal/bound louver facades by 50%. The shading effect was large in winter, and it was suspected that installing louver facades would cause an increase in the heating load.
In west-facing orientations, as was the case with the east-facing, all louver facades had a greater reduction effect in summer than in winter. In summer, the effect of the horizontal louver facades was 66%, the largest reduction of all types of louver facades. The effect of the vertical louver facades was 62% and that of diagonal/bound louver facades was 55%. In winter, the effect of the diagonal (right-down) louver facades was 47%, the lowest value, while the vertical louver facades had the highest value, 66%. The shading effect of the horizontal louver facades was 60% and that of the diagonal (right-up) and bound louver facades was 50%.
4Simulation outline of thermal load and electrical energy consumption
4.1Simulation method
In order to simulate the annual indoor thermal load taking shading effects into account, TRNSYS ver.16, a dynamic heat simulation program for multiple rooms, was used.
4.2Objective building
This study undertook a simulation using the Japanese Standard Office Model (the Model) proposed by Takizawa (Takizawa, 1985), subject to renovation. Figure 11 and Table 1 show a standard floor plan of the Model together with assumptions concerning material composition. The Model was created with reference to Standard Issues for Office proposed by the Environmental Committee of the Architectural Institute of Japan. Some U-values in Table 1 are lower than given in the latest building specifications, but these values were used in this study because the Model (proposed about thirty years ago) is referenced in many environmental research studies as using these material compositions. Tokyo was selected as the target location. The eight story high building embodied a Reinforced Concrete structure. As almost all existing buildings require seismic retrofitting and their windows face many different orientations, the windows in the Model are on all elevations and represent 30% of the external wall area of the office.
4.3Conditions of calculation
Model simulation conditions are outlined in Table 2. The standard year’s weather data from the Expanded AMeDAS Weather Data (1981∼2000, Tokyo) was used to define meteorological conditions. After conducting fore-flow calculations for a month, calculations were made for every hour.
4.3.1Indoor heat generation
(1) Human Heat Generation
Heat generation from the human body was set based on information provided by the SHASE Handbook 14th Vol.1 Fundamental (The Society of Heating, Air-Conditioning and Sanitary Engineers of Japan, 2010). For the Model, the heat generation was calculated at 121 W/person (sensible heat and latent heat were noted for each month) at an occupancy rate (0.1 person/m2), and seated light work, typing.
(2) Lighting Heat Generation
Lighting heat generation for the Model was set at 20 W/m2, referring to the standard office lighting energy consumption provided by IBEC (Institute for Building Environment and Energy Conservation, 2010).
(3) Heat Generation from Equipment
For the Model, the heat generation from equipment was set at 20 W/m2.
4.3.2Schedule of air-conditioning
Air-conditioning in the Model operated from 7 a.m. to 9 p.m. on weekdays and did not work on Saturday and Sunday. Time schedule was set for human, lighting and equipment percentages of heat generation in Table 2. There were no special other controls. Heat generation was the same in all cases. The cooling and heating period was set as constants throughout the year. In the comparison study of louver facades, loads caused by air leakages and ventilations were the same value in all cases. This study did not count the loads in the comparison of the results.
4.3.3Settings for Air Source Heat Pump (ASHP) and indoor air temperature control
This paper calculated the electrical energy consumption of an ASHP. The specification of selected air conditioners is given in Table 3. Generally, COP is given in suppliers’ catalogues, but it is only a rated value, not the actual COP in application. Ueno proposed a calculation method for the actual COP of working air conditioners. The actual COP was calculated using the heat source model. The proposed method of calculating actual COP does not depend on any individual device (air conditioner) characteristics, and has been verified through many experiments. This calculation method can be applied generically to any air conditioners. (Ueno, Kitahara, & Miyanaga, 2013, 2014) In this study, the methodology was applied to actual COP calculation.
The indoor air temperature for simulation studies was set to 22°C from December to March, 24°C in April and November, and 26°C from May to October. The fan power needed to deliver fresh air was not considered in this calculation.
5Result of thermal loads and electrical energy consumptions
Figure 12 and Table 4 show the thermal load and electrical energy consumption simulated with the Model facing east, south and west. In this study, an integrated facade system was installed in one building elevation indicated in Fig. 11 and the Model was rotated to direct the system to east, south and west. Facades not covered by the integrated facade system were arranged to face other directions. For example, if the system faced south, no louver facades were faced to east, west and north. Under such conditions, the result of three orientations: east, south and west, showed the same qualitative tendency. The results of the south-facing model are graphed in Fig. 12 as a representative outcome; Table 4 provides detailed figures for all results.
5.1Representative outcome of Orientation (the result of the South– facing Model)
Figure 12 shows the results for thermal load (Fig. 12A) and electrical energy consumption (Fig. 12B) that were simulated with the Model for south-facing louver facades. It was found that all models with louver facades, regardless of type, reduced both thermal load and electrical energy consumption. Almost all thermal load was cooling load and every louver facade type reduced total load and electrical energy consumption. The reduction ratio of annual thermal load in the horizontal and the vertical louver facades was over 10%, however others were almost 9%. The reduction ratio of annual electrical energy consumption was similar to the load reduction, at around 7.5 to 8% in the case of the horizontal and vertical louver facades, and around 6.5 to 7% in other cases. The annual performance factor of the air conditioner (APF) was almost 4 in all louver facades.
5.2Thermal load
It was found that all models with louver facades, regardless of their type, reduced the cooling load, although horizontal and vertical louver facades created a slightly larger reduction than others. The most effective case was the east-facing horizontal louver facade. However, other types of louver facades reduced the cooling load by more than 4%.
For all orientations, the heating load increased after installation of louver facades. The ratio of heating load increase for horizontal and vertical louver facades was larger than the others. Furthermore, east-facing and south-facing louver facades had a relatively higher heating increase than others did.
The annual thermal load decreased for all orientations and louver facades in this study. It was observed that all louver facades were effective in achieving a 5 to 13% reduction in total thermal load. East-facing models were most effective in reducing annual thermal load. East-facing louver facades performed as shading devices from sunrise and they reduced starting loads for cooling.
5.3Electrical energy consumption of heat pump
It was found that all models with louver facades, regardless of the arrangement of louvers, reduced the electrical energy consumption required for cooling. The electrical energy consumption required for heating increased after installation of louver facades, but the overall annual electrical energy consumption decreased for all orientations and louver arrangements. It was observed that all louver facades were effective in reducing annual electrical energy consumption by between 10.69 and 8.59% for eastward orientations, 8.09 and 6.68% for south and 5.94 and 4.73% for west. It was noted that east-facing louver facades could reduce electrical energy consumption by more than other orientations.
5.4Annual Performance Factor (APF)
The APF of the selected air conditioner was calculated for each of the simulation cases. The resulting APF was a reasonable value, almost 4, and if the thermal load is larger, APF increases. It is assumed that the performance of the selected air conditioner is better when the thermal load is large.
6Conclusion
This study conducted research on the effect of integrated facade systems, which combine louvers and BRBs. The following are the major findings:
(1) External Shading Coefficient: the ESC, proposed by the authors using Radiance simulations and All Sky Model-R, was used for each case. Five types of louver facades were examined: horizontal, vertical, diagonal (right-up and right-down), and bound louver facades. Three orientations were set: east-, south- and west-facing.
(2) Characteristics of louver facades by type were analysed using the ESC calculation method. It was confirmed that, even when the opening rate was constant, the ESC changed due to louver arrangements, orientation, time, and season.
(3) Quantified values of solar radiation reduction resulting from the installation of louver facades were obtained. They were as follows (by orientation/season): east/summer 52– 76%, east/winter 47– 66%, south/summer 58– 72%, south/winter 47– 60%, west/summer 53– 66%, west/winter 47– 66%.
(4) Thermal loads by orientation, (east, south, and west), were simulated using TRNSYS, using the above-mentioned ESC. As a result, it was observed and confirmed that louver facades were effective in reducing the total thermal load by between 13.04% and 5.35% for all three orientations.
(5) The electrical energy consumption for air-conditioning for all three orientations was also simulated using TRNSYS, using the Air Source Heat Pump: ASHP, and actual COP model proposed by Ueno (Ueno et al., 2013, 2014). As a result, it was confirmed that five types of louver facades reduced the electrical energy consumption for all orientations. Specifically, the electrical energy consumption was decreased by between 4.73% and 10.69%.
(6) Both thermal load and electrical energy consumption can be reduced by applying an integrated facade system to existing buildings undergoing refurbishment. These buildings may need seismic retrofitting and appropriate thermal insulation of external walls. An integrated facade system provides sun shading and seismic refurbishment, and the system reduces electrical energy consumption without thermal insulation improvements to the external wall. Therefore an integrated facade system can be an appropriate energy saving measure for building in phased refurbishment, such as when seismic retrofitting is scheduled prior to improvements in external wall thermal insulation. Both seismic safety and a reduction of electrical energy consumption are achieved using integrated facade systems.
For future applications, it will be necessary to carefully study the building types where large energy savings are expected; building types in which indoor heat generation is high and cooling is used throughout the year. It is also expected that the size and pitch of the louvers and the distance between the louvers and the window/external wall surface will need to be adjusted appropriately because this study determined them by simply using the dimensions of the main structural frame and the BRB. Finally, it will be important to measure the efficiency of integrated facade systems in real buildings and to accumulate data for improving building stocks.
Acknowledgments
This study was carried out using Japanese Ministry of Land, Infrastructure, Transport and Tourism Grant Aid for Leading Technological Development for Housing and Construction. Subsidy title: Development of Regeneration Technologies for Existing Stock by means of an ‘Integrated Façade’ that Simultaneously Attempts Performance Improvement in Design, Structure and the Environment. We would like to express our thanks for the excellent support.
References
1 | Igawa N. , Matsuzawa T. , & Koga Y. ((2004) ). Comparison of All Sky Model-R and All Sky Model-L between previous models. Proceedings of Architectural Institute of Japan, D-2: , 57–58. |
2 | Kanaki Y. , Hikone S. , Yamashita T. , & Iwata M. ((2008) ). Seismic Strengthening by the buckling restrained braces arranged diagonally. Journal of Structural and Construction Engineering, (634), 2215–2222. |
3 | Kubo K. , Hikone S. , Misawa Y. , Sato T. , Fukazawa T. , Iwamoto S. , & Iwata M. ((2011) ). A study on indoor thermal environment in integrated facade system; sun shading effect of louver and case study of annual air-conditioning load. Proceedings of The Society of Heating, Air-Conditioning Sanitary Engineers of Japan, 23: (2), 927–930. |
4 | Misawa Y. , Hikone S. , Nakamura M. , Iwamoto S. , & Iwata M. ((2014) ). Diagonally arranged louvers in integrated facade systems – on the interior lighting environment. Journal of Facade Design and Engineering, 2: (3-4), 163–182. |
5 | Nakamura M. , Hikone S. , Misawa Y. , Iwamoto S. , & Iwata M. ((2010) ). The integrated facade consists of louvers and buckling-restrained-braces as a building system. Journal of Environmental Engineering (Transactions of AIJ), 75: (647), 121–129. |
6 | Takeuchi T. , Koyano K. , & Iwata M. ((2005) ). Studies on integrated facade engineering. Analyses on existing facades. Journal of Environmental Engineering (Transaction of AIJ), (592), 97–104. |
7 | Takeuchi T. , Koyano K. , Yasuda K. , Yuasa K. , & Iwata M. . ((2006) a). Studies on integrated facade engineering. Proposal for integrated facade and its evaluation. Journal of Environmental Engineering (Transaction of AIJ), (601), 81–88. |
8 | Takeuchi T. , Yasuda K. , Yuasa K. , Okayama S. , Miyazaki K. , & Iwata M. . ((2006) b). Seismic retrofit of aged building with integrated façade. AIJ Journal of Technology and Design, (24), 161–166. |
9 | Takeda H. , Hikone S. , Misawa Y. , & Iwata M. ((2010) ). A Study on Bound Louver of the Integrated Façade. Proceeding of Architectural Institute of Japan, D-2: , 1239–1240. |
10 | Takizawa H. ((1985) ). Proposal of Standard issues for Office building. Proceedings of Architectural institute of Japan, 15th heating issue symposium, 35–42. |
11 | The Society of Heating, Air-Conditioning and Sanitary Engineers of Japan ((2010) ). SHASE Handbook, 14(1) Fundamental, 414. |
12 | Ueno T. , Kitahara H. , & Miyanaga T. ((2013) ). Development of heat source characteristic model of home use air conditioner: (Part 1) characteristic model during cooling period. The Society of Heating, Air-Conditioning Sanitary Engineers of Japan, (190), 41–49. |
13 | Ueno T. , Kitahara H. , & Miyanaga T. ((2014) ). Development of heat source characteristic model of home use air conditioner (Part 2) characteristic model for heating period and evaluation of applicability of model to various appliances. The Society of Heating, Air-Conditioning Sanitary Engineers of Japan, (204), 85–92. |
14 | Yoshizawa N. , Kobayashi K. , Inanuma M. , & Takeda H. ((2005) ). Typical annual weather data (TWD/L9302/L) in Tokyo area and its application to the daylighting simulation. Journal of Environmental Engineering (Transaction of AIJ), (598), 23–29. |
Figures and Tables
Fig.1
Configuration of bucking restrained brace.
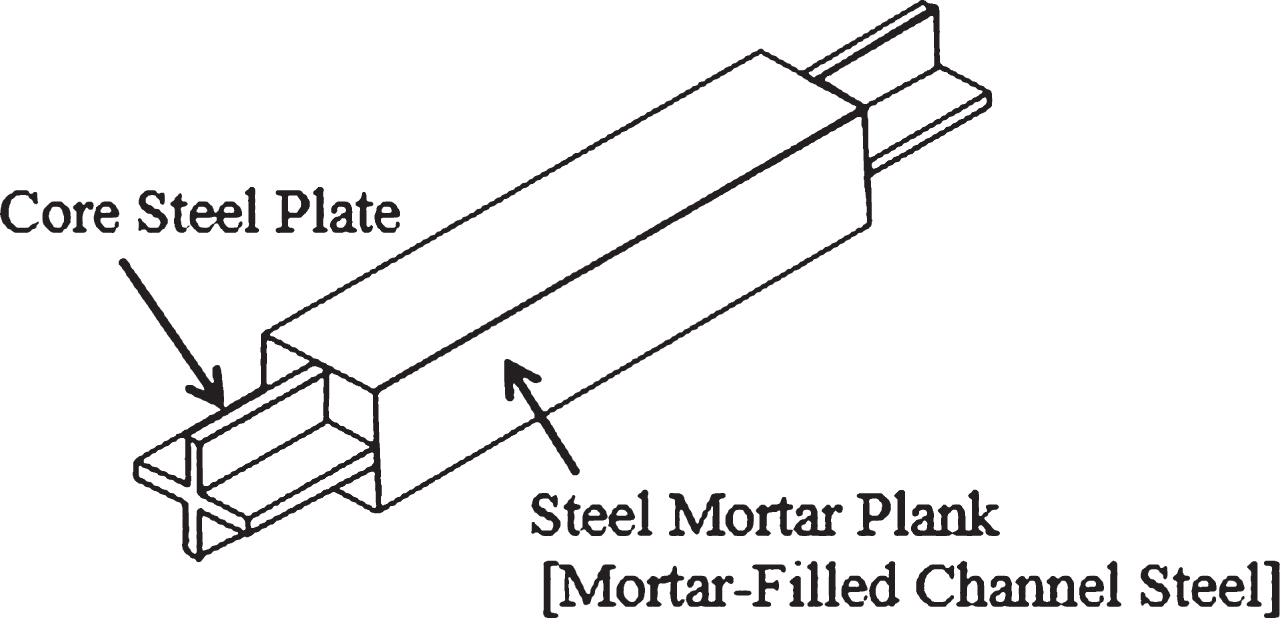
Fig.2
Composition of integrated louver facade.
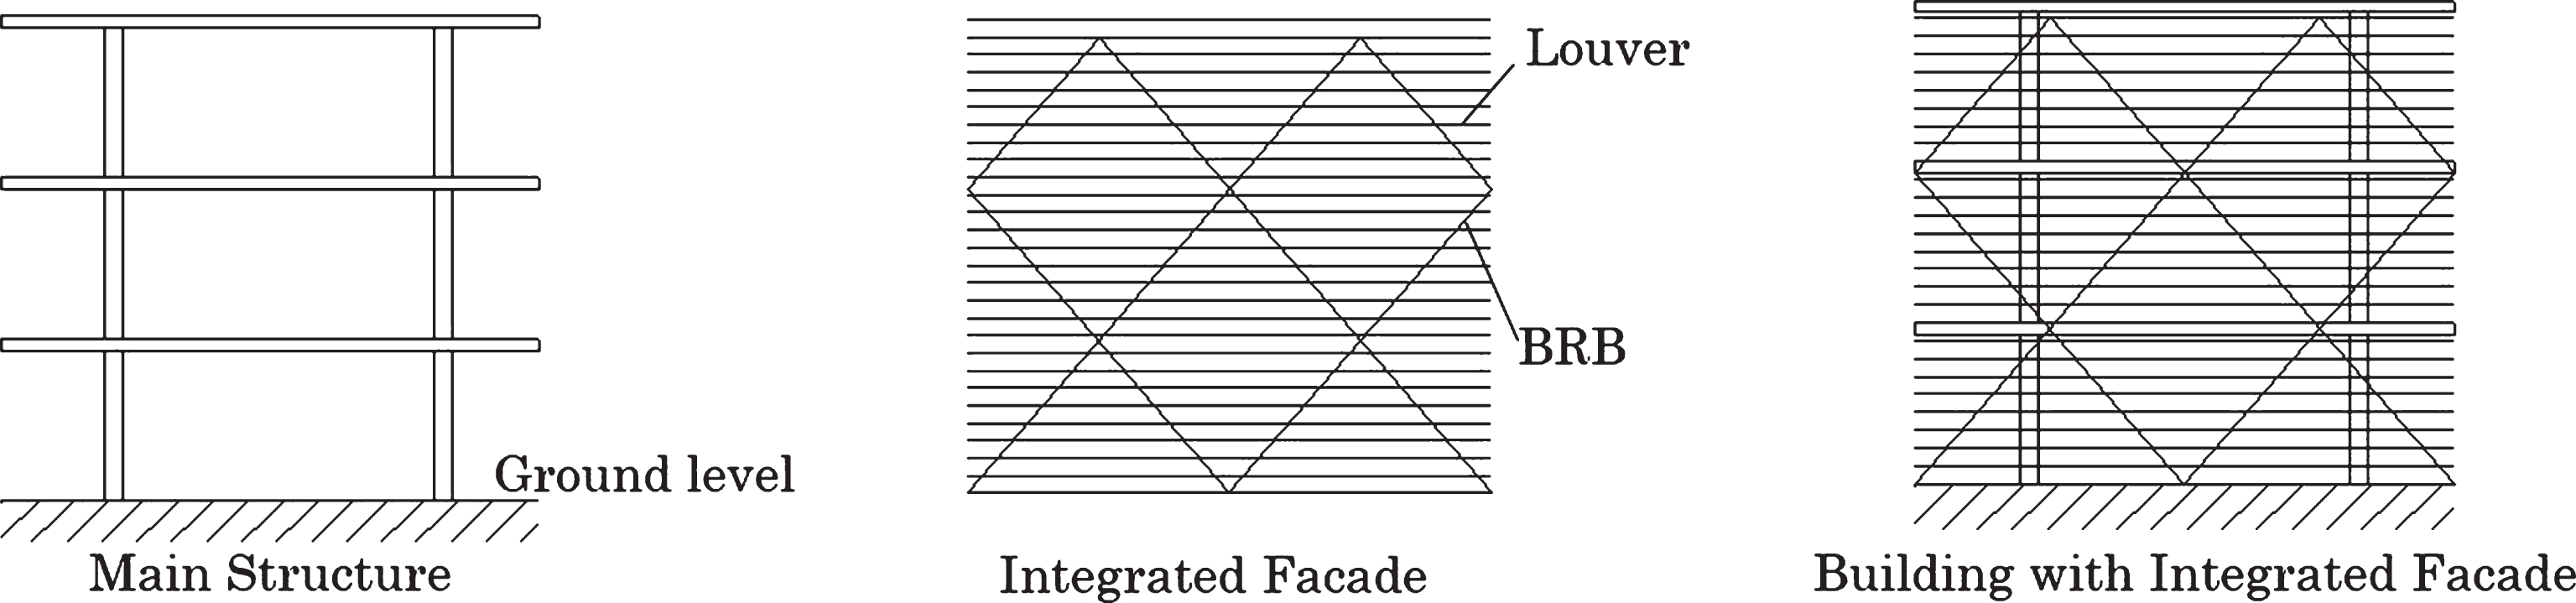
Fig.3
Environmental aspect of louver facade.
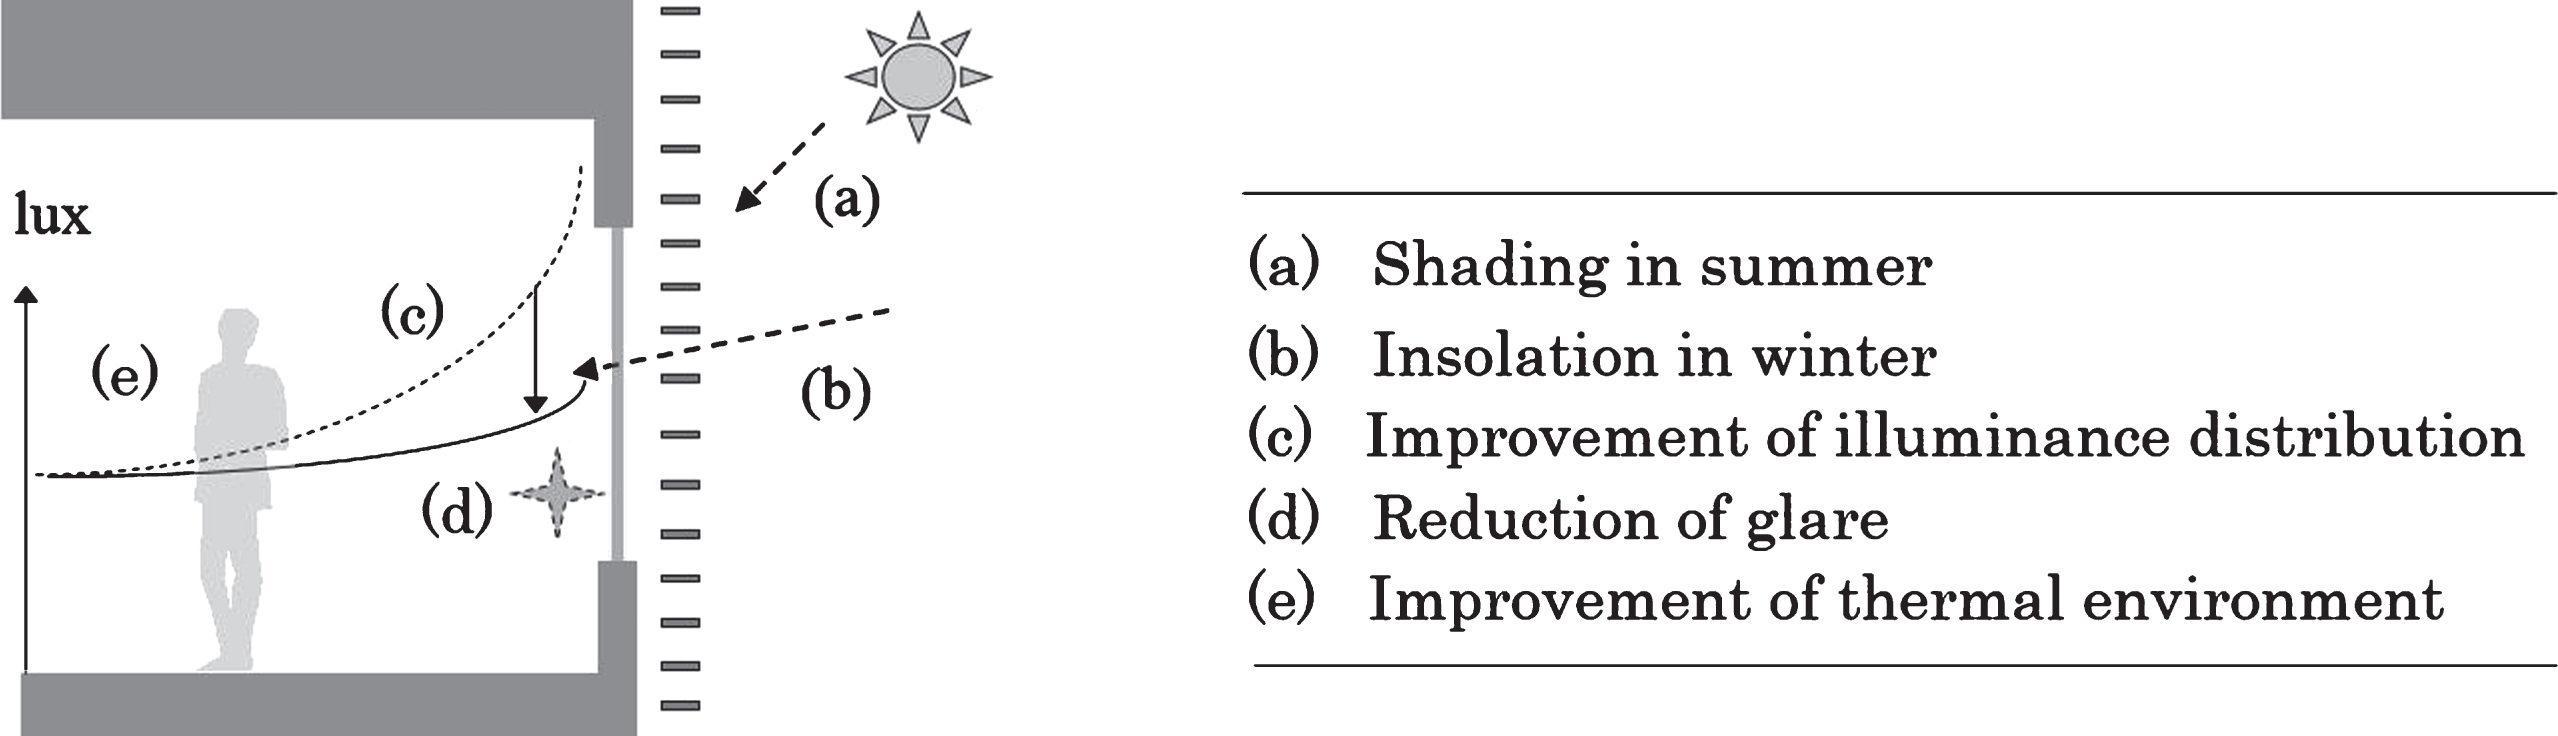
Fig.4
Simulation flow.
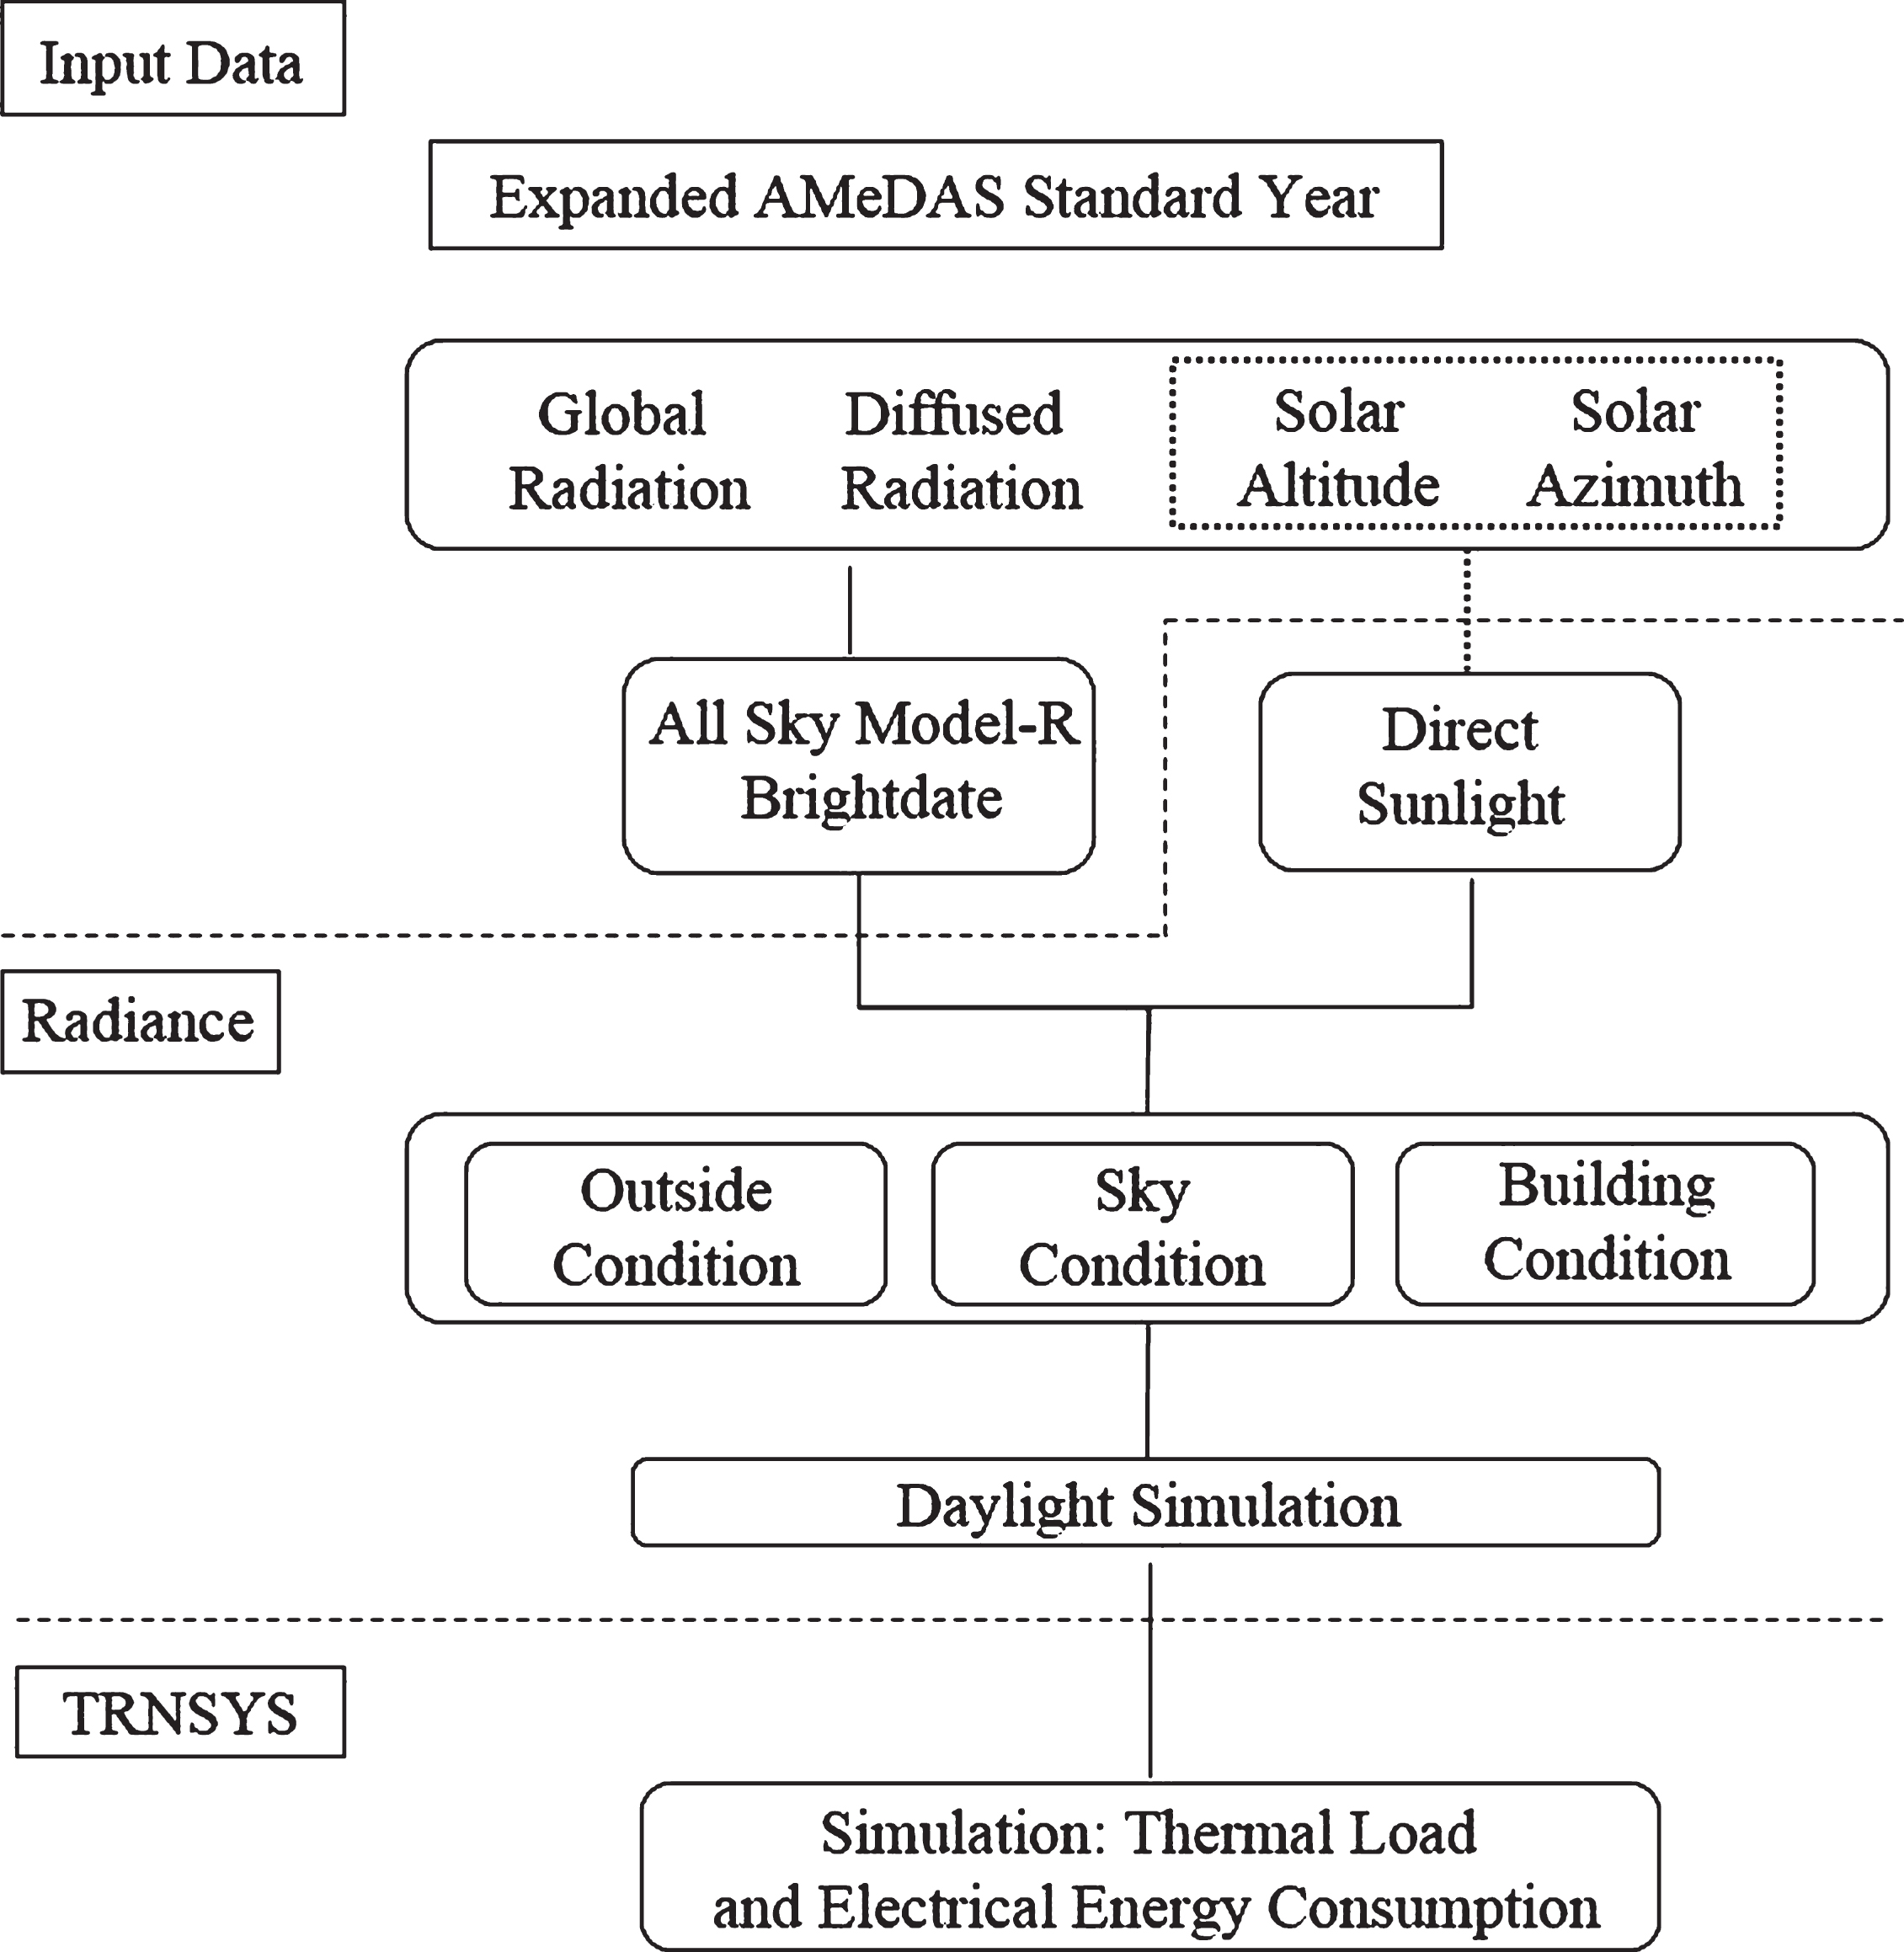
Fig.5
All sky model-R (W/sr m2).
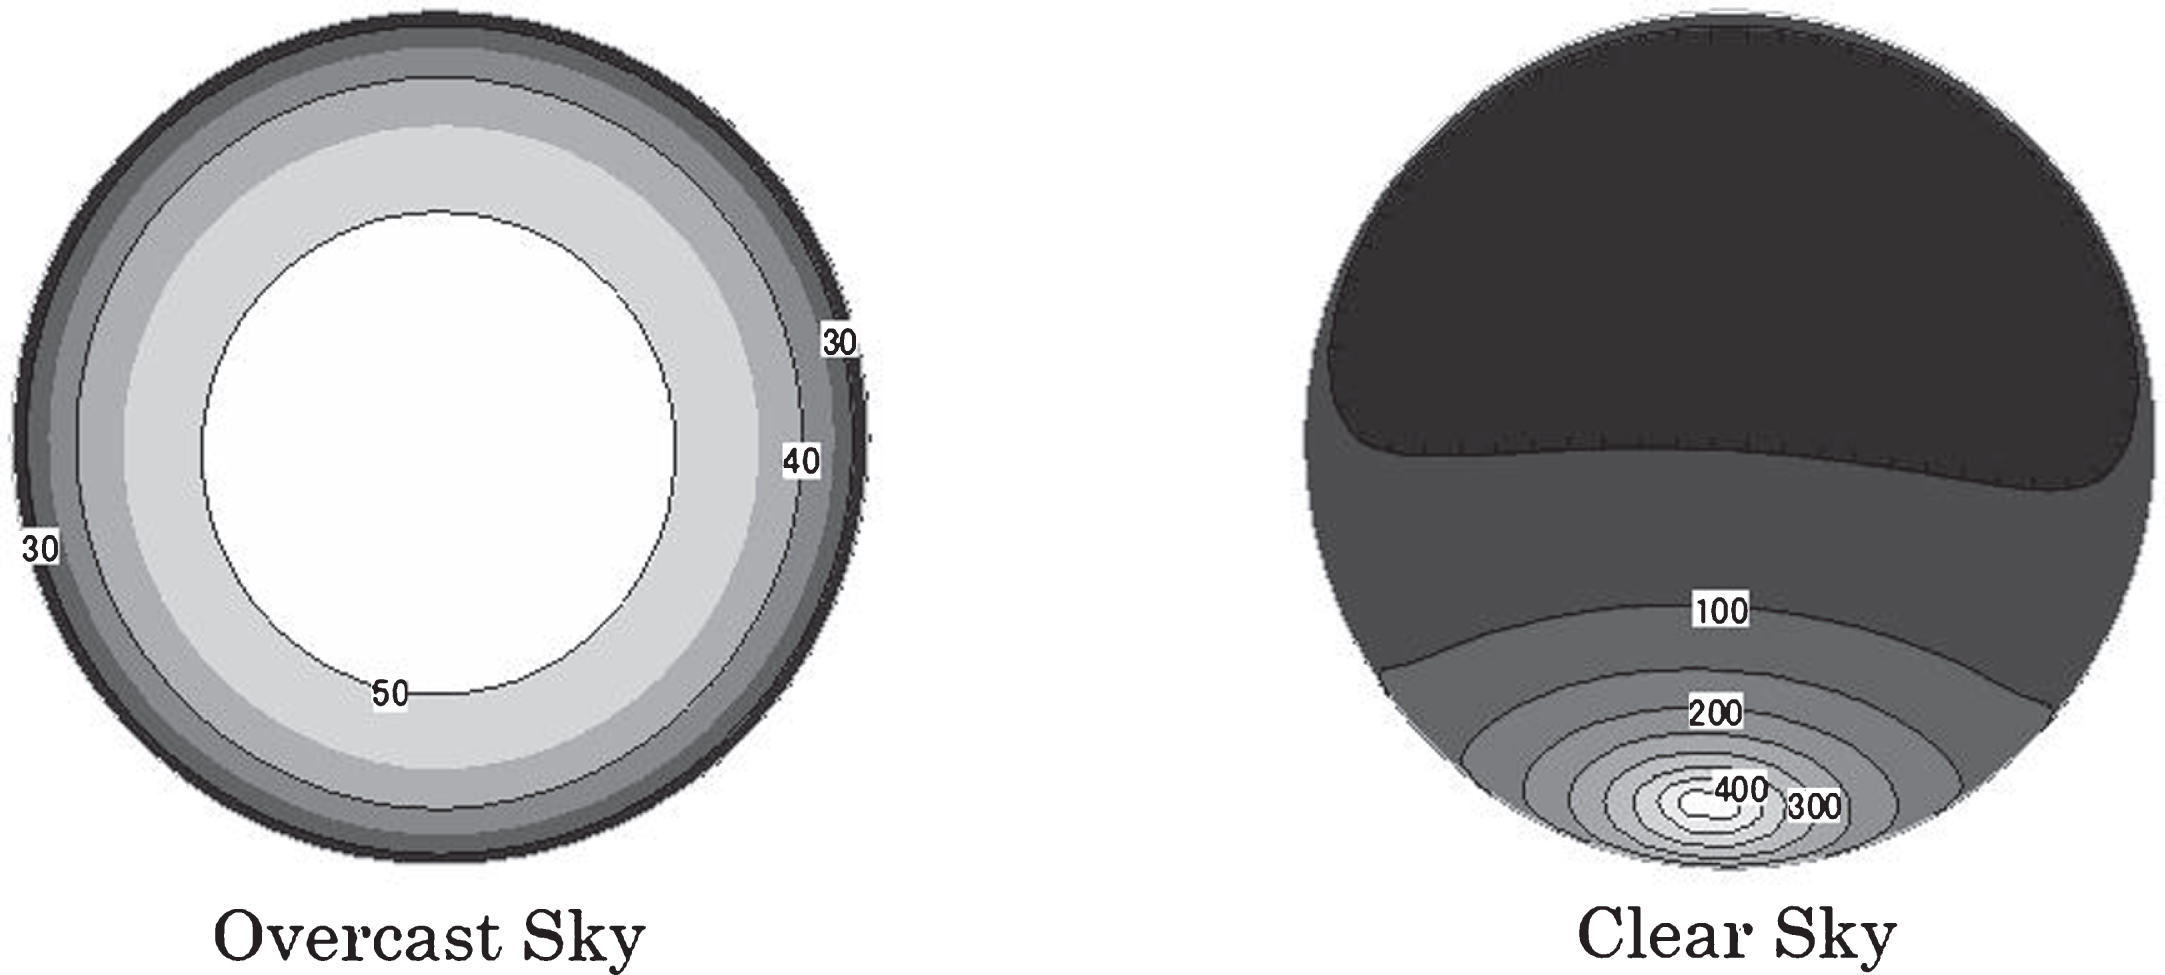
Fig.6
Measuring method.
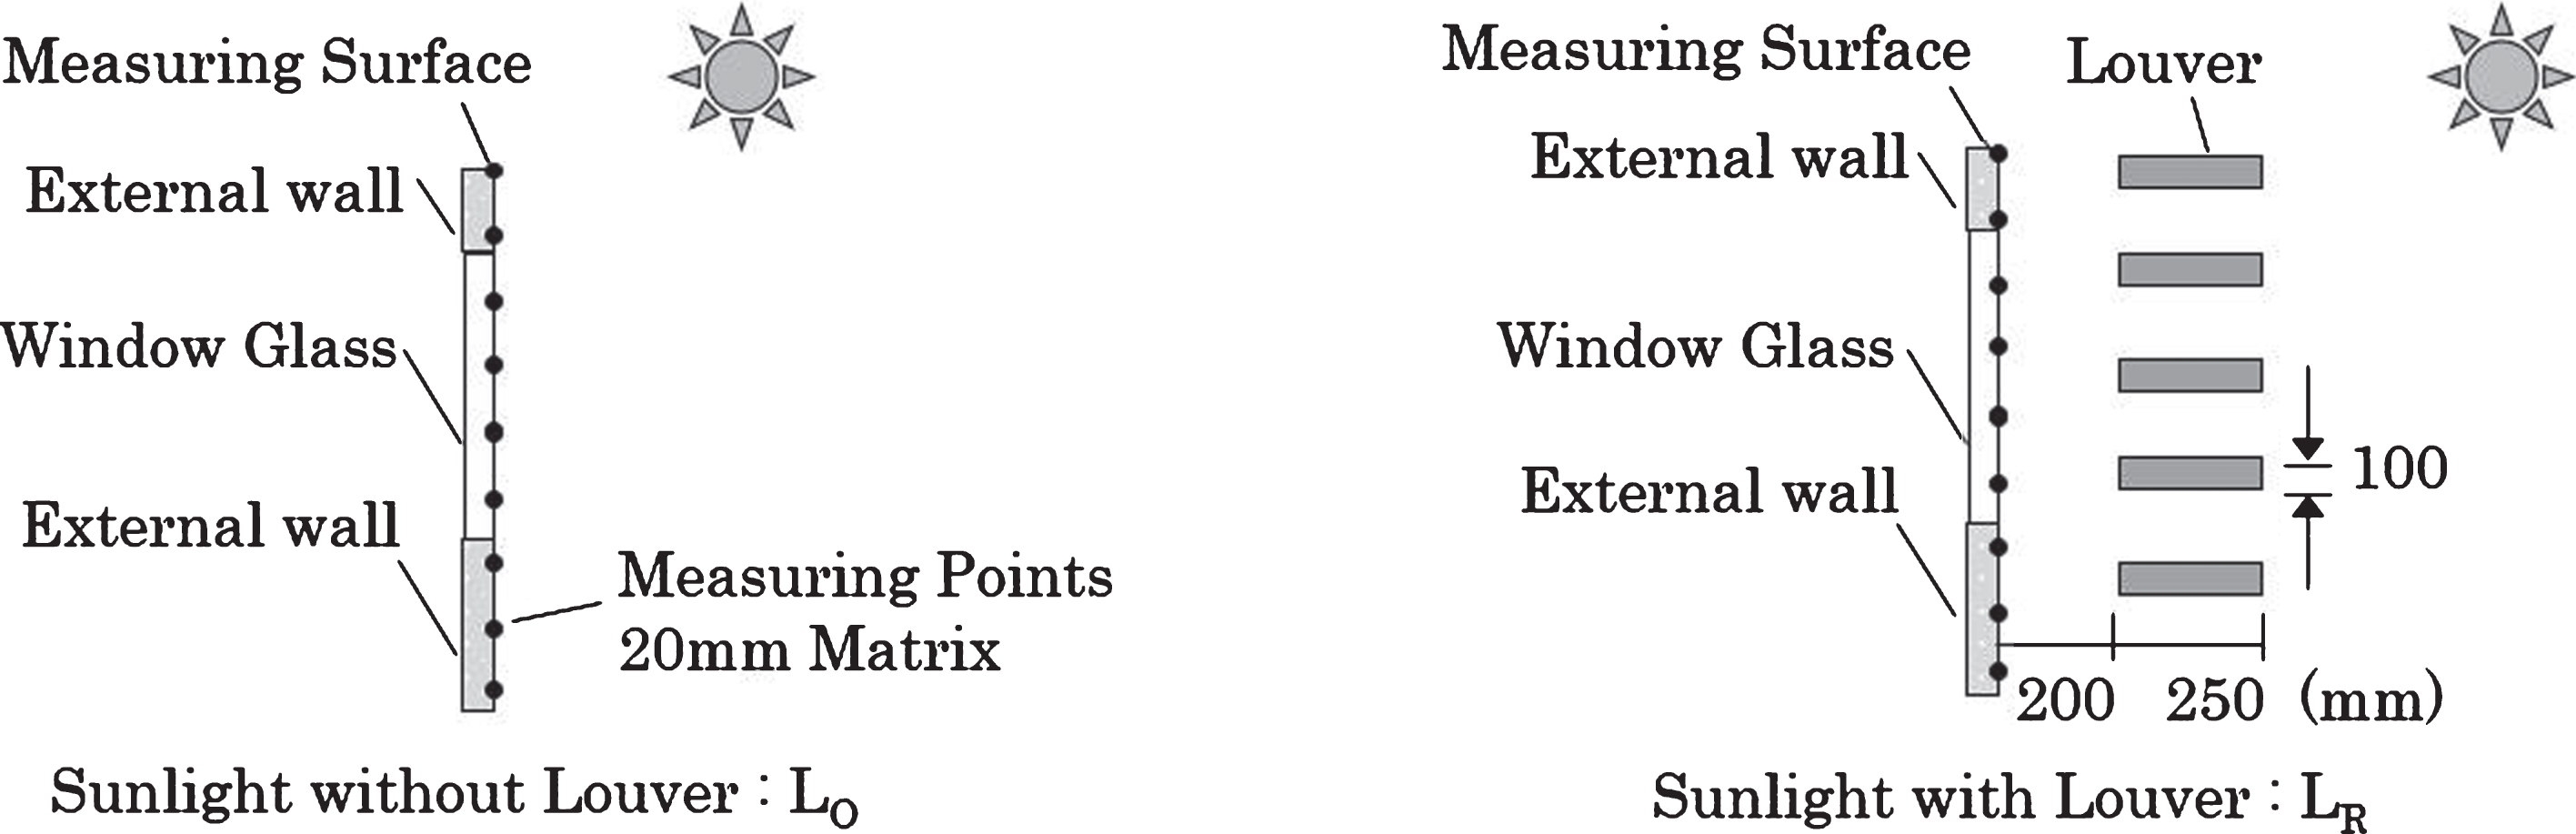
Fig.7
Louver arrangement.
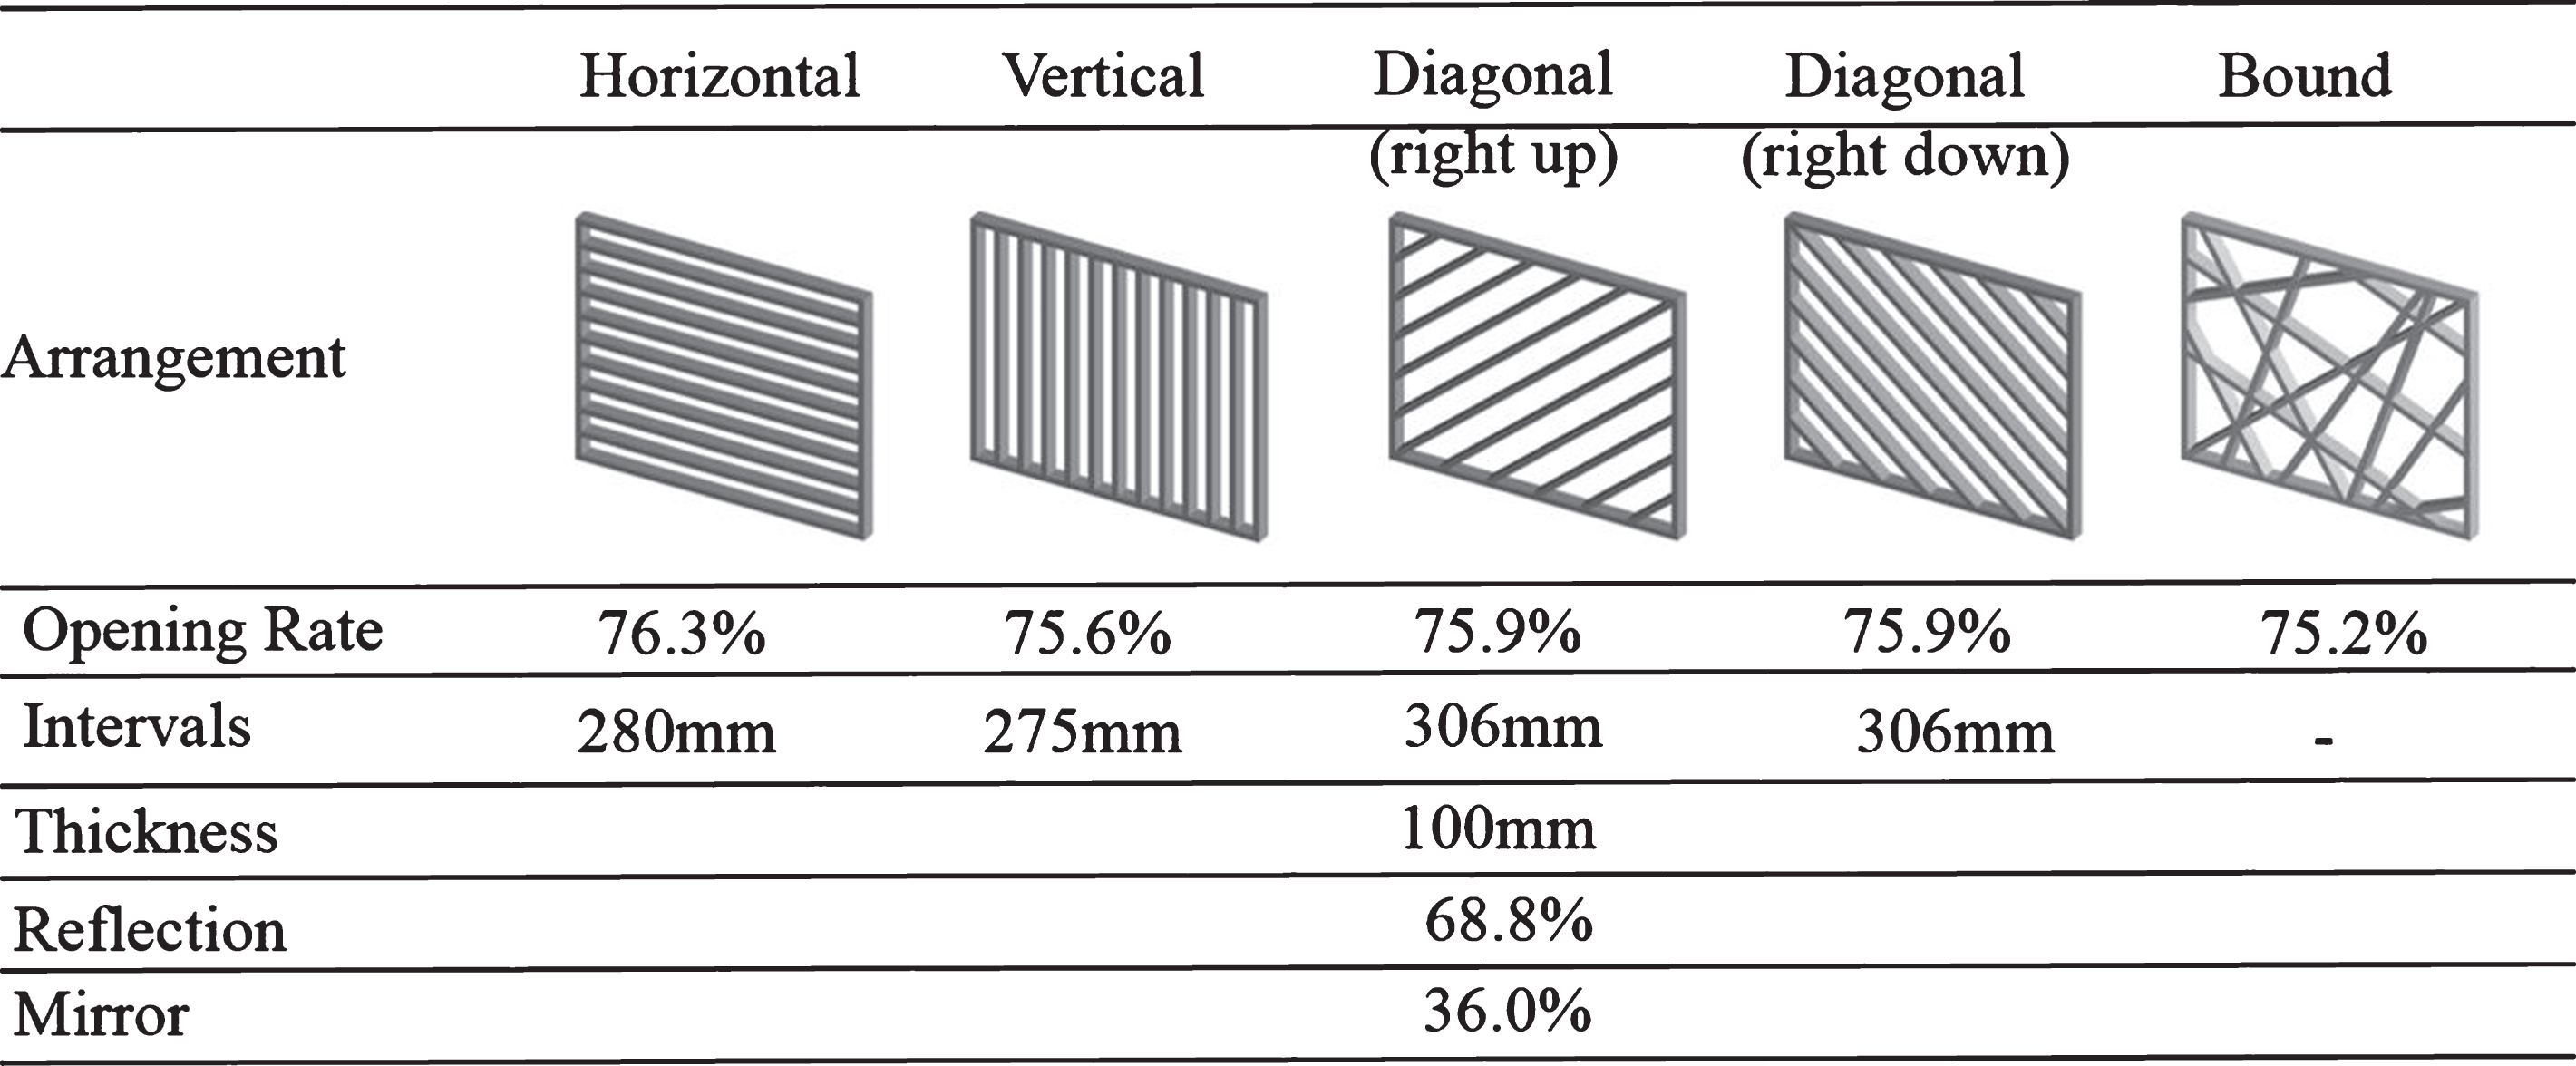
Fig.8
Opening rate.
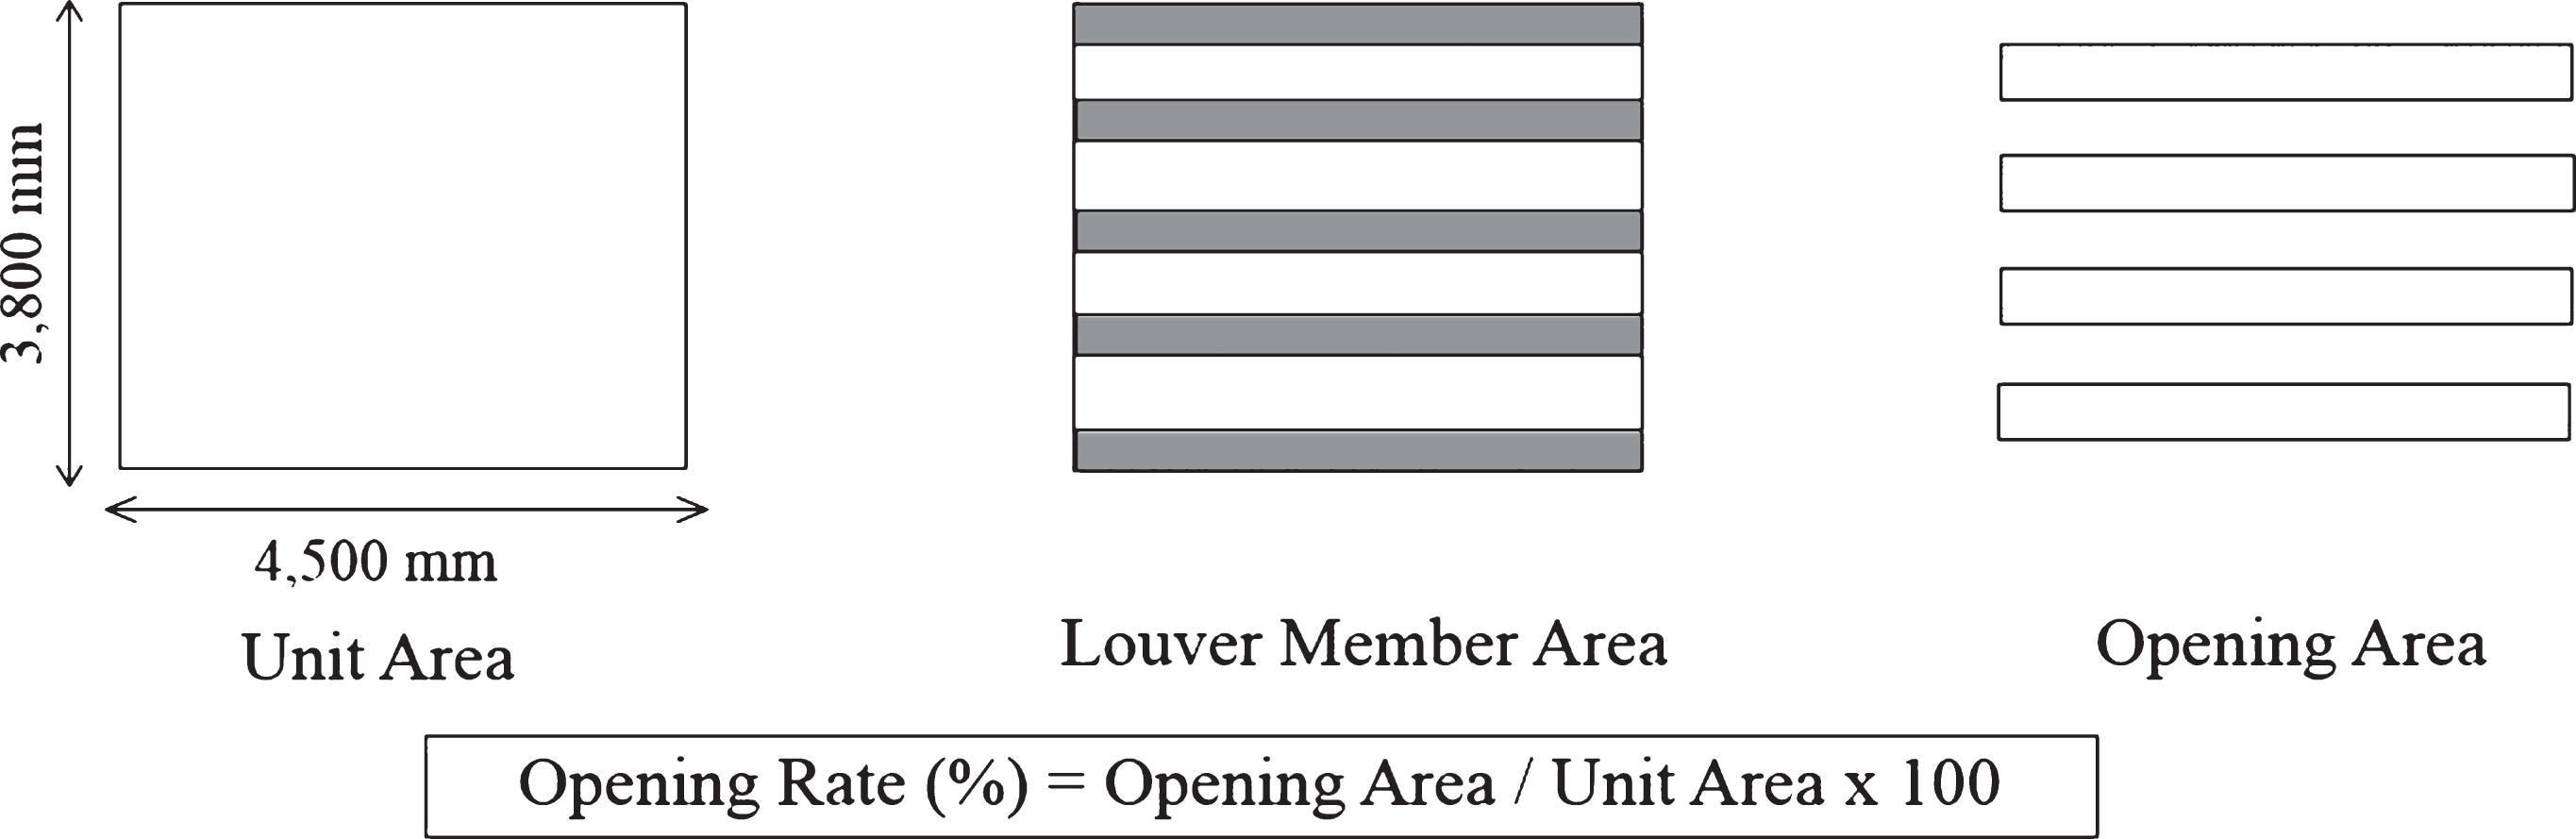
Fig.9
Comparison of the ESC.
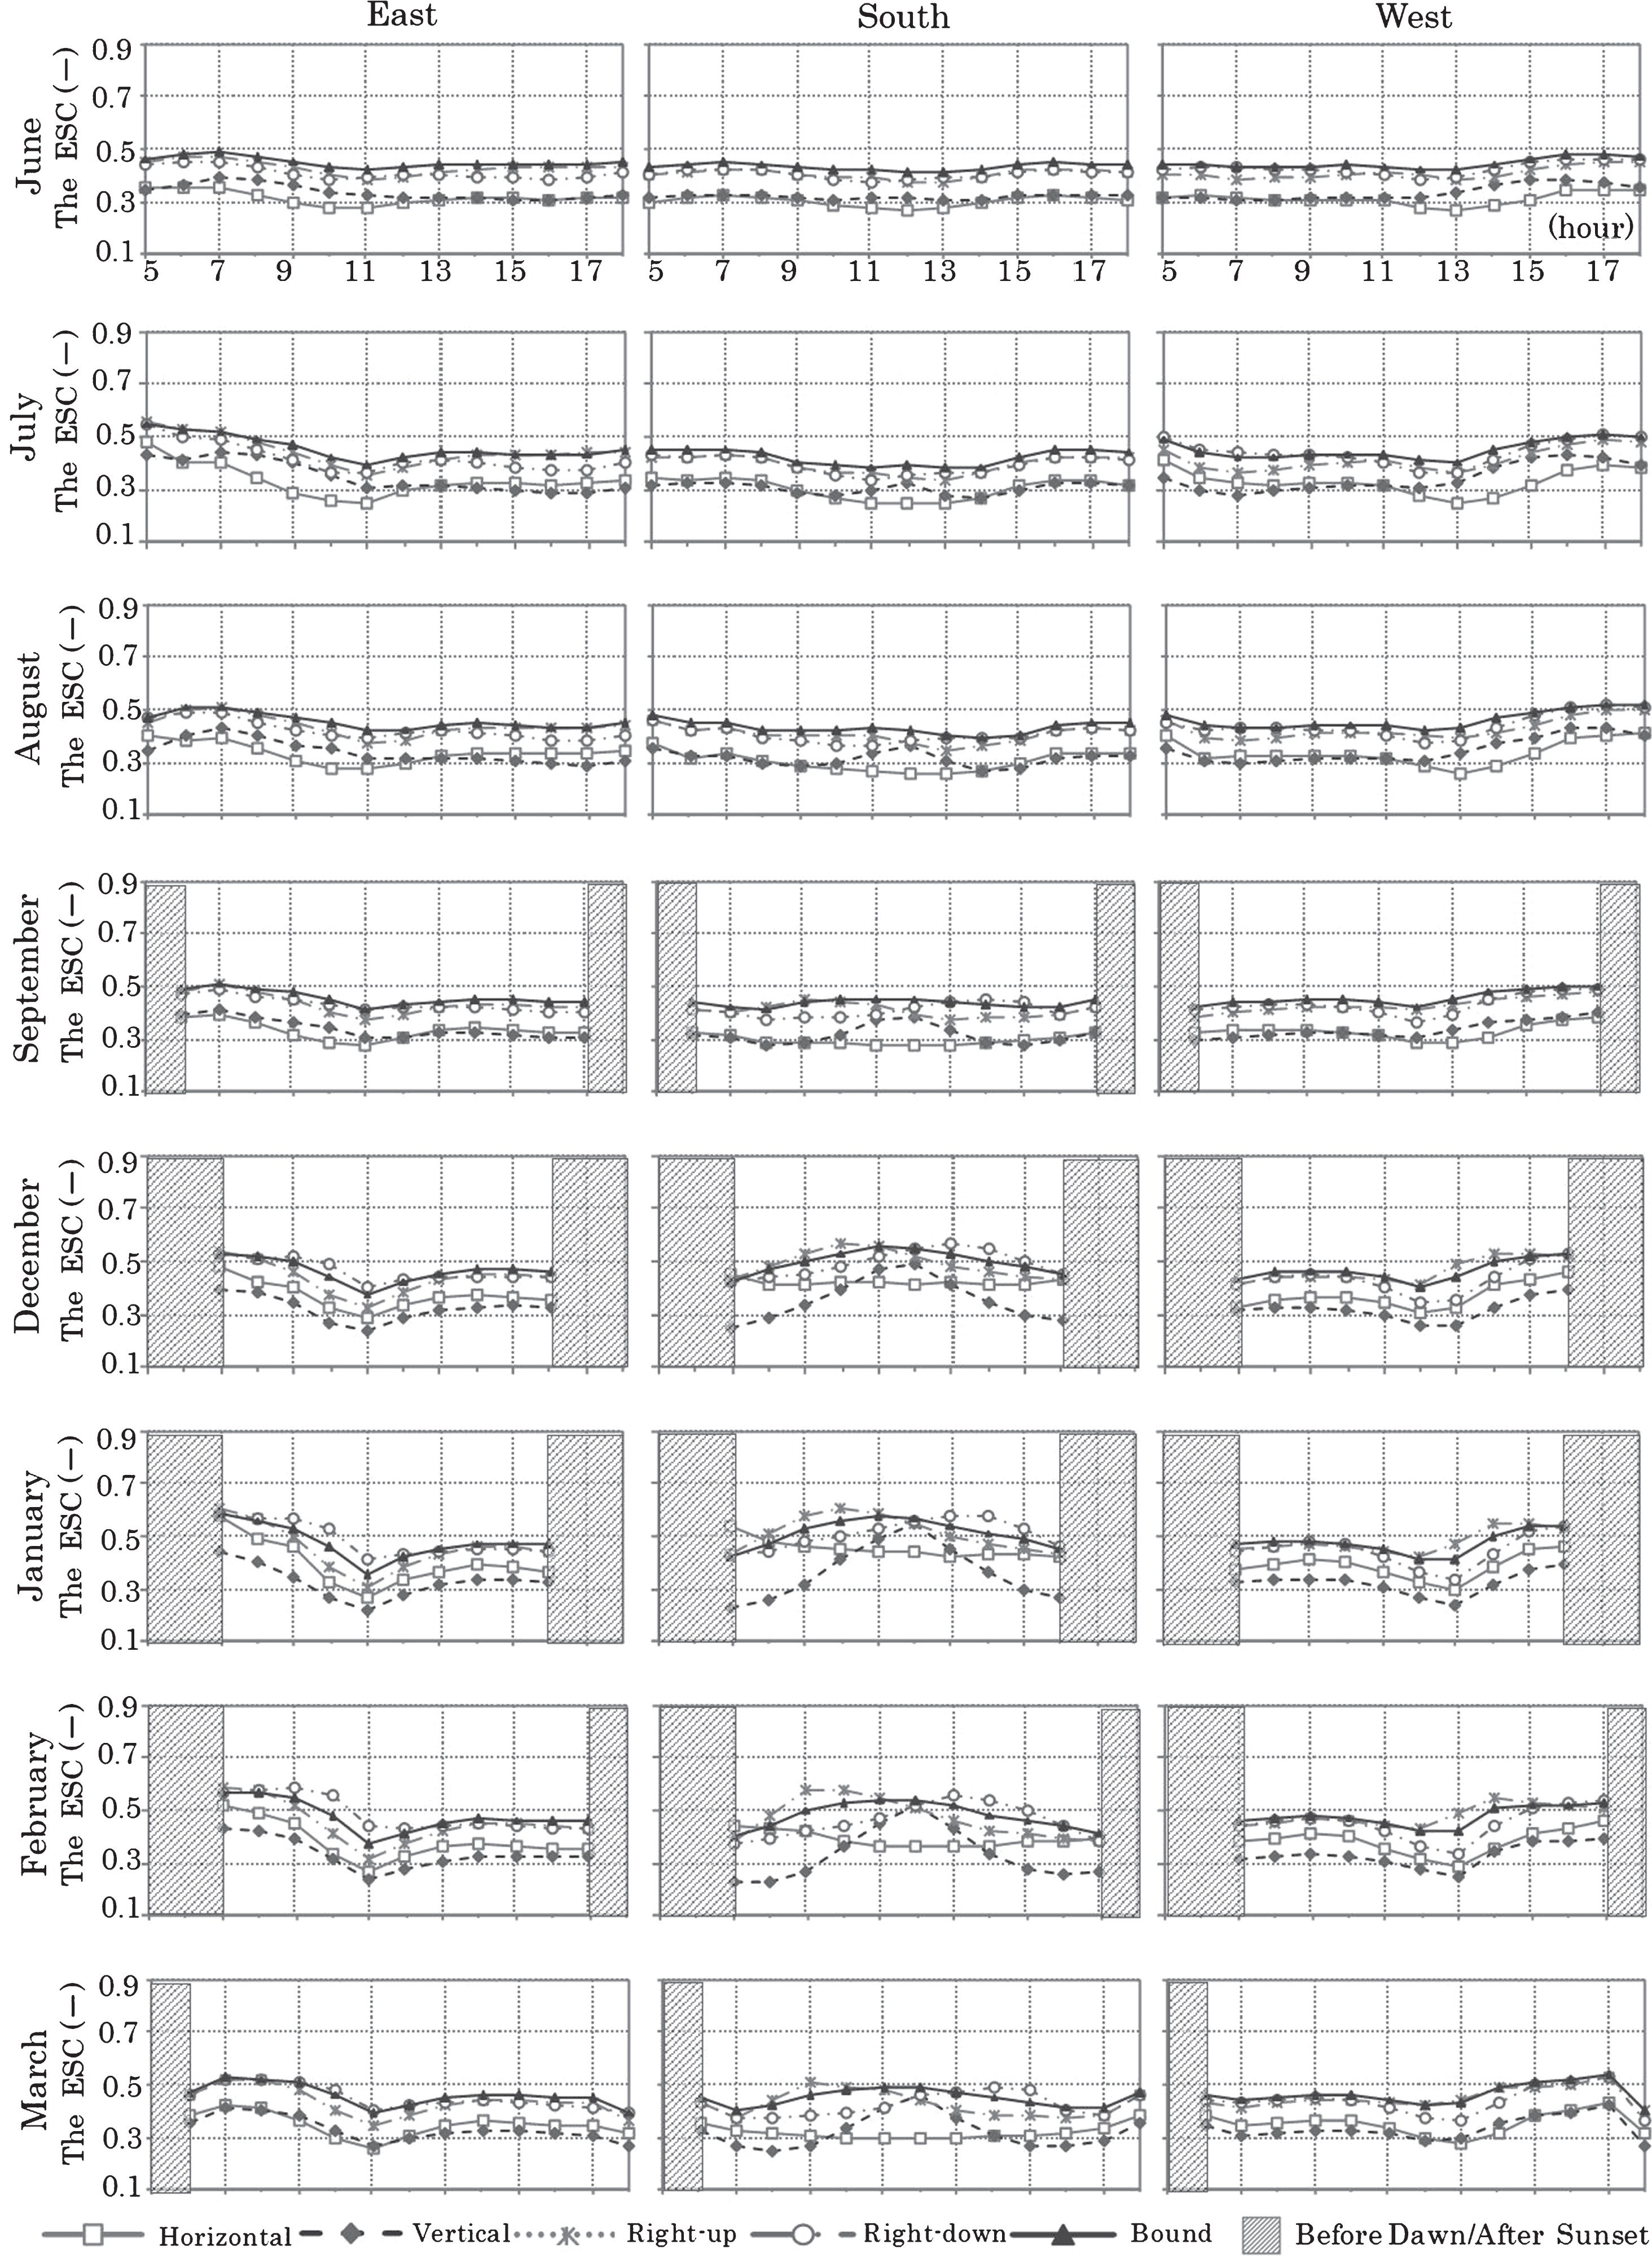
Fig.10
Cumulative amount of solar radiation.
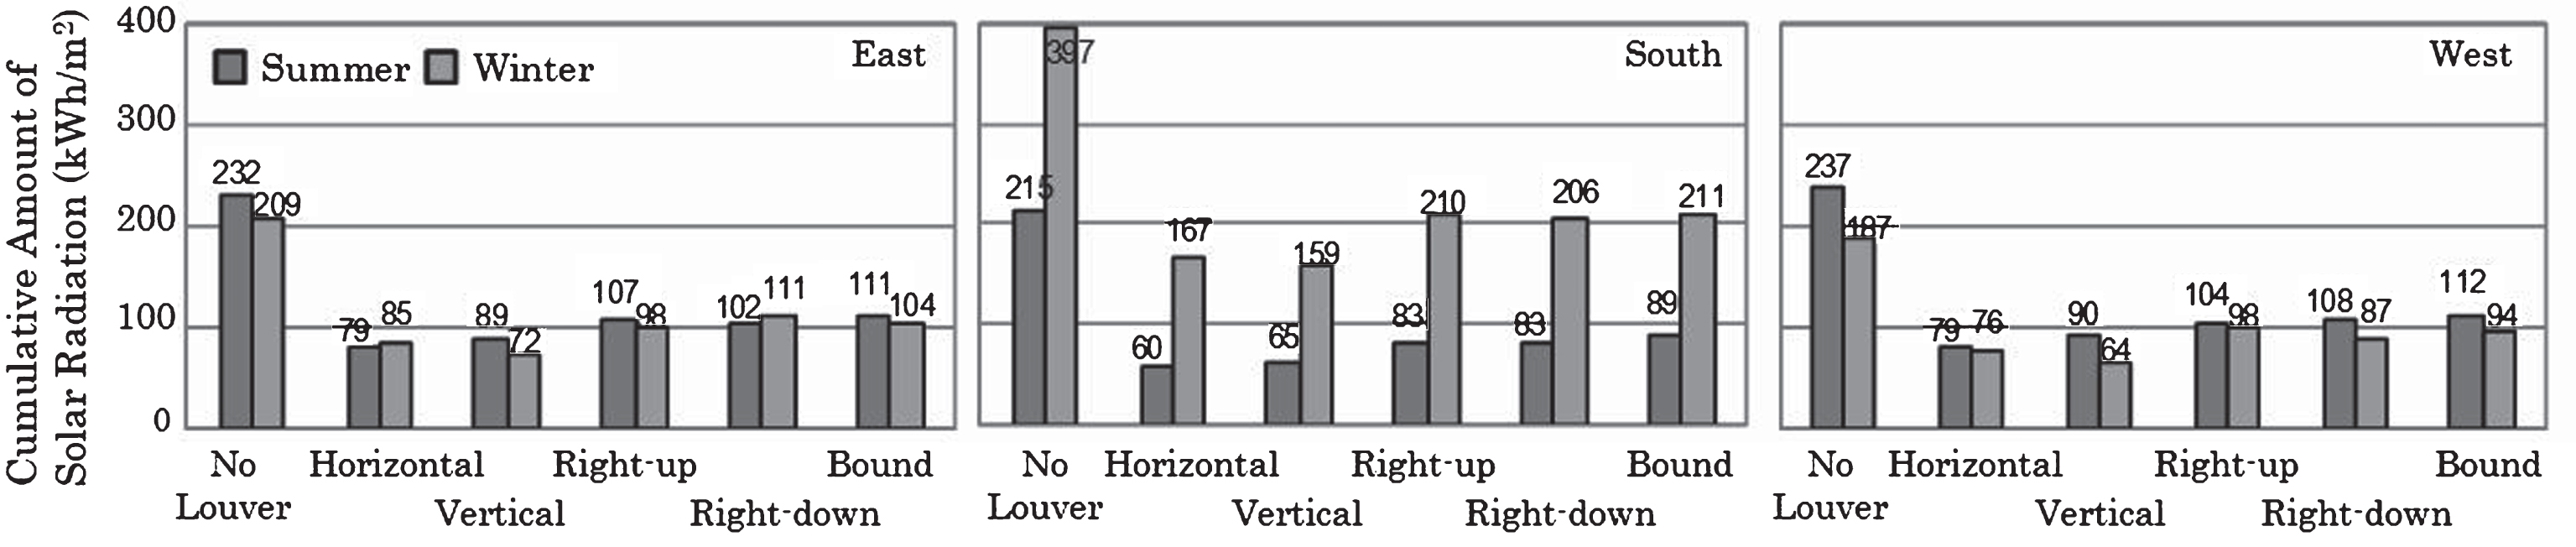
Fig.11
Standard floor plan of the model (unit mm).
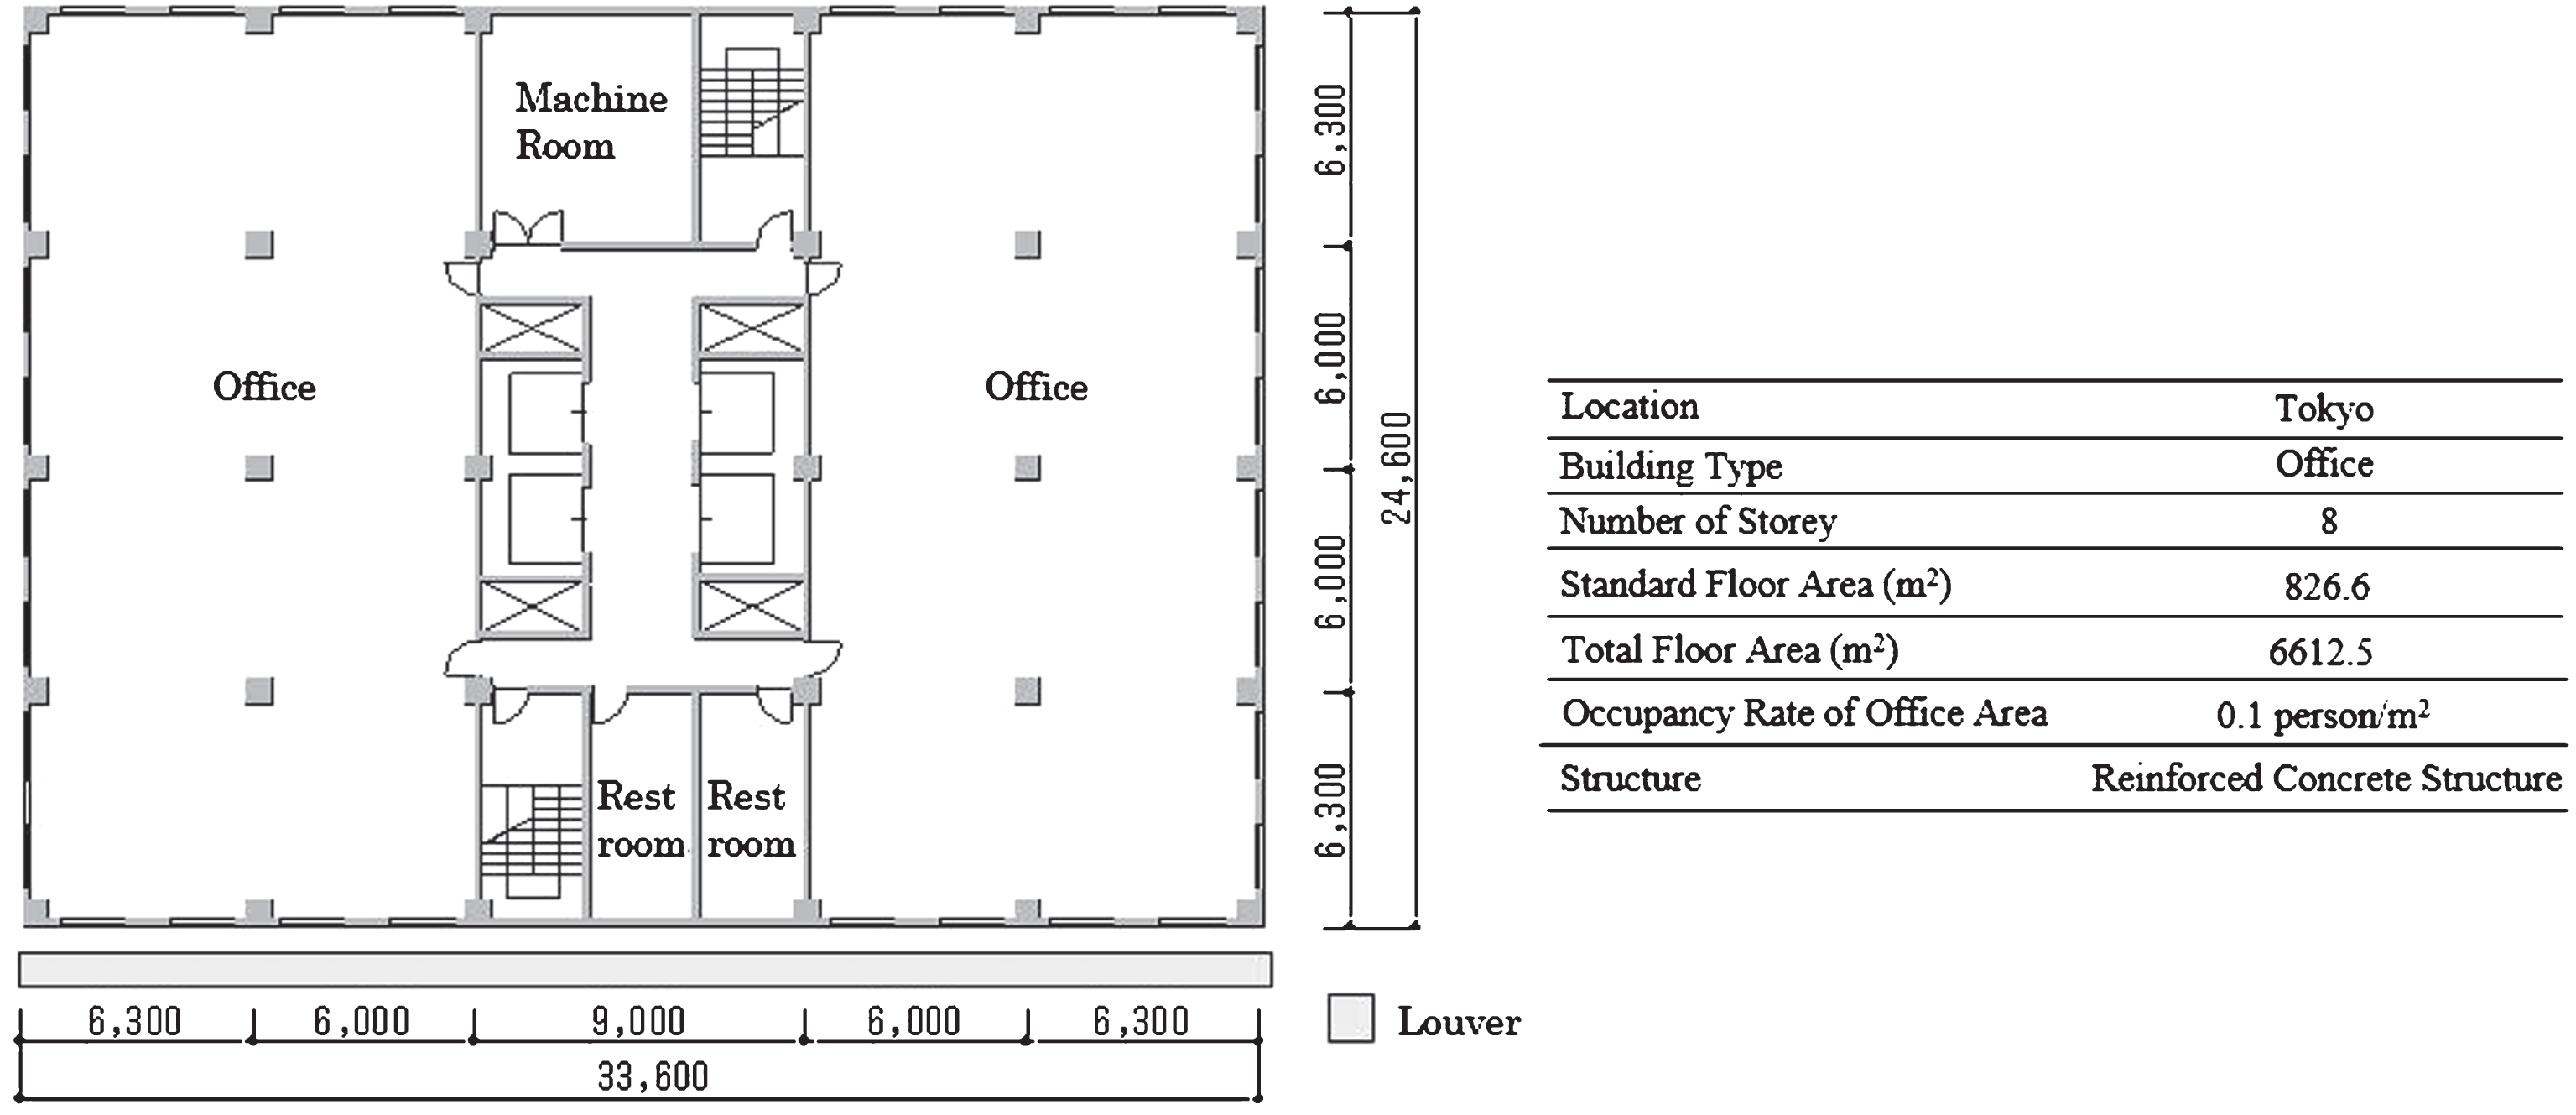
Fig.12
A. Annual thermal load (South), B. Annual electrical energy consumption (South).
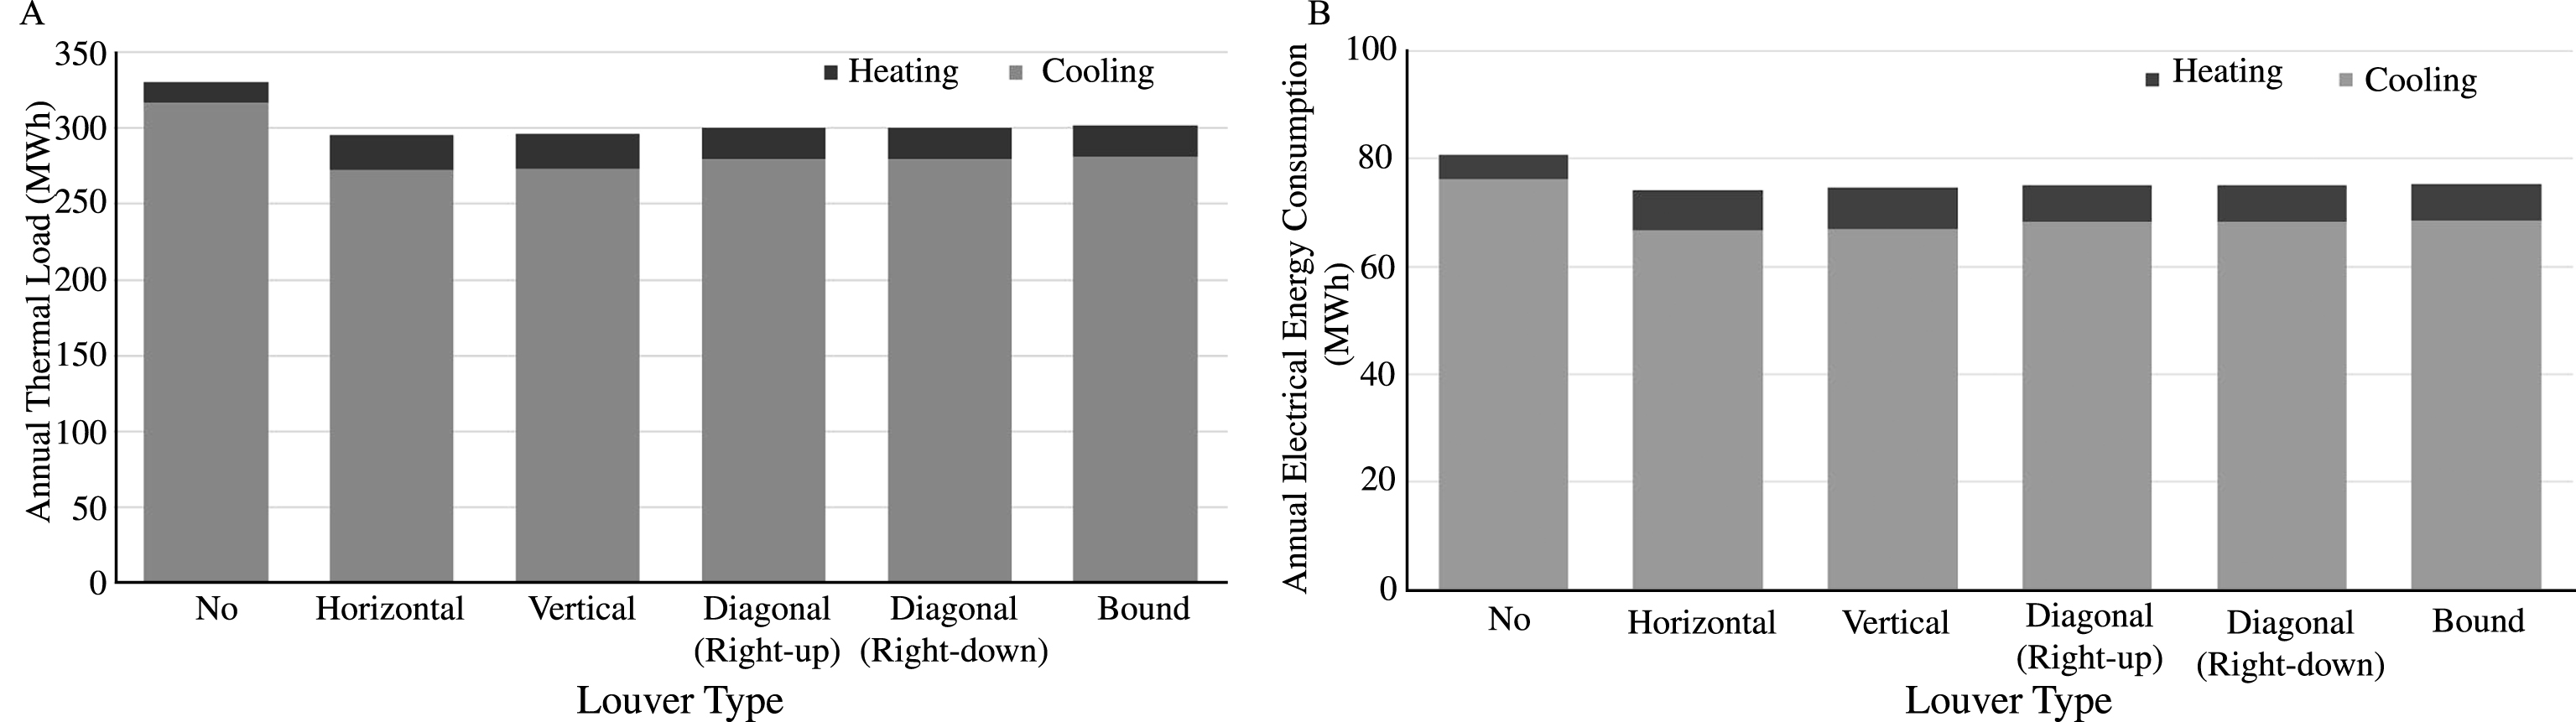
Table 1
Material composition of the model
| Part | Material Composition | U-value | |
| < Material (Thickness, mm) form Interior Side> | (W/m2K) | ||
| Office | |||
| Floor/Ceiling | Rock Wool Board (Acoustic absorbent, 12), Gypsum Board (9), Concrete (150), Tile (3) | 1.92 | |
| Roof | Rock Wool Board (Acoustic absorbent, 12), Gypsum Board (9), Form Polystyrene (25), Concrete (150), Asphalt (10), Lightweight Concrete (60) | 0.74 | |
| Exterior Wall | Gypsum Board (12), Form Polystyrene (25), Mortar (20), Concrete (150), Mortar (20), Tile (8) | 0.95 | |
| Interior Wall | Mortar (20), Concrete (120), Mortar (20) | 3.54 | |
| Window | Single Glass (3) | 5.72 | |
| Machine Room | |||
| Floor/Ceiling | Glass Wool (Acoustic absorbent, 25), Concrete (150) | 1.15 | |
| Roof | Glass Wool (Acoustic absorbent, 25), Form Polystyrene (25), Concrete (150), Asphalt (10), Lightweight Concrete (60) | 0.58 | |
| Exterior Wall | Glass Wool (Acoustic absorbent, 25), Mortar (20), Concrete (150), Mortar (20), Tile (8) | 1.11 | |
| Interior Wall | Glass Wool (Acoustic absorbent, 25), Mortar (20), Concrete (120), Mortar (20) | 1.14 | |
| Others | |||
| Door | Metal Door with Insulation Defined in TRNSYS | 1.67 | |
| Entrance | Single Glass (8) | 5.53 | |
| Exterior Wall of Stairs and Restrooms | Mortar (20), Concrete (150), Mortar (20), Tile (8) | 3.23 |
Table 2
Conditions of calculation of air-conditioning
| Heat Generation | Human (W/person) | 121 | Time schedule | Percentage of Heat Generation (%) | |||||
| Sensible | Latent | Human | Lighting | Equipment | |||||
| from January to March | 78 | 43 | 0–8 | 0 | 0 | 25 | |||
| April | 73 | 43 | 8–12 | 100 | 100 | 100 | |||
| from May to October | 69 | 53 | 12–13 | 60 | 50 | 80 | |||
| November | 73 | 48 | 13–18 | 100 | 100 | 100 | |||
| December | 78 | 43 | 18–19 | 50 | 100 | 100 | |||
| Lighting (W/m2) | 20 | 19–20 | 30 | 100 | 50 | ||||
| Equipment (W/m2) | 20 | 20–21 | 20 | 80 | 50 | ||||
| 21–24 | 0 | 0 | 25 | ||||||
| Air-conditioning Schedule | Weekdays | 7 a.m. to 9 p.m. | |||||||
| (Pre-Heating/Cooling 7 a.m. to 8 a.m.) | |||||||||
| Saturday and Sunday | off | ||||||||
| Temperature (deg. C) | |||||||||
| from January to March | 22 | ||||||||
| Air-conditioning Set Point | April | 24 | |||||||
| from May to October | 26 | ||||||||
| November | 24 | ||||||||
| December | 22 | ||||||||
| Indoor Relative Humidity (%) | 50 | ||||||||
Table 3
Specification of the selected air source heat pump
| Cooling | Electrical Energy | COP (-) | |
| Capacity (kW) | Consumption (kW) | ||
| Cooling | |||
| Rated Value | 5.0 | 1.59 | 3.14 |
| Minimum Value | 0.6 | 0.13 | 4.61 |
| Maximum Value | 5.2 | 1.66 | 3.13 |
| Heating | |||
| Rated Value | 6.3 | 2.04 | 3.08 |
| Minimum Value | 0.5 | 0.12 | 4.16 |
| Maximum Value | 8.6 | 3.23 | 2.66 |
Table 4
Thermal load and electrical energy consumption
| Louvers | No | Horizontal | Vertical | Diagonal | Diagonal | Bound |
| (Right-up) | (Right-down) | |||||
| East | ||||||
| Thermal Load (MWh/year) | 335.7 | 291.9 | 293.9 | 299.0 | 298.7 | 300.1 |
| Reduction Ratio of Thermal Load (%) | – | 13.04 | 12.44 | 10.93 | 11.03 | 10.61 |
| Electrical Energy Consumption (MWh/year) | 81.81 | 73.07 | 73.75 | 74.61 | 74.34 | 74.79 |
| Reduction Ratio of Electrical Energy Consumption (%) | – | 10.69 | 9.86 | 8.81 | 9.14 | 8.59 |
| Annual Performance Factor (APF) (-) | 4.10 | 4.00 | 3.99 | 4.01 | 4.02 | 4.01 |
| South | ||||||
| Thermal Load (MWh/year) | 330.2 | 295.2 | 296.5 | 300.3 | 300.5 | 301.5 |
| Reduction Ratio of Thermal Load (%) | – | 10.60 | 10.20 | 9.06 | 9.00 | 8.70 |
| Electrical Energy Consumption (MWh/year) | 80.67 | 74.14 | 74.53 | 74.97 | 75.10 | 75.28 |
| Reduction Ratio of Electrical Energy Consumption (%) | – | 8.09 | 7.61 | 7.06 | 6.91 | 6.68 |
| Annual Performance Factor (APF) (-) | 4.09 | 3.98 | 3.98 | 4.01 | 4.00 | 4.01 |
| West | ||||||
| Thermal Load (MWh/year) | 333.5 | 311.2 | 312.0 | 314.9 | 314.8 | 315.6 |
| Reduction Ratio of Thermal Load (%) | – | 6.68 | 6.45 | 5.56 | 5.59 | 5.35 |
| Electrical Energy Consumption (MWh/year) | 81.54 | 76.70 | 76.95 | 77.49 | 77.52 | 77.68 |
| Reduction Ratio of Electrical Energy Consumption (%) | – | 5.94 | 5.63 | 4.97 | 4.93 | 4.73 |
| Annual Performance Factor (APF) (-) | 4.09 | 4.06 | 4.05 | 4.06 | 4.06 | 4.06 |

