
Changes in fresh-market and sensory attributes of blackberry genotypes after postharvest storage
Abstract
BACKGROUND:
Since the consumption of fresh blackberries has increased, the demand for new cultivars with extended postharvest quality that meet consumer expectations has increased.
OBJECTIVE:
The objective of this study was to identify fresh-market blackberry genotypes with high postharvest potential and evaluate changes in physiochemical and sensory attributes.
METHODS:
Fruit quality, chemical composition and descriptive sensory attributes of five blackberry cultivars (Natchez, Osage, Ouachita, Prime-Ark® 45 and Prime-Ark® Traveler) and six advanced breeding selections from the University of Arkansas Fruit Breeding Program were evaluated at harvest and after 7 days of storage (2°C and 90% RH). Fruit quality (firmness, red drupelets, weight loss and unmarketability) and chemical composition (basic composition and phytochemicals) were evaluated, and a trained descriptive sensory panel (n = 8-9) evaluated blackberry attributes for appearance, basic tastes, feeling factors, aromatics and texture.
RESULTS:
The blackberries had soluble solids of 6.6–10.9% and titratable acidity of 0.5–1.5% at harvest. ‘Natchez’ had the lowest percent of unmarketable fruit (2.9%) and A-2418 had the highest (53.6%) after 7 days of postharvest storage. After 7 days of storage, ‘Natchez’ and A-2453 had low incidence of red drupelets and high uniformity of color and ‘Natchez’ and A-2491 were associated with the sensory attributes of sweetness and overall aromatic impact. The sensory panelists could not perceive differences in color, uniformity of color, glossiness, firmness or sweetness after storage, but perceived blackberries as more astringent and less sour and bitter after storage. These sensory findings correspond with the fruit quality and chemical composition data that indicated no changes for incidence of red drupelets, firmness or soluble solids of blackberries after storage. However, blackberries had increased total phenolics, flavonols, anthocyanins and ellagitannins, and decreased titratable acidity after storage. After storage, total phenolics and total ellagitannins of blackberries were positively correlated to bitter and sour basic tastes.
CONCLUSION:
Fruit quality and chemical composition analyses correlated to sensory attributes and may assist blackberry breeders in developing cultivars with extended postharvest storage and superior fruit attributes. ‘Natchez’, A-2453 and A-2491 showed positive fruit attributes in this study and have potential for the development of future cultivars or used as parents for crosses in blackberry breeding programs.
1Introduction
Consumers purchase fresh blackberries (Rubus subgenus Rubus Watson) for their unique fruit characteristics and potential health benefits [1, 2]. Intensely-colored fruit, like blackberries, contain high levels of phytochemicals known for their potential biological benefits [2–4]. In addition to nutraceutical properties, phytochemicals in fruits are highly related to flavor perception, since they may affect the taste of food, giving sweet, bitter or astringent flavors [5]. Consumers tend to select foods with a low content of lignin (toughness) and/or tannin (astringency), and higher anthocyanin content (appearance and/or ripeness indicator) [6].
To meet the demands of consumers, the University of Arkansas blackberry breeding program has released cultivars with unique traits incorporated into genotypes (cultivars and advanced, non-released selections). Breeding traits of interest in fresh-market blackberries include enhanced fruit quality, flavors, shipping capabilities, plant thornlessness, productivity, adaptation/habit and disease/pest resistance [9–12]. Some key blackberry attributes include sweetness, acidity, bitterness, color, firmness and symmetry of shape along with postharvest potential. Heavy emphasis in breeding efforts is placed on firmness of fresh-market blackberries because of enhanced potential for shipping and postharvest storage [9]. Blackberries with a unique firmness or crispiness were first observed in the University of Arkansas blackberry breeding program and have high postharvest storage potential due to low incidence of red drupelets and retention of firmness. These crispy genotypes maintain cell wall and cell–cell adhesion during ripening and storage that results in better performance when compared to non-crispy genotypes [13].
Physiochemical and sensory analyses can be used to establish the acceptability of fresh blackberries by identifying the desired attributes and overall quality. In 2014, Threlfall et al. [7] established a descriptive sensory lexicon for fresh-market blackberries grown in the Southeastern United States and compared descriptive and consumer-derived sensory attributes to physiochemical analysis. In other sensory research, the authors reported that the amount of volatile compounds corresponded with the intensity of descriptive aroma attributes, meaning the analytical analyses could be used to predict sensory attributes [8]. There has been limited research on sensory of fresh-market blackberries and the impact on postharvest storage.
Fresh-market blackberries harvested when firm and shiny-black can be held in postharvest cold storage for a week or more, but storability depends greatly on genotype [14, 15]. Blackberries are one of the most perishable types of fruit because of their thin and fragile skin and high respiration and transpiration rates. Hence, rapid changes in blackberry physiochemical and sensory properties, along with decay can occur during postharvest storage [16]. Temperature management, including rapid cooling after harvest and maintenance of low temperatures, is the single-most important factor in minimizing blackberry deterioration and maximizing quality and postharvest storage [17]. For blackberry storage, temperatures from 0°C to 5°C and modified atmosphere (5–10% O2/15–20% CO2) are recommended during shipping [18, 19].
During postharvest storage of fruits, many changes occur in secondary metabolism, and these changes can affect blackberry quality and flavor. In this manuscript, the changes in fresh-market blackberry quality and chemical composition during storage were evaluated and correlated to descriptive sensory attributes. Our primary objective was to identify fresh-market blackberries with high postharvest potential.
2Material and methods
2.1Chemicals
The chemicals used in this study were purchased from commercial sources. Sodium hydroxide (0.1 N) for titratable acidity analysis was purchased from VWR (West Chester, PA). The solvents and standards used for analysis included HPLC-grade methanol, acetone, formic acid and acetic acid purchased from EMD Millipore (Darmstatd, Germany). For the quantification of ellagitannins and flavonols, ellagic acid and rutin standards were purchased from Sigma Aldrich (St. Louis, MO). For the quantification of anthocyanins peaks, a cyanidin 3-glucoside standard was purchased from Polyphenols-AS (Sandnes, Norway). Gallic acid from Sigma Aldrich (St. Louis, MO) was used to quantify total phenolics.
2.2Blackberries
In 2015, blackberries were harvested at the shiny-black stage of maturity at the University of Arkansas Fruit Research Station, Clarksville, AR. Blackberries were harvested directly into 240-g, low-profile, vented clamshells, placed in chilled coolers and transported to the Department of Food Science, Fayetteville, AR. Approximately 4 kg of blackberries were harvested from each of the 11 genotypes, five cultivars (Natchez, Osage, Ouachita, Prime-Ark® 45 and Prime-Ark® Traveler) and six selections (A-2418, A-2434, A-2450, A-2453, A-2491 and APF-268). Six genotypes were harvested one week and the remaining five genotypes were harvested the next week.
Upon arrival at the Department of Food Science, the blackberries were randomized and separated in triplicates (three clamshells by genotype and storage) and evaluated at harvest (day 0) and after storage (day 7). Harvest (day 0) is defined in this study as the day after actual harvest, since the blackberries were harvested and transported then stored overnight at 2.0°C ± 1.0°C and 90.0% ± 1.0% RH. Postharvest evaluations and sensory analysis were performed at harvest and 7 days after storage (2.0°C ± 1.0°C and 90.0% ± 1.0% RH). For chemical composition analysis, 150 g of blackberries were placed in plastic freezer bags in triplicate and frozen in a commercial freezer (–20°C ± 2°C) at harvest and after 7 days of storage. The clamshells for this study were filled with blackberries that were commercially marketable (whole, intact berries without damage or flaws) to simulate commercial fresh-market standards.
2.3Fruit quality
The fruit quality attributes of the blackberries were evaluated in triplicate clamshells per genotype at harvest (day 0) and after storage (day 7). The clamshells were filled with blackberries to commercial capacity (30–48 berries per genotype). The fruit quality attributes were evaluated on the fresh blackberries and included berry firmness, incidence of red drupelets, weight loss and unmarketable fruit.
2.3.1Firmness
Firmness of blackberries was measured by compression using a TA.XTPlus Texture Analyzer (Texture Technologies Corporation, Hamilton, MA) with a 5 kg load cell. Compression measurements were done by placing an individual blackberry horizontally on a flat surface, and a 7.6 cm diameter cylindrical and plane probe compressed each blackberry 5 mm. From each genotype, five blackberries were evaluated randomly from each clamshell in triplicate. The results of firmness by compression were expressed in Newtons (N).
2.3.2Red drupelets
Red drupelets incidence (%) of individual blackberries was calculated by counting the total number of drupelets and the number of red drupelets per berry. Blackberries were evaluated at harvest and after storage using five randomly selected berries from each clamshell/replication.
2.3.3Weight loss
Weight loss (%) was calculated as percent weight decrease of the total blackberries in the clamshell in triplicate for each genotype after storage.
2.3.4Unmarketable fruit
The clamshells were filled with commercially marketable blackberries (100% marketable). After storage, unmarketable fruit (%) was measured by removing all blackberries from each clamshell in triplicate and counting the number with defects for each genotype. The defects were either individual or combinations of decay (berries with mold visible) and leakage (berries with juice visible). The percent (%) unmarketable fruit was calculated as (unmarketable fruit/total fruit)*100.
2.4Chemical composition
The chemical composition of the blackberries was evaluated in triplicate per genotype at harvest (day 0) and after storage (day 7). Chemical composition included analysis of basic blackberry composition and phytochemical compounds.
2.4.1Basic composition
The basic composition included titratable acidity, pH and soluble solids of juice extracted from the blackberries. Blackberries were removed from the freezer and thawed. Three-berry samples of each genotype and replication were strained through cheesecloth to extract the juice. Analyses were performed using juice at room temperature (24°C). Titratable acidity and pH of the juice were measured by an 877 Titrino Plus (Metrohm AG, Herisau, Switzerland) pH meter standardized with pH 2.0, 4.0, 7.0 and 10.0 buffers. Titratable acidity was determined using 6 g of juice diluted with 50 mL of deionized, degassed water by titration with 0.1 N sodium hydroxide to an endpoint of pH 8.2; results were expressed as percent citric acid. Total soluble solids (expressed as percent) of the juice was measured with a Bausch & Lomb Abbe Mark II refractometer with automatic temperature compensation (Scientific Instrument, Keene, NH). The soluble solids/titratable acidity (SS/TA) ratio of the blackberries was calculated.
2.4.2Phytochemical compounds
2.4.2.1Extraction To determine the phytochemical compounds, three blackberries (25–30 g of blackberries per replication and genotype) were homogenized with 20 mL of methanol/water/formic acid (60 : 37 : 3 v/v/v) by a Euro Turrax T18 Tissuemizer (Tekmar-Dohrman Corp., Mason, OH) and then centrifuged for 5 min at 10,000 rpm. After filtering the samples through Miracloth (Calbiochem, La Jolla, CA), the filter cakes were isolated, and the extraction was repeated. This extraction process was repeated with acetone/water/acetic acid (70 : 29.5 : 0.5 v/v/v) to assure complete extraction of the phytochemical compounds. The sample extracts were adjusted to a final volume of 200 mL using a mix of the previous extraction solvents (50 : 50 v/v) and stored at – 80°C until analysis. The analyses were done in triplicate for each genotype.
2.4.2.2Ellagitannins and flavonols Sample extracts (3 mL) were dried using a Speed Vac concentrator (ThermoSavant, Holbrook, NY) and re-suspended in 1.0 mL of 50% methanol. The reconstituted samples were passed through 0.45μm PTFE syringe filters (Varian, Inc., Palo Alto, CA) prior to HPLC analysis. The ellagitannins and flavonols were analyzed according to previous methods [20, 21]. The ellagitannin peaks were quantified at 255 nm with results expressed as milligram of ellagic acid equivalents (EAE) per 100 g of fresh berry weight. The flavonols were quantified at 360 nm with results expressed as milligram of rutin equivalents (RE) per 100 g of fresh berry weight.
2.4.2.3Anthocyanins Sample extracts (3 mL) were dried using a Speed Vac concentrator (ThermoSavant, Holbrook, NY) and re-suspended in 1 mL of 3% formic acid. The reconstituted samples were passed through 0.45μm PTFE syringe filters (Varian, Inc., Palo Alto, CA) prior to HPLC analysis. The anthocyanin analysis by HPLC was performed based on previous methods [22, 23]. All anthocyanins (cyanidin 3-glucoside, cyanidin 3-rutinoside, cyanidin 3-xyloside, cyanidin 3-malonylglucoside and cyanidin 3-dioxalylglucoside) were quantified as cyanidin 3-glucoside equivalents (C3GE) with total monomeric anthocyanins results expressed as milligrams C3GE equivalents per 100 g fresh berry weight.
2.4.2.4Total phenolics Total phenolics were determined using the Folin-Ciocalteu assay [24] with a gallic acid standard and a consistent standard curve based on serial dilutions. Absorbencies were measured at 760 nm, and results were expressed as milligrams of gallic acid equivalents (GAE) per 100 g of fresh berry weight.
2.5Sensory analysis
Descriptive sensory analyses of fresh blackberries were performed at the Sensory and Consumer Research Center at the University of Arkansas, Fayetteville, following the methodology established by Threlfall et al. 2016 [7]. The eleven genotypes were harvested with six genotypes harvested in the first week and five genotypes harvested the following week. The sensory panel had long breaks between replications to avoid panel fatigue. Descriptive sensory analyses were performed by panelists at harvest (day 0) and after storage (7 days). Six genotypes were evaluated on 17th of June (day 0) and then on the 22nd of June (day 7), then the other five genotypes were evaluated on 22nd of June (day 0) and 29th of June (day 7). Each panelist evaluated four berries of each genotype in duplicate. The blackberry samples were served monadically at room temperature (24°C) with random three-digit codes in a randomized complete block design. Sample serving order was randomized across replication to prevent presentation order bias. Panelists cleansed their palates with unsalted crackers and water between samples. The panelists used a modified Sensory Spectrum® method, an objective method for describing the intensity of attributes in products using standards for the attributes. The descriptive panelists (n = 8-9) used a lexicon of sensory terms for fresh-market blackberries (Table 1) [7] and assessed each attribute per genotype and replication at a particular intensity according to the reference and using the universal aromatic scale. The descriptive panel identified and evaluated fresh blackberry attributes for appearance (color, uniformity of color and glossiness), basic tastes (sweet, sour and bitter), feeling factors (astringent and metallic), overall aromatic impact, and texture (hardness and popping), using a 15-point scale (0 = less of the attribute and 15 = more of the attribute in terms of intensity). The color of blackberries was scored based on the Royal Horticulture Society Chart (5th edition, London) Black Group 203 A = 15.0 score for intensity [7].
Table 1
Lexicon for fresh-market blackberry attributes evaluated by the descriptive sensory panel
| Term | Definition | Technique | Reference |
| Appearance | |||
| Color | The degree of BLACK in the sample | Observe the sample and rate the degree to which the sample is black in appearance. (Red to black) | Black Group |
| 203 A = 15.0 | |||
| Royal Horticultural Society Color Chart | |||
| Uniformity of color | The amount of red drupelets versus black drupelets in the sample | Observe the sample and rate the degree to which the sample is uniform in appearance. | Ratio of red to black drupelets |
| (Un-uniform to uniform) | 0% = 0, 50% = 7.5, 100% = 15 | ||
| Glossiness | The degree to which the surface of the berry shines | Observe the sample and determine the degree to which the surface shines. (Dull to wet/shiny) | Photo Paper = 15.0 |
| Raspberry = 3.0 | |||
| Texture | |||
| Hardness | The force required to compress the sample. | Compress or bite through sample one time with molars or incisors. | Cream Cheese = 1.0 |
| (Soft to hard) | Egg White = 2.5 | ||
| American Cheese = 4.5 | |||
| Beef Frank = 5.5 | |||
| Olive = 7.0 | |||
| Peanut = 9.5 | |||
| Almond = 11.0 | |||
| Popping/bursting | The degree the drupelets pop/burst while chewing. | Chew the sample and evaluate the degree the drupelets pop/burst while chewing. (None to much) | Pomegranate seeds = 12.0 |
| Basic tastes | |||
| Sweet | The basic taste, perceived on the tongue, stimulated by sugars and high potency sweeteners | Solutions of sucrose in spring water | 2% = 2.0 |
| 5% = 5.0 | |||
| 10% = 10.0 | |||
| 16% = 15.0 | |||
| Sourness | The basic taste, perceived on the tongue, stimulated by acids, such as citric acid | Solutions of citric acid in spring water | 0.05% = 2.0 |
| 0.08% = 5.0 | |||
| 0.15% = 10.0 | |||
| 0.20% = 15.0 | |||
| Bitterness | The basic taste, perceived on the tongue, stimulated by substances such as quinine, caffeine, and certain other alkaloids | Solutions of caffeine in spring water | 0.05% = 2.0 |
| 0.08% = 5.0 | |||
| 0.15% = 10.0 | |||
| 0.20% = 15.0 | |||
| Feeling factors | |||
| Astringent | The feeling factor on the tongue or other skin surfaces of the mouth described as puckering or drying | Chew sample to point of swallow, expectorate and feel surfaces of the mouth. Swish references in mouth, swallow or expectorate and wait 5 seconds. | 0.53 alum/500 mL water = 6.0 |
| Metallic | Aromatic associated with metals, tinny or iron or a flat chemical feeling factor stimulated on the tongue by metal coins | Tin foil to bite | Intensities based on Universal Scale |
| Saltine = 3.0 | |||
| Applesauce = 7. 0 | |||
| Orange Juice = 10.0 | |||
| Grape Juice = 14.0 | |||
| Big Red Gum = 15.0 | |||
| Aromatics | |||
| Overall aromatic impact | The overall impact of all aromatics in the berry. | Combination of all aromatics | Intensities based on Universal Scale: |
Adapted from Threlfall et al. 2016.
2.6Statistical design and analysis
After harvest, the fruit from each of the 11 genotypes was completely randomized. Three replications were used to evaluate fruit quality and chemical composition analyses, and two replications were used for the descriptive sensory analyses.
Statistical analyses were conducted using JMP® (version 12.0; SAS Institute, Cary, NC). A univariate analysis of variance (ANOVA) was used to determine the significance of main factors (genotype and storage) and interaction (genotype*storage). For the analysis of sensory data, panelists were treated as random effect, while genotypes and storage were treated as fixed effects. Tukey’s test Honestly Significant Difference (HSD) and Slice test were used to detect significant differences (p < 0.05) among means and verify interactions at 95% significance level, respectively. Pairwise correlations and Principal Component Analysis were used to verify the relationship between/within fruit quality, chemical composition and sensory attributes.
3Results and discussion
The data showed there were significant interactions among the 11 blackberry genotypes and postharvest storage (day 0 versus day 7) for many of the fruit quality, chemical composition and sensory attributes (Tables 2 and Tables 3). In general, the significant interactions were strongly influenced by the genotypes, rather than postharvest storage.
Table 2
Main and interactive effects of storage and genotypes on fruit quality and chemical composition of fresh-market blackberry genotypes at harvest (day 0) and after storage at 2°C for 7 days, Clarksville, AR, 2015
| Firmness | Red | Soluble | pH | Titratable | SS/TA | Total | Total | Total | Total | |
| (Newtons) | drupelets (%) | solids (%) | acidity (%) | ratio | anthocyanins | flavonols | ellagitannins | phenolics | ||
| (mg/100 g) | (mg/100 g) | (mg/100 g) | (mg/100 g) | |||||||
| Storage (S) | ||||||||||
| Day 0 | 6.7a | 2.5a | 8.5a | 3.3a | 1.0a | 9.5b | 206.0b | 7.7b | 27.1b | 382.2b |
| Day 7 | 6.5a | 2.2a | 8.6a | 3.4b | 0.9b | 10.8a | 225.0a | 11.8a | 30.7a | 447.0a |
| (S) main effect (P value) | 0.2619 | 0.6364 | 0.6491 | 0.0010* | 0.0031* | 0.1385 | 0.0462* | <0.0001* | 0.0093* | 0.0002* |
| Genotype (G) | ||||||||||
| A-2418 | 7.4bc | 1.3ab | 6.9d | 3.2b | 1.3a | 5.8c | 202.4abc | 7.8bc | 33.1ab | 398.5abc |
| A-2434 | 6.2cd | 1.8ab | 10.4a | 3.2b | 1.2ab | 9.0bc | 176.9cd | 7.9bc | 32.6ab | 424.9abc |
| A-2450 | 8.8a | 1.7ab | 7.2cd | 3.3b | 1.1abc | 6.8c | 271.8a | 13.8ab | 29.2bc | 502.8a |
| A-2453 | 9.6a | 0.7b | 8.9abc | 3.8a | 0.6d | 16.6a | 254.1ab | 8.5abc | 18.2d | 423.2abc |
| A-2491 | 5.3d | 1.3ab | 10.6a | 3.4b | 0.8cd | 14.5ab | 226.9abc | 7.7bc | 21.8cd | 362.1bc |
| APF-268 | 7.4bc | 3.4ab | 7.2cd | 3.1b | 1.1abc | 6.4c | 192.1bcd | 10.8abc | 36.1ab | 366.8bc |
| Natchez | 5.2d | 1.0ab | 9.1ab | 3.4b | 0.9abcd | 10.4abc | 244.9abc | 10.6abc | 42.8a | 497.4a |
| Osage | 5.2d | 1.7ab | 8.4bcd | 3.4b | 0.9abcd | 11.3abc | 265.6ab | 10.2abc | 19.7cd | 420.4abc |
| Ouachita | 5.1d | 6.1a | 9.2ab | 3.4b | 1.0abcd | 11.4abc | 197.3bcd | 6.3c | 20.0cd | 356.5bc |
| Prime-Ark® 45 | 5.9cd | 1.6ab | 8.0bcd | 3.4b | 0.9abcd | 9.3bc | 213.1abc | 14.8a | 37.1ab | 471.7ab |
| Prime-Ark® Traveler | 6.6cd | 4.9ab | 8.5bcd | 3.4b | 0.9bcd | 10.6abc | 124.4d | 8.8abc | 27.5bcd | 336.3c |
| (G) main effect (P value) | <0.0001* | 0.0191* | <0.0001* | <0.0001* | <0.0001* | <0.0001* | <0.0001* | 0.0007* | <0.0001* | <0.0001* |
| (G) x (S) interactive effects | ||||||||||
| (P value) | 0.0344* | 0.9225 | 0.0881 | 0.5249 | 0.0287* | 0.0157* | 0.8164 | 0.5066 | 0.2411 | 0.6420 |
Genotypes were evaluated in triplicate (n = 3). *Significant for the F-test. Means with different letter(s) for each attribute within main effects are significantly different (p < 0.05) using Tukey’s HSD test. Titratable acidity expressed as % citric acid. SS/TA ratio is soluble solids/titratable acidity ratio. Fresh weight of blackberries for total anthocyanins (mg cyanidin 3-glucoside/100 g); total flavonols (mg rutin equivalents/100 g); ellagitannins (mg ellagic acid equivalents/100 g); total phenolics (mg gallic acid equivalents/100 g).
Table 3
Main and interactive effects of storage and genotypes on descriptive sensory attributes of fresh-market blackberry genotypes at harvest (day 0) and after storage at 2°C for 7 days, Clarksville, AR, 2015
| Color | Uniformity of | Glossiness | Hardness | Popping | Sweet | Sour | Bitter | Astringent | Metallic | Overall aromatic | |
| color | feeling | feeling | impact | ||||||||
| Storage | |||||||||||
| Day 0 | 13.6a | 13.5a | 10.8a | 3.8a | 7.5a | 4.3a | 4.7a | 2.2a | 6.0b | 1.3b | 7.9a |
| Day 7 | 13.7a | 13.4a | 11.1a | 3.8a | 6.8b | 4.1a | 4.4b | 2.0b | 6.3a | 1.7a | 7.6b |
| (S) main effect (P value) | 0.3509 | 0.4221 | 0.2182 | 0.2214 | 0.0009* | 0.0800 | 0.0200* | 0.0250* | 0.0060* | <0.0001* | 0.0005* |
| Genotype | |||||||||||
| A-2418 | 13.7a | 13.46a | 11.1ab | 4.1ab | 7.5a | 3.6d | 5.4a | 1.9a | 6.3a | 1.7a | 7.4def |
| A-2434 | 13.7a | 13.46a | 11.0ab | 3.9bc | 7.3a | 4.7ab | 4.6abc | 2.2a | 6.2ab | 1.6a | 8.2abc |
| A-2450 | 13.6a | 13.52a | 10.6abc | 3.8bc | 7.1a | 3.9bcd | 5.1ab | 2.4a | 6.4a | 1.5a | 7.8abcde |
| A-2453 | 13.8a | 13.31a | 11.8a | 4.4a | 7.7a | 4.0bcd | 3.9c | 2.1a | 5.7b | 1.4a | 7.0f |
| A-2491 | 13.5a | 13.55a | 11.1ab | 3.6c | 7.1a | 5.0a | 3.9c | 2.0a | 5.9ab | 1.3a | 8.3a |
| APF-268 | 13.7a | 13.37a | 10.9ab | 3.8bc | 7.2a | 3.9bcd | 4.8abc | 2.0a | 6.3ab | 1.6a | 7.5def |
| Natchez | 13.7a | 13.73a | 11.4ab | 3.6c | 7.2a | 4.4abc | 4.5abc | 2.1a | 6.1ab | 1.4a | 8.3ab |
| Osage | 13.6a | 13.41a | 11.3ab | 3.7bc | 7.0a | 4.1bcd | 4.2bc | 2.1a | 6.2ab | 1.5a | 7.4ef |
| Ouachita | 13.6a | 13.12a | 11.6a | 3.6c | 7.0a | 4.3abcd | 4.1bc | 2.0a | 6.1ab | 1.6a | 7.6cdef |
| Prime-Ark® 45 | 13.2a | 13.11a | 9.4c | 3.8bc | 7.2a | 3.8cd | 5.0ab | 2.3a | 6.2ab | 1.3a | 7.7bcde |
| Prime-Ark® Traveler | 13.6a | 13.52 a | 10.3bc | 3.6c | 6.9a | 4.6ab | 4.3abc | 2.0a | 6.1ab | 1.4a | 8.0abcd |
| (G) main effect (P value) | 0.0776 | 0.1430 | <0.0001* | <0.0001* | 0.8229 | <0.0001* | <0.0001* | 0.2963* | 0.0250* | 0.6497 | <0.0001* |
| (S) x (G) interactive effects | 0.0989 | 0.1422 | 0.0002* | 0.9059 | 0.0209* | 0.0278* | <0.0001* | 0.4444 | 0.4632 | 0.9668 | 0.4293 |
| (P value) |
Genotypes were evaluated in duplicate by 8-9 trained panelists. *Significant for the F-test. Means with different letter(s) for each attribute within main effects are significantly different (p < 0.05) using Tukey’s HSD. Attributes evaluated on a 15-point scale (0 = less of the attribute and 15 = more of the attribute in terms of intensity).
3.1Fruit quality
At harvest, the blackberries had a range of firmness (4.9–9.0 N) and red drupelets (0.3–4.4%), whereas after storage the range of firmness was 4.0–10.1 N and red drupelets was 0–6.4%. There was an interaction between genotype and storage for firmness (p = 0.0344) of blackberries, but not for the percent of red drupelets. For most genotypes, storage did not affect firmness, except A-2491 had decreased firmness from 6.7 N at harvest to 4.0 N after storage (Table 4). Storage did not affect the development of red drupelets. The blackberry genotypes in this study had low red drupelets (<6%). A-2453, the only genotype evaluated with the unique crispy texture, had the lowest percent of red drupelets (0.7%) (Table 2). Color reversion for red drupelets formation can occur due to rupture of cell membranes and walls, causing leakage from vacuole to cytoplasm that changes the pH and the stability of anthocyanins [12]. Crispy genotypes, like A-2453, maintain the stability of cell membranes during storage resulting in lower incidence of red drupelets when compared to non-crispygenotypes [12].
Table 4
Fruit quality and chemical composition of fresh-market blackberry genotypes at harvest (day 0) and after storage at 2°C for 7 days and interactions, Clarksville, AR, 2015
| Genotype | Storage | Firmness | Red | Soluble | pH | Titratable | SS/TA |
| (Newtons) | drupelets (%) | solids (%) | acidity (%) | Ratio | |||
| A-2418 | Day 0 | 7.2abc | 3.1a | 6.6d | 3.1b | 1.5a* | 4.7c |
| A-2434 | Day 0 | 7.0abc | 3.2a | 9.7ab | 3.1b | 1.5a* | 7.0bc |
| A-2450 | Day 0 | 8.4ab | 2.0a | 7.1cd | 3.2ab | 1.1abc | 6.7bc |
| A-2453 | Day 0 | 9.0a | 1.4a | 9.5abc | 3.9a | 0.5c | 19.5a* |
| A-2491 | Day 0 | 6.7abc* | 1.2a | 10.9a | 3.3ab | 0.9abc | 12.1abc |
| APF-268 | Day 0 | 7.2abc | 4.4a | 7.3bcd | 3.0b | 1.3ab | 6.0bc |
| Natchez | Day 0 | 5.7bc | 0.3a | 8.7abcd | 3.3ab | 1.0abc | 9.0bc |
| Osage | Day 0 | 4.9c | 1.4a | 9.2abc | 3.4ab | 0.7bc* | 15.2ab* |
| Ouachita | Day 0 | 4.9c | 5.7a | 8.8abcd | 3.1b | 1.2abc* | 7.3bc* |
| Prime-Ark® 45 | Day 0 | 6.0abc | 1.0a | 7.9bcd | 3.3ab | 0.9abc | 8.8bc |
| Prime-Ark® Traveler | Day 0 | 7.2abc | 4.4a | 7.9bcd | 3.3ab | 1.0abc | 8.6bc |
| P value | 0.0021 | 0.5899 | <0.0001 | 0.0012 | 0.0068 | 0.0014 | |
| A-2418 | Day 7 | 7.5ab | 0.3b | 7.1c | 3.3b | 1.1a* | 6.9ab |
| A-2434 | Day 7 | 5.4bc | 0.4ab | 11.1a | 3.3b | 1.0a* | 11.0ab |
| A-2450 | Day 7 | 9.2a | 1.5ab | 7.2c | 3.3b | 1.1a | 7.0ab |
| A-2453 | Day 7 | 10.1a | 0.0b | 8.3abc | 3.8a | 0.6c | 13.6a* |
| A-2491 | Day 7 | 4.0c* | 1.4ab | 10.2ab | 3.5ab | 0.6c | 16.9a |
| APF-268 | Day 7 | 7.6ab | 2.5ab | 7.2c | 3.2b | 1.1a | 6.8b |
| Natchez | Day 7 | 4.7c | 1.6ab | 9.5abc | 3.4ab | 0.8ab | 11.8ab |
| Osage | Day 7 | 5.6bc | 2.0ab | 7.5bc | 3.4ab | 1.1a* | 7.5ab* |
| Ouachita | Day 7 | 5.3bc | 6.4a | 9.7abc | 3.6ab | 0.7a* | 15.4ab* |
| Prime-Ark® 45 | Day 7 | 5.7bc | 2.2ab | 8.0bc | 3.4ab | 0.9ab | 9.7ab |
| Prime-Ark® Traveler | Day 7 | 5.9bc | 5.5ab | 9.0abc | 3.5ab | 0.7bc | 12.7ab |
| P value | <0.0001 | 0.0171 | 0.0002 | 0.0067 | 0.0124 | 0.0098 |
Genotypes were evaluated in triplicate (n = 3). Means followed by an asterisk (*) within a genotype are significantly different for storage using Slice test (p < 0.05). Means with different letter(s) for each attribute within storage are significantly different (p < 0.05) using Tukey’s HSD test. Titratable acidity as % of citric acid. SS/TA ratio is soluble solids/titratable acidity ratio.
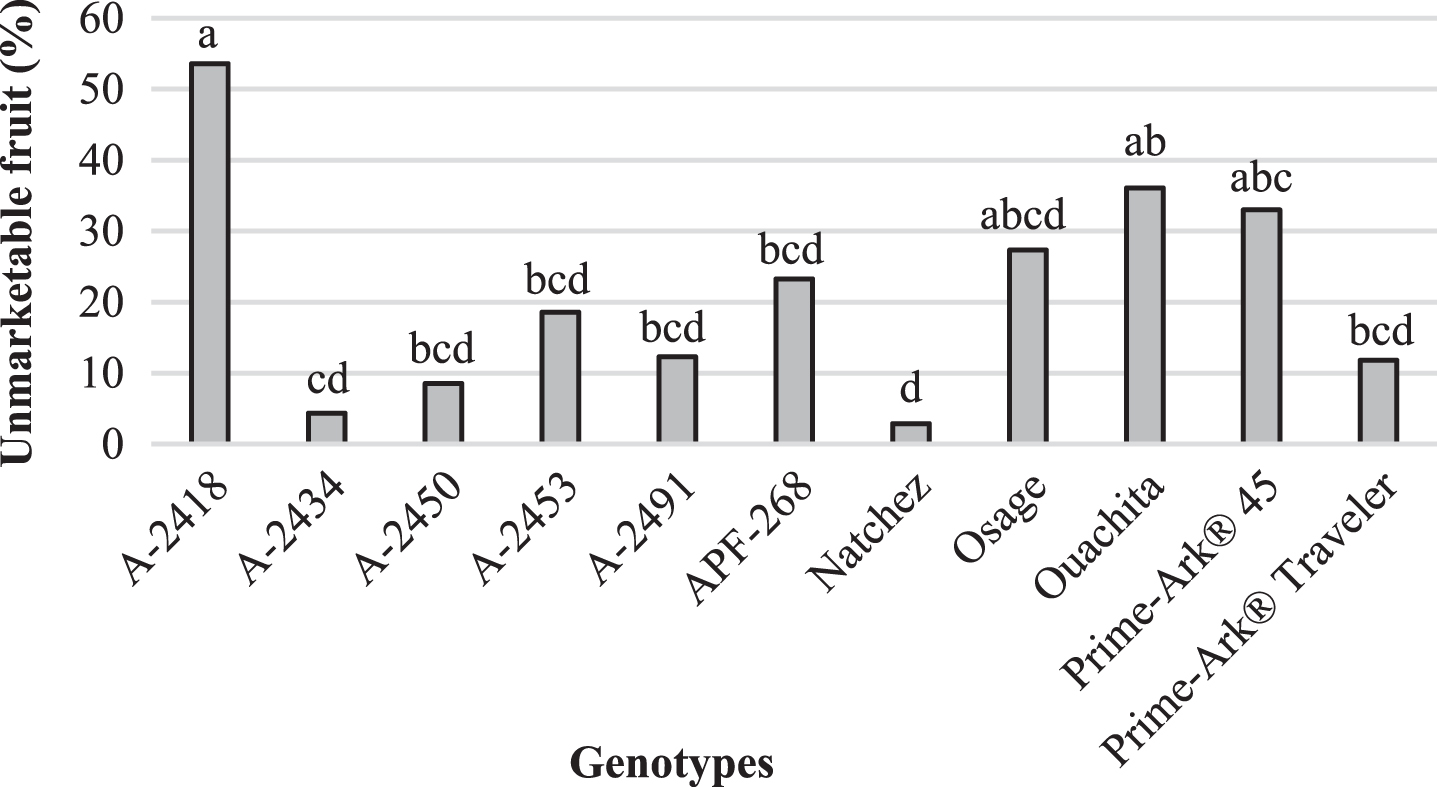
Weight loss and unmarketable fruit of blackberries stored in clamshells were evaluated after storage. Weight loss was very low (<3%) for all the genotypes. A-2491 had the highest weight loss (3.0%) and A-2453 the lowest (0.2%) (Fig. 1). Another study found that ‘Ouachita’, ‘Natchez’ and ‘Navaho’ had 2–4% weight loss when stored at 2°C for 15 days [15]. There were large differences in the genotypes in terms of unmarketable fruit. ‘Natchez’ had the lowest percent of unmarketable fruit (2.9%), demonstrating the potential for ‘Natchez’ as a fresh-market fruit, while A-2418 had the highest unmarketable fruit (53.6%) (Fig. 2). Weight loss was negatively correlated to firmness (r = –0.68), so the more firm the blackberry, then the more potential for postharvest storage. Unmarketable fruit was positively correlated to leakage (r = 0.91) and decay (r = 0.61).
Fig.1
Weight loss (%) after 7 days of storage at 2°C for blackberry genotypes in 240-g, low profile, vented clamshells, Clarksville, AR, 2015. Means with different letter(s) are significantly different (p < 0.05) using Tukey’s HSD test.
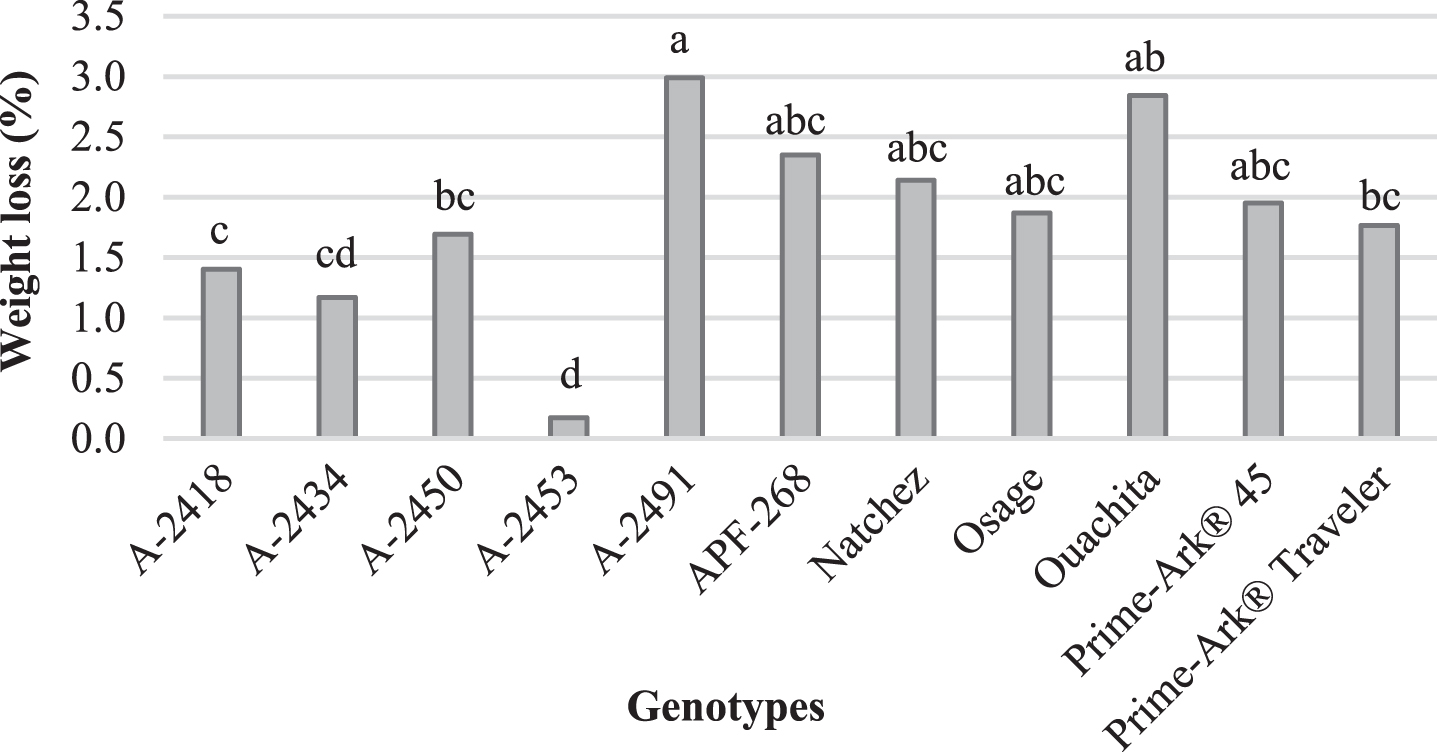
Fig.2
Unmarketable fruit (%) after 7 days of storage at 2°C for blackberry genotypes in 240-g, low profile, vented clamshells, Clarksville, AR, 2015. Means with different letter(s) are significantly different (p < 0.05) using Tukey’s HSD test.
3.2Chemical composition
At harvest, the blackberries had a range of soluble solids (6.6–10.9%), pH (3.1–3.9) titratable acidity (0.5–1.3%), and SS/TA ratio (4.7–19.5). Other research has shown similar data with soluble solids of blackberries from 6.2–11.1% and pH from 2.5–4.1 [25]. Although some research has shown that soluble solids levels decreased [26] and some showed levels that increased [13] during storage of blackberries. A slight increase in soluble solids was expected, since weight loss in blackberries concentrates cell sap [13]. In this study, the level of soluble solids was not affected by storage. A-2434 and A-2491 had the highest levels of soluble solids, 10.4% and 10.6%, respectively, while A-2418 had the lowest (6.9%). However, storage induced an increase in pH and a reduction of titratable acidity. At harvest, genotypes had a pH of 3.3 and after 7 days of storage had pH of 3.4. A-2453 had the highest pH (3.8), while the pH of other genotypes ranged from 3.1 to 3.4 (Table 2).
There was an interaction between genotype and storage for titratable acidity (p = 0.0287) and SS/TA ratio (p = 0.0157). After 7 days of storage, the titratable acidity decreased by 28% for A-2418 (from 1.5 to 1.1%) and A-2434 (from 1.5 to 1.0%). The titratable acidity decreased by 40% (from 1.2 to 0.7%) in ‘Ouachita’, but increased by 28.0% (from 0.7 to 1.1%) in ‘Osage’ (Table 4). Reduction of 10.0% to 30.0% in titratable acidity was observed in shiny-black blackberries during storage for ‘Shawnee’, ‘Cheyenne’ and ‘Choctaw’, and an increase of 30.0% in ‘Navaho’ [13]. Preferential use of organic acids for respiration may have decreased the titratable acidity [26]. Genotypes with higher respiration rates may have higher degradation of organic acids. SS/TA ratio decreased 30.0% for A-2453 (from 19.5 to 13.6) and 51.0% for ‘Osage’ (from 15.2 to 7.5), and increased 53.0% for ‘Ouachita’ (from 7.3 to 15.4) (Table 4).
The phytochemical levels varied among the genotypes but all increased after 7 days of storage at 2°C (Table 2). Before storage, the level of total phenolics was 382.2 mg GAE/100 g, the level of anthocyanins was 206.0 mg C3GE/100 g, the level of flavonols was 7.7 mg RE/100 g, and the level of ellagitannins was 27.1 mg EAE/100 g. After storage, the level of total phenolics increased 17.0%, anthocyanins 9.0%, flavonols 53.0% and ellagitannins 13.0%. It is possible that, in this study, stress conditions such as low temperature or pathogen attack during the postharvest storage could have increased these compounds. Postharvest storage temperature can affect the level of anthocyanins in small fruits, such as raspberries, strawberries, cherries, sour cherries and red currants [27]. The storage of blackberries for 15 days at 2°C, increased the level of total anthocyanins, total flavonols and total phenolics by 3.2%, 10.4% and 8.7%, respectively in ‘Natchez’, 38.0%, 19.8% and 32.0%, respectively in ‘Ouachita’, and 48.0%, 33.6% and 59.8%, respectively in ‘Navaho’, suggesting that genetic background may play an important role in phytochemical compound changes during storage [15]. After 7 days of storage at 2°C, the content of total phenolics increased in ‘Arapaho’ (289 to 323 mg GAE/100 g) and ‘Shawnee’ (175 to 364.6 mg GAE/100 g) and remained the same for ‘Choctaw’ and ‘Apache’, while total anthocyanins decreased in ‘Arapaho’ (144 to 119 mg C3GE/100 g) and increased in ‘Navaho’ (136 to 158 mg C3GE/100 g) [28]. In oranges, storage at 4°C increased the level of anthocyanins eight times compared to fruit stored at 25°C. The low temperature led to activation of phenylalanine ammonia lyase (PAL), chalcone synthase (CHS), dihydroflavonol 4-reductase (DFR) and UPD-glucose flavonoid glucosyl transferase (UFGT) genes involved in the biosynthesis of anthocyanins and suggests that genes of the anthocyanin biosynthesis pathway in oranges can be considered cor (cold-regulated) genes [29].
Selection A-2450 had the highest level of total phenolics and total anthocyanins, 502.8 mg GAE/100 g and 271.8 mg C3GE/100 g, respectively, while ‘Prime-Ark® Traveler’ had the lowest levels (336.3 mg GAE/100 g and 124.4 mg C3GE/100 g). ‘Prime-Ark® 45’ had the highest level of total flavonols (14.8 mg RE/100 g) and ‘Ouachita’ the lowest (6.3 mg RE/100 g). ‘Natchez’ had the highest level of total ellagitannins (42.8 mg EAE/100 g) and A-2453 the lowest (18.2 mg EAE/100 g) (Table 2). Blackberries showed a wide variation in their biochemical composition due to genotype differences, total phenolics ranged from 682 to 1040 mg GAE/100 g for total phenolics, total anthocyanins from 131 to 256 mg C3GE/100 g, total flavonols from 4 to 12 mg RE/100 g and total ellagitannins from 8 to 27 mg EAE/100 g [30].
At harvest, total anthocyanins and total flavonols were positively correlated to total phenolics (r = 0.71 and r = 0.68, respectively). Interestingly, red drupelet incidence (%) was negatively correlated with total phenolics (r = –0.77) and total flavonols (r = –0.66). After storage, only total flavonols were correlated with total phenolics (r = 0.68).
3.3Sensory analysis
The descriptive sensory panelists evaluated appearance, texture, basic tastes, feeling factors and overall aromatic impact of the blackberry genotypes at harvest and after storage. The panelists did not detect differences in the color and uniformity of color of the blackberries. On the 15-point scale, the blackberries were scored 13.2–13.7, very dark and uniform. The intense, almost black color of blackberries can be correlated to composition and high levels of various anthocyanins [31]. A-2453 was the glossiest genotype, and ‘Prime-Ark® 45’ was the least glossy. Glossiness of the blackberries was not impacted by storage.
Storage did not impact the hardness of the blackberries, but hardness varied by genotype with ‘Natchez’, ‘Ouachita’, ‘Prime-Ark® Traveler’ and A-2491 as the softest and A-2453 the firmest. There was an interaction between genotype and storage for the popping attribute (p = 0.0209). Panelists identified a decrease of the popping attribute for the genotypes A-2434, A-2450, A-2491, ‘Natchez’ and ‘Prime-Ark 45®’ after 7 days of storage (Table 5).
Table 5
Descriptive sensory attributes for fresh-market blackberry genotypes at harvest (day 0) and after storage at 2°C for 7 days, Clarksville, AR, 2015
| Genotypes | Storage | Glossiness | Popping | Sweet | Sour |
| A-2418 | Day 0 | 11.0a | 7.3a | 3.3a | 5.0a |
| A-2434 | Day 0 | 10.9a | 7.9a* | 4.9a | 5.5a* |
| A-2450 | Day 0 | 9.8a | 7.8a* | 4.1a | 5.8a* |
| A-2453 | Day 0 | 11.5a | 7.3a | 3.7a | 3.7a |
| A-2491 | Day 0 | 10.8a | 7.8a* | 5.4a* | 4.4a* |
| APF-268 | Day 0 | 10.7a | 7.3a | 3.9a | 4.4a |
| Natchez | Day 0 | 11.7a | 8.0a* | 4.9a* | 5.1a* |
| Osage | Day 0 | 11.3a | 7.0a | 4.0a | 3.7a* |
| Ouachita | Day 0 | 11.4a | 7.0a | 4.2a | 3.7a |
| Prime-Ark® 45 | Day 0 | 9.9a | 8.1a* | 4.1a | 5.6a* |
| Prime-Ark® Traveler | Day 0 | 10.3a | 7.5a | 4.9a | 4.8a* |
| P value | 0.2822 | 0.8733 | 0.0523 | 0.1648 | |
| A-2418 | Day 7 | 11.1a | 7.7a | 3.9a | 5.7a |
| A-2434 | Day 7 | 11.1ab | 6.6a* | 4.5a | 3.7b* |
| A-2450 | Day 7 | 11.3a | 6.4a* | 3.8a | 4.4ab* |
| A-2453 | Day 7 | 12.0a | 8.2a | 4.3a | 4.1ab |
| A-2491 | Day 7 | 11.5a | 6.4a* | 4.5a* | 3.4b* |
| APF-268 | Day 7 | 11.2a | 7.0a | 3.9a | 5.2ab |
| Natchez | Day 7 | 11.1ab | 6.4a* | 4.0a* | 4.0ab* |
| Osage | Day 7 | 11.3a | 7.0a | 4.1a | 4.7ab* |
| Ouachita | Day 7 | 11.9a | 7.0a | 4.3a | 4.6ab |
| Prime-Ark® 45 | Day 7 | 9.0b | 6.3a* | 3.5a | 4.5ab* |
| Prime-Ark® Traveler | Day 7 | 10.3ab | 6.4a | 4.4a | 3.8b* |
| P value | 0.0013* | 0.6404 | 0.8844 | 0.0044* |
Genotypes were evaluated in duplicate. Means followed by an asterisk (*) within genotype are significantly different for storage using Slice test (p < 0.05). Means with different letter(s) for each attribute within each storage date are significantly different (p < 0.05) using Tukey’s HSD test. Attributes evaluated on a 15-point scale (0 = less of the attribute and 15 = more of the attribute in terms of intensity).
In terms of basic tastes, there were interactions between genotype and storage for the sweet (p = 0.0279) and sour attributes (p < 0.0001), but the interactions were not significant for bitter basic taste, the feeling factors or the overall aromatic impact. Before storage, panelists identified A-2491 as the sweetest (soluble solids 10.9%) and A-2418 as the least sweet (soluble solids 6.6%) and found the sweetness of A-2491 and ‘Natchez’ decreased during storage. In terms of sourness after storage, A-2434, A-2450, A-2491, ‘Natchez’, ‘Prime-Ark® 45’ and ‘Prime-Ark® Traveler’ showed a reduction of sourness, while ‘Osage’ showed an increase. After storage, A-2418 was the sourest, while A-2491 the least sour. These findings correspond with our analytical results that showed variation in titratable acidity for the genotypes after 7 days of storage. Panelists did not find differences among genotypes for bitterness, but found that berries were bitterer before storage, but overall bitterness was low (<2.2 on the 15-point scale).
Astringent feeling factor varied among genotypes and increased after storage. It is interesting to note that panelists identified A-2453 as the least astringent and A-2450 as the most astringent, since A-2453 had the lowest content of ellagitannins and A-2450 the highest content of total phenolics and anthocyanins. Astringent feeling factor is related to phenolic compounds such as anthocyanins [32]. The metallic feeling factor (biting into tin foil as a reference) of the blackberries was very low. There was not a difference between genotypes found, but the metallic feeling increased after storage.
The intensity of overall aromatics ranged from 7.0 to 8.3 with A-2491 having the highest intensity, but the overall aromatics were impacted by storage with a decrease from 7.9 to 7.6 in the intensity of overall aromatics after 7 days of storage. Soluble solids were positively correlated with sweet basic taste and overall aromatic impact (r = 0.74 and 0.68, respectively).
3.4Principal component analysis
Principal component analysis was used to segregate genotypes into different organoleptic groups (Table 6). The perception of sensory attributes and analytical attributes was reduced to three principal components, which explained 71.1% and 72.2% of data variance, at harvest and after storage, respectively.
Table 6
Principal component analysis on descriptive sensory attibutes and fruit quality and chemical composition (analytical) attributes of fresh-market blackberries at harvest (day 0) and after storage at 2°C for 7 days, Clarksville, AR, 2015
| Harvest | ||||
| Component 1 | Component 2 Sour and | Component 3 | ||
| Astringent → Higher | Phytochemicals → Red Color | Sweet and Soft → Hard | ||
| pH (less acidic) | ||||
| Positive loadings | Descriptive attributes | Astringent feeling | Sour taste | Sweet taste |
| Metallic feeling | Popping | Uniformity of color | ||
| Overall aromatic impact | ||||
| Analytical attributes | Titratable acidity | Total flavonols | Soluble solids | |
| Total phenolics | ||||
| Key samples | A-2434 and APF-268 | A-2450 and ‘Prime-Ark® 45’ | A-2491 and ‘Natchez’ | |
| Negative loadings | Descriptive attributes | * | Color | Hardness |
| Analytical attributes | pH | Red drupelets incidence | * | |
| SS/TA ratio | ||||
| Key samples | A-2453 | ‘Ouachita’ | A-2418 | |
| After storage | ||||
| Component 1 | Component 2 Hard → High | Component 3 | ||
| Sour → Sweet | Phytochemicals | Dark Color → Red Color | ||
| Positive loadings | Descriptive attributes | Sour taste | Glossiness | Color |
| Astringent feeling | Hardness | Uniformity of color | ||
| Metallic feeling | Popping | |||
| Analytical attributes | Titratable acidity | * | Total phenolics | |
| Total anthocyanins | ||||
| Key samples | A-2418 | A-2453 | A-2453 | |
| A-2450 | ‘Natchez’ | |||
| Negative loadings | Descriptive attributes | Sweet taste | Bitter taste | * |
| Overall aromatic impact | ||||
| Analytical attributes | Soluble solids | Total flavonols | Red drupelets incidence | |
| SS/TA ratio | Total ellagitannins | |||
| Key samples | A-2491 | ‘Prime-Ark® 45’ | ‘Ouachita’ | |
| ‘Natchez’ | ||||
*No attributes have high loadings on this side of this dimension. SS/TA ratio means Soluble solids/titratable acidity ratio. Three principal components explained 71.1% and 72.2% of data variance, at harvest day and after storage, respectively.
At harvest, the positive loadings in component 1 were astringent feeling factor, metallic feeling factor and titratable acidity associated with APF-268 and A-2434, while the negative loadings were pH and SS/TA ratio associated with A-2453. The positive loadings in component 2 were sour taste, popping, total flavonols and total phenolics associated with A-2450 and ‘Prime-Ark® 45’, while the negative loadings were red drupelets incidence and color associated with ‘Ouachita’. The positive loadings in component 3 were sweet taste, overall aromatic impact, uniformity of color and soluble solids associated with A-2491 and ‘Natchez’, while the negative loading was hardness associated with A-2418.
After storage, the positive loadings in component 1 were sour taste, astringent feeling factor, metallic feeling factor and titratable acidity associated with A-2418 and A-2450, while the negative loadings were sweet taste, soluble solids and SS/TA ratio associated with A-2491. The positive loadings in component 2 were glossiness, hardness and popping associated with A-2453, while the negative loadings were bitter taste, overall aromatic impact, total flavonols and total ellagitannins associated with ‘Prime-Ark® 45’ and ‘Natchez’. The positive loadings in component 3 were color, uniformity of color, total phenolics and total anthocyanins associated with A-2453 and ‘Natchez’, while the negative loading was red drupelet incidence associated with ‘Ouachita’.
The shifts in the multidimensional sensory and analytical dimensions between 0 and 7 days of storage indicate the need for examining changes in genotypes over time. For example, at day 0, sweetness and soluble solids are more strongly associated with uniformity of color and overall aromatic impact; the negative correlation with sourness was less pronounced at day 0 than at day 7. In contrast, in the day 7 principal component analysis solution for component 1, sour taste, astringent feeling, metallic feeling and titratable acidity are negatively associated with sweet taste, soluble solids, and SS/TA ratio. Sourness and titratable acidity of many cultivars decreased over time, which partly drove the changes in the sensory and analytical space. Higher fruit quality is associated with higher sweetness, lower sourness and lower bitterness [23]. Since lower sourness and higher sweetness are associated with higher consumer liking, blackberries like A-2491, a key sample on the sweetness dimension, may be more desirable after 7 days of storage than at harvest. As another example, bitter taste is more strongly associated with total flavonols and total ellagitannins on component 2 at day 7. Since higher bitterness is associated with lower consumer liking [23], A-2453, a key sample, which is negatively associated with high flavonols and bitter taste may be liked more than other cultivars which are more bitter.
4Conclusions
This study identified blackberry genotypes with postharvest storage potential for the fresh-market industry, as well as fruit quality and sensory attributes that impact postharvest potential. The blackberry genotypes in this study had low levels of weight loss, firmness loss and incidence of red drupelets, but also maintained commercially acceptable levels of soluble solids, titratable acidity and phytochemical compounds after postharvest storage. After 7 days of storage, ‘Natchez’ had the lowest percent of unmarketable fruit and was associated with sweet taste and overall aromatic impact as well as A-2491. ‘Natchez’ and A-2453 had the lowest incidence of red drupelets and were associated with uniformity of color. The correlation of fruit quality and chemical composition to sensory attributes can assist blackberry breeders in developing cultivars with extended shelf-life and superior fruit attributes for fresh-market.
Acknowledgments
This research was funded by a Specialty Crop Block Grant from the Arkansas Agriculture Department, United States Department of Agriculture (14-SCBGP-AR0005). Additional support was provided by the Southern Region Small Fruit Consortium and by the Coordenação de Aperfeiçoamento de Pessoal de Nível Superior (CAPES – Ministério da Educação e Cultura, Brasil).
References
[1] | Meret M , Brat P , Mertz C , Lebrun M , Ginata Z . Contribution to aroma potential of Andean blackberry (Rubus glaucus Benth). Food Research International. (2011) ;44: :54–60. doi: 10.1016/j.foodres.2010.11.016 |
[2] | Jakobek L , Seruga M , Navak I , Medvidovic-Kosanovic M . Flavonols, phenolic acids and antioxidant activity of some red fruits. Deutsche Lebensmittel-Rundschau. (2007) ;103: (8):369–77. |
[3] | Siriwoharn T , Wrolstad RE . Phenolic composition of ‘Marion’ and ‘Evergreen’ blackberries. Journal of Food Science. (2004) ;69: :233–40. doi: 10.1111/j.1365-2621.2004.tb06322.x |
[4] | Tsoyi K , Park HB , Kim YM , Chung JI , Shin SC , Lee WS , Kim HJ . Anthocyanins from black soybean seed coats inhibit UVB-induced inflammatory cylooxygenase-2 gene expression and PGE2 production through regulation of the nuclear factor-κB and phosphatidylinositol 3-kinase/Akt pathway. Journal of Agricultural and Food Chemistry. (2008) ;56: (19):8969–89. doi: 10.1021/jf801345c |
[5] | Tomás-Barberán FA , Espín JC . Phenolic compounds and related enzymes as determinants of quality in fruits and vegetables. Journal of the Science of Food and Agriculture. (2001) ;81: :853–76. doi: 10.1002/jsfa.885 |
[6] | Lattanzio V . Bioactive Polyphenols: Their role in quality and storability of fruit and vegetables. Journal of Applied Botany. (2003) ;77: :128–46. |
[7] | Threlfall RT , Hines OS , Clark JR , Howard LR , Brownmiller CR , Segantini DM , Lawless LJR . Evaluation of physiochemical and sensory attributes of fresh blackberries grown in Southeastern United States. HortiScience. (2016) ;51: :1351–62. |
[8] | Du XF , Kurnianta A , McDaniel M , Finn CE , Qian MC . Flavour profiling of ‘Marion’ and thornless blackberries by instrumental and sensory analysis. Food Chemistry. (2010) ;121: :1080–8. doi: 10.1016/j.foodchem.2010.01.053 |
[9] | Clark JR . Primocane-fruiting Blackberry Breeding. HortScience. (2008) ;43: :1736–9. |
[10] | Clark JR , Finn CE . New trends in blackberry breeding. Acta Horticulturae. (2008) ;777: :41–7. doi: 0.17660/ActaHortic.2008.777.2 |
[11] | Clark JR , Perkins-Veazie P . Prime-Ark® 45 primocane-fruiting blackberry. HortScience. (2011) ;46: :670–3. |
[12] | Lewers KS , Wang SY , Vinyard BT . Evaluation of blackberry cultivars and breeding selections for fruit quality traits and flowering and fruiting dates. Crop Science. (2010) ;50: :2475–91. doi: 10.2135/cropsci2010.02.0097 |
[13] | Salgado AA , Clark JR . “Crispy” blackberry genotypes: A breeding innovation of the university of arkansas blackberry breeding program. HortScience. (2016) ;51: :468–71. |
[14] | Perkins-Veazie P , Collins JK , Clark JR . Cultivar and maturity affect postharvest quality of fruit from erect blackberries. HortScience. (1996) ;31: :258–61. |
[15] | Kim MJ , Perkins-Veazie P , Guoying M , Fernandez G . Shelf life and changes in phenolic compounds of organically grown blackberries during refrigerated storage. Postharvest Biology and Technology. (2015) ;110: :257–63. doi: dx.doi.org/10.1016/j.postharvbio.2015.08.020 |
[16] | Joo MJ , Lewandowski N , Auras R , Harte J , Almenar E . Comparative shelf life study of blackberry fruit in bio-based and petroleum-based containers under retail storage conditions. Food Chemistry. (2011) ;126: :1734–40. doi: doi: 10.1016/j.foodchem.2010.12.071 |
[17] | Bolda M , Gaskell M , Mitcham E , Cahn M . Fresh Market: Caneberry production manual. California: University of California Agricultural and Natural Resources Communication Services, (2012) , 74p. (Publication 3525). |
[18] | Kader AA . Postharvest technology of horticultural crops. 3rd ed. California: University of California; (2002) . 509P. |
[19] | Cia P , Bron IU , Valentini SRT , Pio R , Chagas EA . Atmosfera modificada e refrigeração para conservação pós-colheita da amora-preta. Bioscience Journal. (2007) ;23: (3): 11–6. |
[20] | Hager TJ , Howard LR , Liyanage R , Lay JO , Prior RL . Ellagitannin composition of blackberry as determined by HPLC-ESI-MS and MALDI-TOF-MS. Journal of Agricultural Food Chemistry. (2008) ;56: :661–69. doi: 10.1021/jf102964b |
[21] | Hager TJ , Howard LR , Prior RL . Processing and storage effects on the ellagitannin composition of processed blackberry products. Journal of Agricultural and Food Chemistry. (2010) ;58: :1749–54. doi: 10.1021/jf102964b |
[22] | Cho MJ , Howard LR , Prior RL , Clark JR . Flavonoid glycosides and antioxidant capacity of various blackberry, blueberry and red grape genotypes determined by high-performance liquid chromatography/mass spectrometry. Journal of the Science of Food and Agriculture. (2004) ;84: (13):1771–82. doi: 10.1002/jsfa.1885 |
[23] | Hager TR , Prior RL , Howard LR . Processing and storage effects on monomeric anthocyanins, percent polymeric color, and antioxidant capacity of processed blackberry products. Journal of Agricultural and Food Chemistry. (2008) ;56: :689–95. doi: 10.1021/jf071994g |
[24] | Slinkard K , Singleton VL . Total phenol analysis: Automation and comparison with manual methods. American Journal for Enology and Viticulture. (1977) ;28: :49–55. |
[25] | Souza VR , Pereira PAP , Da Silva TLT , Lima LCO , Pio R , Queiroz F . Determination of the bioactive compounds, antioxidant activity and chemical composition of Brazilian blackberry, red raspberry, strawberry, blueberry and sweet cherry fruits. Food Chemistry. (2014) ;156: :362–8. doi: dx.doi.org/10.1016/j.foodchem.2014.01.125 |
[26] | Wu RY , Frei B , Kennedy JA , Zhao YY . Effects of refrigerated storage and processing technologies on the bioactive compounds and antioxidant capacities of ‘Marion’ and ‘Evergreen’ blackberries. LWT-Food Science and Technology. (2010) ;43: :1253–64. doi: 10.1016/j.lwt.2010.04.002 |
[27] | Piljac-Žegarac J , Šamec D . Antioxidant stability of small fruits in postharvest storage at room and refrigerator temperatures. Food Research International. (2011) ;44: :345–50. doi: 10.1016/j.foodres.2010.09.039 |
[28] | Perkins-Veazie P , Kalt W . Postharvest storage of blackberry fruit does not increase antioxidant levels. Acta Horticulturae. (2002) ; ISHS (2002) ;521–4. |
[29] | Lo Piero AR , Puglisi I , Rapisarda P , Petrone G . Anthocyanins accumulation and related gene expression in red orange fruit induced by low temperature storage. Journal of Agricultural and Food Chemistry. (2005) ;53: :9083–8. doi: 10.1021/jf051609s |
[30] | Siriwoharn T , Wrolstad RE , Finn CE , Pereira CB . Influence of cultivar, maturity, and sampling on blackberry [Rubus L. hybrids] anthocyanins, polyphenolics, and antioxidant properties. Journal of Agricultural and Food Chemistry. (2004) ;52: :8021–30. doi: 10.1021/jf048619y |
[31] | Howard LR , Prior RL , Liyanage R , Lay JO . Processing and storage effect on berry polyphenols: Challenges and implications for bioactive properties. Journal of Agricultural and Food Chemistry. (2012) ;60: :6678–93. doi: dx.doi.org/10.1021/jf2046575 |
[32] | Viljanen , Heiniö RJ , Juvonen R , Kössö T , Puupponen-Pimiä R . Relation of sensory perception with chemical composition of bioprocessed lingoberry. Food Chemistry. (2014) ;157: :148–456. doi: http://dx.doi.org/10.1016/j.foodchem.2014.02.030 |

