
Evolution of the taste-related and bioactive compound profiles of the external and internal tissues of strawberry fruits (Fragaria x ananassa) cv. ‘Clery’ during ripening
Abstract
BACKGROUND: The distribution of bioactive compounds within a fruit is not homogenous. A better understanding of the developmental profile of the taste-related and bioactive compounds within different fruit tissues will be useful.
OBJECTIVE: The aim of this study was to characterise the evolution of the taste-related and bioactive compounds in the internal and external tissues during stages of ripening strawberry fruits.
METHODS: Taste-related compounds were analysed using refractometric and titrational methods. Phenolics was analysed using LC-MS. HPLC-UV was used to identify and quantify the levels of individual compounds. Antioxidant capacity and anthocyanins were determined photometrically.
RESULTS: The perception of the taste could be attributed to the internal tissues. Regarding the bioactive compound contents, polyphenol compounds were present from the initial stage of fruit development. Among them, pelargonidin derivatives contributed to the antioxidant capacity only after the fruit had reached the 50%-red stage. They first accumulated in the external tissues and only later accumulated in the internal tissues. Ellagitannins were initially present in both tissues suggesting their antioxidant capacity contribution throughout the fruit ripening stages.
CONCLUSIONS: This study demonstrated significant differences in the accumulation processes of bioactive compounds in the internal and the external layers of strawberry fruits.
1Introduction
Among the berries that humans currently consume, strawberries or processed strawberry products are most popular because of their pleasant taste and high nutritional value [1, 2]. The traits that are important for a consumer’s acceptance of a food concern its visual appearance (redness, brightness and firmness) and taste (sweetness and aroma levels) [3–7]. Many studies that investigated the nutritional value of foods, as reviewed by Giampieri et al. [2], showed that strawberries contain a wide range of bioactive compounds and described their benefits for human health. The most important and most widely studied health-related compounds of strawberries are anthocyanins. The members of this phytochemical group have been shown to contribute 25 to 40% of the total antioxidant capacity of these fruits. Moreover, it has been hypothesized that strawberry consumption helps to prevent the development of certain diseases, such as cardiovascular disease and cancer [1, 2]. Such information could make consumers aware of these benefits and increase their level of strawberryconsumption.
The variation in the quality traits of strawberry fruits can be attributed to their genetic background and ripening stages and to the particular harvest periods and cultivation procedures involved, as well as to environmental factors [2, 4, 7, 8–12]. Another factor that affects the bioactive-compound profile of strawberries that was recently reported is the duration of the fruit-ripening period [13]. Fruits that develop more slowly and have a longer ripening period appeared to accumulate more anthocyanins. Moreover, Yoshida et al. [14] observed an increase in the total anthocyanin content during the late stage of fruit maturation, during which the colour of the fruit appeared not to change. These authors suggested that anthocyanins may first accumulate in the external layer of the fruits and later accumulate in the internal layer and that the fruit colour changes were correlated with the contents of the predominant anthocyanins. Nevertheless, it is known that the stability and profile of anthocyanins generally depend on the content of a combination of other compounds that form phenol complexes [15]. To our knowledge, little information is available on the accumulation of polyphenolic compounds in the external and internal layers of strawberries during their ripening process.
The distribution of bioactive compounds within a fruit is not homogenous. To our knowledge, few investigations of the phenolic profiles of different parts of fruits, such as the internal and external tissues, have been conducted. Such studies would allow better understanding of the synthesis of bioactive compound in fruits.
The objective of this study was to analyse the evolution of fruit-quality traits in the external and internal layers of strawberries during their ripening. The levels of taste-related and bioactive compounds in these layers were determined, and the major phenolic compounds present were characterised and quantified at each ripening stage. The relationship between the contents of bioactive compounds and the antioxidant capacity of the strawberry layers was analysed. The results of this study will allow a better understanding of the process of accumulation of bioactive compounds in fruits during their ripening.
2Materials and methods
2.1Plant material
The strawberry cultivar ‘Clery’ was used in this investigation because its fruit is rich in anthocyanin and its bioactive compounds are stable under various environmental conditions [11]. Plug plants of the cultivar ‘Clery’ were planted in 2011 under a plastic tunnel on raised beds covered with black plastic mulch; each plot contained 35 to 37 plants at a density of 4 plants/m2. The rows were separated by 1.25 m, and the raised beds had an internal width and height of 30 and 15 cm, respectively. The plants were arranged in 4 repetitions. The tunnel was 5 m wide, 3 m high and 52 m long and it was covered with a new polyethylene plastic sheet (200 μu, 7.25 EVA Patilux, Italy) at the beginning of March. The ends and sides of the tunnel remained open during the day when the temperature inside had reached 20°C. Water and nutrients were provided using fertigation (drip irrigation via T-Tape with emitters spaced at 0.3-m intervals) based on the recommendations for strawberries with a fruit yield of 2 kg/m2, at (in kg/ha) 100 N, 15 P 50 K and 20 Mg. Phytosanitary treatments were applied according to the Integrated Production System guidelines (Steffek et al., 2003).
During the peak of the harvest period (from the 2nd to the 15th of May), fruits at five different ripening stages were harvested every 3 d. The five ripening stages were defined by the colour of the strawberry fruits: white (0% red), 10% red, 50% red, 100% bright red and 100% purple red (PR). The colour 100% -bright red corresponded to the common harvesting stage. The harvested fruits were immediately transferred to the laboratory and were cut to separate the external and internal tissues. The external tissues of the fruits included the achene-containing tissue and the pigmented flesh of the fruits that were beginning to gain colour. Therefore, the external tissues of white fruit correspond to the flesh containing achene. The internal tissues included the core of each fruit. Regardless of the size of the fruits, the core had a cuboidal shape (1 to 2 cm long, 0.7 to 1.3 cm wide and 0.8 to 1 cm high) and represented 50% of the fruit volume. The lots of tissues from the fruits collected on the 5 picking dates were pooled according to their ripening stages and the field replicate number and were immediately frozen (treated with liquid nitrogen and stored at –80°C) before analysis. Given that the aim of this study was to determine the differences between the contents of the internal and external tissues, the field replications were considered repetitions.
2.2Soluble-solid content (SSC) and titratable acidity (TA) level
The SSC and the TA level were determined using juice extracted from the fruits using a commercial Juice Master (Hapag, Switzerland). The SSC, expressed as % Brix, was determined using a refractometer (Atago, PR-1, Kunzmann, Switzerland). Ten grams of clear fruit juice was adjusted to pH 8.2 using 0.1 mol/L NaOH using an automated titrator (Titrino DMP 785, Metrohm AG, Switzerland) to determine the titratable acidity value, which was expressed as mg citric acid equivalent per 100 g of juice.
2.3Sample preparation
The strawberry tissue layers were extracted according to the method of Tulipani et al. [16], with slight modifications. Briefly, the frozen tissue layers were homogenised using a laboratory blender (IKA ® A11 basic, Staufen, D), resulting in a powder containing intact achenes. Five grams of frozen strawberry powder was placed in 25 g of the extraction solution (methanol: water: formic acid/80 : 19 : 1/ v:v:v). The obtained slurry was sonicated in an ice-cooled water bath (0–4°C) for 15 min then centrifuged for 5 minutes at 9000 rpm. The supernatant was filtered through a LS 141/2 filter (Schleicher and Schuell, Germany). The extracts were stored for up to 3 d at –80°C before being used for the determination of the antioxidant capacity, the total phenolic and anthocyanin contents as well as for the identification and quantification of individual phenolic compounds.
2.4Total phenolic content (TPC)
The TPC was determined using the Folin-Ciocalteu reagent as described by Singleton & Rossi (1965), with minor modifications. Briefly, 500-μl samples of the extracts or the standards were mixed with 7.5 ml of H2O and 0.5 ml of Folin-Ciocalteu reagent (F-9252, Sigma-Aldrich, Switzerland). After a 10-min incubation at room temperature, 0.5 ml of a 20% aqueous Na2CO3 solution was added, and the samples were incubated at 40 °C for 20 min. The reaction was stopped by placing the samples on ice, and the absorbance at 755 nm was read using water as the blank. Quantification was performed using an ellagic acid standard calibration curve, and the results were expressed as mg ellagic acid equivalent per 100 g of fresh weight (mg EAE/100 g FW).
2.5Total anthocyanin content (TAC)
The TAC was measured using the pH-differential method of Lee et al. [17]. Briefly, the extract was diluted 5-fold using buffers with pH values of 1.0 and 4.5 and the absorbance of these solutions at 510 and 700 nm was read. The pH 1 buffer was a solution of 0.025 mol/L potassium chloride. The pH 4.5 buffer was a solution of 0.4 mol/L sodium acetate. Between 20 to 50 min after the diluents were prepared, their absorbance at 510 and 700 nm was measured, using distilled water as the blank. The total anthocyanin content was calculated using the molar extinction coefficient of 22400 L/mol cm (pelargonidin-3-glucoside) according to the absorbance (A) value determined using the following equation:
The results were expressed as mg pelargonidin-3-glucoside equivalent per 100 g of fresh weight (mg P3GE/100 g FW).
2.6Antioxidant capacity
The antioxidant capacity (AC) was assessed using the stable 1,1- diphenyl-2-picrylhydrazyl (DPPH) radical according to the method of Brand-Williams et al. [18]. Briefly, 100-μl aliquots of the extracts were added to 10 ml of 0.1 mmol/L DPPH, stirred well and left to react at room temperature. The absorption at 517 nm was measured after 30 minutes against that of the methanol/water extraction mixture (blank). Quantification was performed using a Trolox standard calibration curve (0–2.4 μmol/ml), and the results were calculated as μmol Trolox equivalent per 100 g of fresh weight (μmol TE/100 g FW).
2.7HPLC-MS analysis of the content of phenolic compounds
The content of phenolic compounds in the filtered (0.45 μm) strawberry extracts was determined using an Agilent 1200 series HPLC instrument coupled to diode array detectors (DAD). Each sample contained 100 μl of naringin (10 mg/ml) that was added as an internal standard. The extracts (50 μL) were analysed using a C18 column (250×4.6 mm, 5 μm, Luna, Phenomenex, CA, USA) equipped with a guard column (4×2 mm, 5 μm, Phenomenex). The mobile phase consisted of HPLC-grade acidified water (H2O:HCOOH/v:v/90 : 10) (A) and acidified acetonitrile (ACN:HCOOH/v:v/90 : 10) (B). A gradient of 5 to 30% solution B was applied over a period of 40 min at a flow rate of 0.7 ml min–1, with the column maintained at 30 °C. The measurements at three different wavelengths were recorded first, as follows: that at 500 nm to determine the level of anthocyanin and those at 260 nm to determine the levels of other phenolic compounds. The content of each anthocyanin was calculated by comparison with the calibration curves obtained using the external standards cyanidin-3-glucoside, pelargonidin-3-glucoside and ellagic acid (Extrasynthese, Lyon, France) using an Agilent ChemStation Rev. B.02.01. The LC-MS spectrometer used was an HP Agilent 1100 series instrument equipped with an atmospheric-pressure ionisation (API) device operated in the electrospray-ionisation (ESI) mode. The phenolic compound contents were analysed using the positive- and negative-ionisation modes. The nebuliser pressure used was 45 psi; the gas flow was set at 12 L/min; the drying gas temperature was set at 350 °C; and the capillary voltage was set at 3500 V. This analysis was conducted using a scan range of m/z 100 to 2200.
2.8Statistical analysis
All the statistical analyses, such as the analysis of variance, Tukey test (at p < 0.05), simple linear regression test, coefficient of determination r2 value as determined using the Pearson test and the factorial discriminant analysis regarding the differences amongst the tissues were determined using an analysis of variance using the Tukey multiple comparison test (α= 0.05) and were performed using XLSTAT Version 2011.1.01 software. The experimental design was a randomized complete-block design with four repetitions. P values of less than 0.05 were considered to indicate significant differences.
3Results and discussion
3.1Evolution of the profiles of the taste- and health-related constituents
Determination of the SSC and TA levels of the internal and external tissues showed significant differences for both parameters during ripening (Fig. 1). The differences between the SSCs of the internal and external tissues were much smaller than were those of the TA values. A slow increase in the SSC was observed in both the external and internal tissues of the fruits. In contrast, variation in the TA levels was observed mainly in the external tissues of the fruits, whereas the TA level of the internal tissues remained stable during the entire maturation process. A decrease in the TA level of the external fruit layer was observed only after the half-red stage had been reached. According to Perkins-Veazie [19], the perceived sweetness of fruits determines its flavour intensity and can be described by its SSC/TA ratio. This ratio slightly increased during ripening. Moreover, it is known that the flavour of fruits depends on the SSC level at harvest [7, 9, 20].The higher the SSC level, the more the fruits were appreciated by consumers. Therefore, the perception of the taste of the tested strawberries could be attributed to their internal layer because the SSC/TA ratio was not only significantly higher in the internal tissues but also followed the evolutionary pattern of their SSC values.
The evolutionary profiles of TPC and AC level during fruit ripening were similar but TAC were different (Fig. 1). The results demonstrated a high correlation observed (R2 = 0.96, p-value <0.0001). It confirmed the observation that TPC could be the major contributors to the antioxidant activity level of strawberries [2]. High levels of TPC were found in the external layer of white fruits. These levels decreased during ripening, until the fruits reach the 100%-red stage. In contrast, this level was very low at the beginning of the ripening process and increased during fruit maturation in the internal layer. The same tendencies are observed for the AC values. The comparison of these results with the TAC curve can be led to the hypothesis that the phenolic compounds synthetized in the internal tissues during the maturation process were probably mainly anthocyanins. Among the major classes of phenolic compounds, anthocyanins have been reported to be the most predominant in ripe strawberries [2, 21–23]. These phytochemical compounds were detected at the 50%-red stage, and their levels increased beyond the 100%-red stage, confirming the results of Yoshida et al. [14]. The increase in the total anthocyanin content appeared to correlate with the decrease in the total phenolic content. Indeed, the main phenolic compounds present in the external tissues at the 0% - and 10%-red stages were simple phenolic compounds, such as gallic acid [24] and coumaric acid [25], which are known to be the precursors of the main polyphenolic classes of compounds found in strawberries. These results were consistent with those obtained by Montero et al. [26]. Consequently, anthocyanin compounds contributed to the AC after the strawberries reached the 50%-red stage, first in the external layer (negative correlation; slope with r2 = 0.51) and later in the internal layer of the fruits (positive correlation: slope withr2 = 0.83).
3.2Evolution of the contents of the major individual phenolic compounds
Several research groups have characterised and determined the levels of individual phenolic compounds in strawberries, either to study the effects of the cultivar, cultivation method or environment [11, 16, 27, 28]. Other studies have focused on the evolution of the phenolic-compound profile during fruit development [4, 11, 26, 30–32].
As shown in the chromatograms of the polyphenol compounds detected using different wavelengths (Fig. 2), most of these compounds first accumulated in cells of the external fruit layer during the earlier ripening stages. The polyphenol compounds accumulated later in the cells of the internal layer. For example, peaks 3 to 10 were not detected before the 50% red stage in extracts of the same concentration (black line, Fig. 2A),whereas these peaks could be quantified at the 100%-red stage (black line, Fig. 2C). Additionally, the height of peaks 1 and 2 was considerably greater in chromatograms representing the external tissue (red line, Fig. 2D) than in those representing the internal tissue (black line, Fig. 2D) of fruits at the 100%-red stage. Large changes in the phytochemical constituents present at the 50% - and 100%-red stages were observed, as shown by the evolution of peaks 1 and 2 in the chromatograms representative of the external layer of the fruits (red lines, Fig. 2B and 2D). These observations confirmed those of other studies showing that anthocyanins accumulated during fruit development and ripening [13, 14, 26]. Fruits that develop more slowly and have a longer ripening period appeared to accumulate more anthocyanins. Unfortunately, none of the relevant studies characterised the evolution of the anthocyanin profile during fruit maturation.
In this investigation, the level of each identified polyphenol compound in the different tissue layers was determined, and the results are shown in Table 2. Among the polyphenol compounds analysed, the levels of the identified anthocyanin compounds were significantly higher in the external and internal tissues of mature fruits compared with those in immature fruits. Nevertheless, their abundance levels during fruit development distinctly differed. Fruit at the 100%-red stage had a high level of pelargonidin derivatives, whereas fruits at the 0% - to 50%-red stages had very low tissue levels of these compounds. These observations indicated that these compounds were synthesised only when the fruits began to gain colour, confirming the results of Yoshida et al. [14]. The coloration of fruits is due to their accumulation of anthocyanins. The increase in the levels of pelargonidin-3-glucoside and pelargonidin-3-malonylglucoside during fruit development was demonstrated in the HPLC-DAD chromatograms and these compounds were further identified using MSD-API-ESI (Table 1). In contrast, the level of cyanidin-3-glucoside in the external tissue did not change during fruit development. In the internal tissue, the level of cyanidin-3-glucoside increased from the 100%-red stage and reached its maximum at the purple-red stage. These results can explain the colour changes that occur within the internal tissue during the ripening process because both of these compounds, particularly the cyanidin-like compounds, have been reported to affect the level of red colouration of strawberries [31]. These observations are consistent with those of previous studies [30, 31] regarding the total content of each compound evaluated in this study. The increase in the levels of these anthocyanin compounds in the internal tissues of the strawberries was consistent with the observed evolution of the total anthocyanin and phenolic compound profiles during their ripening, which resulted in the demonstrated increase in their antioxidant capacity (Fig. 1). Pelargonidins are known to be the major contributors, among the anthocyanins, to the antioxidant capacity of ripe strawberry fruits [2]. Moreover, these results strengthened the evidence that a longer fruit-development period increased the level of anthocyanins in the fruits[13, 14, 26].
Ellagitannins, which are considered to be health-promoting compounds, were also present in the fruits of the ‘Clery’ cultivar [2, 33]. Free ellagic acid was found only in the external tissue, whereas the dimer of gallyol-bis-hexahydroxydiphenic acid (sanguiin H-6 or agrimoniin) was found in both of the fruit layers (Tables 1 and 2).The presence of the dimer of gallyol-bis-hexahydroxydiphenic acid in both tissue layers suggested that this compound was present at the beginning of fruit development. Interestingly, the total ellagitannin content of the external tissue tended to decrease when the fruits were overripe. Williner et al. reported that the ellagic acid content of green fruit was higher than that of fully ripe fruit [34]. The content of the dimer of gallyol-bis-hexahydroxydiphenic acid in the external tissue tended to decline during the fruit-ripening progress, in contrast to what occurred in the internal tissue, in which the highest concentration was recorded at the 100%-redstage.
The evolution of the quercetin-3-glucuronide content changes during fruit development was the same as that of the ellagic acid content. These compounds are only present in the external tissues suggesting that these compounds were synthesised mostly in the outer layer from the beginning of fruit development. It is important to note that these compounds are known to be abundant in strawberries and that their levels are highly correlated with the level of antiradical activity [2, 35]. To our knowledge, this study is the first to demonstrate the presence of quercetin-3-glucoronide only in the external layer of strawberry fruits.
The presence of cinnamic-acid derivatives in strawberry fruits was noted in previous reports [24, 36]. The evolution of the cinnamic-acid derivative profile observed in the present study was completely different from that of all of the other compounds that were evaluated. The concentration of cinnamic-acid derivatives in both the external and internal tissues slowly changed until the strawberries reached the 50%-red stage and then appeared to dramatically increase in both tissue layers, but particularly in the internal layer. The content of these compounds was also significantly different in the internal tissue of fruits of the 100%-red and PRstages.
All these finding were well illustrated by the Fig. 3. The external tissues of mature fruits (ext 100% and ext PR) were characterized by the pelagonidin derivatives compounds and the internal tissues by the cyaniding-3-glucoside. The ellagic acid and the quercetin-3-glucuronide contents were only present in the external tissues and the cinnamic-acid derivatives were specific to the internal mature tissues.
3.3Relationships between the content of bioactive compounds and the antioxidant capacity
The variations in the contents of bioactive compounds during the fruit-ripening process indicated that the rate of production of phytochemical compounds depended up on the maturation stage of the fruits. Giampieri et al. stated that vitamin C contributed more than 30% of the total antioxidant capacity of strawberries, followed by anthocyanins, which contributed 25% to 40% of this capacity, with the rest of this capacity contributed by ellagitannins and flavonols [2]. In this study, the contents of the identified flavonol and ellagitannin compounds tended to decrease as fruit maturation progressed, whereas those of the anthocyanins drastically increased (Table 2) and clearly discriminated the outer layer of the fruits. These results demonstrated the important contributions of the anthocyanins to the antioxidant activity of mature fruits. This phytochemical group constituted 70% of the identified compounds at the 100%-red stage, with pelargonidin-3-glucoside as the dominantcompound.
These observations indicated that fruits picked when they were at a level of less-than-100%-red stage had a lower content of bioactive compounds than did those picked at later stages. Indeed, the contents of anthocyanins in every type of tissue of fruits at a later maturation stage were significantly higher than were those of fruits at an earlier stage. Anthocyanins were the predominant polyphenolic compounds identified in this study (Fig. 2C and D)and as was reported in several studies of other varieties of fruit, these molecules may be the main contributors to the antioxidant activity of the studied fruit variety [11, 16, 35]. In addition, the activities of the anthocyanins were strengthened by the activity of the dimers of gallyol-bis-hexahydroxydiphenic acid and cinnamic-acid derivatives. The level of dimers of gallyol-bis-hexahydroxydiphenic acid reached a maximum from the 100%-red stage in the internal tissues of the studied fruits, and the content of cinnamic-acid derivatives significantly increased during fruit development (Table 2).
4Conclusions
This study demonstrated that the bioactive compound contents of the external and internal tissues of a fruit were very different. The external fruit layer generally had higher levels of the taste-related and bioactive compounds compared with those of the internal fruit layer, from the beginning to the end of the fruit-ripening process. A change in the bioactive-compound levels began during the 50%-red stage, during which the total phenolic content decreased and the total anthocyanin content increased. Identifying and quantifying the major individual polyphenolic compounds present revealed that compounds identified as ellagic acid and quercetin-3-glucoronide distinguished the external fruit tissue from the internal fruit tissue. Pelargonidin derivatives, which strongly contributed to the antioxidant capacity of the fruit, were present from the 50%-red stage, and their content had increased dramatically by the 100%-red stage, particularly in the purple-redfruits.
The evolution of the taste-related and bioactive compound profiles within the internal fruit layer followed the maturation pattern of the fruit. The evolution of the pelargonidin-glucoside profile correlated with the developmental stages of the fruit. These compounds were present from the 50%-red stage and their levels were dramatically increased in fruits of the 100%-red and purple-fruit stages. However, their levels were slightly lower in the external than in the internal layer of the fruit, suggesting that these compounds were synthesised within the external tissue of the fruit and then later spread throughout the fruit.
Moreover, the fact that the pelargonidin compounds were present in the fruits from the 50%-red stage and that their levels were increased in the purple-red stage suggested that there was a relationship between their level of expression and fruit development. The levels of these compounds in fruits that ripened slowly was higher than that of the fruits that ripened more rapidly. These observations strengthened the hypothesis mentioned in previous reports demonstrating that fruits with a longer ripening time accumulated a higher level of anthocyanins [13, 14].
In practical terms, the results of this study indicated that picking fruits at the 100%-red stage is recommended for their fresh consumption considering the contents of their taste- and health-related compounds. In the case of processed fruits, this study indicated that picking fruits that will be processed later than the 100%-red stage was advantageous regarding their content of health-promoting compounds.
Acknowledgments
The authors thank Christoph Auderset and Eliane Filliez-Tornay for their technical assistance and Véronique Varone for her assistance in the laboratory.
References
[1] | Tulipani S , Mezzetti B , Battino M . Impact of strawberries on human health: Insight into marginally discussed bioactive compounds for the mediterranean diet. Public Health Nutrition. (2009) ;12: (9A):1656–62. |
[2] | Giampieri F , Tulipani S , Alvarez-Suarez JM , Quiles JL , Mezzetti B , Battino M . The strawberry: Composition, nutritional quality, and impact on human health. Nutrition. (2012) ;28: :9–19. |
[3] | Kallio H , Hakala M , Pelkkikangas AM , Lapvetelainen A . Sugars and acids of strawberry varieties. European of Food Research and Technologies. (2000) ;212: (1):81–5. |
[4] | Cordenunsi BR , Donascimento JRO , Genovese MI , Lajolo FM . Influence of cultivar on quality parameters and chemical composition of strawberry fruits grown in Brazil. Journal of Agricultural and Food Chemistry. (2002) ;50: (9):2581–6. |
[5] | Carlen C , Ançay A . Measurement of the sensory quality of strawberries. Acta Horticulturae. (2003) ;604: :353–60. |
[6] | Bordonaba JG , Terry LA . Development of a glucose biosensor for rapid assessment of strawberry quality: Relationship between biosensor response and fruit composition. Journal of Agricultural and Food Chemistry. (2009) ;57: (18):8220–6. |
[7] | Gunness P , Kravchuk O , Nottingham SM , D’Arcy BR , Gidley MJ . Sensory analysis of individual strawberry fruit and comparison with instrumental analysis. Postharvest Biology and Technologies. (2009) ;52: :164–72. |
[8] | Carlen C , Potel AM , Ançay A . Influence of leaf/fruit ratio of strawberry plants on the sensory quality of their fruits. Acta Horticulturae. (2007) ;761: :121–6. |
[9] | Kafkas E , Kosar M , Paydas S , Kafkas S , Baser KHC . Quality characteristics of strawberry genotypes at different maturation stages. Food Chemistry. (2007) ;100: (3):1229–36. |
[10] | Tulipani S , Marzban G , Herndl A , Laimer M , Mezzetti B , Battino M . Influence of environmental and genetic factors on health-related compounds in strawberry. Food Chemistry. (2011) ;124: :906–13. |
[11] | Crespo P , Bordonaba JG , Terry LA , Carlen C . Characterization of major taste and health-related compounds of four strawberry genotypes grown at different Swiss production sites. Food Chemistry. (2010) ;122: (1):16–24. |
[12] | Pincemail J , Kevers C , Tabart J , Defraigne JO , Dommes J . Cultivars, culture conditions, and harvest time influence phenolic and ascorbic acid contents and antioxidant capacity of strawberry (Fragaria x ananassa). Journal of Food Science. (2012) ;77: (2):205–10. |
[13] | Andrianjaka-Camps ZN , Crespo P , Ançay A , Carlen C . Strawberry Clery’ Fruit Quality Evolution During Harvest. Acta Horticulturae. SHE. Ed. ISHS, Leuven. December; (2012) . |
[14] | Yoshida Y , Koyama N , Tamura H . Color and anthocyanin composition of strawberry fruit: Changes during fruit development and differences among cultivars, with special reference to the occurrence of pelargonidin 3-malonylglucoside. Journal of the Japanese Society for Horticultural Science. (2002) ;71: (3):355–61. |
[15] | Malien-Aubert C , Dangles O , Amiot MJ . Color stability of commercial anthocyanin-based extracts in relation to the phenolic composition. Protective effects by intra and intermolecular copigmantation. Journal of Agricultural and Food Chemistry. (2001) ;49: :170–6. |
[16] | Tulipani S , Mezzetti B , Capocasa F , Bompadre S , Beekwilder J , De Vos CHR , Capanoglu E , Bovy A , Battino M . Antioxidants, phenolic compounds, and nutritional quality of different strawberry genotypes. Journal of Agricultural and Food Chemistry. (2008) ;56: (3):696–704. |
[17] | Lee J , Durst RW , Wrolstad RE . Determination of total monomeric anthocyanin pigment content of fruit juices, beverages, natural colorants, and wines by the pH differential method: A collaborative study. Journal of AOAC International. (2005) ;88: (5):1269–78. |
[18] | Brand-Williams W , Cuvelier ME , Berset C . Use of a free-radical method to evaluate antioxidant activity. Food Science and Technology. (1995) ;28: (1):25–30. |
[19] | Perkins-Veazie P . Growth and ripening strawberry fruit. Horticulturae Review. (1995) ;7: :267–96. |
[20] | Carlen C , Potel AM , Bellon C , Ançay A . Qualité des fraises: Effets de la variété, du rapport feuilles/fruit, de la période de récolte et du stade de maturité. Révue Suisse Viticulture Arboriculture Horticulture. (2005) ;37: (2):87–93. |
[21] | Wang SY , Lin HS . Antioxidant activity in fruits and leaves of blackberry, raspberry, and strawberry varies with cultivar and developmental stage. Journal of Agricultural and Food Chemistry. (2000) ;48: (2):140–6. |
[22] | Lopez da Silva F , Escribano-Bailon MT , Alonso JJP , Rivas-Gonzalo JC , Santos-Buelga C . Anthocyanin pigments in strawberry. Lwt-Food Science and Technology. (2007) ;40: (2):374–82. |
[23] | Crespo P , Ançay A , Carlen C , Stamp P . Strawberry cultivar response to tunnel cultivation. Acta Horticulturae. (2009) ;838: :77–82. |
[24] | Huang WY , Zhang HC , Liu WX , Li CY . Survey of antioxidant capacity and phenolic composition of blueberry, blackberry and strawberry in Nanjing. Biomedecine and Biotechnology. (2012) ;13: (2):94–102. |
[25] | Aaby K , Ekeberg D , Skrede G . Characterization of phenolic compounds in strawberry (Fragaria x ananassa) fruits by different HPLC detectors and contribution of individual compounds to total antioxidant capacity. Journal of Agricultural and Food Chemistry. (2007) ;55: (11):4395–406. |
[26] | Montero TM , Molla EM , Esteban RM , Lopezandreu FJ . Quality attributes of strawberry during ripening. Scientia Horticulturae. (1996) ;65: (4):239–50. |
[27] | Kelebek H , Selli S . Characterization of phenolic compounds in strawberry fruits by RP-HPLC-DAD and investigation of their antioxidant capacity. Journal of Liquid Chromatography and Related Technologies. (2011) ;34: :2495–504. |
[28] | Kosińska A , Diering S , Héritier J , Prim D , Andlauer W . Phenolic Compounds Profile of Strawberry Fruits of Charlotte Cultivar. Journal of Berry Research. (2013) ;3: :15–23. |
[29] | Josuttis M , Carlen C , Crespo P , Nestby R , Toldam-Andersen TB , Dietrich H , Krüger E . A comparison of bioactive compounds of strawberry fruit from Europe affected by genotype and latitude. Journal of Berry Research. (2012) ;2: :73–95. |
[30] | Kosar M , Kafkas E , Paydas S , Baser KHC . Phenolic composition of strawberry genotypes at different maturation stages. Journal of Agricultural and Food Chemistry. (2004) ;52: (6):1586–9. |
[31] | Nunes MCN , Brecht JK , Morais AMMB , Sargent SA . Physiocochemical changes during strawberry development in the field compared with those that occur in harvested fruit during storage. Journal of the Science of Food and Agriculture. (2006) ;86: :180–90. |
[32] | Ferreyra RM , Vina SZ , Mugridge A , Chaves AR . Growth and ripening season effects on antioxidant capacity of strawberry cultivar Selva. Scientia Horticulturae. (2007) ;112: (1):27–32. |
[33] | Vrhovsek U , Guella G , Gasperotti M , Pojer E , Zancato M , Mattivi F . Clarifying the identity of the main ellagitannin in the fruit of the strawberry, Fragaria vesca and Fragaria ananassa Duch. Journal of Agricultural and Food Chemistry. (2012) ;60: :2507–6. |
[34] | Williner MR , Pirovani ME , Güemes DR . Ellagic acid content in strawberries of different cultivars and ripening stages. Journal of the Science of Food and Agriculture. (2003) ;83: :842–5. |
[35] | Jakobek L , Seruga M . Influence of anthocyanins, flavonols and phenolic acids on the antiradical activity of berries and small fruits. International Journal of Food Proprieties. (2012) ;15: :122–33. |
[36] | Cheel J , Theoduloz C , Rodriguez J , Saud G , Caligari PDS , Schmeda-Hirschmann G . E-cinnamic acid derivatives and phenolics from Chilean strawberry fruits, Fragaria chiloensis schiloensis. Journal of Agricultural and Food Chemistry. (2005) ;53: (22):8512–8. |
[37] | Aaby K , Wrolstad RE , Ekeberg D , Skrede G . Polyphenol composition and antioxidant activity in strawberry purees; impact of achene level and storage. Journal of Agricultural and Food Chemistry. (2007) ;55: (13):5156–66. |
Figures and Tables
Fig.1
Evolution of the taste-related and bioactive compounds in the internal and external tissues during stages of ripening strawberry fruits. Points represent means of four replications. Per replication more than 10 fruits were considered. Letters indicate a significant difference (Tukey test, p < 0.01) between the ripening stages. SSC means soluble solid contents; TA the titratable acidity contents; AC the antioxidant capacity; CAE the citric acid equivalent; EAE the ellagic acid equivalent; P3GE the pelargonidin-3-glucoside equivalent; TE the trolox equivalent; ext the external fruit tissues; int the internal fruit tissues; FW the fresh weight and PR the purple red.
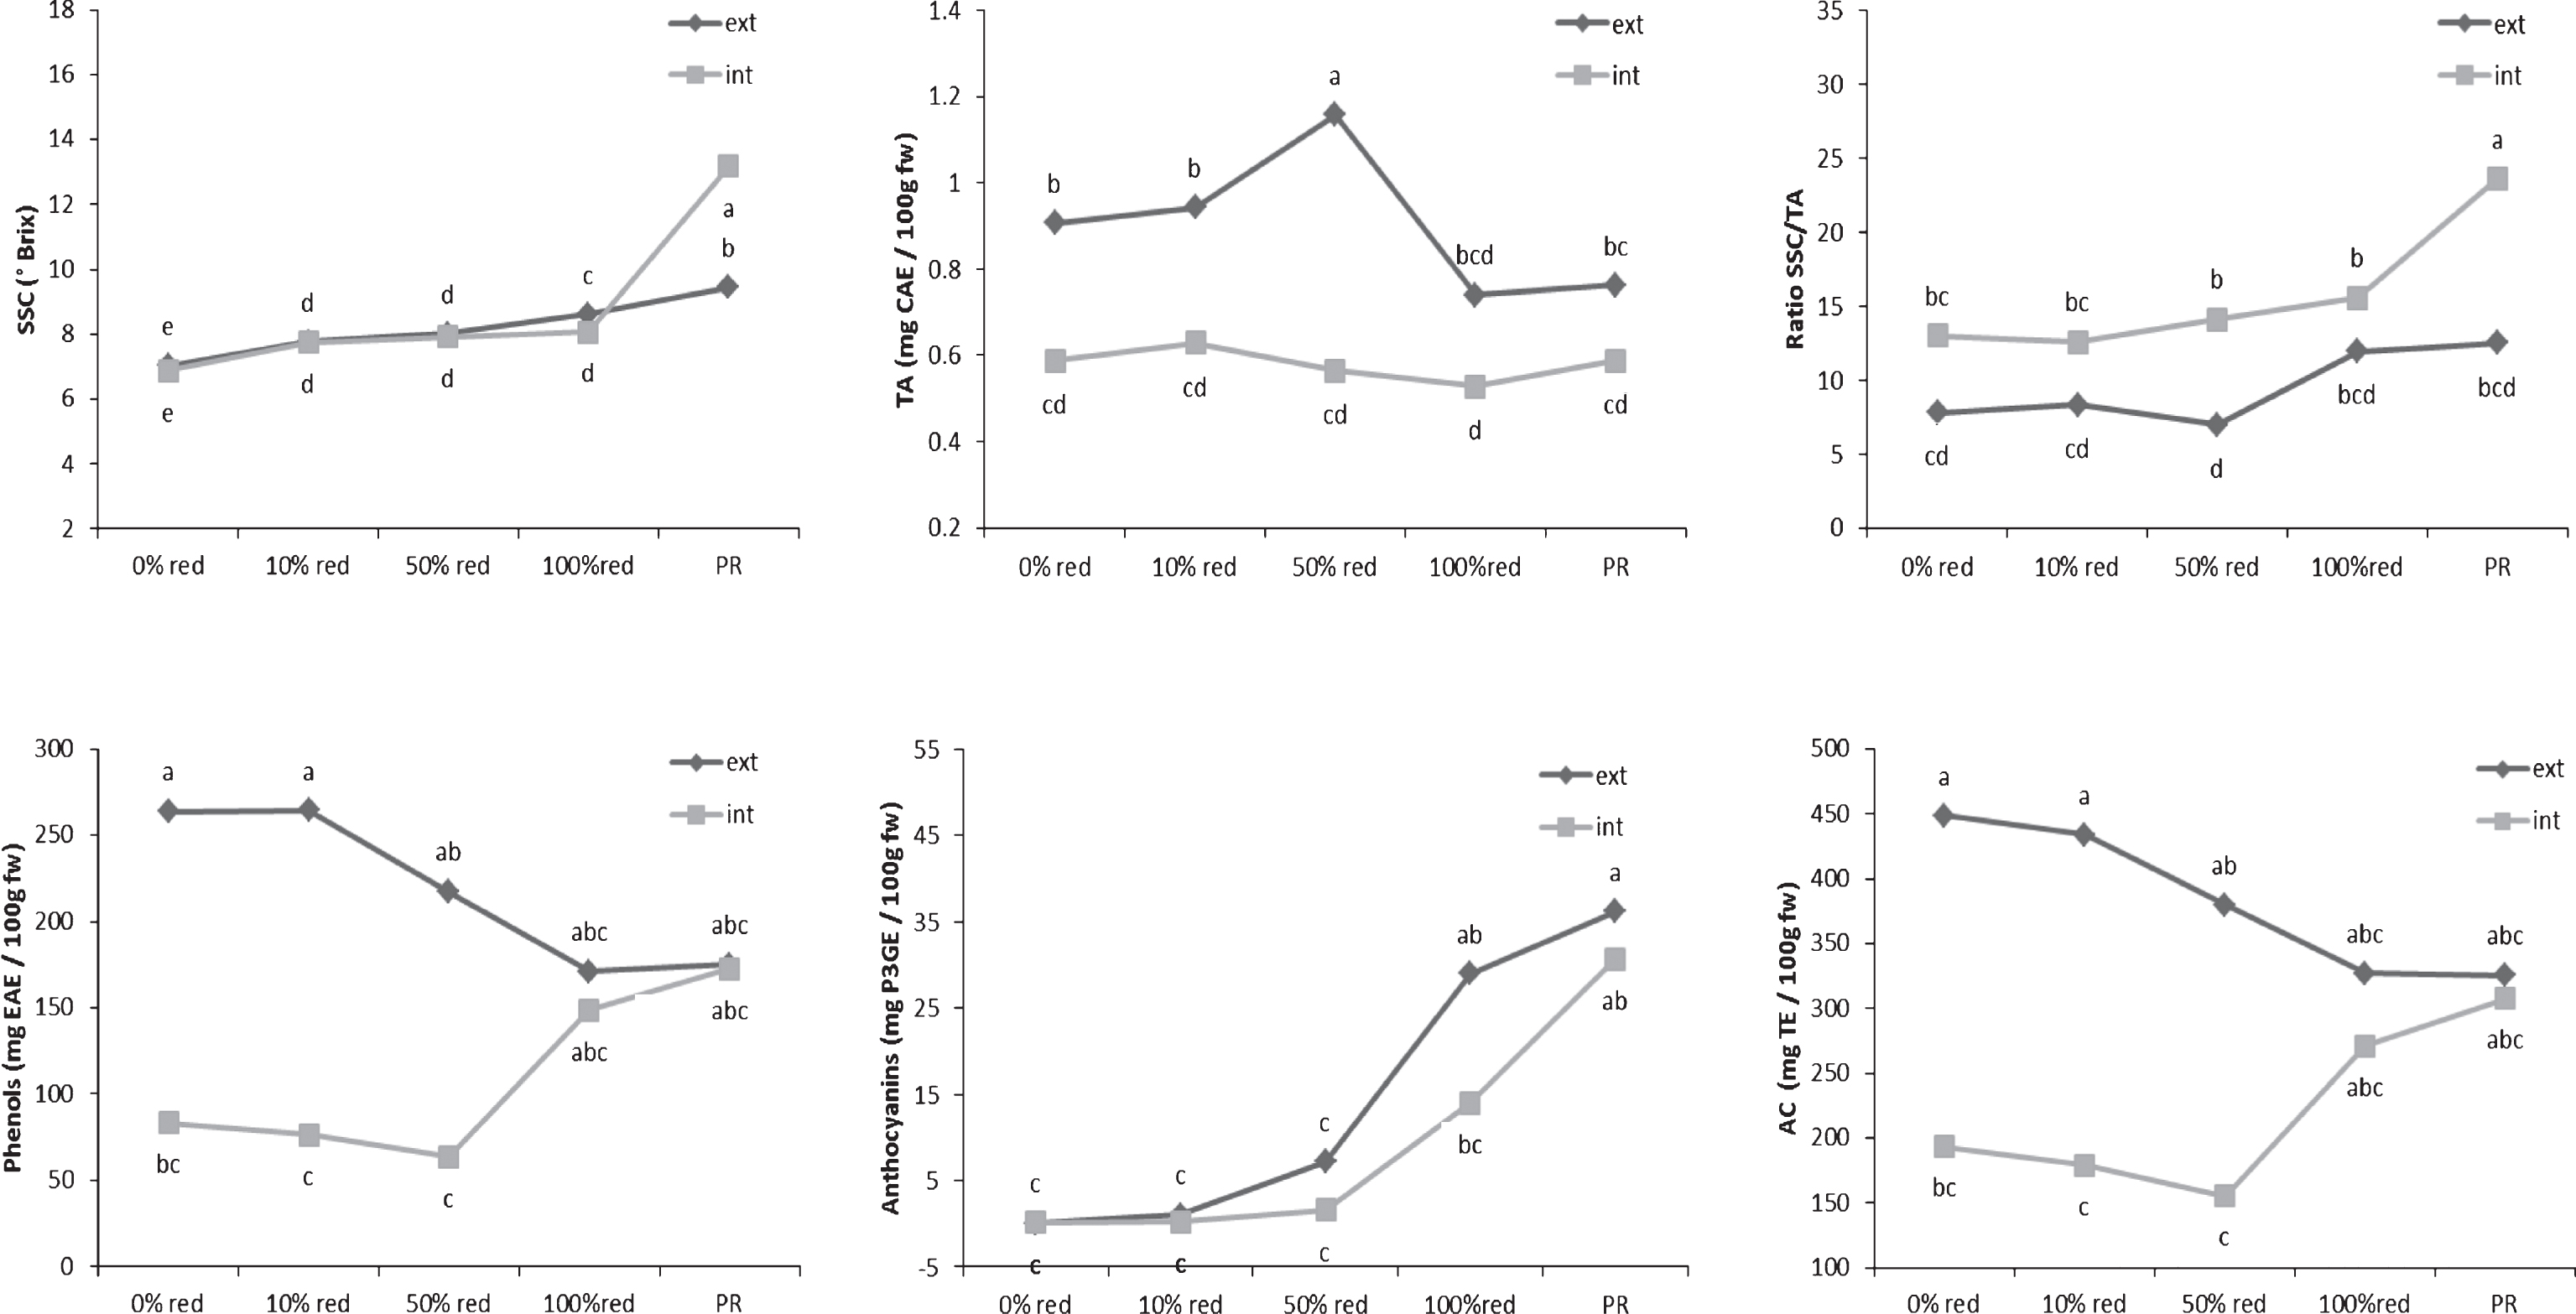
Fig.2
HPLC-DAD chromatograms of polyphenols in 50% red (A and B) and 100% red (C and D) stages recorded at 260 nm (A and C) and 500 nm (B and D). X-axis represents the retention time (min) and Y-axis the absorbance. Black lines indicate internal tissues and red lines external tissues. Peak numbers refer to Table 1.
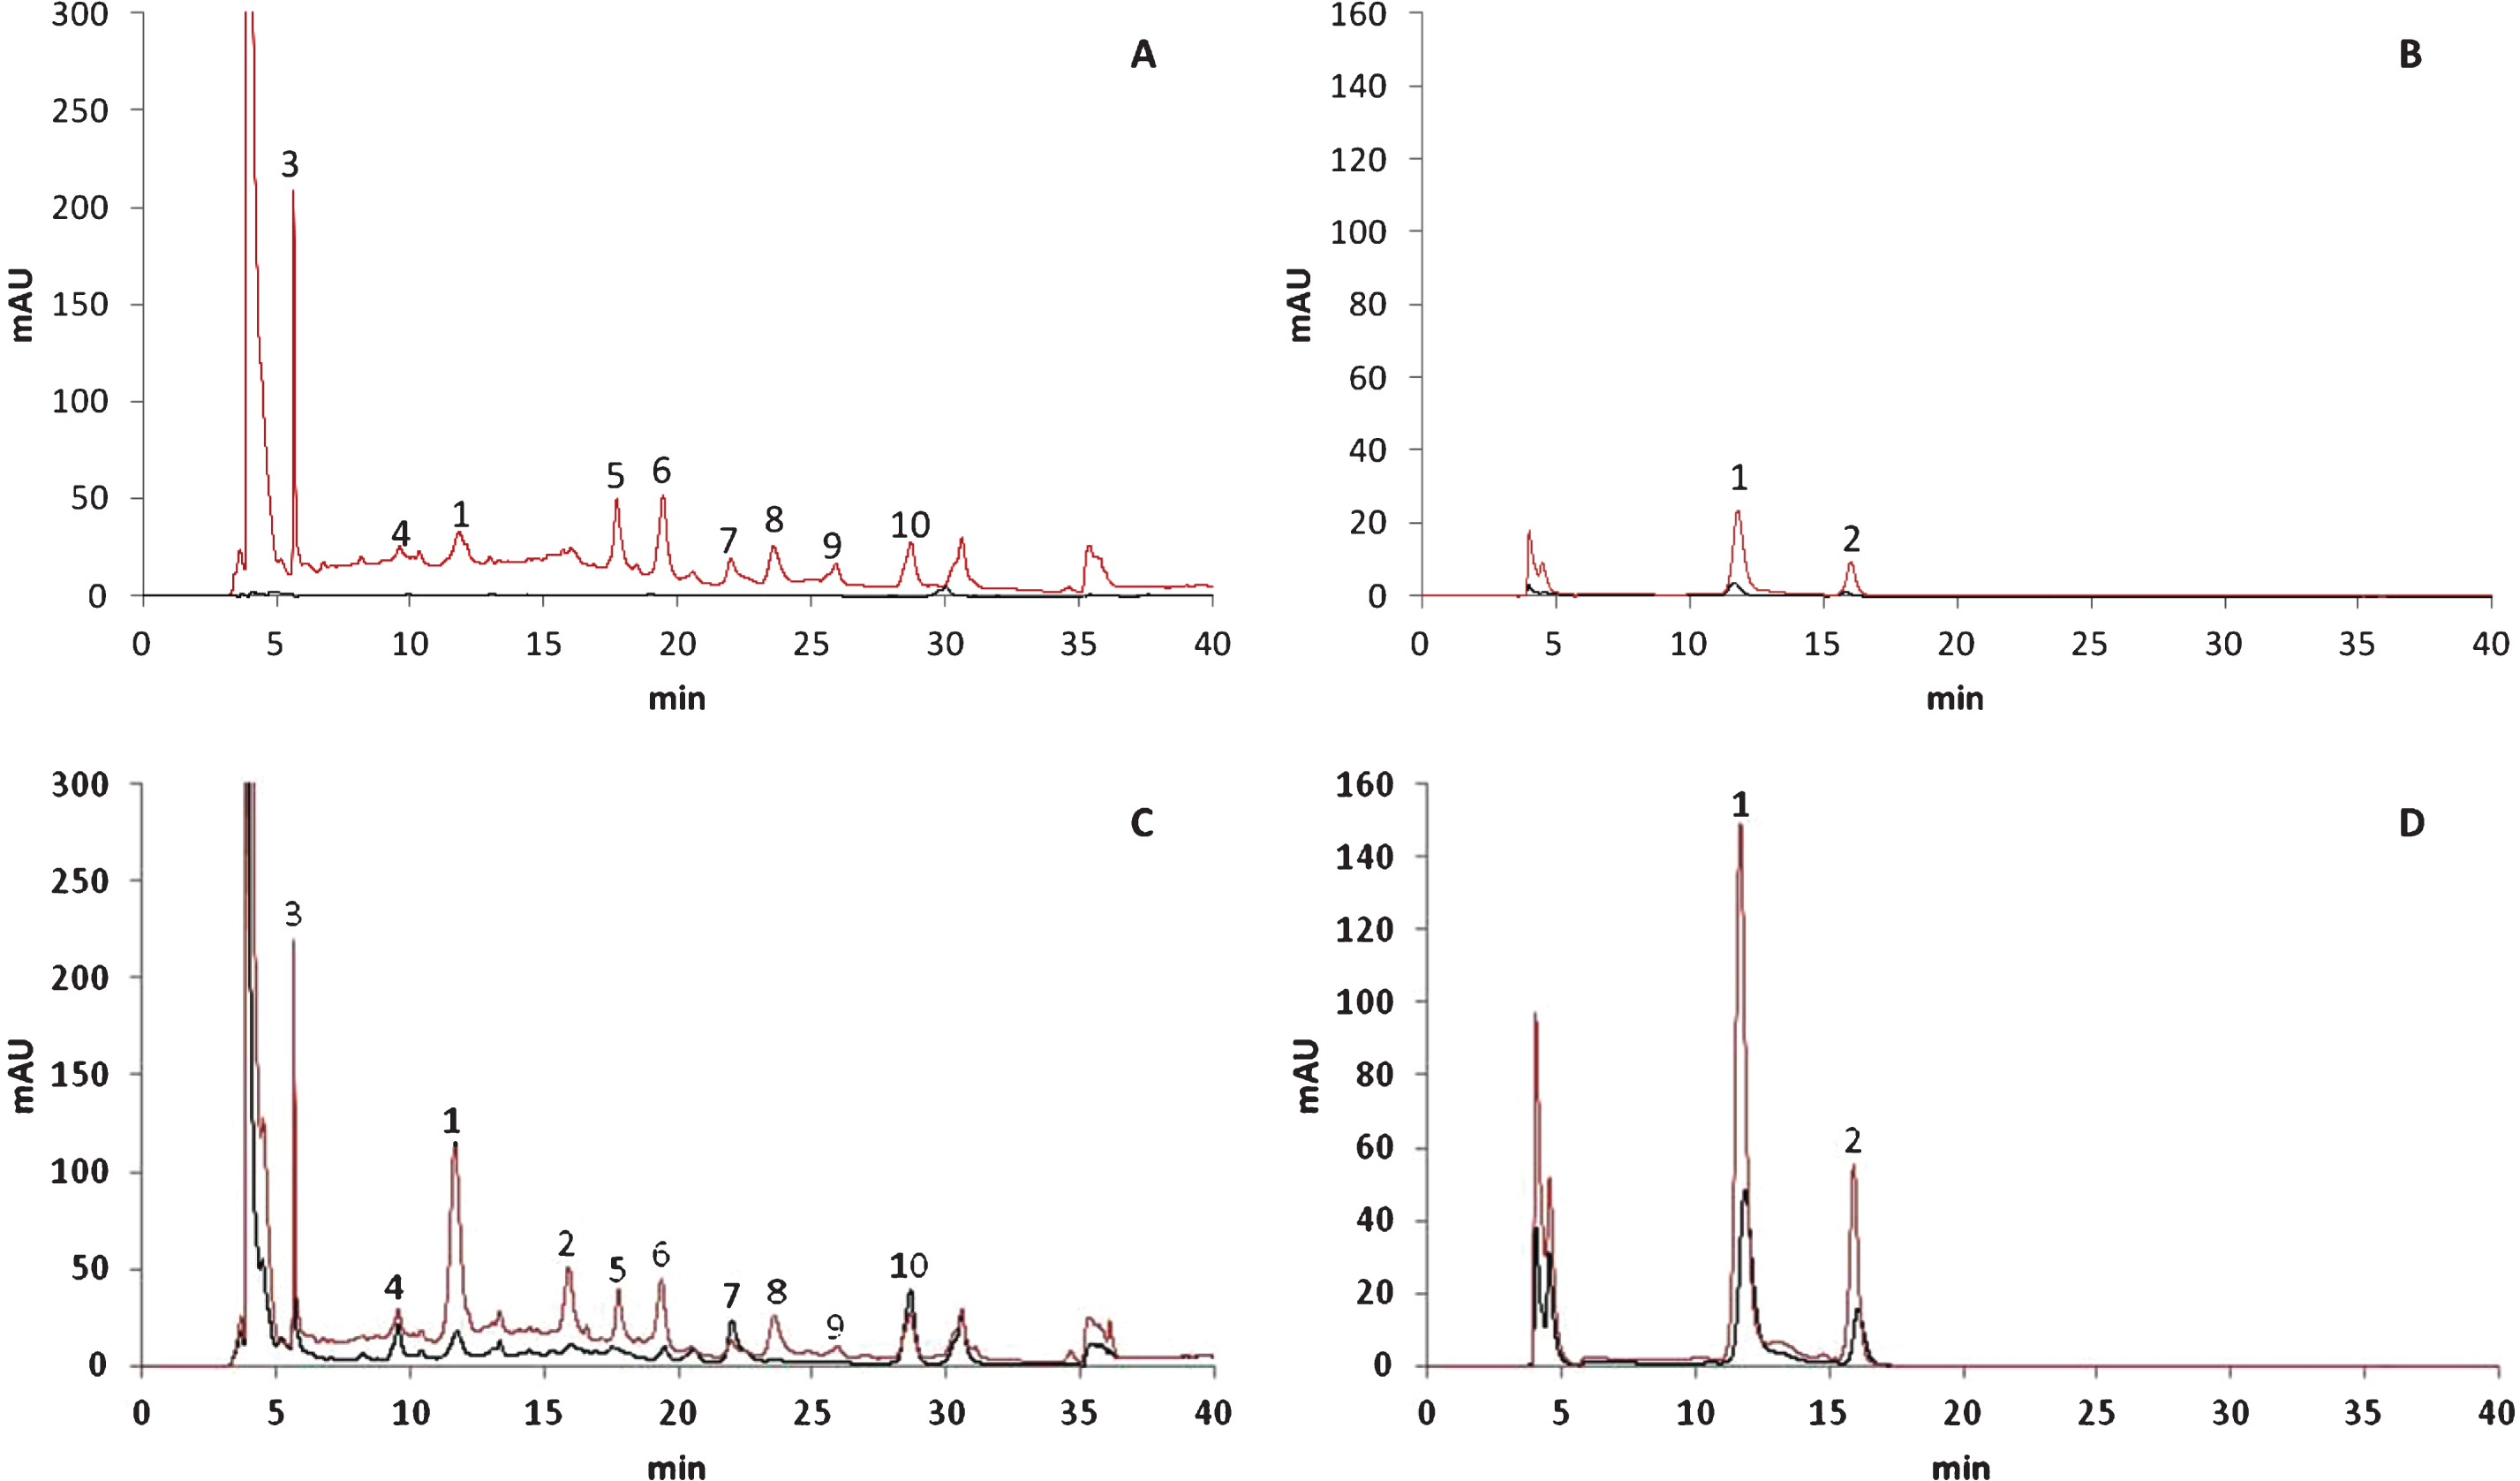
Fig.3
Factorial discriminant analysis of the phenolic compounds content in the external and internal tissues at different fruit ripening stages.
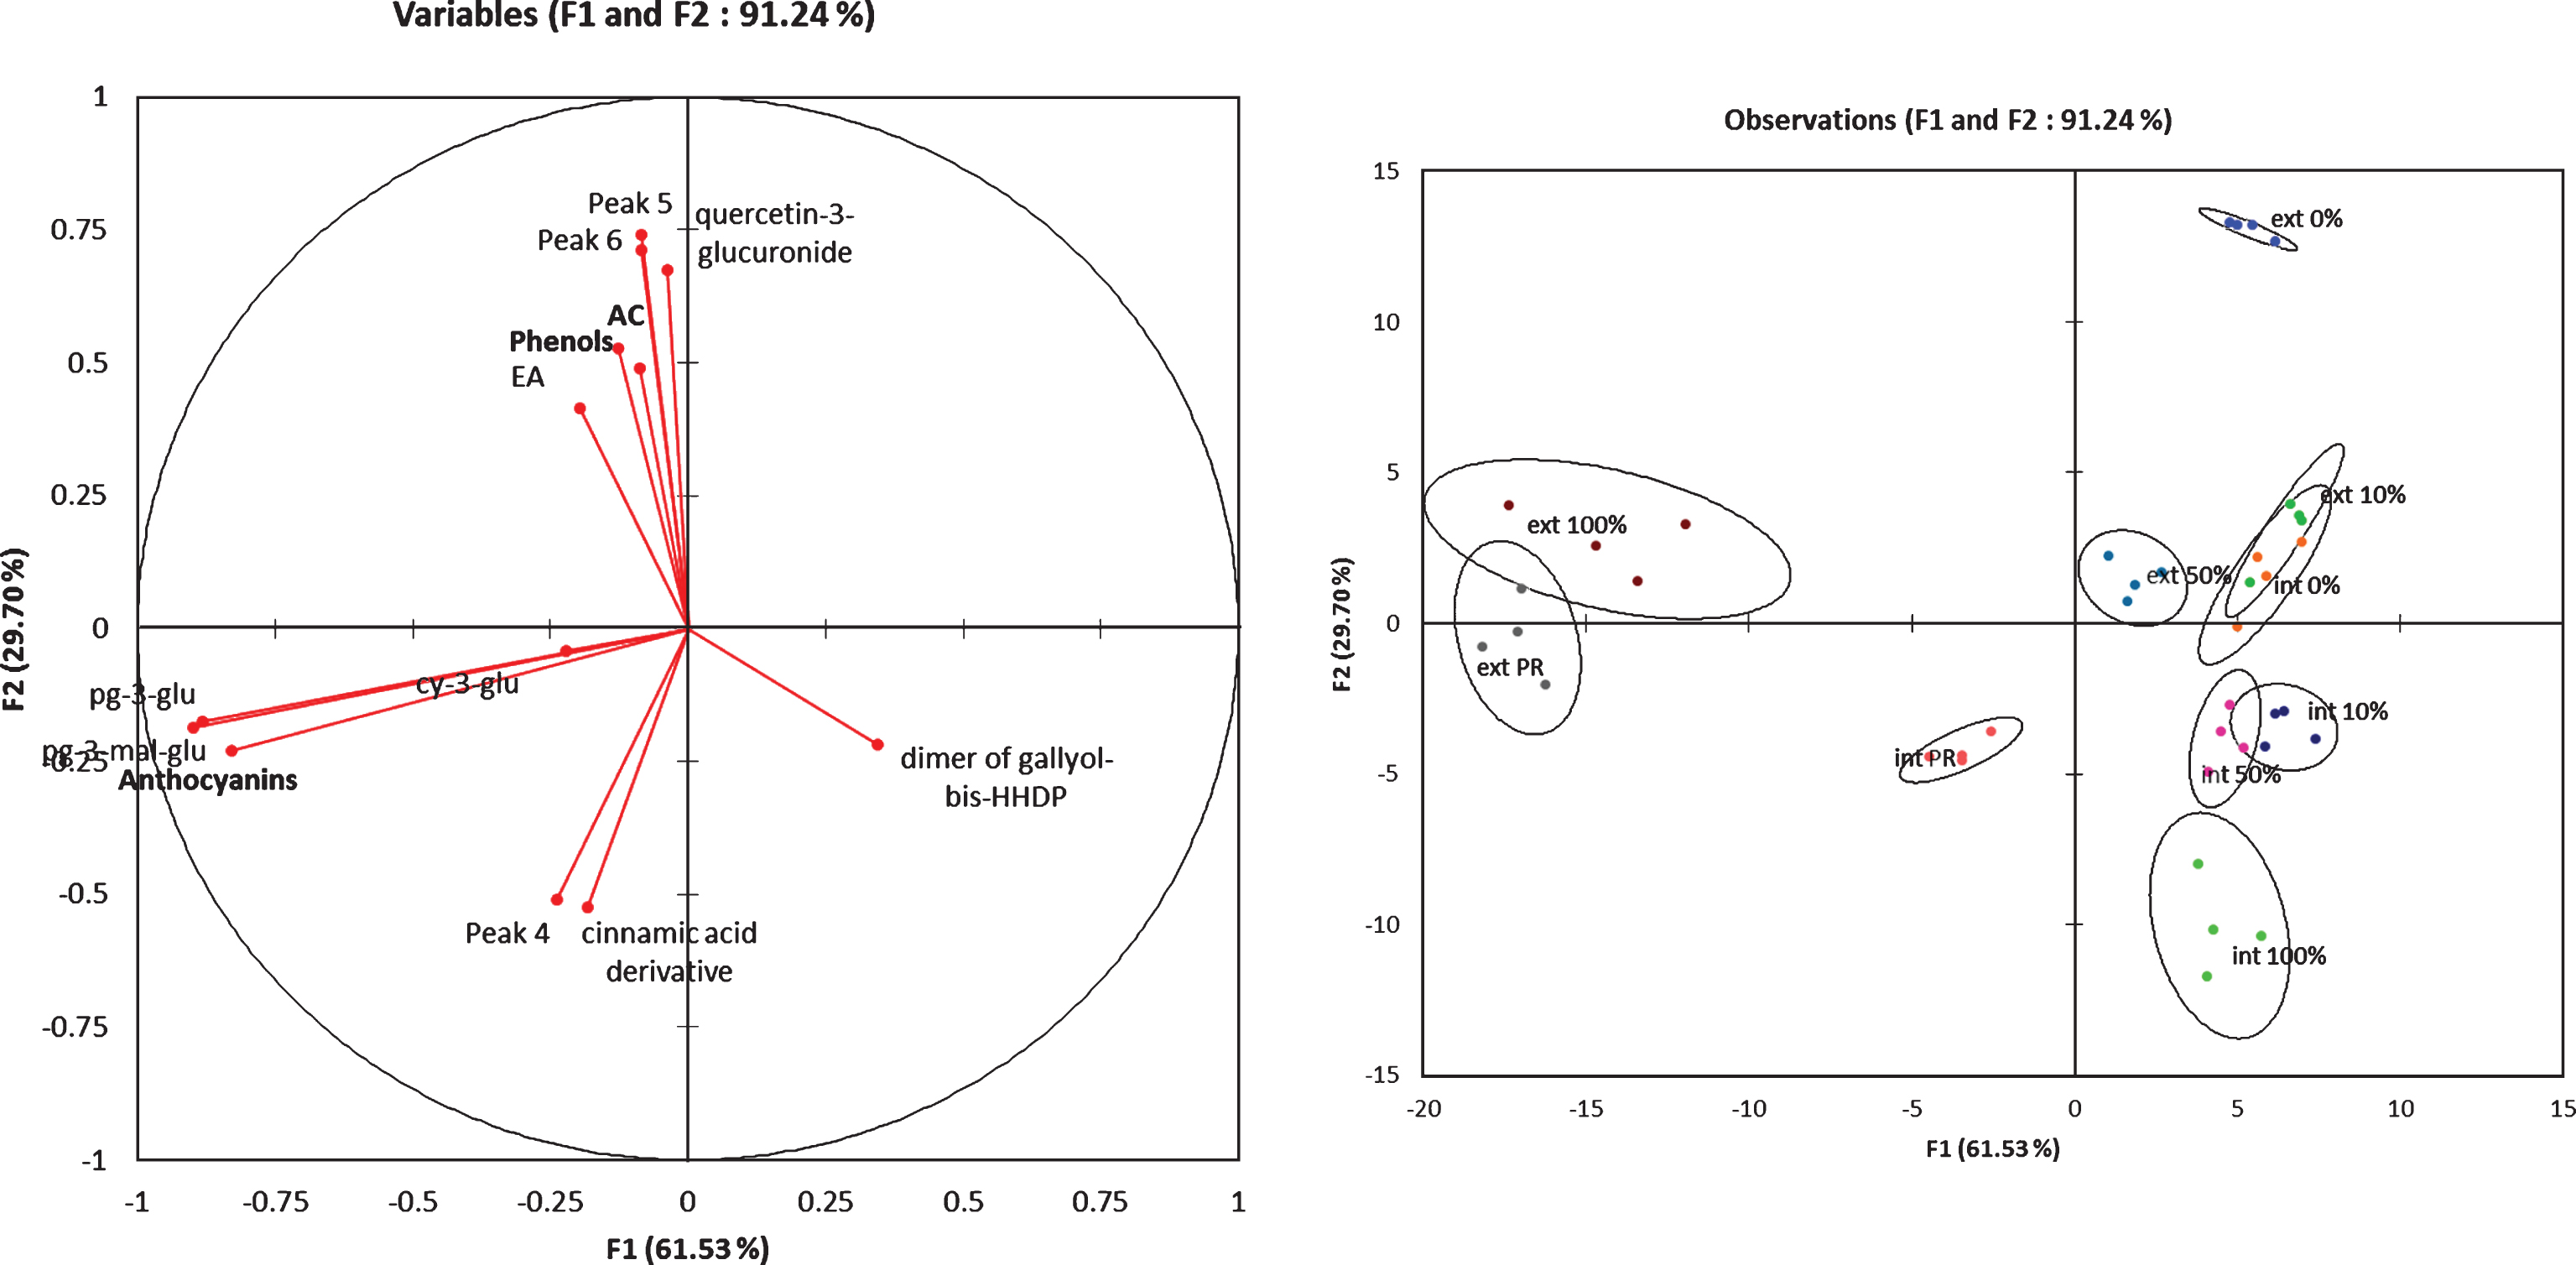
Table 1
Identification of major individual phenolic compounds in methanol extract using HPLC-DAD and MS-API-ESI detection
| Wavelenght | Peak n° | tR (min) | λmax | MW (m/z) | Fragment | Tentative identification | References |
| (nm) | found (m/z) | ||||||
| 500 nm | 1 | 11.7 | 502 432sh 328 278 | 433 | 271 | pelargonidin-3-glucoside (P3G) | Aaby et al. (2007a, 2007b); Lopez da Silva et al. (2007) |
| 2 | 15.9 | 503 430sh 268 | 519 | 271 | pelargonidin-3-malonylglucoside (P3MG) | Aaby et al. (2007a, 2007b); Lopez da Silva et al. (2007) | |
| 260 nm | 3 | 5.6 | 516 280 | 449 | 287 | cyanidin-3-glucoside (C3G) | Aaby et al. (2007a, 2007b); Lopez da Silva et al. (2007) |
| 4 | 9.6 | 310sh 280 | – | – | unknown | ||
| 5 | 17.8 | 280 | – | – | unknown | ||
| 6 | 19.2 | 365 280 | – | – | unknown | ||
| 7 | 21.9 | 280 | 1869 | 934, 275 | dimer of gallyol-bis- hexahydroxydiphenicacid (sanguiin H-6 or agrimoniin) | Aaby et al. (2007a); Vrhovsek et al. (2012) | |
| 8 | 23.5 | 368 254 | 302 | 284 | ellagic acid (EA) | Aaby et al. (2007a) | |
| 9 | 25.7 | 354 260 | 478 | 434, 301 | quercetin-3-glucuronide (Q3G) | Aaby et al. (2007a) | |
| 10 | 28.6 | 284 | – | 351, 309, 147 | Cinnamic acid derivative (CAD) |
Table 2
Content of identified phenolic compounds in the external and internal tissues at different fruit ripening stages
| Wavelength | 500 nm | 260 nm | |||||
| Tissues type | P3G | P3MG | C3G | dimer of gallyol-bis-HHDP | EA | Q3G | CAD |
| ext 0% | ND | ND | 5.66ab | 1.78ab | 1.79a | 1.96a | 1.00c |
| ext 10% | 0.72c | ND | 6.95ab | 1.66ab | 2.34a | 1.48a | 3.04bc |
| ext 50% | 3.66c | 1.49c | 5.67ab | 1.54ab | 1.88a | 1.29a | 3.03bc |
| ext 100% | 14.29ab | 4.91a | 5.51ab | 1.48ab | 1.88a | 0.98a | 2.65bc |
| ext PR | 16.93a | 5.58a | 6.31ab | 1.40b | 1.78a | 1.13a | 4.10abc |
| int 0% | ND | ND | 3.51b | 1.87ab | ND | ND | 1.05c |
| int 10% | ND | ND | 3.74b | 1.72ab | ND | ND | 2.72bc |
| int 50% | 1.12c | ND | 3.68b | 1.50ab | ND | ND | 3.23bc |
| int 100% | 6.89bc | 2.24bc | 6.12ab | 2.15a | ND | ND | 6.03ab |
| int PR | 14.13ab | 3.97ab | 9.22a | 1.92ab | ND | ND | 8.91a |
Means followed by different letters indicate a significant difference between the different tissues (p-value <0.01, Tukey test, n > 3). Pelargonidin-3-glucoside (P3G); pelargonidin-3-malonylglucoside (P3MG); quercetin-3-glucuronide (Q3G) and cinnamic acid derivative (CAD) are expressed in mg pelargonidin-3-glucoside equivalence per 100 g of fresh weight. Cyanidin-3-glucoside (C3G) is expressed in mg cyanidin-3-glucoside equivalence per 100 g of fresh weight. Ellagic acid (EA) and dimer of gallyol-bis-HHDP are expressed in mg ellagic acid equivalence per 100 g of fresh weight. ND means not detected.

