
Easy-to-install system for daily walking ability assessment using a distance sensor array
Walking is a fundamental daily activity of humans. Therefore, the walking ability is regarded as a valuable predictor of mortality rate and activities of daily living (ADL). In this paper, we propose a walking ability assessment system that can be installed easily in a home. The main component of this system is a low-cost distance sensor array, which allows walking speed and step length measurements. Furthermore, the proposed system can accurately extract regular walking data. Results of an experiment conducted with elderly people show that the system has adequate performance; Mean absolute relative errors are 6.5% (walking speed) and 3.8% (step length). Those superior results demonstrate that the proposed system can be a promising tool for daily assessment of walking ability.
1.Introduction
Walking, the most fundamental form of mobility, is extremely important for humans to maintain normal activity in society. Declining walking ability in older adults causes mobility limitation [17,19]. Thereby, it brings about functional limitations and disability [18]. Walking ability can be a predictor of mortality [9] and decline in activities of daily living (ADL) [7]. Concretely, walking speed and step length reportedly have a relation to survival rate and fall risk [14,25]. Moreover, that ability can be an index predicting cognitive decline [15] because walking is a complex cognitive task [10]. To summarize, “daily” assessment of walking ability is necessary for detecting decline in walking ability. Our target is non-diseased older people who can walk without a cane and who live alone in their homes. Early detection of walking ability deterioration in homes makes it possible to offer elderly people suitable medical treatment before their condition worsens.
However, conventional walking ability measurement methods present important problems hindering the realization of daily measurement. Table 1 presents benefits and shortcomings of respective methods. Features of each method are described below.
Table 1
Qualitative comparison of potential home-based methods for gait measurement
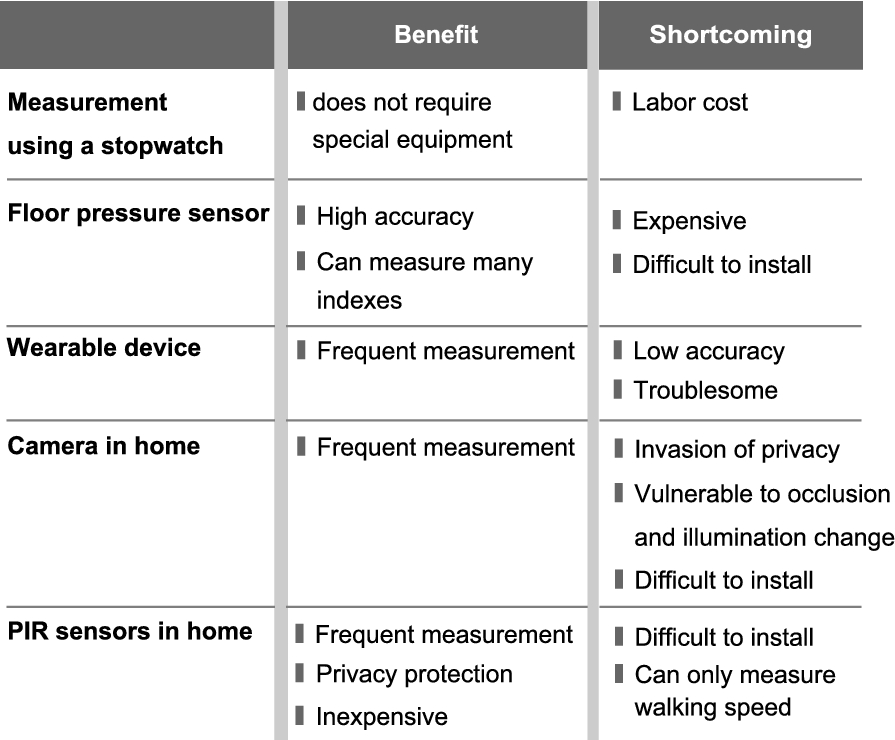
The 10-meter or 5-meter walking test is widely adopted as a simple method. Walking speed is measured mainly using a stopwatch. Supplementarily, step length or cadence is calculated by counting steps. This method requires elderly people to go to a medical institution or a nursing facility for measurements.
For studies that have undertaken detailed walking analyses in the medical field, floor pressure sensor systems are usually used [4,5]. Floor sensor systems can measure not only temporal and spatial parameters (i.e. cadence and step length), but also the floor reaction force. However, such systems are extremely expensive and can be used only in limited locations, such as some research institutions or medical facilities. It is difficult for this method to become widespread as a daily means of walking ability assessment.
Many systems incorporating wearable sensors have been proposed in recent years because they facilitate continuous assessment by automating measurement procedures. These studies, which use gyroscopes or accelerometers in most cases [1,2,20,21], can assess walking ability in an unstructured environment. However, such systems have a critical weak point: they require a user to wear a device continuously which might be troublesome, especially for elderly people.
Home monitoring systems have been proposed for the assessment of residents’ walking ability. For example, Stone et al. [23] use cameras to estimate walking speed and step length. The latest work [24] uses Kinect (Microsoft Corp.) equipped with an RGB camera and a depth sensor. Those methods are vulnerable to illumination change and occlusion. In addition, when those systems are installed in a home, the preservation of privacy can pose a severe problem.
Passive infrared (PIR) sensors are inexpensive and non-invasive. They have been used in homes for assessment of walking [3,8]. In these studies, walking speed is estimated using an array of PIR sensors installed on a ceiling. Although PIR sensor systems can detect human motion roughly, they are incapable of measuring foot movements. Furthermore, initial construction costs present a barrier for installation in a home because PIR sensors are usually mounted on a ceiling to prevent thermal disturbances.
As stated above, these conventional methods present some problems in terms of price, ease of installation, and privacy preservation. Moreover, walking parameters should be estimated without troublesome initial configurations that requires a person’s individual calibration or learning from previously acquired training data. We propose a system using a distance sensor array device as a practical system satisfying these requirements. The proposed system uses our original algorithm for step length and walking speed estimation. The algorithm requires no complicated calibration or learning procedures.
The organization of this paper is as follows. Section 2 presents an overview of the distance sensor array device and discusses the possibilities of the proposed system. Section 3 explains the development of the distance sensor array device. In Section 4, walking ability estimation algorithms are presented: (1) regular walking data extraction algorithm, (2) step length estimation algorithm, and (3) walking speed estimation algorithm. Section 5 describes experiments conducted to evaluate the performance of the proposed system, not only with healthy young adults but also with older adults. Section 6 presents important conclusions.
2.Easy-to-install system for daily walking ability assessment
2.1.Overview of distance sensor array device
Precise measurement of foot movement is indispensable to measure walking ability. A distance sensor is selected as a basic element of our device. The device comprises multiple distance sensors, constituting a distance sensor array. The proposed system measures walking along the sensor array and estimates the walking indexes from data acquired by the device.
Fig. 1.
Conceptual sketch of system installation in a house.
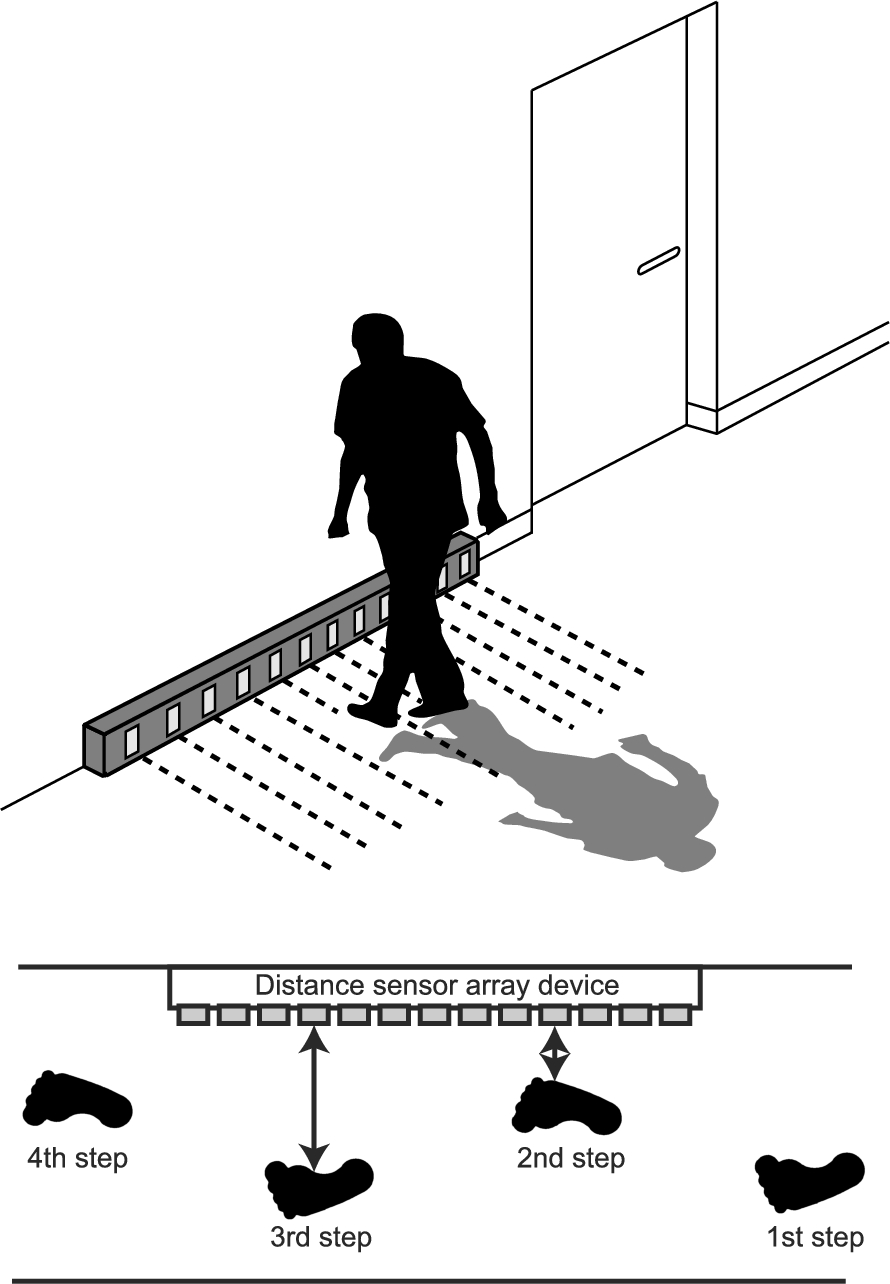
Figure 1 shows a conceptual sketch of the distance sensor array installed in the hallway of a house. To obtain standardized walking data, this device should be installed in a hallway along which a resident usually walks straight. The distance sensor array measures distances between sensors and resident’s feet while the resident is walking. Time series data of walking are obtained by sampling the output of each sensor with high frequency. Finally, walking ability can be estimated by analyzing the time series data. The device length is expected to be about 1.0 m for easy installation and for a resident’s comfortable life. In one day, multiple walking data are expected to be obtained by our system.
2.2.Possibility of the proposed system
This system presents important benefits from the perspective of privacy, ease of installation, and cost. First, the device will not be rejected by users because the device cannot reveal details of their personal life. Second, installation of this device can be done simply by putting the device on a floor. Finally, the distance sensor is an inexpensive sensor in itself. It is necessary to optimize the number of distance sensors to realize an inexpensive device. The benefits explained above enable us to infer that the proposed system using a distance sensor array has high implementability and practicality for automatic walking measurement in a home.
3.Development of distance sensor array device
This section presents details of the developed distance sensor array device.
3.1.Distance sensor specifications
We adopted a distance sensor module (Sharp Corp.; GP2Y0A21YK0F, Fig. 2, left) as the main component of this device. This sensor module is composed of an infrared light emitting diode (LED) and a position sensitive device (PSD). The LED emits infrared light one thousand times per second. Then a target object reflects it. As Fig. 2 shows, the PSD detects the position of the light spot on a sensor surface. Then the distance between the sensor and a target object is measured by triangulation. This sensor can measure from 100 to 800 mm. Figure 3 portrays the electro-optical characteristics of the PSD sensor.
Fig. 2.
PSD sensor and its principle.
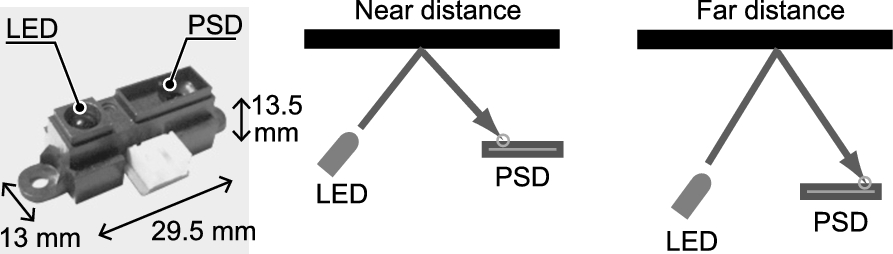
Fig. 3.
Electro-optical characteristics of the PSD sensor (GP2Y0A21-YK0F). This graph is made from the data-sheet [6].
![Electro-optical characteristics of the PSD sensor (GP2Y0A21-YK0F). This graph is made from the data-sheet [6].](https://content.iospress.com:443/media/ais/2015/7-3/ais-7-3-ais319/ais-7-ais319-g003.jpg)
3.2.Device specifications
Fig. 4.
Overview of distance sensor array device.
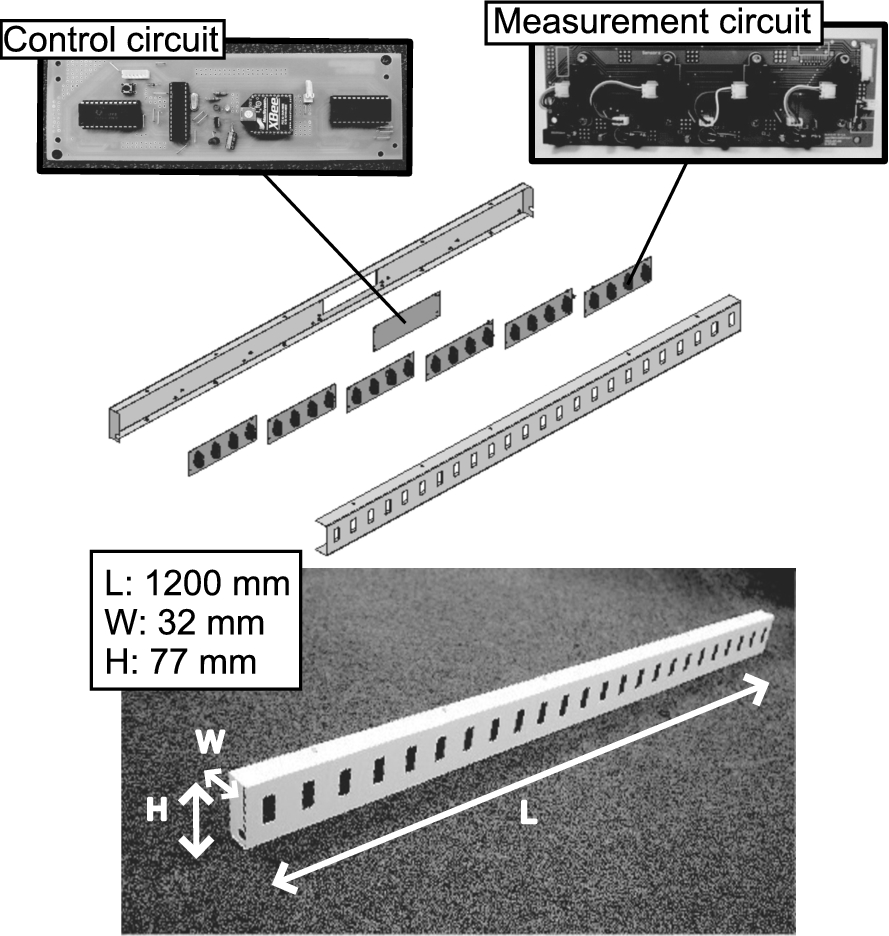
Fig. 5.
Close-up view of the measurement circuit and connections among multiple circuits.
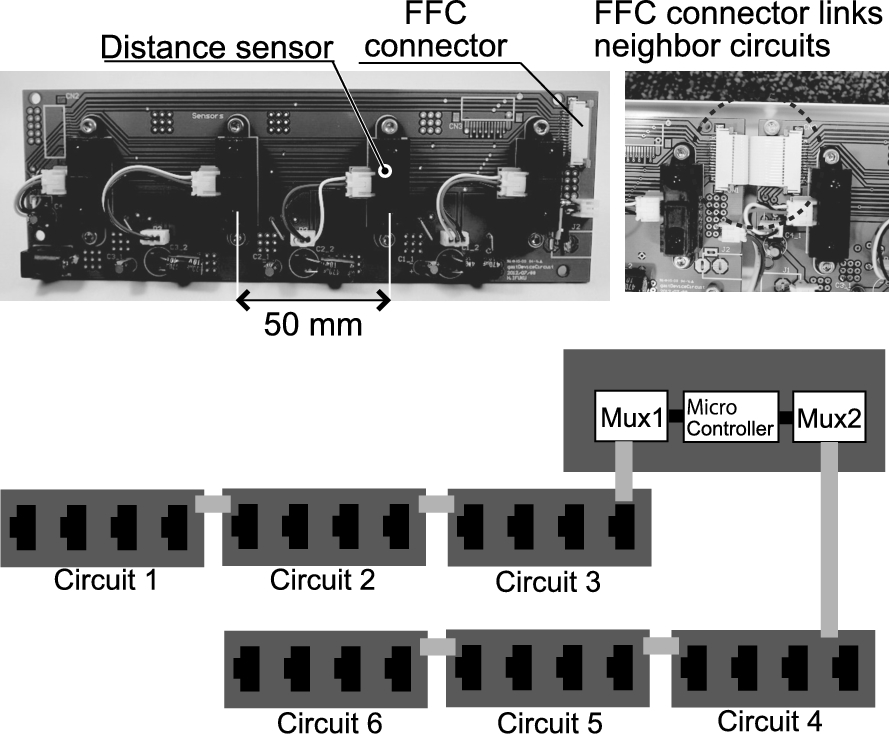
Figure 4 presents an overview of the developed distance sensor array device. Distance sensors are arranged at intervals of 50 mm. Because the ankle width is about 60–90 mm, this device can absolutely detect a human ankle. Every four sensors are attached to one measurement circuit module. Six modules are connected and embedded in a case. Figure 5 shows a close-up view of the measurement circuit and connection between multiple circuits. Those six modules use the same electronic circuit board. Their identifiers are configured simply by changing jumper settings. Using the same circuit board to replace six different boards can reduce costs. The total number of sensors is 24. The full length of the device is 1200 mm, which is short enough to install in a hallway, but long enough to capture two or more steps for measuring step length because one step is generally 800 mm long, at most, for an adult male [11]. In our design, the distance sensors are placed vertically at 50 mm height above the floor. These specifications are based on the results of a preliminary experiment. Appendix A presents the details of the preliminary experiment.
Fig. 6.
Block diagram of distance sensor array.
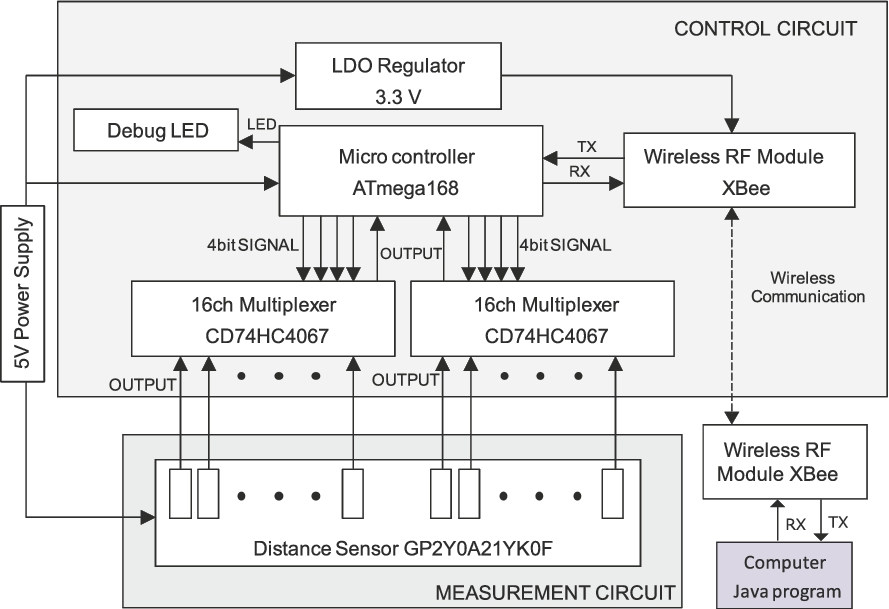
Fig. 7.
Data processing flow in the system.
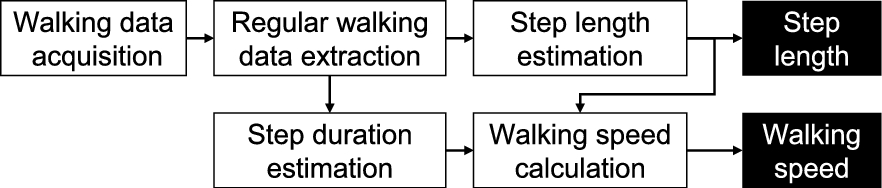
Figure 6 is a block diagram of the distance sensor array. The distance sensors output is sent to multiplexers in a control circuit. A microcontroller operates analog-to-digital conversion and sends values to PC through wireless module XBee. The output voltages of 24 distance sensors can be acquired at 60 Hz. A PC program estimates the step length and walking speed by analyzing time series distance data.
4.Walking ability estimation algorithm
Figure 7 portrays the system flow from data acquisition to data processing. First, regular walking data are extracted from the output of a distance sensor array device. Second, the step length is estimated from the extracted data. Finally, the walking speed is estimated. To estimate the walking speed, the estimated step length value is used. In these estimation processes of step length and walking speed, no troublesome calibration is necessary. The following sections describe algorithm details.
4.1.Regular walking data extraction algorithm
In an actual home environment, not all output of the device is a response to regular walking. Output includes noise and data obtained when a resident wanders around the device. It is necessary to extract only regular walking data as a result of straight walking. This section describes a process for extracting regular walking data from the device output.
Fig. 8.
Binary image generated from raw data.
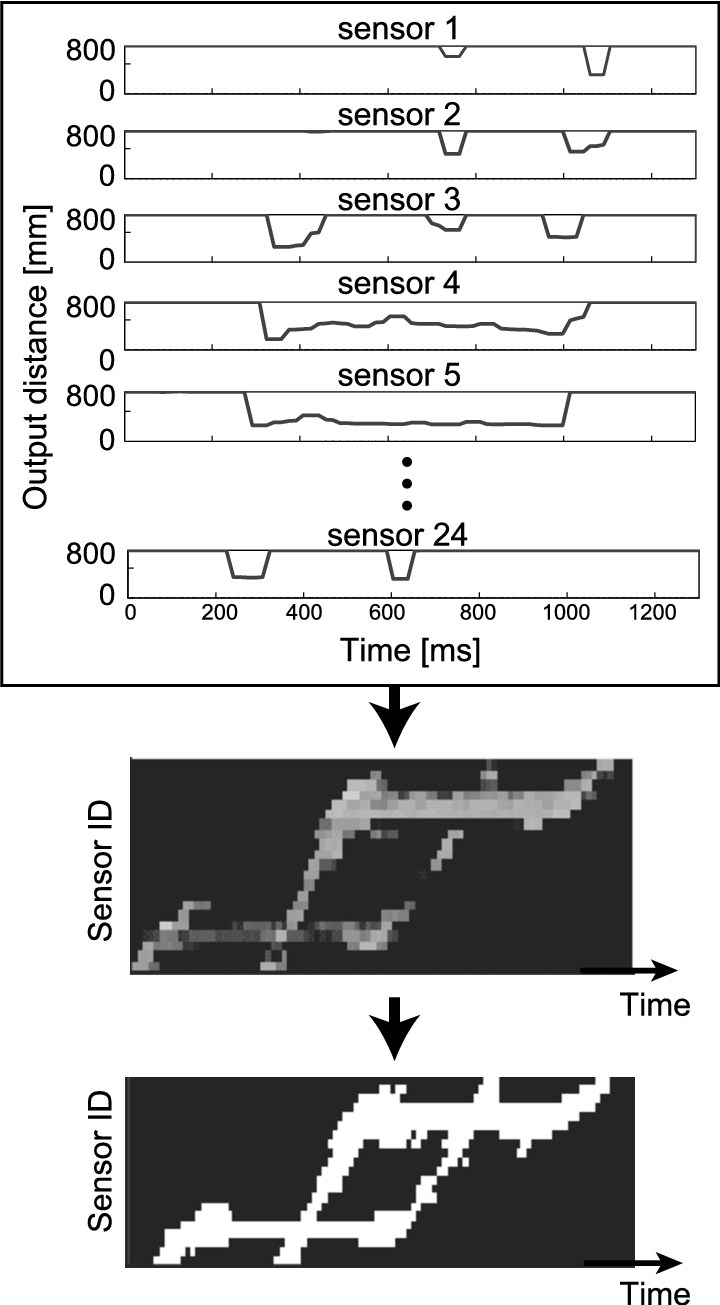
The top of Fig. 8 depicts the conversion of raw data to a graph. The horizontal axis shows the time. The vertical axis shows the sensor output (distance). The middle of Fig. 8 shows converted sensor output as a grayscale image. The bottom of Fig. 8 shows a binary image. The binary image is created from the grayscale image by binarizing with a threshold (800 mm) because the maximum measurement distance of the sensor is 800 mm and the output distance is 800 mm or less when the sensor reacts to a foot or an obstacle. One pixel of this binary image has information related to the reaction of each time and each sensor. We explore a regular walking data extraction algorithm using this binary image.
Fig. 9.
Regular walking data extraction procedure from time-series data.
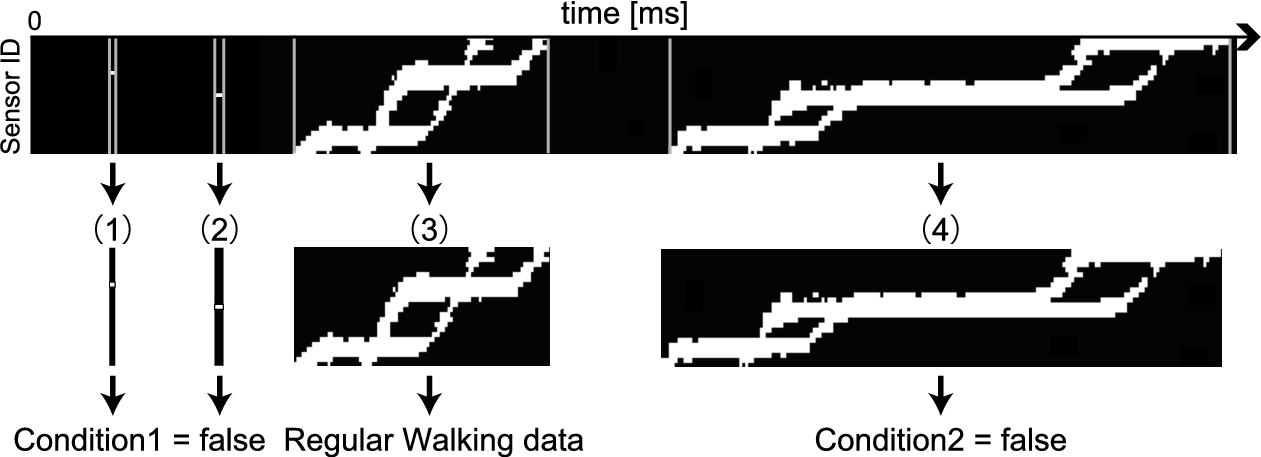
The extraction of regular walking data is conducted in two steps, as Fig. 9 shows. In the first step, a period during which at least one sensor reacts is extracted. For example, Fig. 9 shows four candidates of regular walking data. Only (3) shows regular walking data, (1) and (2) are noise, and (4) is obtained when a person stops on the way. The following two conditions can be criteria to extract regular walking data from the candidates in the first step:
– Condition 1: All the sensors react at least one time.
– Condition 2: The elapsed time of data is less than 3.0 s.
4.2.Step length estimation algorithm
Fig. 10.
Step length estimation algorithm.
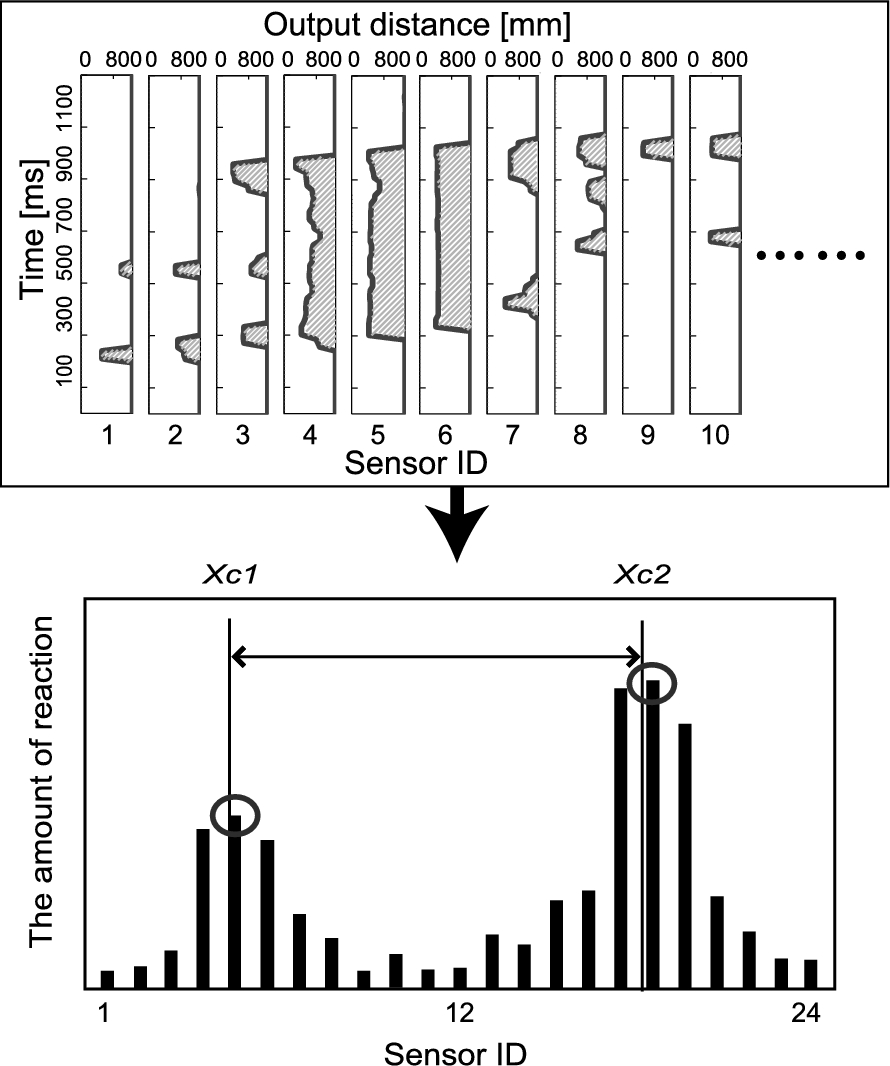
This algorithm aims to determine the lengths between various steps during human walking. Our proposed algorithm estimates the step length by measuring two foot-landing positions. When a person walks along the distance sensor array device and the person’s foot lands near a specific sensor, that sensor detects it for a long time. Here, we define “reaction weight” at each sensor as the summation of outputs at a certain time. In the top image of Fig. 10, the hatched area shows the reaction weight at each sensor. The bottom part of the figure presents a bar graph showing all sensors’ reaction weights. Because reaction weights near landing positions become larger, peaks are extracted as the landing positions. The bottom part of Fig. 10 shows data obtained when two foot landings are observed. Two peaks are evident in this chart. The following peak-extractor-processes detect abstract positions of peaks.
1. Apply a moving average filter calculated from three data points.
2. Calculate the increase and decrease of three adjacent points. If a point is a local maximum, the point is recognized as a peak.
Next, the local center of gravity of reacting weights is calculated from five neighboring sensors. The local center of gravity
(1)
4.3.Walking speed estimation algorithm
Next, this section describes a walking speed estimation algorithm. First, a walking movement is not a uniform motion involving the whole human body. Consequently, it is difficult to estimate walking speed merely by monitoring the speed of a specific human body part. For this reason, we devised the following technique to extract one walking movement sequence. The predefined binary image can be a good clue for this technique. Figure 11 portrays a binary image obtained when a person walks along the device and trajectories of right and left foot movement acquired by a motion capture system.
Fig. 11.
Binary image created from distance sensor array data and motion capture data. Horizontal axis shows time. Vertical axis shows the foot moving distance.
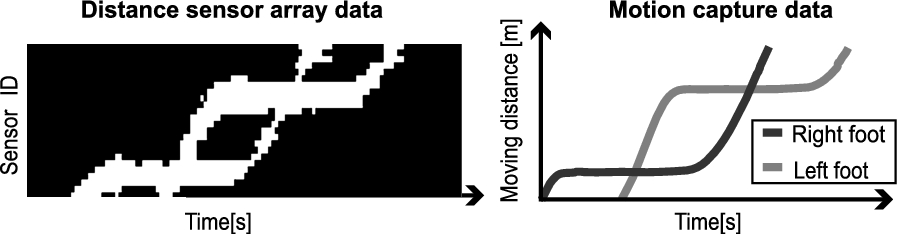
This motion capture data show that the right foot is moving forward while the left foot is contacting the ground – and vice versa. Similarly, the binary image shows the trajectory of the movement of both feet. For this study, we use the binary image and estimate walking speed by extracting one cycle of walking. The cycle starts at the heel strike of a foot and ends at the other foot heel strike. Detailed procedures of walking speed estimation are shown in Fig. 12.
Fig. 12.
Walking speed estimation algorithm.
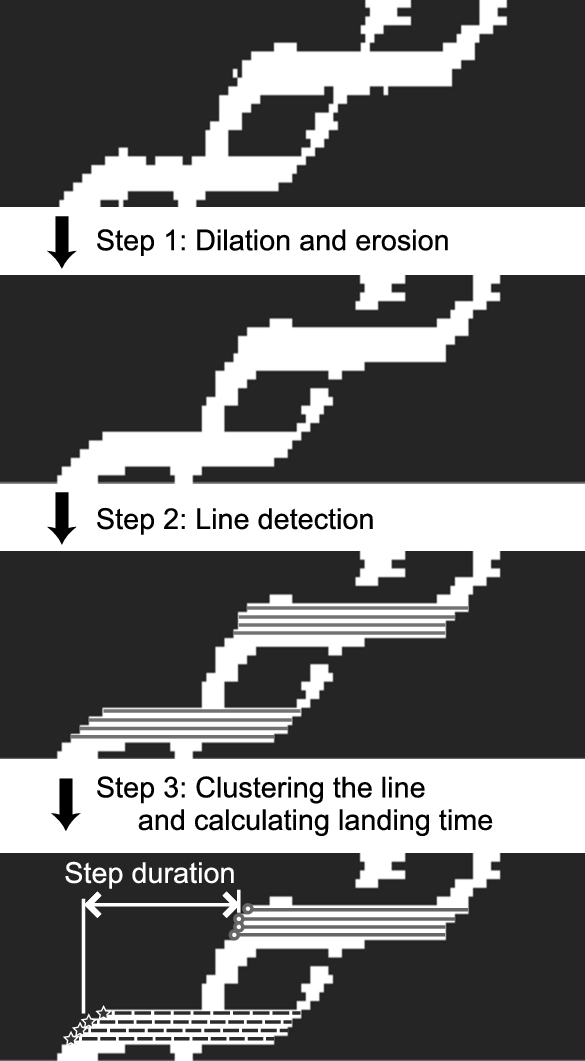
Step 1: Dilate and erode the binary image for eliminating small holes and filling gaps [22].
Step 2: Detect the lines denoting landing in the binary image using a Hough Transform [12]. These lines are parallel to the time axis because the sensor ID values are constant. Consequently, in a parameter space for the voting procedure, the angle parameter is restricted to 0 deg (parallel to the time axis) so that unnecessary lines might not be detected. Two foot steps are detected as multiple lines as shown in the third image of Fig. 12.
Step 3: Classify these detected lines in Hough parameter space. At this point, because the number of landings in the sensing area is unknown, the number of clusters is also unknown. Therefore, aggregative hierarchical clustering is adopted as the clustering method because it is not necessary to define the cluster numbers in advance. The minimum pixel number in the sensor ID axis between two lines is the stopping criteria of clustering. If the distance between the closest two lines from different clusters is greater than a threshold value (4 pixels; 200 mm in our implementation), then the clustering process stops. In fact, two steps are classified as two clusters in the fourth image of Fig. 12. Pixels of the end points of the detected lines show the time when the sensors begin to react to the landings. The median of the end points is defined as the estimated landing time because one landing includes multiple lines. Two consecutive landing times are estimated in this way. Step duration, the total time spent on a step, is calculated by subtracting these times. Walking speed is calculated as the estimated value of the step length divided by this step duration.
4.4.Benefits of estimating algorithms
These algorithms entail no troublesome calibration. Nevertheless, it is difficult for these algorithms to be applied to extremely slow walking. For walking when the step length is shorter than the foot length, peak detection is difficult in the step length estimation process because landing positions overlap. In addition, these algorithms require no complex calculations. Moreover, the system processes walking data in real time.
5.Experiments
5.1.Experiment of regular walking data extraction
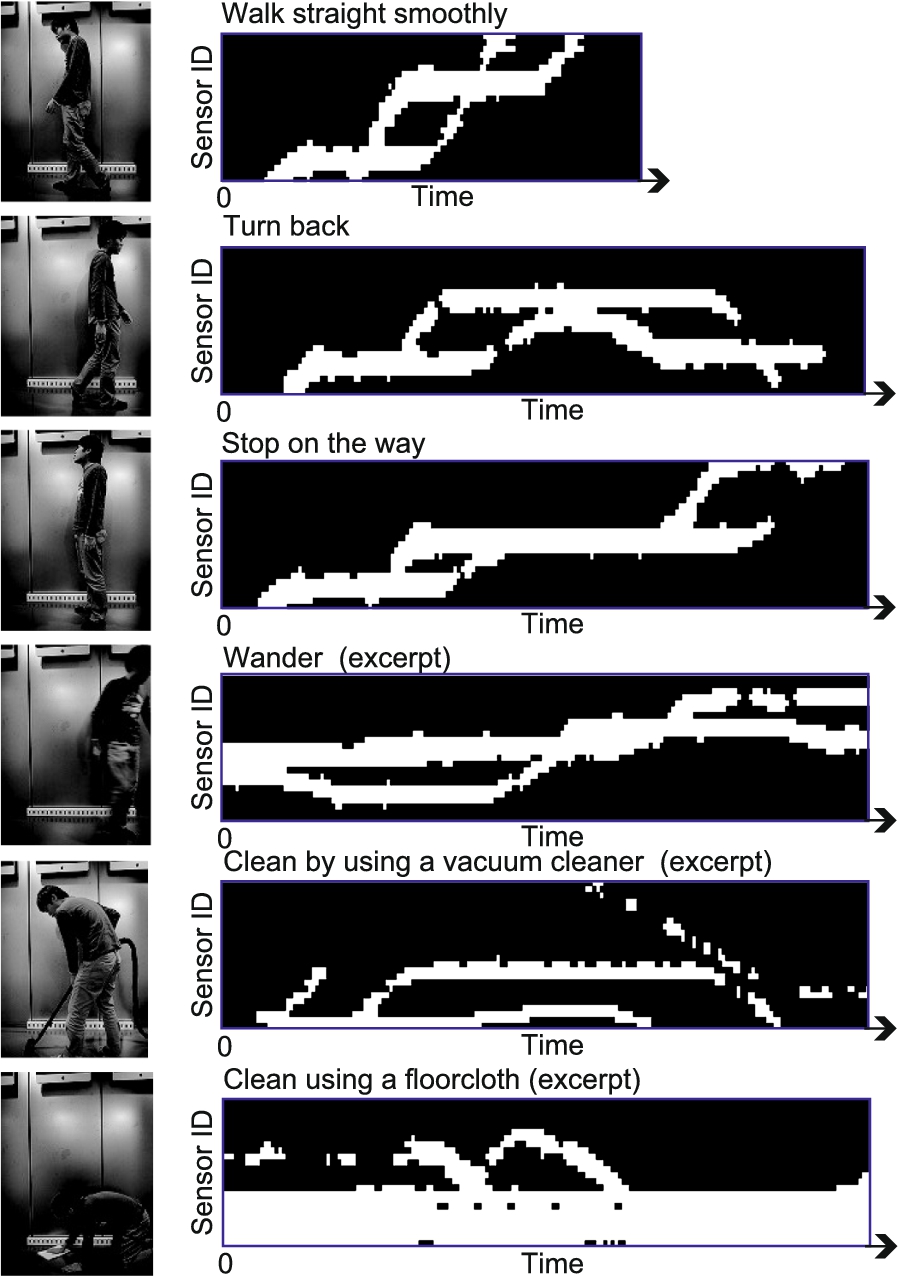
In the regular walking data extraction procedure, our proposed system eliminates action data other than that of regular walking. The algorithm is applied to regular walking data and other action data. Its performance is evaluated. Four healthy men (aged 21–32 years, mean age 25.0 years) participated in the experiment. They walked 20 times straight and smoothly along the sensor array device. In addition, non-walking pseudo-action data were collected by the device. The participants were given some instructions to play non-walking actions. Collected data were classifiable into five action groups based on the home monitoring result presented in Appendix B. Each participant did each non-walking action twice. Figure 13 depicts examples of collected data. The data are shown as binary images. In summary, we obtained 80 regular walking data and 40 non-walking action data.
Fig. 13.
Measurement and example data of various actions.
“Precision”, “Recall (Sensitivity)”, and “Specificity” described in Eqs (2), (3), (4) are used as evaluation indexes.
Results are shown in Table 2.
Table 2
Regular walking data extraction performance
| Precision | Recall (Sensitivity) | Specificity |
| 97.6% (80/82) | 100% (80/80) | 95.0% (38/40) |
Fig. 14.
Results of step length and walking speed estimation for extracted data as regular walking.
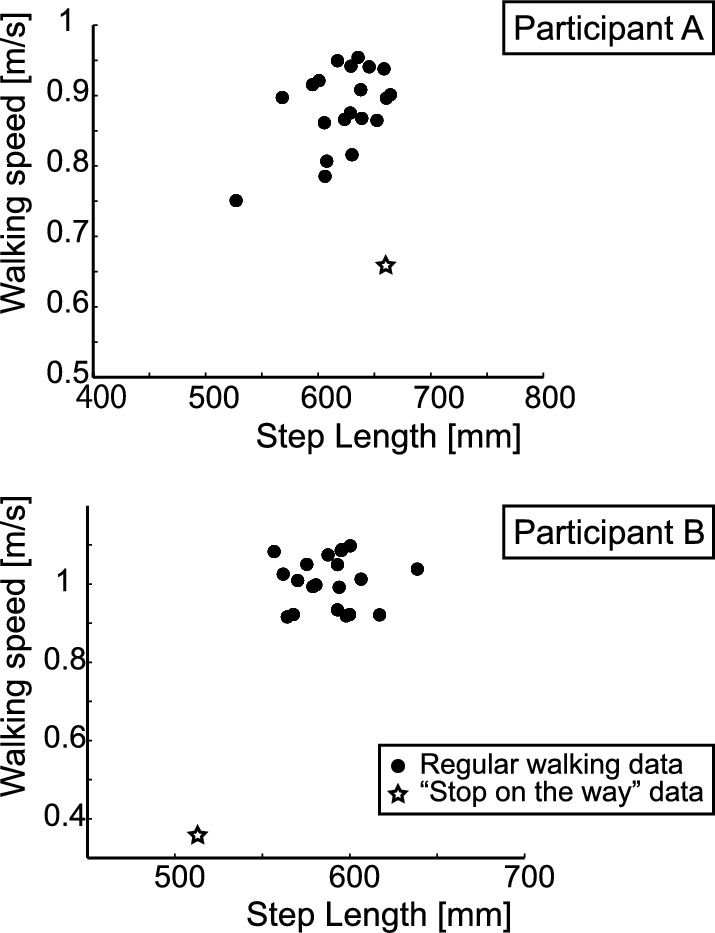
All regular walking data are extracted, which means that Recall (Sensitivity) is 100%. In contrast, Precision is 97.6% and Specificity is 95.0% because of the incorrect extraction of two other action data. These two data are “Stop on the way” data that were collected from two different participants. 21 data including incorrect data were targets of step length and walking speed estimation for these two participants. Estimation results are shown in Fig. 14. The estimated values from regular walking data are concentrated in a certain area. However, the estimated value from “Stop on the way” is plotted at a distant position from the area. Non-walking data can be excluded easily based on the average and distribution of regular walking data.
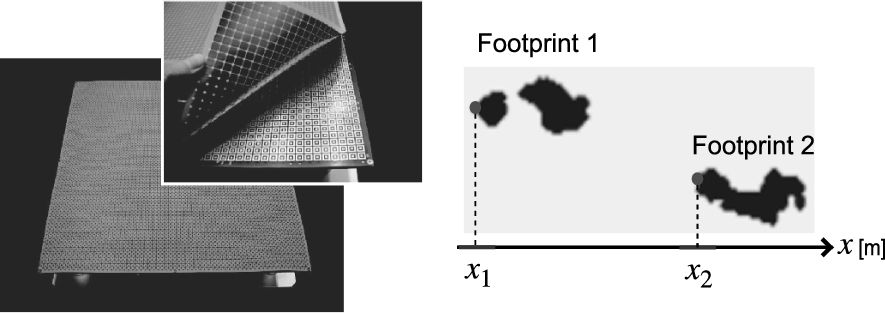
Fig. 15.
Close-up view of floor sensor and acquired data sample.
5.2.Basic performance evaluation
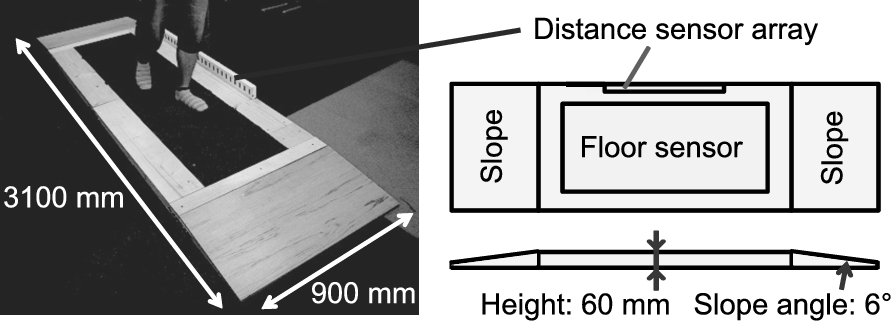
To examine the basic performance of walking ability estimation, we conducted an experiment with healthy young adults. This experiment was conducted to verify the feasibility of our system and to fix experimental procedures before conducting an experiment with elderly people. Participants were 8 men (aged 21–32 years, mean age 23.5 years). In the experiment, a high-resolution floor pressure sensor system [16] was used for acquiring reference data. Figure 15 (left) portrays a close-up view of the floor pressure sensor system. Table 3 shows specifications of the floor pressure sensor system. To collect walking data using both the distance sensor array device and the floor pressure sensor system, we constructed a walkway as shown in Fig. 16.
Table 3
Sensor Floor Specifications
| Sensing Area | 2000 × 2000 mm |
| Sensor Pitch | 7 mm |
| Output Data | ON-OFF (1 bit) |
| Transition Pressure | 25 kPa |
| Sampling Frequency | Approx. 20 Hz |
| Data Transfer Rate | 115200 bps |
| Data Type | Compressed Character |
From floor pressure sensor system data, two steps’ footprints were extracted using a labeling process. Figure 15 (right) portrays an example of extracted footprints. Tail ends of two footprints are designated respectively as
(5)
Fig. 16.
Walkway used for the experiment.
Participants walked 20 times. Although the total number of walking samples was 160, 158 data were used for evaluation. Two data were excluded because two steps were not detected. When a step length was too long compared with the distance sensor array device, only one step was detected. Sometimes more than three steps were detected. However, the first two steps were used to estimate the step length and walking speed.
Evaluation indexes were mean absolute error (MAE), mean of the absolute relative error (MARE), and standard deviation of the absolute relative error
MAE is a metric used to evaluate how precisely the algorithms estimate walking ability in the view of its original unit. In contrast, MARE shows the accuracy ratio: relative performance. Compared to root mean squared error (RMSE) and relative root mean squared error (RRMSE), they are stable against outliers.
Fig. 17.
Comparison of estimated and reference values in the basic experiment.
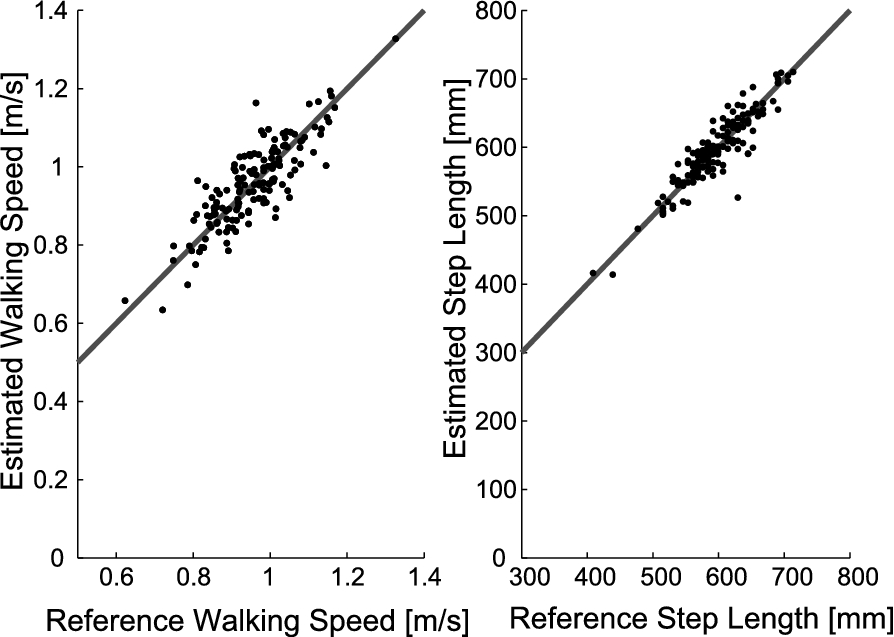
Figure 17 presents scatter diagrams of the step length and walking speed. Reference values are plotted on the horizontal axis. Estimated values are plotted on the vertical axis. Almost all obtained data are distributed over step length 500–700 mm and walking speed 0.8–1.2 m/s. As shown in Table 4, the step length and walking speed can be estimated with high accuracy. MARE is less than 5% for both these indexes. The superior estimation accuracy was demonstrated in step length (about 15 mm), although distance sensors are arranged at intervals of 50 mm.
5.3.Experiment with elderly people
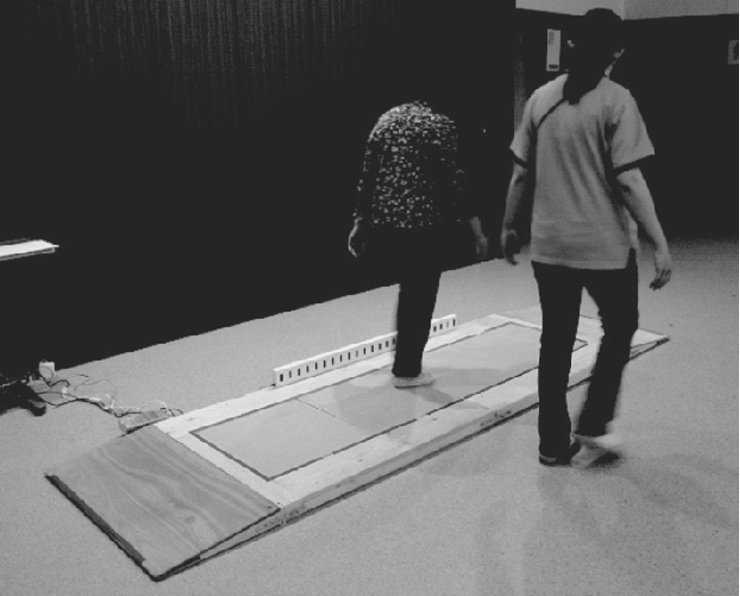
Based on the result of the basic performance evaluation, we conducted an experiment with elderly people, who are the main target of this research. Ten participants (5 men and 5 women, aged 72–86 years, mean age 78.5 years) participated in the experiment. All participants were attendees of “the Japanese Red Cross Day Care Center”. However, they were able to walk without a cane. Before the experiment, we obtained permission to conduct the experiment from the Center Director. All participants were informed of the purpose and methods of this study. Written informed consent was obtained from each participant’s family. The experimental setup was the same as that of the basic performance evaluation experiment. Figure 18 presents a snapshot of the experiment. Ten walking sequences were observed for each participant. We analyzed 100 walking sequences.
Table 4
Error scores in the basic experiment
| Walking Speed | Step Length | |
| MAE | 0.046m/s | 15.1mm |
| MARE | 4.8% | 2.6% |
| 3.8% | 2.5% |
Fig. 18.
Snapshot of the experiment with elderly people.
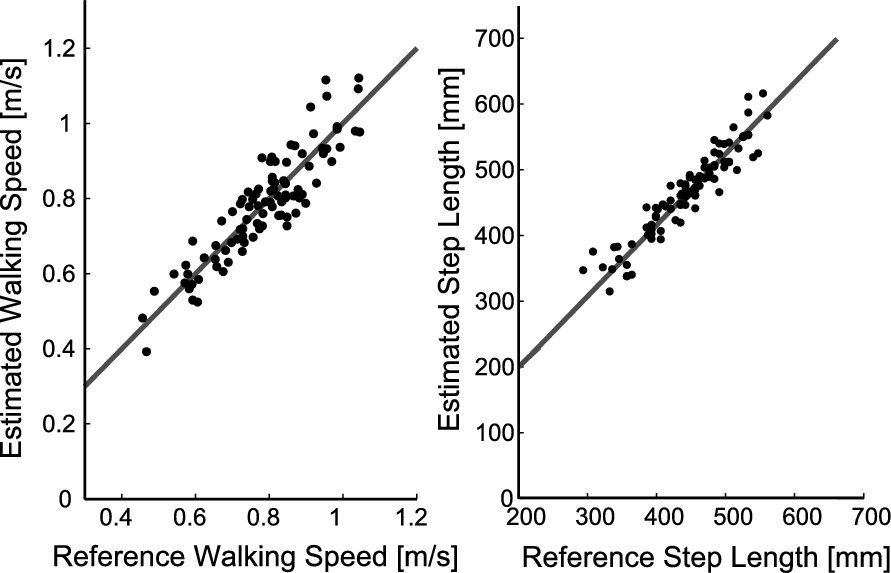
Experimental results are presented in Fig. 19 and Table 5. Obtained data are distributed over step lengths of 300–600 mm and walking speed 0.5–1.0 m/s. Step length and walking speed were estimated with high accuracy, as shown also for the prior experiment. However, MARE and
Table 5
Error scores of the experiment with elderly people
| Walking Speed | Step Length | |
| MAE | 0.051m/s | 17.4mm |
| MARE | 6.5% | 3.8% |
| 4.3% | 3.3% |
Fig. 19.
Comparison of estimated and reference values for the experiment with elderly people.
6.Conclusion
We proposed a system for the daily assessment of walking ability using a distance sensor array device. The system uses a simple device comprising inexpensive distance sensors. The proposed system has several benefits: preservation of privacy, ease of installation, and cost.
The system performance was verified in several experiments. First, non-walking action data can be excluded with high probability using simple conditional processes. Second, we conducted experiments not only with younger people, but also with elderly people. The experimental results prove that walking parameters can be estimated with high accuracy using the proposed system. Especially, the proposed algorithm can estimate step length with 15 mm accuracy and walking speed with 0.05 m/s accuracy on average. Based on these results, we conclude that the proposed system can be a useful tool for the daily assessment of walking ability.
In future work, the algorithm will be extended to the estimation of parameters related to walking balance such as single supporting time and double supporting time. In addition, this paper is merely the first step for daily gait monitoring. We must study whether our system can detect signs of specific diseases such as Parkinson’s disease.
Notes
1 Generally speaking, anyone who can not walk at more than 0.4 m/s should go to adequate facilities for medical care.
2 This includes non-regular walking data.
Acknowledgements
We would like to thank the study participants in this research. We also greatly appreciate the contribution of Yukie Ohashi, Miho Akimoto, and other staffs of the Japanese Red Cross.
Appendices
Appendix A.
Appendix A.Preliminary experiment for design of distance sensor array specifications
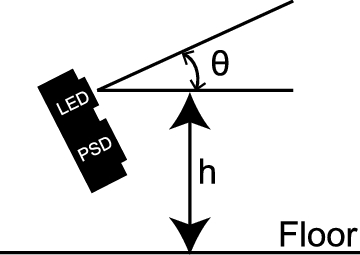
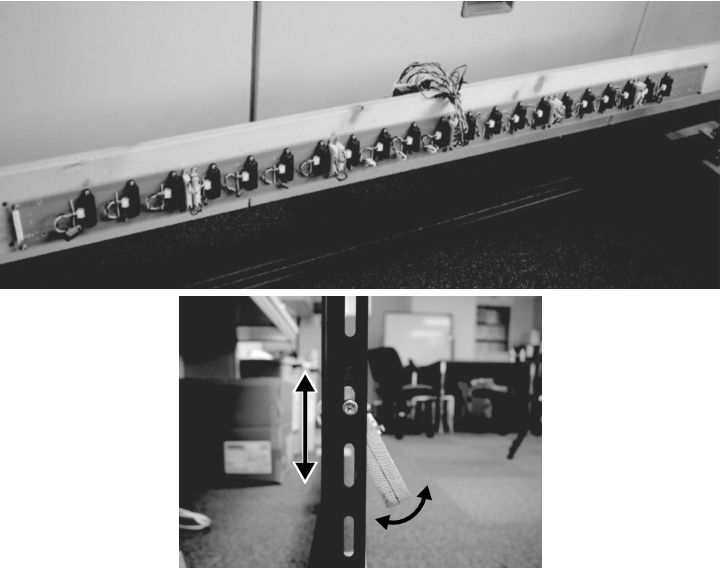
We must conduct a preliminary experiment to decide how the sensors are placed in the device. Two design parameters are the height and direction of sensors. Figure 20 presents definitions of those parameters.
Fig. 20.
Two design parameters: height and direction of sensors.
To ascertain the optimal parameters, a prototype device was developed, as Fig. 21 shows. This prototype has 21 distance sensors in 50 mm pitch. The height and the direction of those sensors can be changed arbitrarily. The seven various conditions in Table 6 (left) are evaluated in this experiment.
Table 6
Experimental conditions and results of the preliminary experiment
| No. | height (h) [mm] | direction θ [deg] | MARE of speed [%] | MARE of step length [%] |
| 1 | 50 | 0 | 4.6 | 2.8 |
| 2 | 50 | 10 | 8.3 | 2.8 |
| 3 | 50 | 20 | –* | –* |
| 4 | 100 | 0 | 7.5 | 4.4 |
| 5 | 100 | 10 | 14.6 | 6.5 |
| 6 | 100 | 20 | –* | –* |
| 7 | 200 | 0 | –* | –* |
* Not measurable in the condition.
Fig. 21.
Snapshot of the distance sensor array prototype.
The three variations in height correspond to different targets of foot parts, as shown in Fig. 22.
A motion capture system (NaturalPoint OptiTrack FEX:V100 [13]) was used as a reference. Four healthy young men participated in this experiment, for which 32 data were acquired. Table 6 (right) shows results for different configurations. The performance evaluation index is MARE calculated in Eq. (7). As might be apparent in condition No. 3, No. 6, and No. 7, it is impossible to distinguish the stance phase and the swing phase because sensors in those conditions target the shank. Moreover, no great difference exists between sensor data of the stance and swing phases.
Fig. 22.
Targeting points in three different conditions.
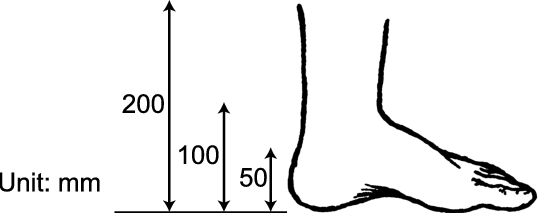
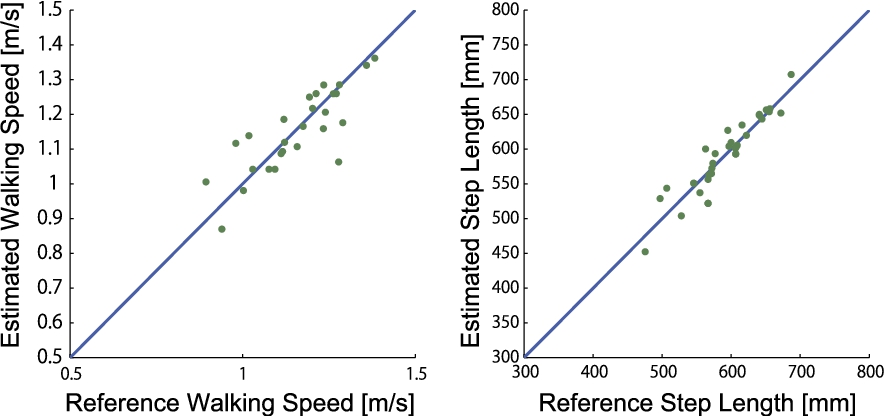
Figure 23 shows the experimental results obtained for condition No. 1: the best condition. Results show that both walking speed and step length are estimated precisely in this configuration. Finally this configuration was adopted: height of 50 mm and direction of 0 deg.
Fig. 23.
Experimental results of condition No. 1.
Appendix B.
Appendix B.Observation of action patterns in daily living
The distance sensor array device proposed in this paper is assumed to be installed in a hallway. Apparently the device obtains various action data other than regular walking data. To ascertain what actions are performed, we monitored an actual home environment for 12 days. A man in his twenties who lives alone was monitored. Figure 24 shows the monitoring configuration and examples of recorded pictures.
Fig. 24.
Setup for home monitoring. Examples of recorded picture.
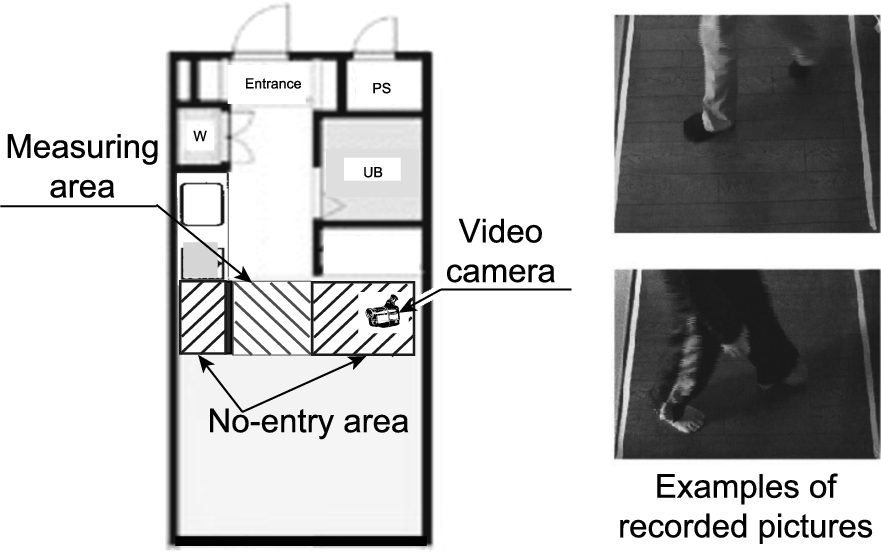
Fig. 25.
Aggregate results of action patterns in a home.
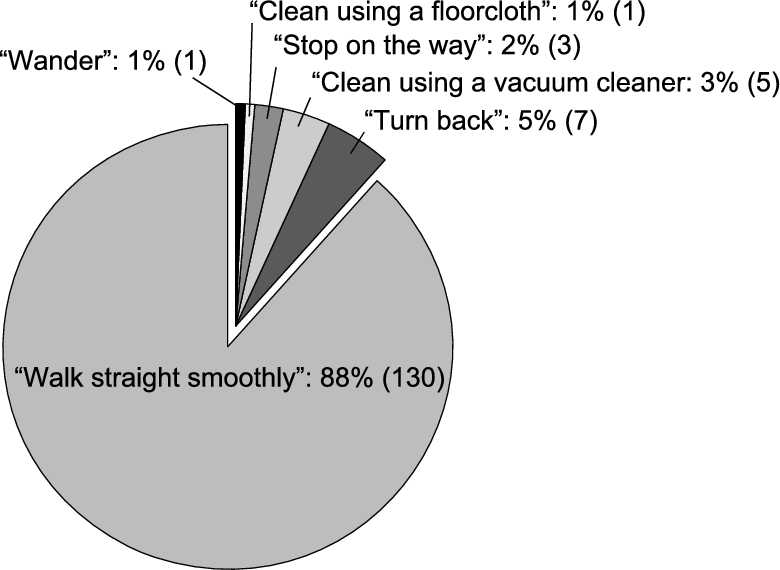
The resident’s actions in the hallway were filmed continuously by a camera installed near the ceiling. Action patterns were classified by the resident’s foot motion. The results are shown in Fig. 25. Foot motions were detected 149 times. The rate of smooth walking, which is the object of walking ability assessment, is about 90 % of all data. Non-walking actions were detected 19 times. These actions can be classified broadly into five groups.
– Turn back
– Stop on the way
– Wander
– Clean using a vacuum cleaner
– Clean using a floorcloth
References
1 | [[1]] D. Alvarez, R.C. González, A. López and J.C. Alvarez, Comparison of step length estimators from wearable accelerometer devices, in: Proc. of IEEE Annual International Conference Engineering in Medicine and Biology Society, (2006) , pp. 5964–5967. |
2 | [[2]] K. Aminian, P. Robert, E. Jequier and Y. Schutz, Incline, speed, and distance assessment during unconstrained walking, Medicine and Science in Sports and Exercise 27: ((1995) ) 226. |
3 | [[3]] D. Austin, T.L. Hayes, J. Kaye, N. Mattek and M. Pavela, On the disambiguation of passively measured in-home gait velocities from multi-person smart homes, Journal of Ambient Intelligence and Smart Environments 3: (2) ((2011) ), 165–174. |
4 | [[4]] A. Bowen, R. Wenman, J. Mickelborough, J. Foster, E. Hill and R. Tallis, Dual-task effects of talking while walking on velocity and balance following a stroke, Age and Ageing 30: (4) ((2001) ), 319–323. |
5 | [[5]] J.S. Brach, R. Berthold, R. Craik, J.M. VanSwearingen and A.B. Newman, Gait variability in community-dwelling older adults, Journal of the American Geriatrics Society 49: (12) ((2001) ), 1646–1650. |
6 | [[6]] SHARP Corporation, Distance measuring sensor unit, GP2Y0A21YK0F, http://www.sharp.co.jp/products/device/doc/opto/gp2y0a21yk_e.pdf. |
7 | [[7]] J.M. Guralnik, L. Ferrucci, E.M. Simonsick, M.E. Salive and R.B. Wallace, Lower-extremity function in persons over the age of 70 years as a predictor of subsequent disability, New England Journal of Medicine 332: (9) ((1995) ), 556–562. |
8 | [[8]] S. Hagler, D. Austin, T.L. Hayes, J. Kaye and M. Pavel, Unobtrusive and ubiquitous in-home monitoring: A methodology for continuous assessment of gait velocity in elders, IEEE Transactions on Biomedical Engineering 57: (4) ((2005) ), 813–820. |
9 | [[9]] S.E. Hardy, S. Perera, Y.F. Roumani, J.M. Chandler and S.A. Studenski, Improvement in usual gait speed predicts better survival in older adults, Journal of the American Geriatrics Society 55: (11) ((2007) ), 1727–1734. |
10 | [[10]] J.M. Hausdorff, G. Yogev, S. Springer, E.S. Simon and N. Giladi, Walking is more like catching than tapping: Gait in the elderly as a complex cognitive task, Experimental Brain Research 164: (4) ((2005) ), 541–548. |
11 | [[11]] J.E. Himann, D.A. Cunningham, P.A. Rechnitzer, D.H. Paterson et al., Age-related changes in speed of walking, Medicine and Science in Sports and Exercise 20: (2) ((1988) ) 161. |
12 | [[12]] P.V.C. Hough, Method and means for recognizing complex patterns, U.S. Patent, 3069654, 1962. |
13 | [[13]] NaturalPoint Inc., Optitrack FLEX:V100, http://www.naturalpoint.com/optitrack/products/flex-v100/. |
14 | [[14]] B.E. Maki et al., Gait changes in older adults: Predictors of falls or indicators of fear, Journal of the American Geriatrics Society 45: (3) ((1997) ), 313. |
15 | [[15]] S. Marquis, M. Milar Moore, D.B. Howieson, G. Sexton, H. Payami, J.A. Kaye and R. Camicioli, Independent predictors of cognitive decline in healthy elderly persons, Archives of Neurology 59: (4) ((2002) ), 601. |
16 | [[16]] H. Morishita, R. Fukui and T. Sato, High resolution pressure sensor distributed floor for future human-robot symbiosis environments, in: Proc. of IEEE/RSJ International Conference on Intelligent Robots and Systems, (2002) , pp. 1246–1251. |
17 | [[17]] A.B. Newman, E.M. Simonsick, B.L. Naydeck, R.M. Boudreau, S.B. Kritchevsky, M.C. Nevitt, M. Pahor, S. Satterfield, J.S. Brach, S.A. Studenski et al., Association of long-distance corridor walk performance with mortality, cardiovascular disease, mobility limitation, and disability, JAMA: The Journal of the American Medical Association 295: (17) ((2006) ), 2018–2026. |
18 | [[18]] M. Parker, P.S. Baker and R.M. Allman, A life-space approach to functional assessment of mobility in the elderly, Journal of Gerontological Social Work 35: (4) ((2002) ), 35– 55. |
19 | [[19]] Y.M. Rolland, M. Cesari, M.E. Miller, B.W. Penninx, H.H. Atkinson and M. Pahor, Reliability of the 400-M usual-pace walk test as an assessment of mobility limitation in older adults, Journal of the American Geriatrics Society 52: (6) ((2004) ), 972–976. |
20 | [[20]] A.M. Sabatini, C. Martelloni, S. Scapellato and F. Cavallo, Assessment of walking features from foot inertial sensing, IEEE Transactions on Biomedical Engineering 52: (3) ((2005) ), 486–494. |
21 | [[21]] A. Salarian, F.B. Horak, C. Zampieri, P. Carlson-Kuhta, J.G. Nutt and K. Aminian, iTUG, a sensitive and reliable measure of mobility, IEEE Transactions on Neural Systems and Rehabilitation Engineering 18: (3) ((2010) ), 303–310. |
22 | [[22]] J. Serra, Image Analysis and Mathematical Morphology, Academic Press, (1982) . |
23 | [[23]] E.E. Stone, D. Anderson, M. Skubic and J.M. Keller, Extracting footfalls from voxel data, in: Proc. of IEEE Annual International Conference Engineering in Medicine and Biology Society, (2010) , pp. 1119–1122. |
24 | [[24]] E.E. Stone and M. Skubic, Evaluation of an inexpensive depth camera for passive in-home fall risk assessment, in: Proc. of IEEE International Conference on Pervasive Computing Technologies for Healthcare, (2011) , pp. 71–77. |
25 | [[25]] S. Studenski, S. Perera, D. Wallace, J.M. Chandler, P.W. Duncan, E. Rooney, M. Fox and J.M. Guralnik, Physical performance measures in the clinical setting, Journal of the American Geriatrics Society 51: (3) ((2003) ), 314–322. |

