
A Multi-Center Study on Human Brain Glutathione Conformation using Magnetic Resonance Spectroscopy
Abstract
Molecular dynamics simulation and in vitro nuclear magnetic resonance (NMR) studies on glutathione (GSH) indicated existence of closed and extended conformations. The present work in a multi-center research setting reports in-depth analysis of GSH conformers in vivo using a common magnetic resonance spectroscopy (MRS) protocol and signal processing scheme. MEGA-PRESS pulse sequence was applied on healthy subjects using 3T Philips MRI scanner (India) and 3T GE MRI scanner (Norway) using the same experimental parameters (echo time, repetition time, and selective 180° refocusing ON-pulse at 4.40 ppm and 4.56 ppm). All MRS data were processed at one site National Brain Research Center (NBRC) using in-house MRS processing toolbox (KALPANA) for consistency. We have found that both the closed and extended GSH conformations are present in human brain and the relative proportion of individual conformer peak depends on the specific selection of refocusing ON-pulse position in MEGA-PRESS pulse sequence. It is important to emphasize that in vivo experiments with different refocusing and inversion pulse positions, echo time, and voxel size, clearly evidence the presence of both the GSH conformations. The GSH conformer peak positions for the closed GSH (Cys-Hβ) peak at ∼2.80 ppm and extended GSH (Cys-Hβ) peak at ∼2.95 ppm remain consistent irrespective of the selective refocusing OFF-pulse positions. This is the first in vivo study where both extended and closed GSH conformers are detected using the MEGA-PRESS sequence employing the parameters derived from the high resolution in vitro NMR studies on GSH.
INTRODUCTION
Endogenous glutathione (GSH) is a master antioxidant and detoxifier involved in oxidative stress and redox balance in human cells. Glutathione is capable of preventing damage to important cellular components caused by reactive oxygen species such as free radicals, peroxides, lipid peroxides, and heavy metals. In vivo, the GSH level working as radical scavenger plays a significant role in preventive oxidation mechanism and is considered to be an important indicator of healthy aging [1], neurodegenerative disorders [2], and psychiatric disorders [3, 4]. Existence of GSH conformers reported in vitro and requirement for detailed in vivo was indicated [5, 6]. Detection and quantitation of the GSH forms in the human brain are very critical for identifying the transitional stage of Alzheimer’s disease (AD) pathogenesis from its mild to severe stages.
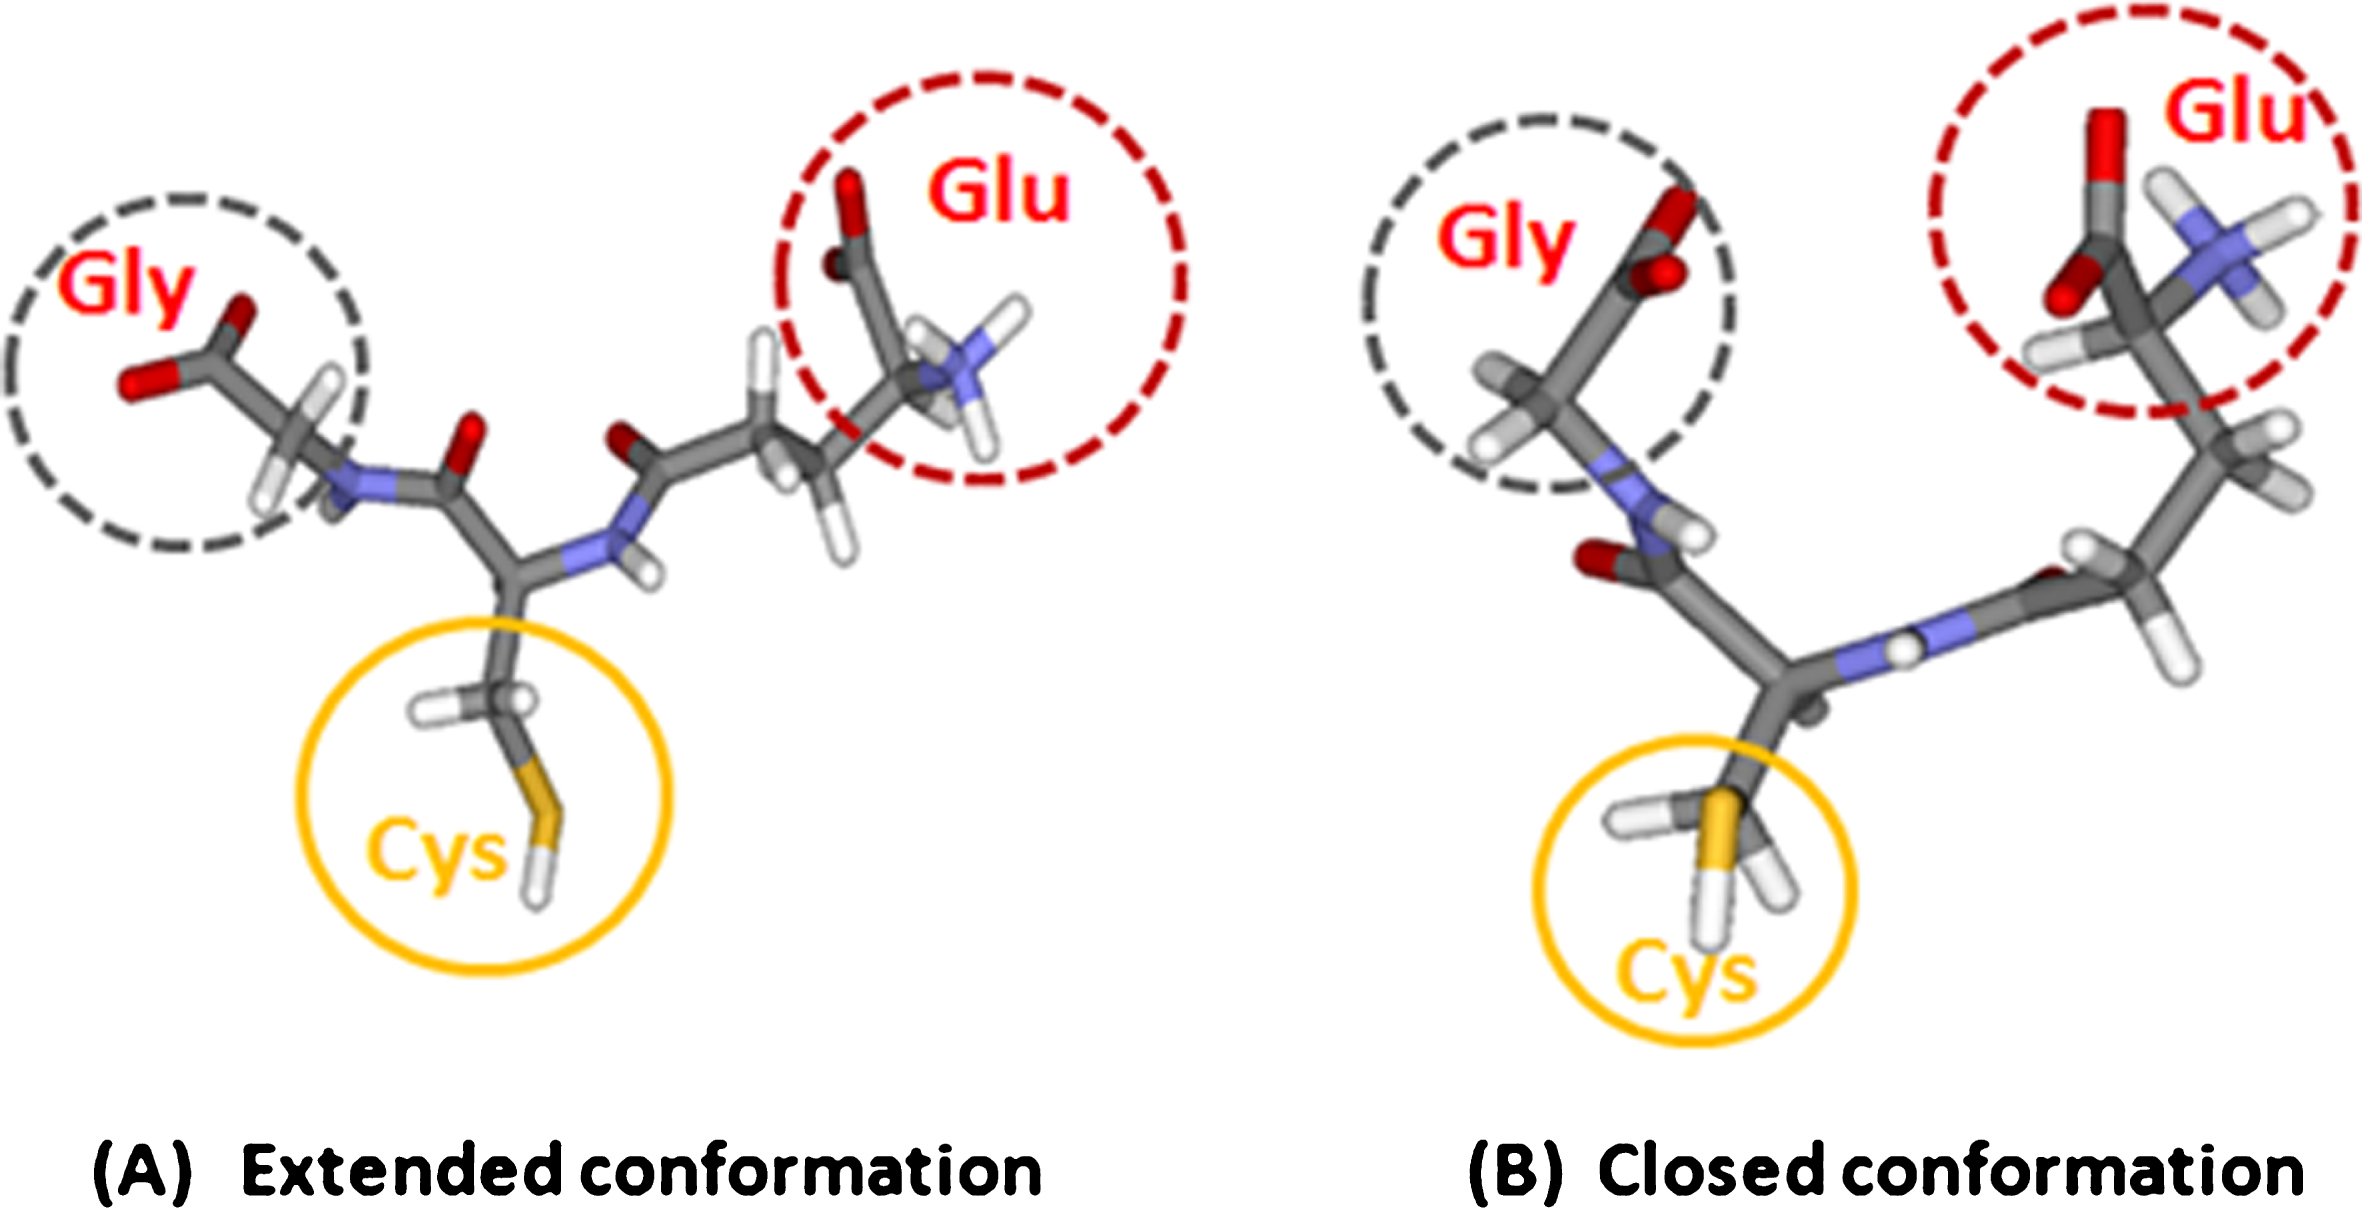
Magnetic resonance spectroscopy (MRS) is a powerful non-invasive technique for measuring brain metabolites and a prior knowledge of chemical shifts and coupling constants from in vitro nuclear magnetic resonance (NMR) studies are critical in selecting experimental parameters for in vivo MRS studies [7, 8]. It has been observed recently that NMR spectral parameters of in vitro NMR metabolites may get altered in vivo due to local cellular environmental differences [9]. Modulation of spectral patterns of metabolites with micro-environmental changes necessitates a closer scrutiny of their structures, specifically of those neurochemicals with various possible conformational states. Among the most prominently observed brain metabolites, the thiol (S-H) group containing monomeric GSH has been shown to exist in multiple conformational states under local variations in oxygen tension [10]. Published reports from molecular dynamics [11–14], Raman spectroscopy [15, 16], and NMR [17, 18] on GSH under various experimental conditions provide evidence of distinct GSH conformations (extended and closed forms) that are shown in Fig. 1. Effect of oxygen tension on the GSH conformations is also revealed by the analysis of two different NMR studies of aqueous GSH solution, one performed by researchers in “nitrogen degassing condition” [19] and the other performed “without degassing GSH solution” [8]. The 1H NMR spectra of non-degassed aqueous GSH in phosphate buffer saline (PBS) solution reported the chemical shift of Cys-Hα and -Hβ at 4.56 ppm and 2.95 ppm [8, 20, 21]. In contrast, 1H NMR studies with degassed GSH samples in aqueous medium reported the Cys-Hα and Cys-Hβ peak positions at 4.40 ppm and 2.80 ppm, respectively [19, 22]. Based on the currently available literature on molecular dynamics simulation and NMR studies on GSH, we have recently suggested the existence of the extended and closed conformations of GSH in vivo. GSH conformers [6]. Summarization of the different in vitro studies presently available on the GSH conformations as well as our in vivo studies on GSH, are illustrated in Supplementary Fig. 1.
Fig.1
Glutathione and its structural conformations. The extended (A) and closed (B) conformation (copyright permission obtained from the publisher).
The emphasis of our present multi-center spectroscopic study is on the firm establishment of the two in vivo GSH conformers, especially in view of the overlap of the GSH resonance signals with the typical signatures of other in vivo metabolites that are present in much larger concentrations. Details on the acquisition, analysis, and interpretation of the in vivo GSH resonance signals constitute the major content of this study.
Our choice of optimal MRS parameters for in viv o GSH detection with an appropriate pulse sequence has been made on the basis of high resolution NMR studies. The J-difference-edited 1H MRS MEscher–GArwood-Point RESolved Spectroscopy (MEGA-PRESS) pulse sequence [23] is very useful for identifying brain GSH, which is reported from autopsy studies to be below 2 mM [24, 25]. In MEGA-PRESS pulse sequence, the selective 180° refocusing pulse is applied at the Cys-Hα and the J-coupled Cys-Hβ peak is observed in the difference edited spectrum for GSH detection without any ambiguity. Considering that GSH has two conformational states (extended and closed) with different chemical shift positions of Cys-Hα peaks [1, 5, 6], the application of selective 180° pulse in MEGA-PRESS at 4.40 ppm or 4.56 ppm position would be required to determine the relative proportions of closed and extended GSH conformer peak observed in the edited spectra. To the best of our knowledge, there is no in vivo study indicating existence of the GSH conformers.
We have investigated the existence of the two GSH conformations in healthy control subjects using the MEGA-PRESS pulse sequence from two centers equipped with 3T Philips (NBRC, India) and 3T GE (Bergen, Norway) scanners. Same protocol has been followed in experimental design (e.g., echo time (TE), repetition time (TR)), and the selective 180° ON-pulse positions (at 4.56 ppm as well as 4.40 ppm). MRS data from both the centers have been processed with the same software, namely, KALPANA, an in-house MATLAB based MRS data processing toolbox at NBRC [2].
METHODS
In vitro NMR studies
Aqueous solutions of GSH (Sigma-Aldrich, USA) and GSH with N-acetyl aspartate (NAA) (Sigma-Aldrich, USA) were prepared in PBS. One dimensional (1D) and two dimensional (2D) total correlation (TOCSY) spectroscopic data were acquired using a 500 MHz Bruker Avance III spectrometer equipped with a “broad band observe” probe (Department of Chemistry, Case Western Reserve University, Cleveland, OH, USA). Proton NMR data were collected at 25°C and 37°C for GSH and, at 25°C, 37°C, and 47°C for the mixed GSH and NAA samples. For internal chemical shift reference, TSP (3-(trimethylsilyl)-propionate-d4) was used. Two dimensional TOCSY data on GSH PBS solution were performed for establishing through bond connectivity at 25°C using a mixing time of 80 ms.
NMR data processing
One dimensional NMR data were processed using MestReNova (version 11.0.4) software. Data were apodized with mixed exponential (2.50 Hz) and Gaussian (4.70 Hz) windows, and zero-order phase correction was applied. Multipoint spline algorithm was used for baseline correction. Both 1D data and 2D NMR TOCSY data were referenced to TSP. In 2D TOCSY data processing, T1-noise suppression was applied in both the indirect (f1) and acquisition (f2) directions of the 2D spectra. Data apodization was performed with mixed exponential (6.10 Hz) and Gaussian (2.40 Hz) windows.
In vivo human brain studies
Subject recruitment
In this study, a total of 29 healthy adult subjects [N = 12 (M/F = 7/5) in Norway and N = 17 (M/F = 10/7)] in India were recruited. Exclusion criteria comprised MR incompatibility and claustrophobia. The purpose of the study was explained to all subjects and a written informed consent was obtained from them before participation in the study. The study was conducted with approved human ethics protocols at the NBRC, India, and the Haukeland University Hospital, Bergen, Norway.
MRS data acquisition
1H-MRS data at NBRC were acquired with a 3.0 Tesla MR scanner (Achieva, Philips), equipped with an eight-channel dual tuned transmit-receive volume coil (RAPID corporation, Germany). In Bergen, Norway data were collected using 3.0 Tesla MR scanner (Discovery MR750, GE, USA) equipped with an eight-channel volume coil. GSH was detected from left parietal cortex region using MEGA-PRESS pulse sequence [23] from each subject, and voxel volumes of 15.6 cc (of dimensions 2.5×2.5×2.5 cm3) as well as 42.9 cc (of dimensions 3.5×3.5×3.5 cm3) were used with the following experimental parameters: TR = 2500 ms; TE = 130 ms; spectral width 2000 Hz (Philips) and 5000 Hz (GE); number of samples 2048 (Philips) and 4096 (GE). The 180° refocusing pulse (ON-pulse) was applied at 4.40 ppm (4.56 ppm) for the closed (extended) conformations, and the inversion pulse (OFF-pulse) was applied at 5.0 ppm. Water suppression was performed with CHEmical Shift Selective (CHESS) pulse in both the Philips and GE scanners. First and second-order shimming were performed using pencil beam-volume, resulting in a water linewidth of <12 Hz from the left parietal cortex of the brain. Additional in vivo data were collected with variable TE values (120 ms, 125 ms, 130 ms and 140 ms) and with selective 180° pulse (ON-pulse) at 4.40 ppm and 4.56 ppm, and 180° inversion pulse (OFF-pulse) at 5.0 ppm as well as at 7.22 ppm [26] keeping all other experimental parameters unchanged.
MRS data processing
The MEGA-PRESS in vivo data were processed using the in-house developed MATLAB-based toolbox, KALPANA [2] at NBRC to maintain the consistency in data processing. Individual spectra of MEGA-PRESS MRS data were aligned by positioning the water peak at 4.67 ppm. Both sets of MEGA-PRESS data (ON-pulse at 4.40 ppm as well as at 4.56 ppm) were processed with an identical scheme. The interleaved sub-spectra resulting from the MEGA-PRESS data (both OFF and ON) without any phase corrections were added directly to give the averaged OFF and averaged ON spectrum, which were further processed to generate a difference edited spectrum. The edited spectrum was inverse Fourier transformed in time-domain and residual water was suppressed using the Hankel-Lanczos singular value decomposition method with 15 components [27]. The edited spectrum was apodized with a mixed filter comprising a combination of Gaussian (2.0 Hz) and exponential (0.7 Hz) window functions. To identify the in vivo GSH conformations, the edited spectrum was zero-order phase corrected for both the GSH conformer peaks and baseline correction was performed using singular spectrum analysis (SSA) of window length 15 in combination to iterative time-domain spectral fitting scheme. The processed edited spectra were fitted as two Gaussian peaks using time domain nonlinear least square cost function optimization. The quality of spectral fitting was assessed using Cramer-Rao lower bound (CRLB) of the GSH peak area estimates, and spectra with fit results of CRLB >20% were rejected.
RESULTS
In vitro NMR study on GSH conformations
We present the NMR derived results to show the variability in chemical shift positions of GSH peaks (specifically Cys-Hα and Cys-Hβ) indicating the importance of the local environment on GSH conformations. Figure 2 shows the 1D 1H spectra of GSH and its correlation with COSY/TOCSY spectra in different sample conditions such as dimethyl sulfoxide (DMSO), the aqueous medium with degassing condition as well as in PBS. The chemical shifts of GSH peaks were referenced with respect to TSP in both the degassed aqueous medium condition [19] and in PBS solution. For the NMR studies of GSH solution in PBS, the external reference TSP (taken in a 2 mm NMR tube) inserted co-axially in the 5 mm NMR tube containing GSH solution in PBS was used. Figure 2A and 2B show the COSY and the TOCSY spectra of GSH in DMSO and degassed aqueous solutions, respectively, highlighting the through bond spin-spin connectivity between the Cys-Hα peak (at 4.40 ppm) with Cys-Hβ (2.80 ppm) in DMSO and in degassed environment [19] representing the stable (or closed) form of GSH conformation. In the non-degassed PBS solution, the TOCSY spectrum of GSH (Fig. 2C) shows the through bond spin-spin connectivity between Cys-Hα peak (at 4.56 ppm) with Cys-Hβ (at 2.95 ppm) representing the extended GSH conformation. Fig. 2D-F show the respective 1D-NMR spectra highlighting the Cys-Hα and Cys-Hβ peak positions for GSH sample in the DMSO, degassed aqueous, and PBS buffer solutions.
Fig.2
In vitro GSH sample study using NMR under different sample conditions. 2D NMR showing J-coupled GSH Cysteine peaks under different sample conditions: (A) COSY spectra of GSH in DMSO [18], (B) TOCSY spectra of GSH in aqueous D2O (degassed with nitrogen) [19], (C) TOCSY spectra of GSH in phosphate buffer saline (PBS) solutions; 1D NMR sample study for GSH in (D) DMSO [18], (E) aqueous D2O (degassed) [19], (F) PBS solutions (no degassing) (copyright permission obtained from the respective publishers).
![In vitro GSH sample study using NMR under different sample conditions. 2D NMR showing J-coupled GSH Cysteine peaks under different sample conditions: (A) COSY spectra of GSH in DMSO [18], (B) TOCSY spectra of GSH in aqueous D2O (degassed with nitrogen) [19], (C) TOCSY spectra of GSH in phosphate buffer saline (PBS) solutions; 1D NMR sample study for GSH in (D) DMSO [18], (E) aqueous D2O (degassed) [19], (F) PBS solutions (no degassing) (copyright permission obtained from the respective publishers).](https://content.iospress.com:443/media/jad/2018/66-2/jad-66-2-jad180648/jad-66-jad180648-g002.jpg)
Temperature dependent NMR studies have been carried out to show that 1H chemical shift positions of GSH remains unaltered irrespective of the sample temperature, or pH 6.4, 6.9, 7.0, and 7.2 [19]. Figure 3A and 3B illustrate the comparative temperature based analysis of 1D 1H spectra of GSH in PBS (27°C and 37°C), and degassed aqueous mediums (7°C (pH 7.0) and 17°C (pH 6.4, 6.9, and 7.2)) [19].
Fig.3
Effect on Cysteine GSH peak positions under varying environmental conditions. (A) 1D NMR spectra of GSH in PBS solution using 500 MHz NMR at different temperatures (i) 25°C, (ii) 37°C, (B) 1D NMR of GSH in nitrogen degassed aqueous solution with different (i) pH 5.6, 6.4, 7.2 at temperature 290 K (17°C), [19] (ii) pH 7.0 at temperature 280 K (7°C). GSH peak positions remain consistent irrespective of pH and/or temperature (copyright permission obtained from the publisher).
![Effect on Cysteine GSH peak positions under varying environmental conditions. (A) 1D NMR spectra of GSH in PBS solution using 500 MHz NMR at different temperatures (i) 25°C, (ii) 37°C, (B) 1D NMR of GSH in nitrogen degassed aqueous solution with different (i) pH 5.6, 6.4, 7.2 at temperature 290 K (17°C), [19] (ii) pH 7.0 at temperature 280 K (7°C). GSH peak positions remain consistent irrespective of pH and/or temperature (copyright permission obtained from the publisher).](https://content.iospress.com:443/media/jad/2018/66-2/jad-66-2-jad180648/jad-66-jad180648-g003.jpg)
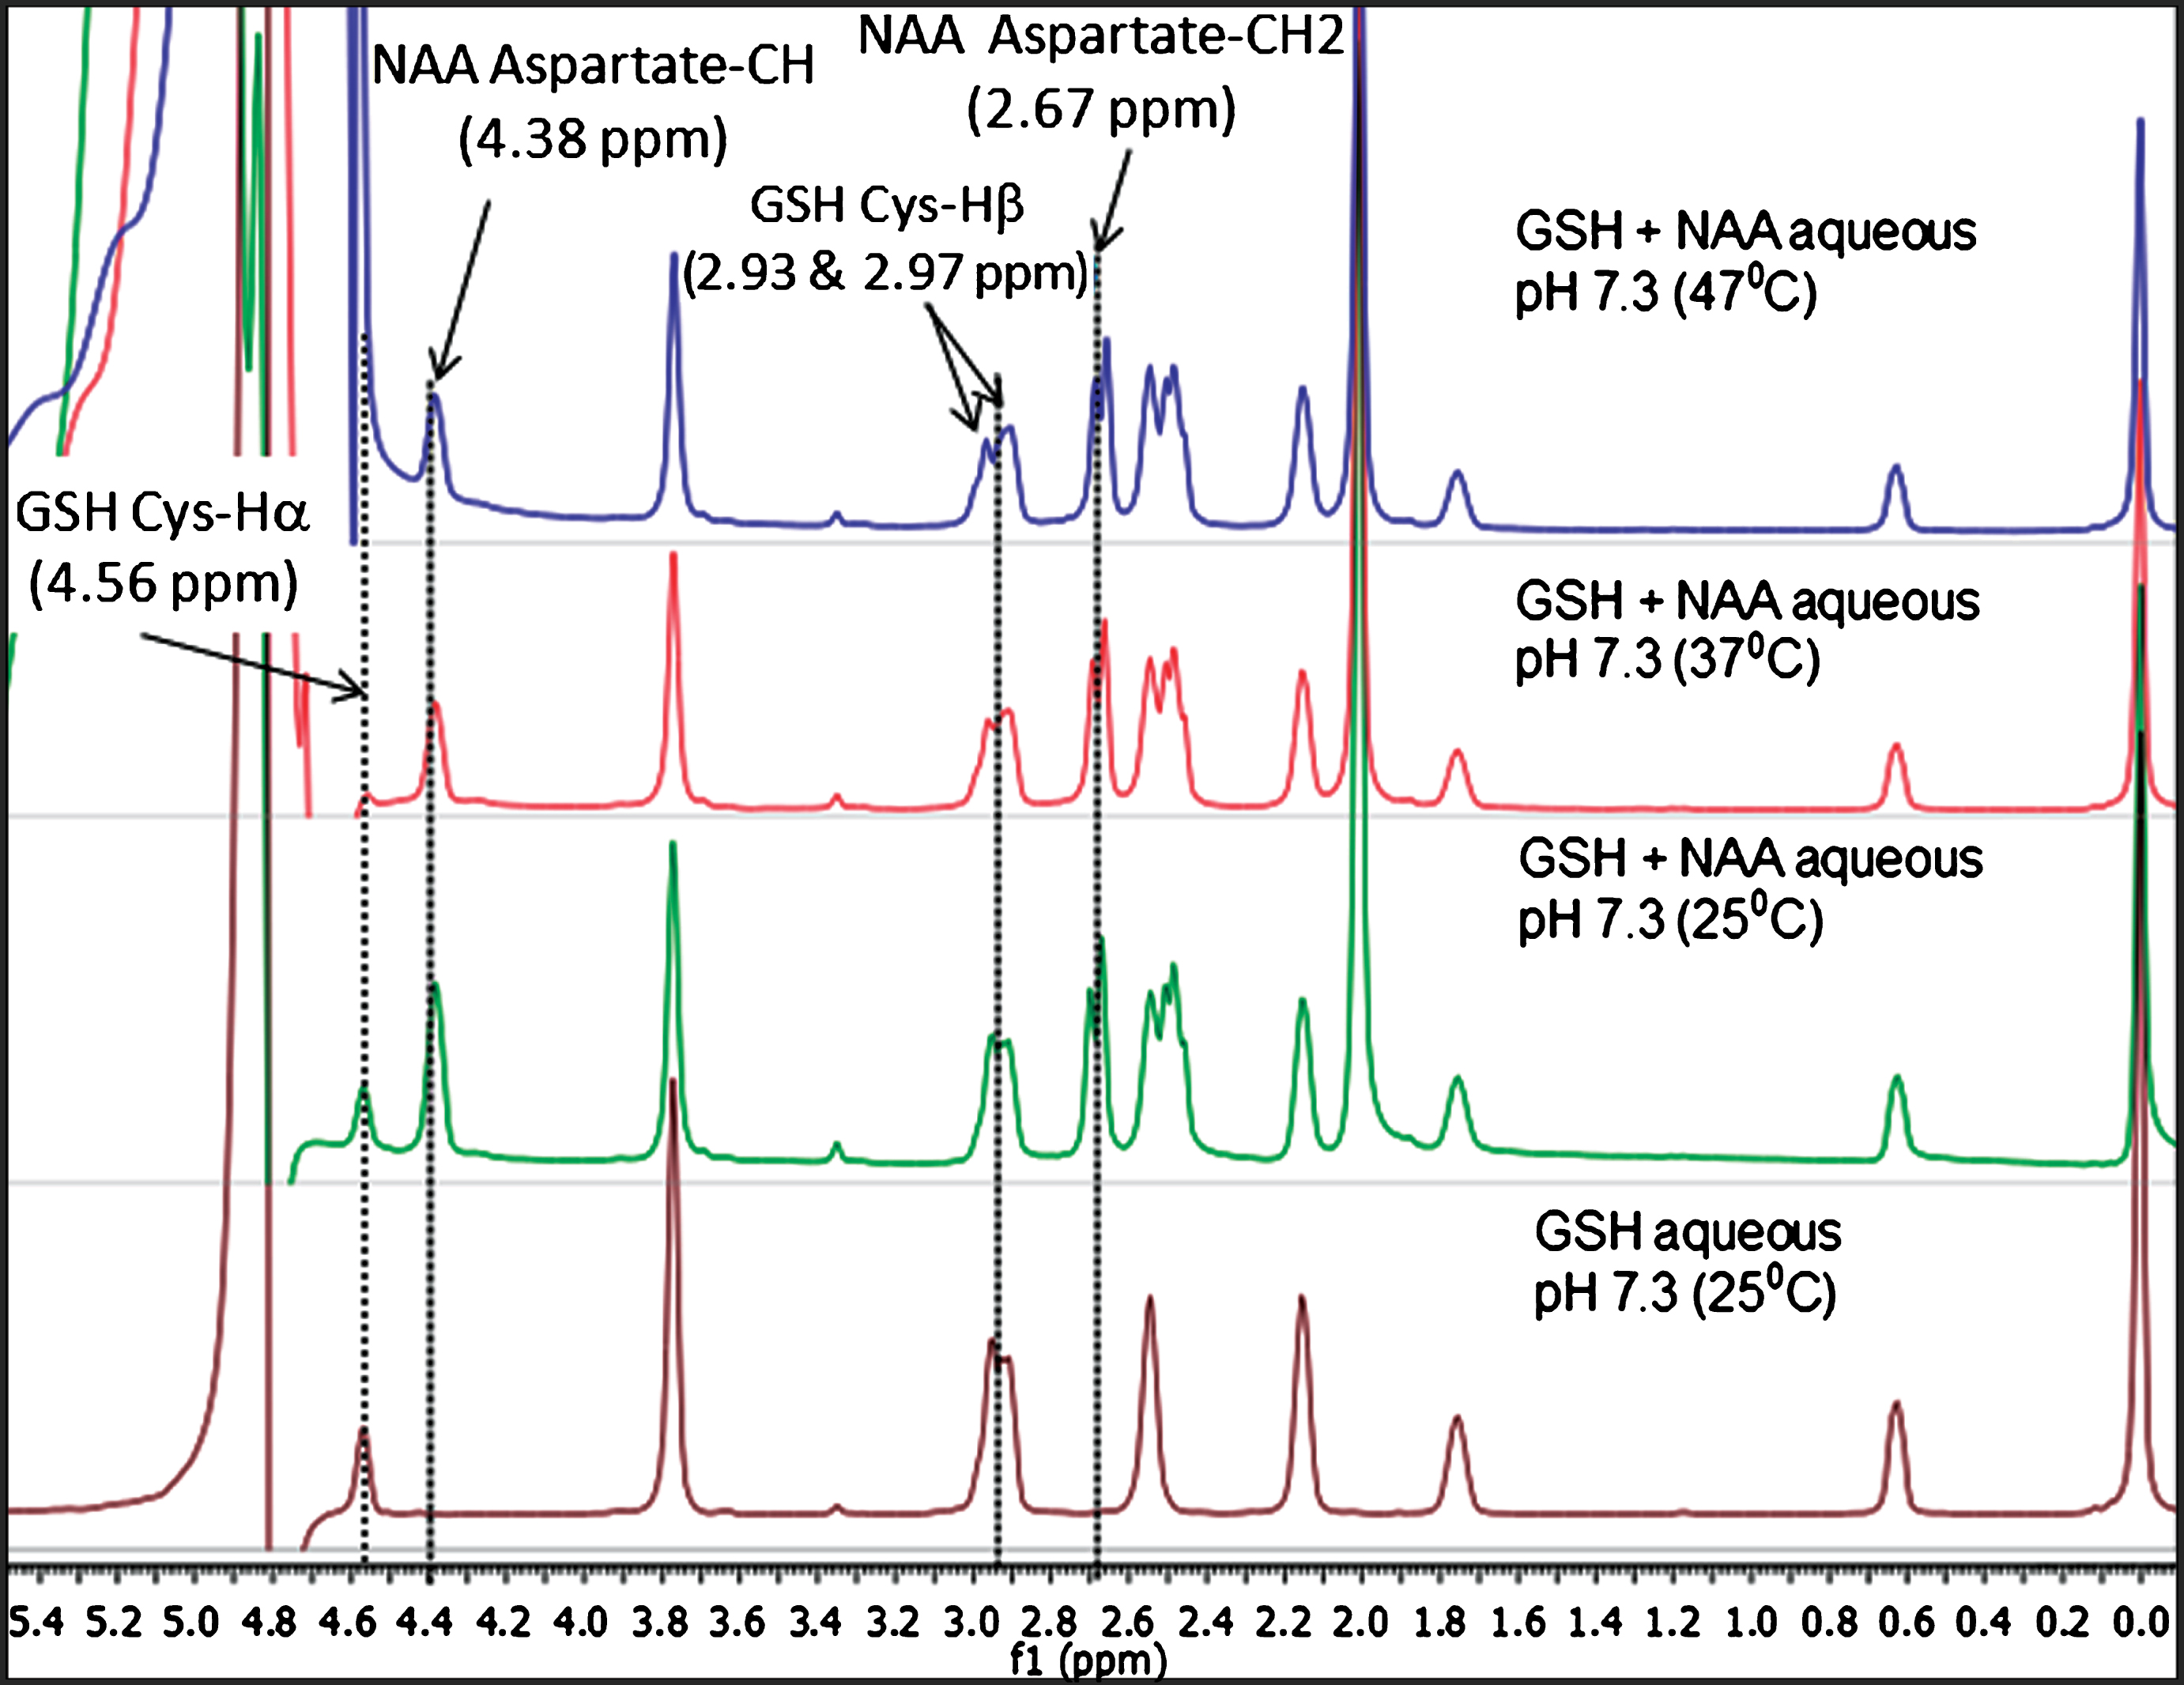
Since N-acetyl aspartate (NAA) is available in high concentration (9–14 mM) [28] in human brain and the aspartyl CH2 peaks also appear in MEGA-PRESS pulse sequence during in vivo GSH detection [2, 23, 29, 30], we have also performed NMR studies of NAA and NAA+GSH samples at various temperatures. Figure 4 illustrates the temperature dependent NMR studies for GSH and GSH+NAA samples at various temperatures (25°C, 37°C, and 47°C). High resolution NMR spectra of GSH+NAA show that the aspartate-CH2 peaks of NAA at 2.67 ppm and 2.49 ppm [8, 28] are well separated from the GSH Cys-Hβ peak at 2.95 ppm. The motivation for this comparative temperature study as presented in Fig. 4, is to establish that only the water peak shifts with temperature, while the chemical shift positions of NAA and GSH are unaffected.
Fig.4
Comparison of relative peak positions of GSH and GSH+NAA samples in phosphate buffer saline (PBS) using NMR study over different temperatures. (A) 1D NMR for GSH in PBS solution at 25°C, (B) 1D NMR for GSH+NAA PBS solution at 25°C, (C) GSH+NAA in PBS solution 37°C and, (D) GSH+NAA in PBS solution at 47°C using 500 MHz NMR.
In vivo human brain GSH and its conformations
Synthesis of information from the existing NMR studies [6] are extremely helpful for selecting the excitation pulse position (e.g. 4.40 ppm or 4.56 ppm) to identify GSH conformation in vivo. Figures 5–7 demonstrate the existence of the two GSH conformers in vivo irrespective of the selected parameters under the effect of variable TE and inversion (OFF) pulse positions, scanners, and population, respectively. In vivo MRS data have been acquired from NBRC and Bergen using the same experimental protocol. Further details of our MEGA-PRESS experiments are as follows:
Fig.5
In vivo GSH conformer detection using MEGA-PRESS sequence using 3T Philips and GE scanners with the two MEGA-ON pulse positions, i.e., 4.40 ppm (A) and 4.56 ppm (B) and analysis of relative peak positions and phase of the two GSH conformation using same experimental parameters. Effect of different echo times on the two MEGA-ON pulse positions using both the Philips and GE scanners has been demonstrated for variable TE (120 ms, 125 ms, 130 ms and 140 ms) using MEGA-ON pulse at 4.40 ppm (A) and at 4.56 ppm (B). The selective excitation 180° pulse is applied at 4.40 ppm (for closed conformer) and 4.56 ppm (for extended conformer) (TE = 120 ms and TE = 125 ms give the two out of phase conformer peaks while the same two peaks appear in-phase for TE = 130 ms and TE = 140 ms. Excitation with ON-pulse at 4.40 ppm gives a sharp and heightened peak at ∼2.80 ppm and a broad peak at ∼2.95 ppm; however, ON-pulse at 4.56 ppm results in nearly equal peak shapes and area at two different positions) as the two GSH conformal peaks). The peaks are labeled as: GSHex refers to Cys-Hβ extended form; GSHcl refers to Cys-Hβ closed form; NAA-CH2 refers to NAA-Aspartate CH2 group.
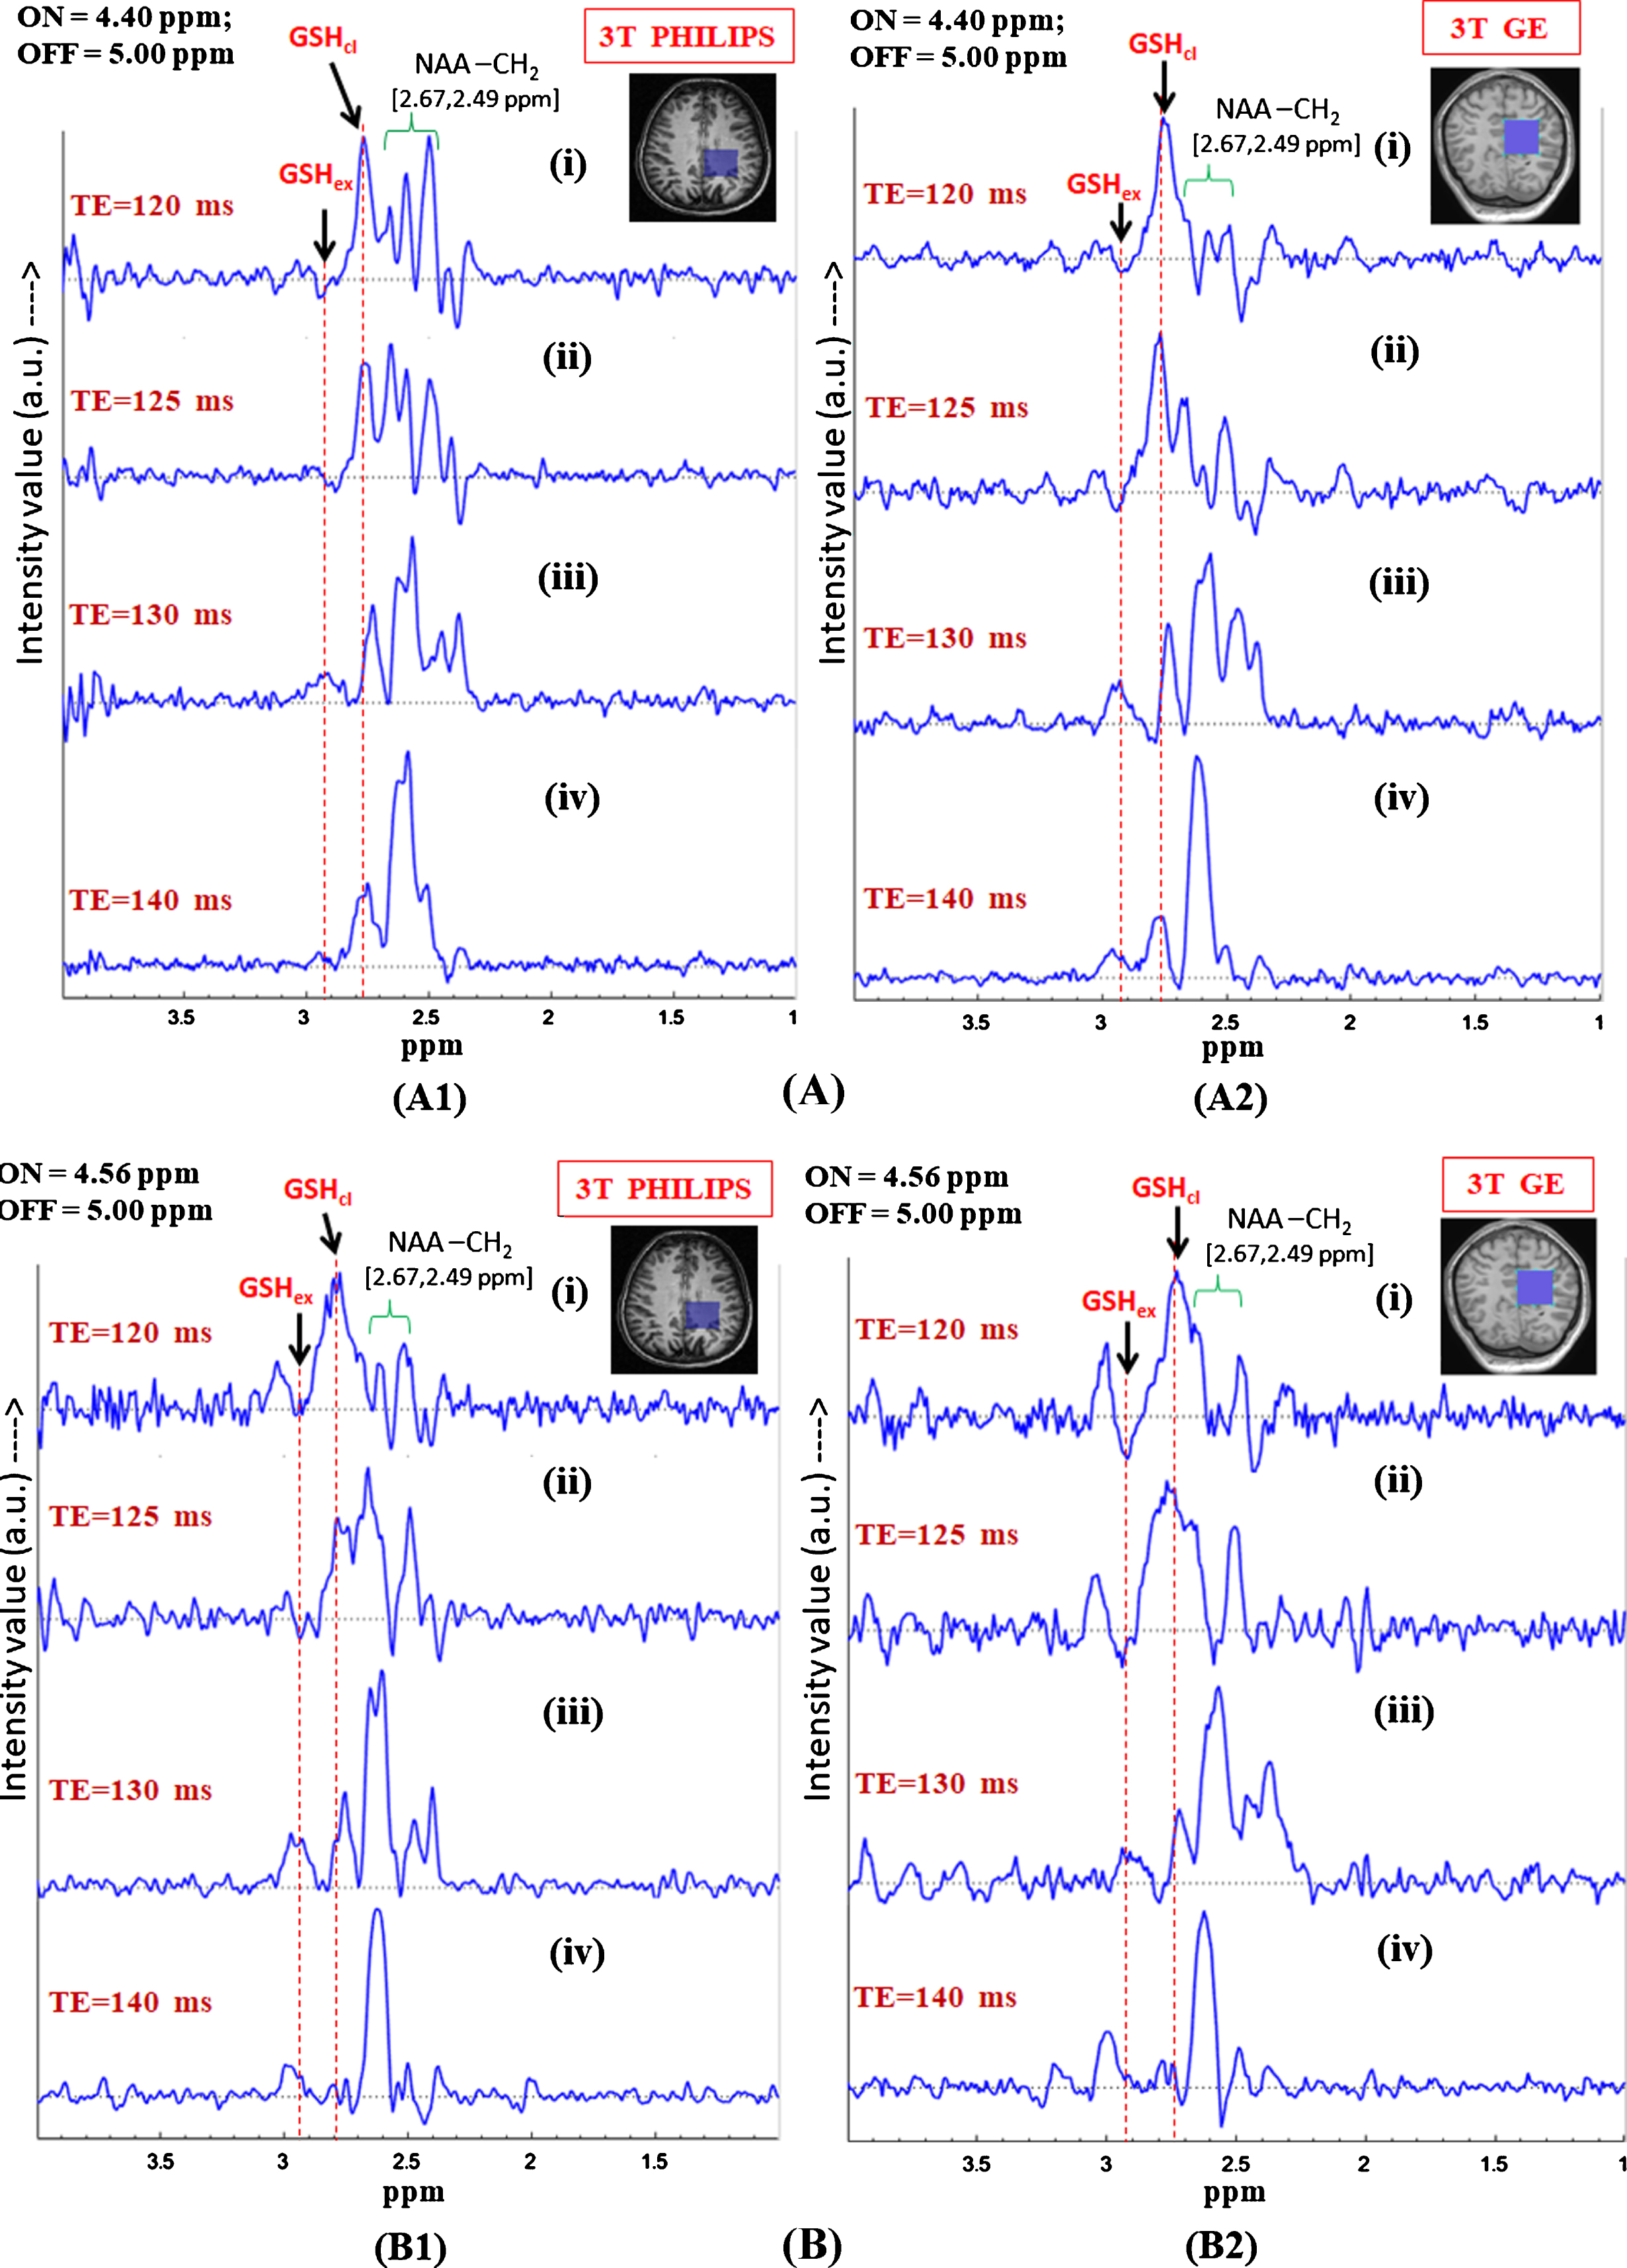
Fig.6
Effect of inversion pulse position on the in vivo GSH conformer peak detection using MEGA-PRESS sequence. Validation of the two GSH conformal peaks in different published protocols for MEGA-ON, MEGA-OFF (ON/OFF = 4.40 ppm/5.0 ppm; 4.40 ppm/7.22 ppm; 4.56 ppm/5.0 ppm, 4.56 ppm/7.22 ppm; TE = 120 ms; TR = 2500 ms, voxel size = 3.5×3.5×3.5 cm3 on left parietal cortex) using (A) Philips scanner (Indian site) (B) GE scanner (Norwegian site) (both the peaks are present irrespective of the chosen protocols).
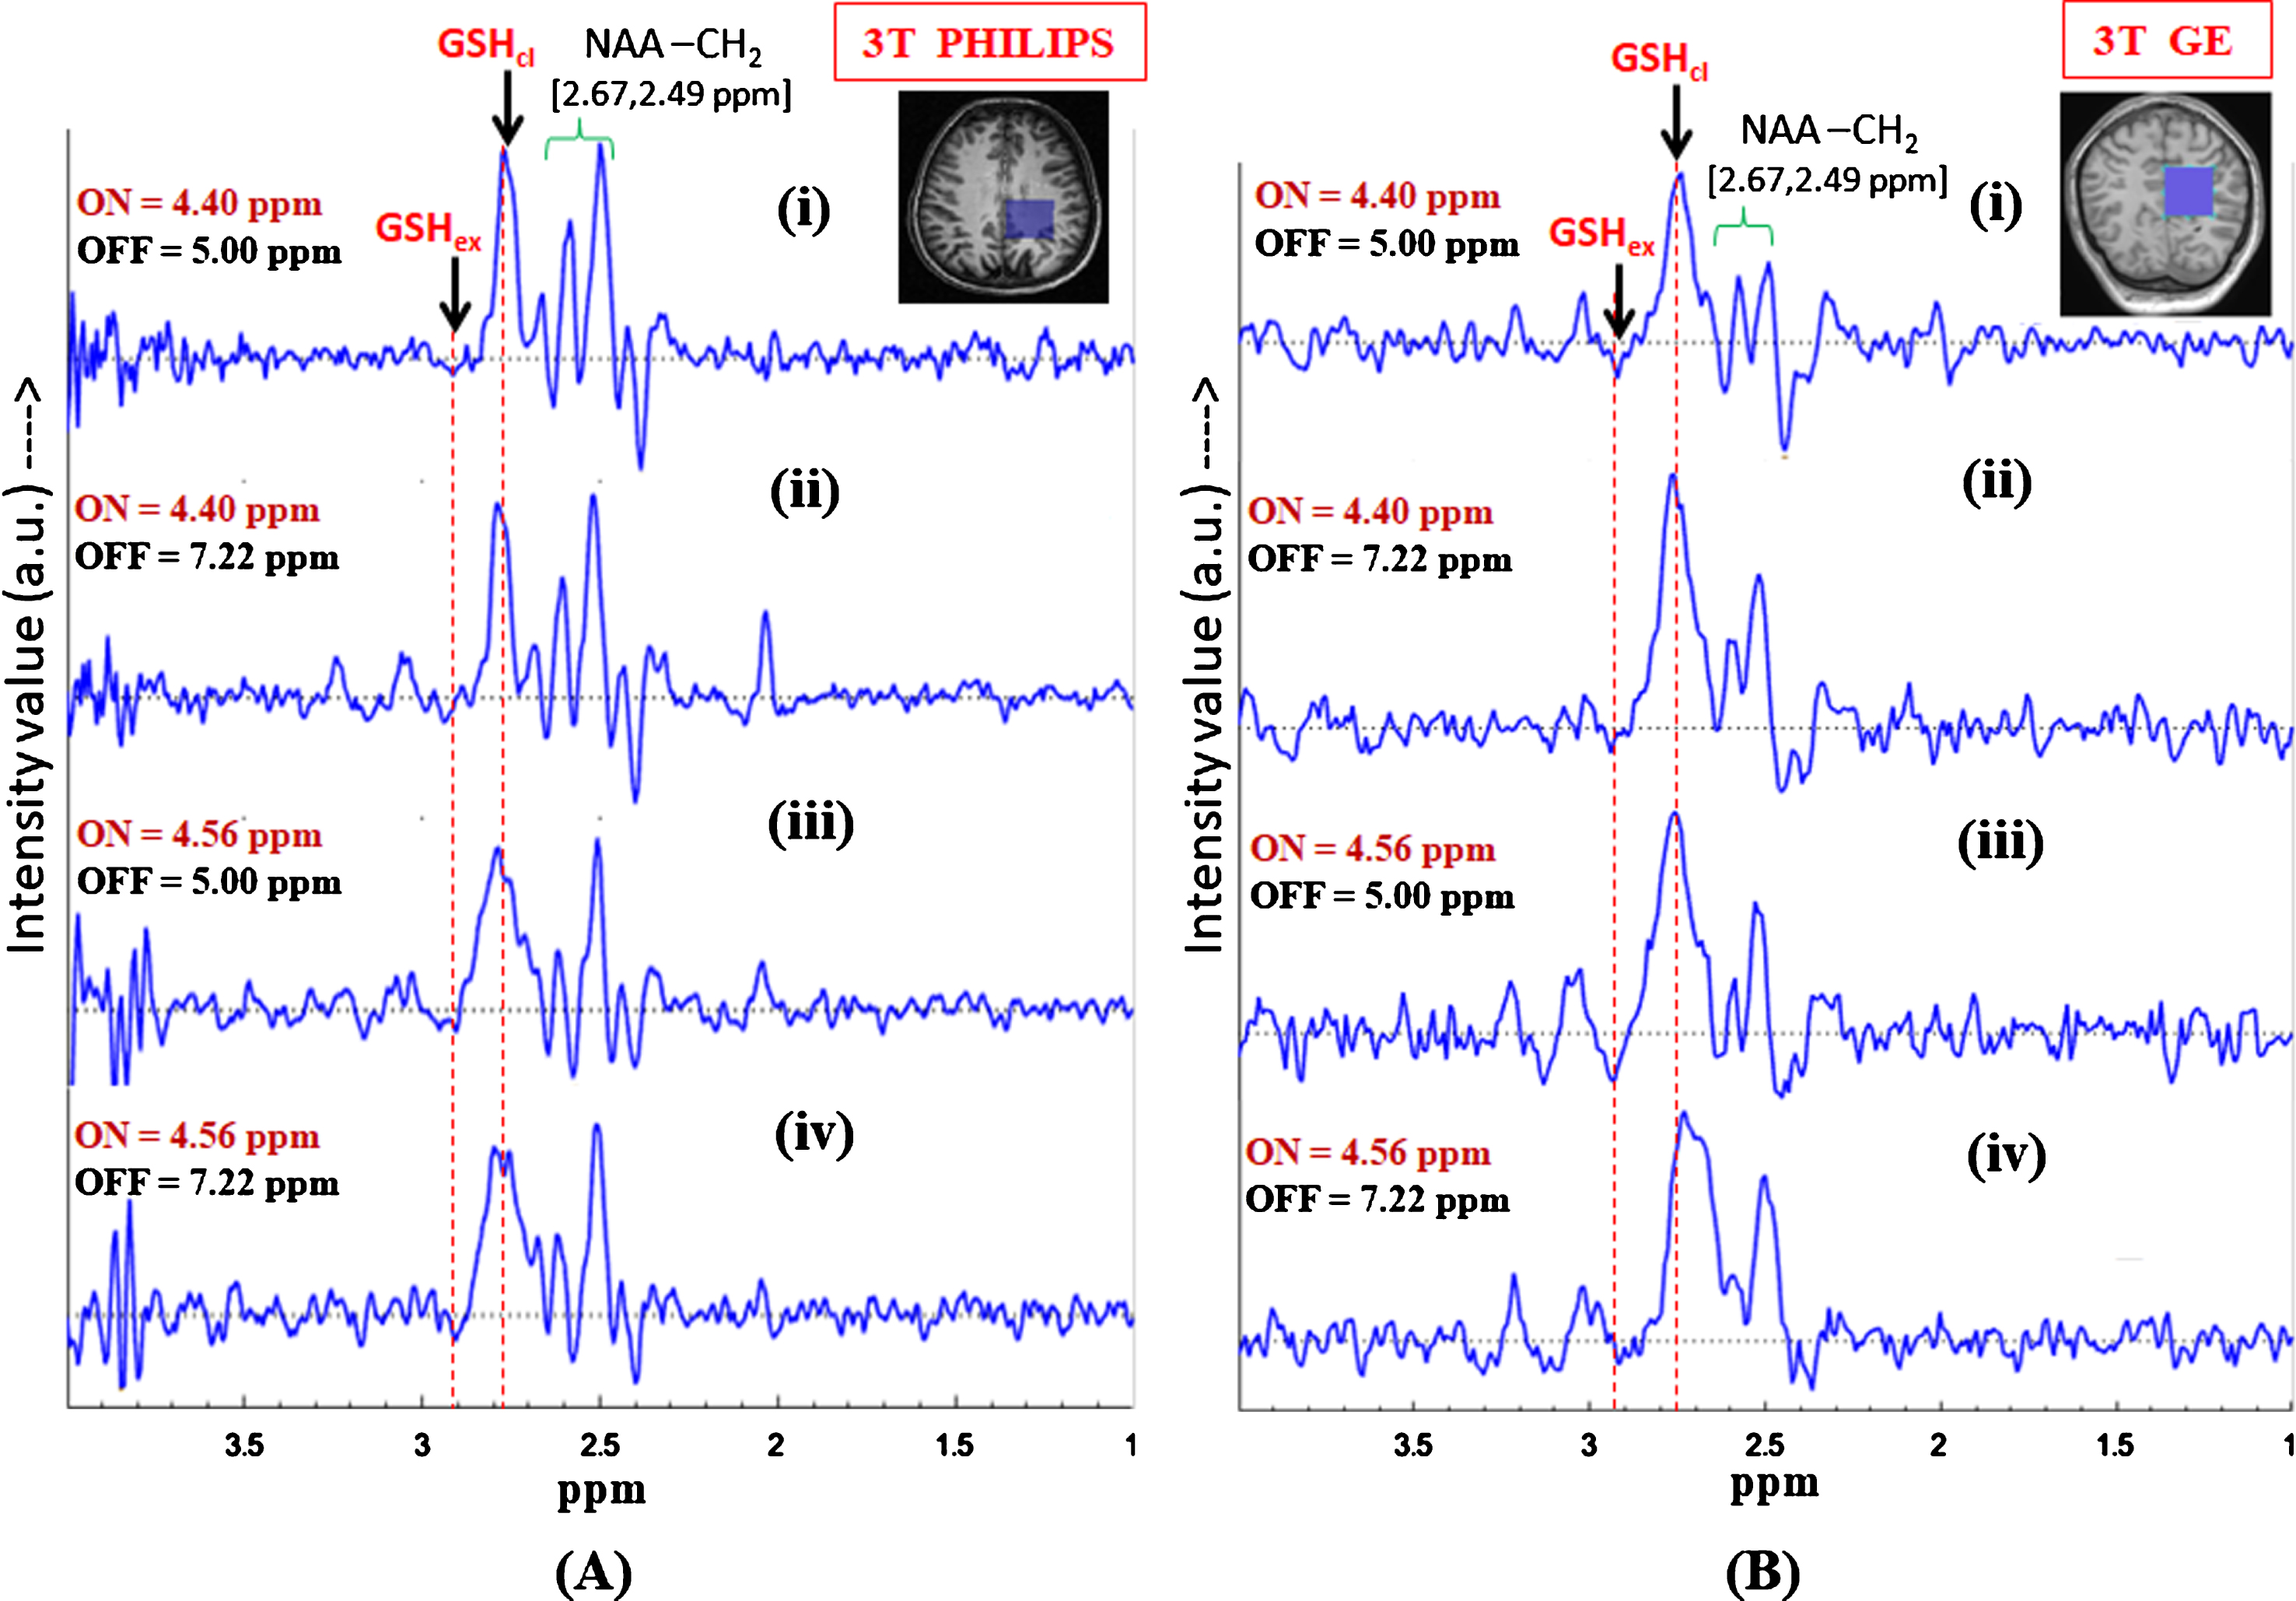
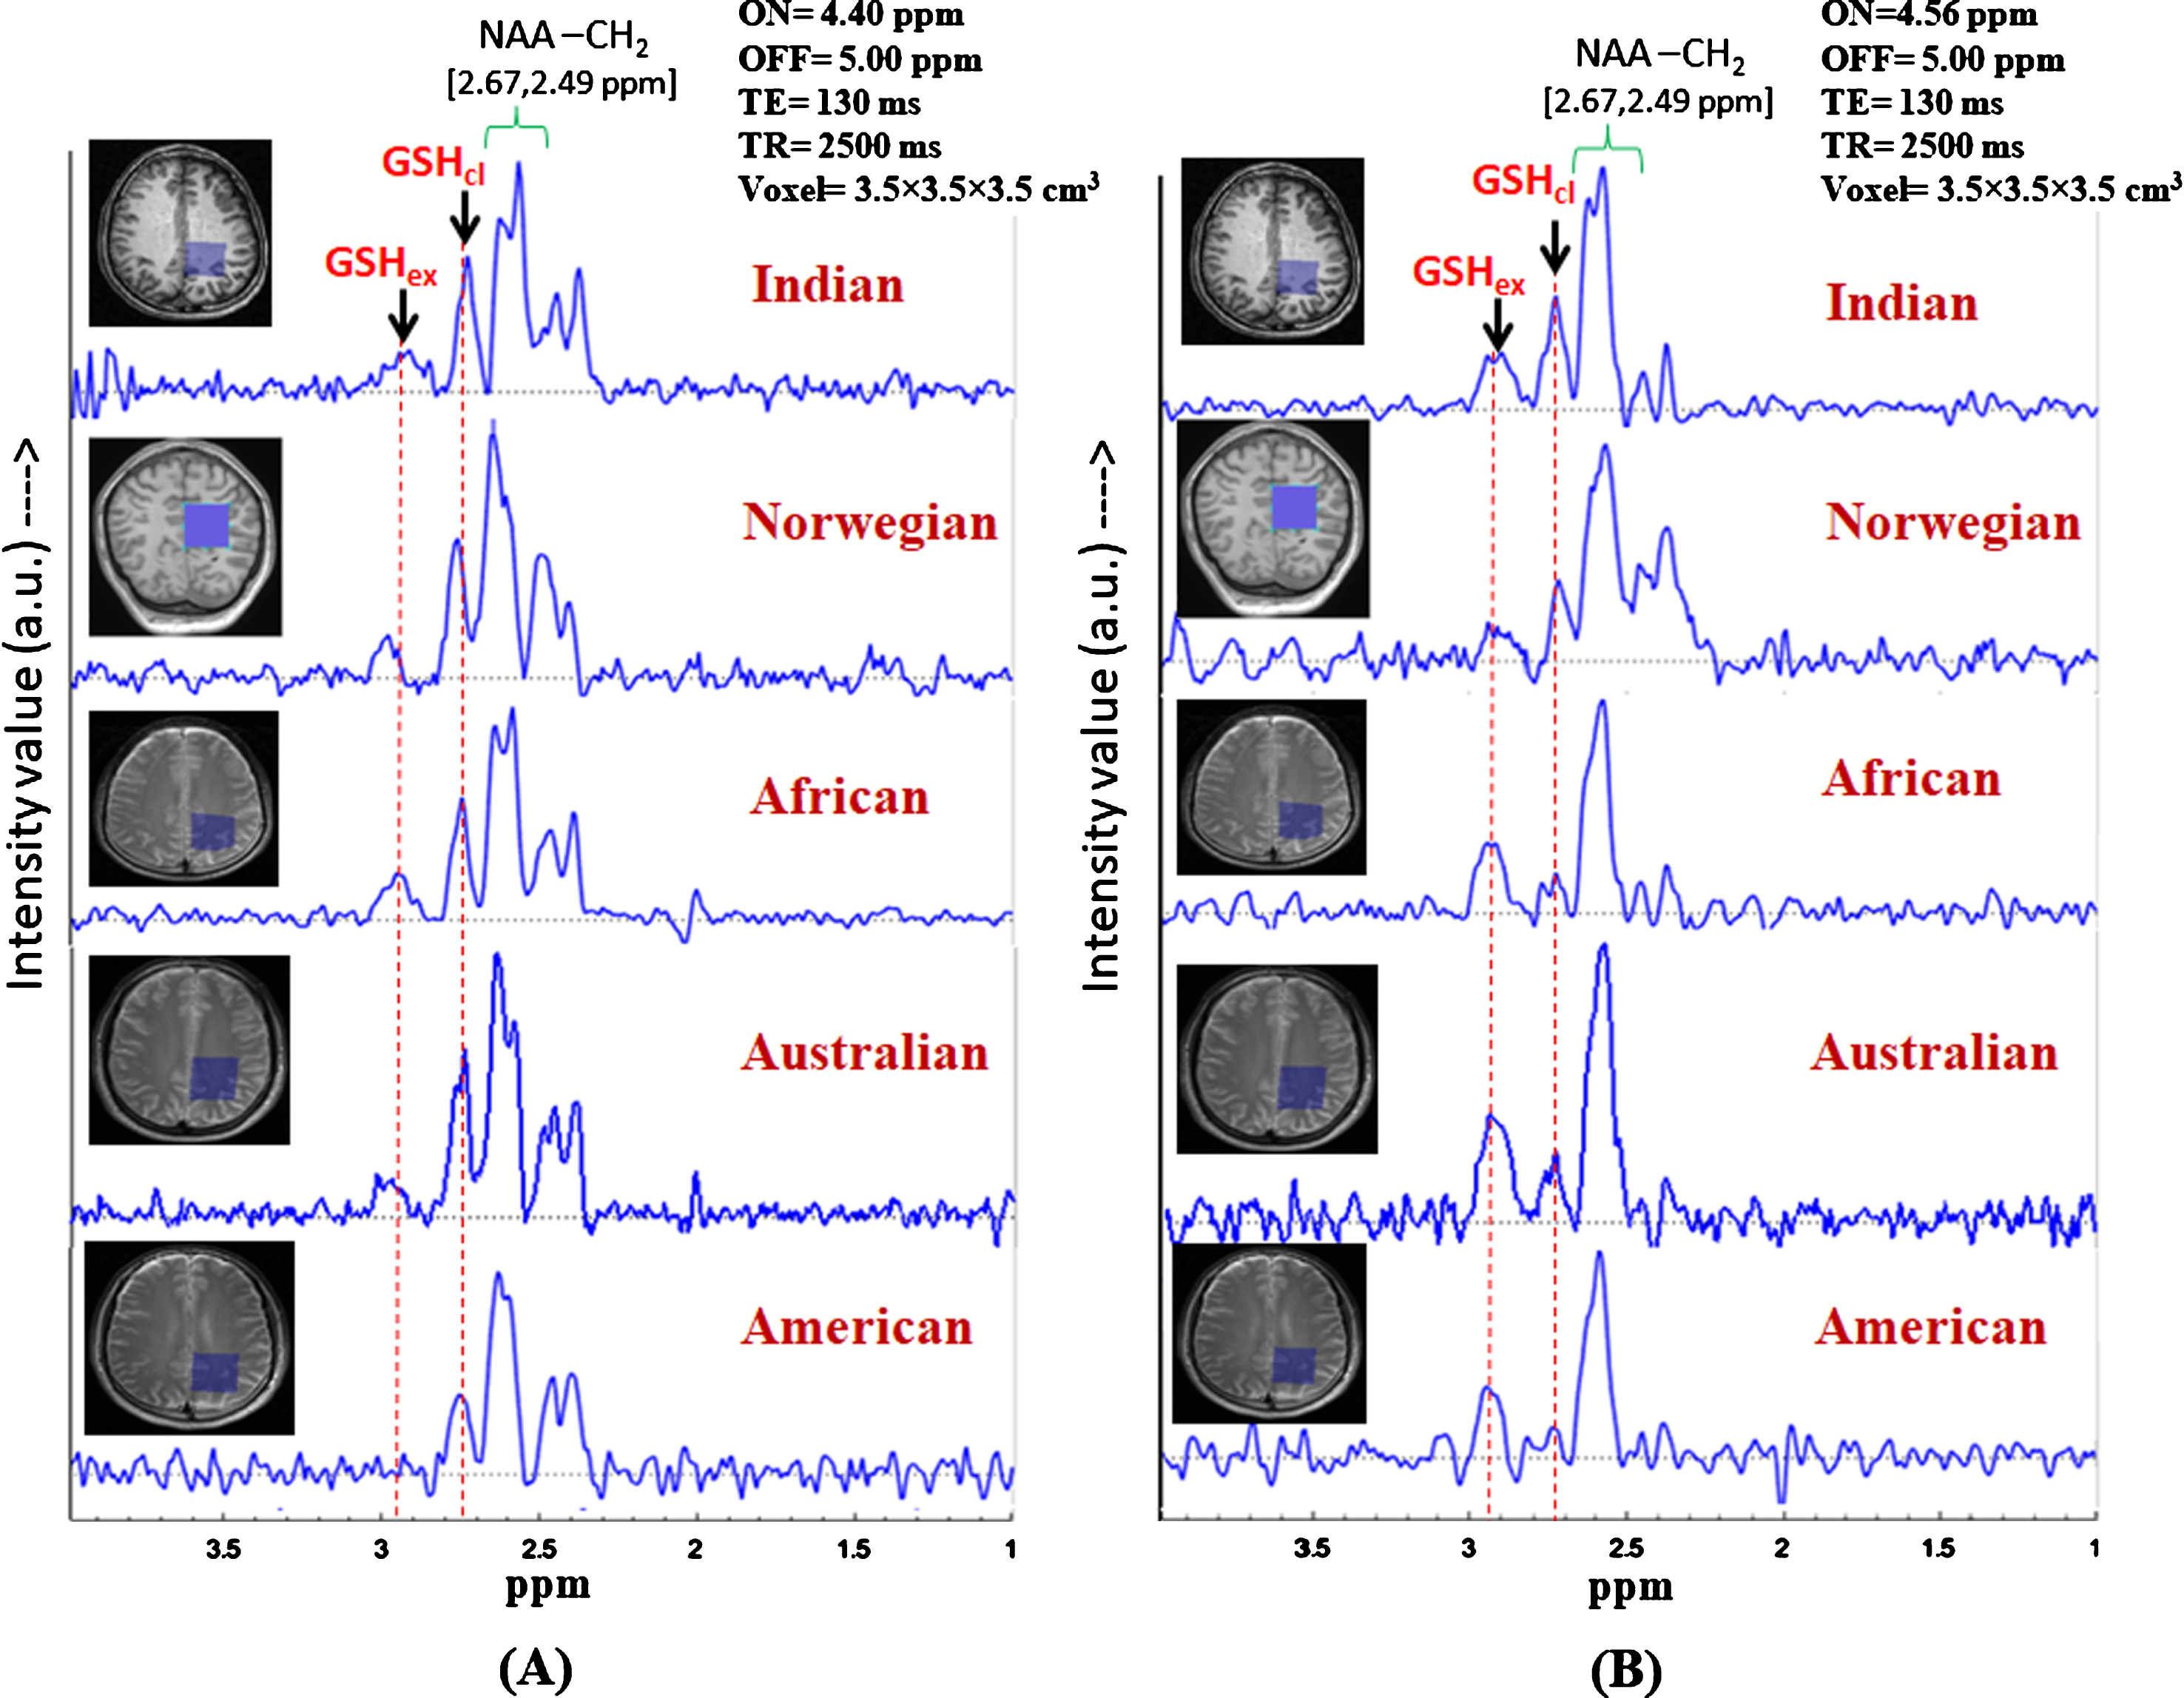
Fig.7
Identification of the two in vivo GSH conformer peaks in controls subjects from different continents. (Data from Indian subject, subject from African, Australian, and American origins are collected using Philips scanner at NBRC, India, and data from Norwegian subject is collected using GE scanner at Bergen, Norway). Same MRS protocol was used for data acquisition: TE = 130 ms, TR = 2500 ms, (A) MEGA-ON/OFF = 4.40 ppm/5.00 ppm and, (B) MEGA-ON/OFF = 4.56 ppm/5.00 ppm) (voxel size = 3.5×3.5×3.5 cm3 on left parietal cortex).
J-couplings of Cys-Hα peaks in the extended (4.56 ppm) and the closed (4.40 ppm) conformations of GSH are used in our in vivo MEGA-PRESS study. Figure 5 shows the in vivo results from two centers including data from Philips and GE scanners for analyzing the effects of editing pulse positions at 4.40 ppm (Fig. 5A) and 4.56 ppm (Fig. 5B). It has been found that, in both conditions, the two GSH conformer peaks, i.e., extended form at ∼2.95 ppm (marked by GSHex) and closed form at ∼2.80 ppm (marked by GSHcl), as well as the aspartate (-CH2) group of NAA at 2.49 ppm and 2.67 ppm (marked by NAA-CH2) are present. Based on the observations from NMR sample study, in vivo MEGA-PRESS data was acquired with the editing ON-pulse applied at 4.40 ppm (GSH Cys-Hα), and the J-coupled peak at 2.80 ppm (GSH Cys-Hβ) was observed. Figure 5A1 and 5B1 show the results for edited GSH MEGA-PRESS data acquired from 3T Philips scanner with a voxel size of 3.5×3.5×3.5 cm3 on left parietal cortex with ON-pulse set at 4.40 ppm and 4.56 ppm, respectively. The two figures are arranged as stacked edited spectra of the two ON-pulse positions acquired with different TE values, and it is observed that, while the Cys-Hβ of the two GSH conformers appear out-of-phase for TE = 120 ms and 125 ms, they are in-phase for TE values of 130 ms and 140 ms. In the case of the ON-pulse at 4.40 ppm, the signal from the closed conformer at 2.80 ppm is sharp and more intense, while the other form of GSH at 2.95 ppm appears as a broad peak. In contrast, application of the ON-pulse at 4.56 ppm shows a higher proportion of the extended conformer peak at 2.95 ppm over the peak at 2.80 ppm. However, relative MRS signal observed for one of the two detected GSH conformer peaks depends on the selection of 180° refocusing (ON) pulse, which is clearly evident in Fig. 5A1(iv) and 5B1(iv). Conclusively then, as demonstrated in our in vitro GSH studies, the two GSH conformers also exist in vivo and the MRS signal intensity of the particular conformer depends on the selectivity of 180° excitation pulse at 4.40 ppm for the closed and 4.56 ppm for the extended form of GSH. In Fig. 5 (A2 and B2), MEGA-PRESS data recorded on the GE scanner (Norway) showed a similar GSH pattern for the data acquired using identical experimental conditions. Our multi-center GSH study with different populations and scanners therefore establishes that GSH exists in two different conformations irrespective of diversity of population and data acquisition methodology. To the best of our knowledge, the two GSH conformations have not been studied with respect to their relative in vivo changes.
DISCUSSION
The clinical significance of detection of the two GSH conformers becomes important for following reasons. Glutathione, a non-protein free thiol, is synthesized in cytosol from precursor amino acids glutamate, cysteine, and glycine [31]. GSH is involved in neutralizing free radical and reactive oxygen species, and serves as a radical scavenger in virtue of its unique electron donating properties [32]. GSH concentrations from the white and the gray matters of parietal cortex of autopsy brain (N = 5) were reported to be 1.18±0.09 mM and 0.89±0.03 mM, respectively [25]. GSH is reported to decrease with age and age-associated disorders [33]. Another autopsy study has reported that the hippocampus (N = 25) and frontal cortex (N = 31) undergo widespread oxidative stress as evident from the decrease in GSH level with age [34]. GSH level is an important indicator with healthy aging and neurodegenerative disorders, as well as in psychiatric disorders. Clinical study elsewhere [35] indicated the significant decrease in GSH levels in mild cognitive impairment (MCI) (N = 34) and AD (N = 45) using the plasma levels of GSH and age-matched (N = 28) control subjects.
Autopsy studies involving AD, Parkinson’s disease (PD), and dementia with Lewy bodies (DLB) have reported that the GSH level in the cingulate cortex region of AD patients is reduced by 49% as compared to age-matched control subjects; such a specific change is not found in PD and DLB patients [36].
Another postmortem study in MCI, mild and, severe AD brains has revealed depleted GSH levels in post-mitochondrial supernatant, mitochondrial, and synaptosomal fractions from frontal cortices, as compared to controls [37]. GSH depletion pattern similar to those from the above autopsy studies have been reported in one of our earlier studies using MEGA-PRESS MRS in healthy control, MCI, and AD subjects [2]. We have found the reduction in GSH selectively in the brain regions (frontal cortex and hippocampus) affected by AD pathology, but not in the cerebellum [2]. GSH depletion has also been correlated with behavioral studies involving cognitive impairment [2, 5].
GSH conformation in vitro
To understand the conformational changes of GSH, molecular dynamics [11–14], Raman spectroscopy [15, 16], and sample studies with NMR [17, 18] have been published. Molecular dynamics studies have shown that the structural conformation of GSH is very flexible in aqueous solution and an inter-conversion occurs between the extended and the folded forms [12]. The various chemical shifts of Cys-Hα and Cys-Hβ resonance peaks are indicative of the conformational status of GSH. In our earlier report [6], we correlated Cys-Hα and Cys-Hβ peak positions to the corresponding closed (4.40 ppm and 2.80 ppm) and extended (4.56 ppm and 2.95 ppm) conformations of GSH. The COSY spectra of aqueous GSH sample (Supplementary Figure 2) clearly show a J-coupling between Cys-Hα and Cys-Hβ at 4.40 ppm and 2.80 ppm [18], which is additionally validated by results from the spin-connectivity between Cys-Hα and Cys-Hβ at 4.40 ppm and 2.80 ppm in total correlation spectroscopy (TOCSY) of GSH in aqueous medium under degassed condition (Fig. 3B) [19]. The stable GSH form is reported in DMSO solvent [12] and two dimensional COSY spectrum of GSH in DMSO shows off-diagonal cross-peak connection of Cys-Hα, Cys-Hβ at 4.40 ppm and 2.80 ppm [18]. In the aqueous medium, the closed conformation of GSH, the chemical shift of Cys-Hα and Cys-Hβ [18] from COSY spectra as well as the TOCSY spectra of GSH shows cross-peak connectivity between 4.40 ppm and 2.80 ppm [19] resembling NMR spin connectivity of Cys-Hα and Cys-Hβ (cross peak between 4.40 ppm and 2.80 ppm) of GSH in DMSO [18]. On the contrary, in the case of extended GSH Cys-Hα and Cys-Hβ TOCSY spectra, cross peak connectivity is observed between 4.56 ppm and 2.95 ppm. The NMR chemical shift positions of Cys-Hα and Cys-Hβ of GSH are reflective of conformational states (extended or closed conformer) or completely oxidized (GSSG) form. Published NMR studies are analyzed to demonstrate the oxidation sensitivity of GSH [19]. It is found that cysteine peaks (Cys-Hα and Cys-Hβ) are more susceptible to the surrounding environment, and the effect of oxygen tension in local environment is reflected as the transitional shift in both the Cys-Hα and Cys-Hβ peak positions (GSH in degassed sample (Cys-Hα 4.40 ppm, -Hβ: 2.80 ppm) [18, 19]; aqueous non-degassed (Cys-Hα 4.56 ppm,-Hβ ppm) [8]; oxidized GSH (GSSG) (Cys-Hα: 4.65 ppm, -Hβ (3.26 and 2.96 ppm) [38]). It is important to note that the chemical shift information of GSH conformers from phantom studies may not lead to sufficient accuracy, firstly because of the difficulty in reproducing the local cellular and anaerobic or aerobic physiological conditions in the brain and secondly due to the uncontrolled local environment within an MR scanner.
GSH conformation in vivo
GSH is sensitive to its surrounding environment due to the presence of thiol group and its sensitivity to biological activities. Low concentration of GSH in the brain and overlap of its spectral patterns with other metabolites make it difficult to detect it using commonly used PRESS sequences: thus a special MEGA-PRESS editing sequence based on GSH-Cysteine peak J-coupling is used for GSH detection. Information derived from the GSH NMR studies has confirmed two conformational states of GSH, which implies suitable experimental parameter selection in MEGA-PRESS MRS editing sequence for in vivo GSH detection. However, this is not the case for other popular in vivo metabolites such as lipid, lactate, NAA, glutamate, creatine, choline, and myo-inositol due to the absence of the thiol group in these metabolites. These metabolites do not have any known structural conformational states, and hence chemical shift information of these in vitro metabolites (except GSH) can be considered as gold standard for detection in vivo studies.
We overrule the interference from other metabolite peak positions in our GSH MEGA-PRESS data. The possible appearance of other brain metabolites at 2.80 ppm in terms of the peak positions of their protonic moieties may be rationalized further. As the human brain contains a variety of metabolites, the peak at 2.80 ppm should not be confused with NAA or aspartate (Asp). Selective editing pulse at 4.40 ppm being close to NAA-CH Asp moiety (i.e., 4.38 ppm), excites NAA–Asp CH2 peaks, which appear in the range of 2.49 ppm to 2.67 ppm of the edited GSH MEGA-PRESS spectrum [8]. Comparative NMR sample study of the GSH and GSH+NAA samples presented in Fig. 4, clearly shows the NAA-Asp CH2 peak at 2.67 ppm, which is absent in the 1D NMR spectrum of GSH sample. Neither any spectral shift could be reasonably envisaged as being due to a temperature difference between the high resolution NMR and in vivo experiments in the MRI scanner, nor could the peak at 2.80 ppm be considered as a spillover NAA peak. NAA peak under no condition can appear at 2.80 ppm giving a shift of 0.13 ppm (shift from 2.67 ppm). Similarly, for Asp, J-coupling between CH (3.89 ppm) and CH2 (2.80 ppm) cancels out the possible excitation of Asp at 2.80 ppm by exciting the coupled moiety at 4.40 ppm or 4.56 ppm [8]. Therefore, the excitation at 4.40 ppm or 4.56 ppm is by no means linked to any NAA or Asp peaks. The peak at 2.80 ppm using MEGA-PRESS sequence therefore leads to an unambiguous assignment of the GSH Cys-Hβ peak.
Effect of TE on relative phasing of the Cysteine β-CH2 peak of the two GSH conformers are also investigated. Figures 5 and 6 demonstrate the presence of two conformations of in vivo GSH at ∼2.95 ppm and ∼2.80 ppm. However, selection of ON-pulse position controls the relative proportions of the observed peaks of the two conformers. Spectral patterns corresponding to the two conformers indicate flexible conformal states of GSH molecules in vivo, possibly indicating GSH at two different local cellular environments. An initial investigation in protocol standardization led to the observation of relative phase changes in the two GSH conformers. It is observed that the two GSH peaks appear out of phase for TE = 120 ms, while they are in-phase for TE = 130 ms. Modulation of the relative peak phases due to such small difference of TE values is still unclear; however, the results demonstrate the same observation with data from another center. To further validate the observation on the effectiveness of the TE selection in MEGA-PRESS MRS sequence, results with transitional TE values (i.e., 120, 125, 130, and 140 ms) have also been demonstrated in Fig. 5. TE = 120 ms and 125 ms result in opposite-phasing of the two conformers, while higher TEs of 130 ms and 140 ms give in-phase conformal peaks at their consistent positions. This is a possible indication of a slight variability in the spin-spin relaxation time (T2) of the two conformers. In any case, the above echo time variation substantiates the existence of in vivo GSH conformers, where the change of echo time should only affect the relative peak phasing, and not the resonating coupled peak positions.
Effect of inversion pulse position on in vivo GSH conformers are observed by following the earlier published studies which considered only one (extended (2.95 ppm) [23] or closed (2.80 ppm) [2]) form of GSH. In the present study, to validate the co-existence of the two conformal peaks both the excitation ON-pulse positions, i.e., 4.40 ppm (closed/stable) and 4.56 ppm (extended), are compared with different OFF-pulse positions (5.00 ppm and 7.22 ppm) with TE = 120 ms. Figure 6 shows the edited GSH spectra from the data reproduced in our center (Fig. 6A) and Bergen (Fig. 6B) using following MEGA-PRESS experimental protocols: 1) Editing ON-pulse at 4.40 ppm, OFF-pulse at 5.00 ppm, TE = 120 ms, and TR = 2500 ms; 2) Editing ON-pulse at 4.56 ppm, OFF-pulse at 7.22 ppm, TE = 120 ms, and TR = 2500 ms [30].
Figure 6A shows the edited difference spectra of GSH from 3T Philips (India) using MEGA-PRESS sequence in the brain of a single subject, where application of the selective 180° pulse (ON-pulse) at 4.40 ppm enables observation of the closed form of GSH, while the ON-pulse at 4.56 ppm allows observation of the extended conformation of GSH. In both the cases, the inversion OFF-pulse was applied at 5.00 ppm. To further validate the observation of the peaks from the two GSH conformers, Fig. 6 shows results for additional data acquired with the inversion (OFF) pulse set at 7.22 ppm. For both cases of ON-pulse setting at 4.40 ppm and 4.56 ppm, it is found that the appearance of the two peaks and their positions remain consistent irrespective of the different inversion pulse positions at 5.00 ppm and 7.22 ppm. The two sets of data from two different scanners provide the same results, emphasizing our correct assignment of the two conformational peaks of interest.
Investigation of GSH conformers in various ethnicity in our multi-center study following the same experimental protocol (TE = 130 ms; TR = 2500 ms; ON-pulse at 4.40 ppm and 4.56 ppm; OFF-pulse at 5.00 ppm; voxel size = 3.5×3.5×3.5 cm3) is performed to further investigate the existence of the two GSH conformal states in voluntary subjects from different continental origins. Accordingly, GSH profiling over different population from different continents and different scanners was performed (Fig. 7). However, no significant differences were observed. This validates the selection of parameters for GSH conformer selectivity in vivo as the two conformal peaks observed at ∼2.80 ppm (closed) and ∼2.95 ppm (extended) without any ambiguity. Small dispersion of chemical shift in the range of 2.90 to 2.95 ppm and 2.76 to 2.80 ppm due to subject variability is reflective of the local micro-environmental differences in individual brains.
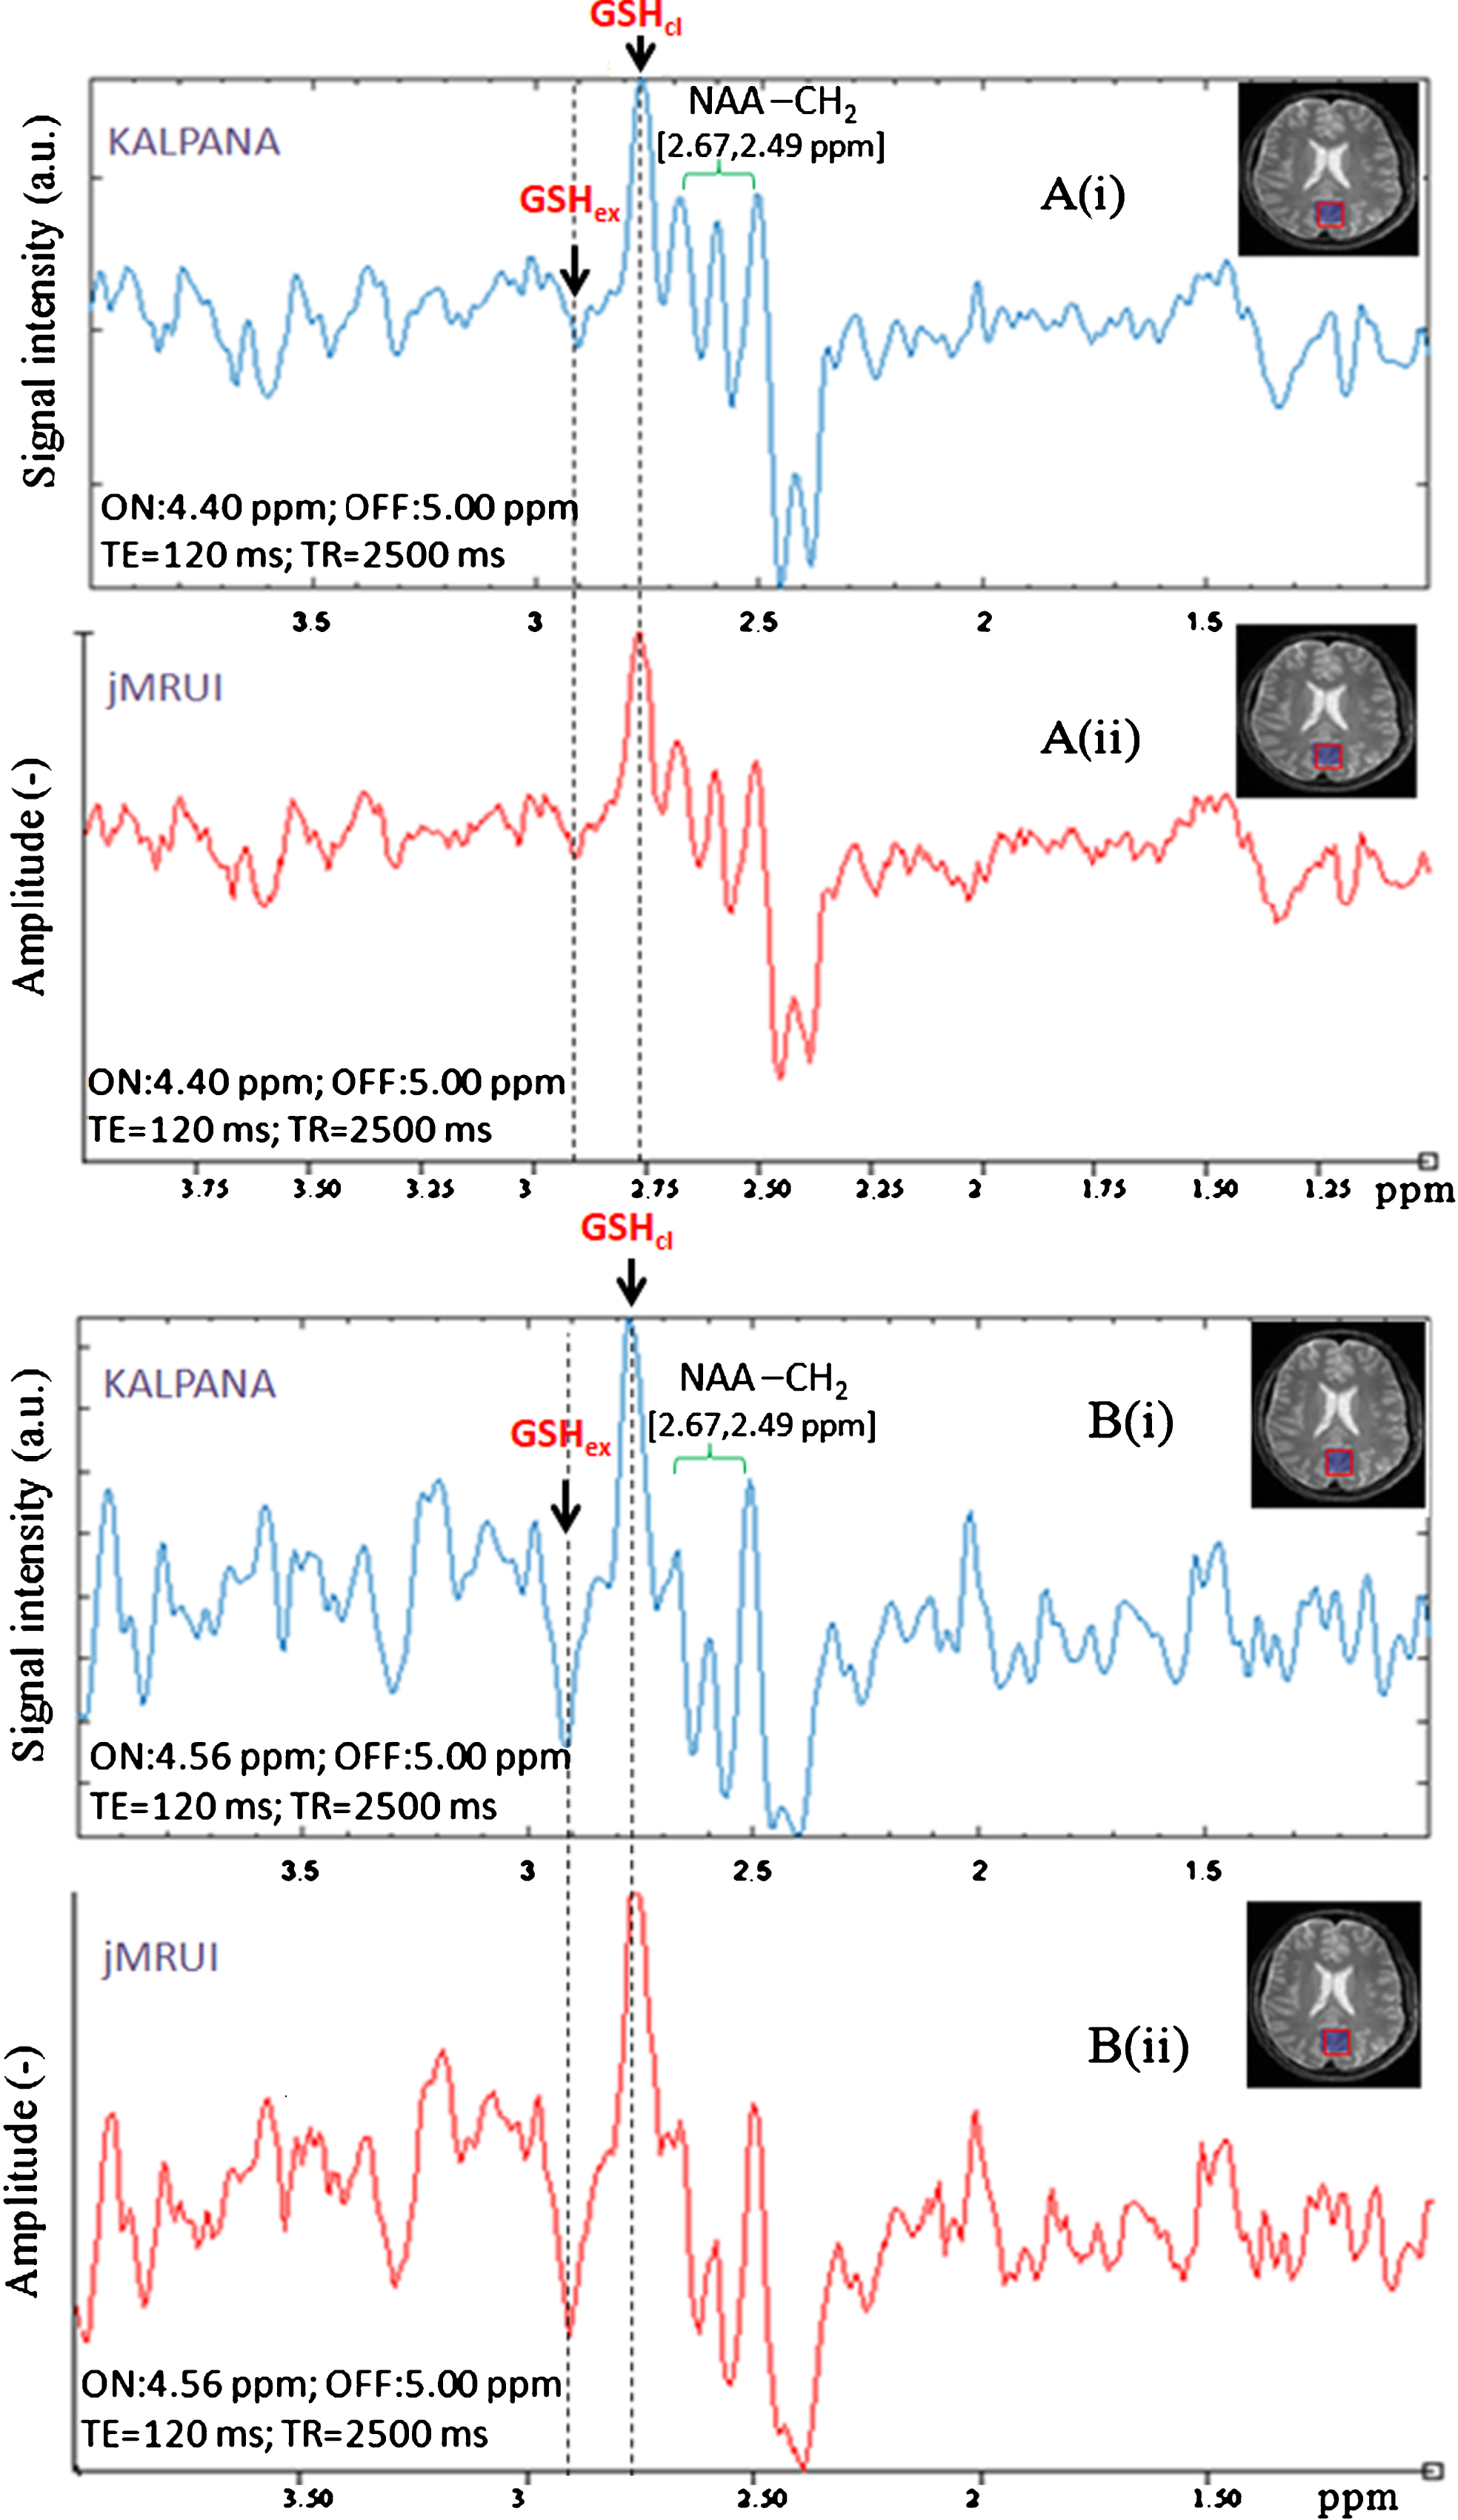
In order to compare results from our processing scheme in KALPANA for two sets of MEGA-PRESS data (selective 180° refocusing pulse at 4.40 ppm as well as at 4.56 ppm, TE = 120 ms, TR = 2500 ms), we have also processed the same data using jMRUI [39] and compared their spectral pattern in resulted edited spectra (Fig. 8A, B). Both the edited spectra were phase corrected for peak at ∼2.80 ppm, and the opposite phase peak at ∼2.90 ppm is highlighted with aligned dashed marker line. This clearly shows reproducibility of our data using KALPANA [2] and another independent jMRUI package [39]. Data processing validated with different software shows no ambiguity in processing and positions of the two GSH peaks of interest.
Fig.8
Validation of in vivo GSH conformers in edited MEGA-PRESS spectra processed using different software. A) Edited MEGA-PRESS spectra with excitation ON-pulse at 4.40 ppm, analyzed with two different phase corrections with respect to conformal peak positions. B) Edited MEGA-PRESS spectra with excitation ON-pulse at 4.56 ppm, analyzed with two different phase corrections w.r.t. conformal peak positions.
Quantitation of in vivo GSH conformations
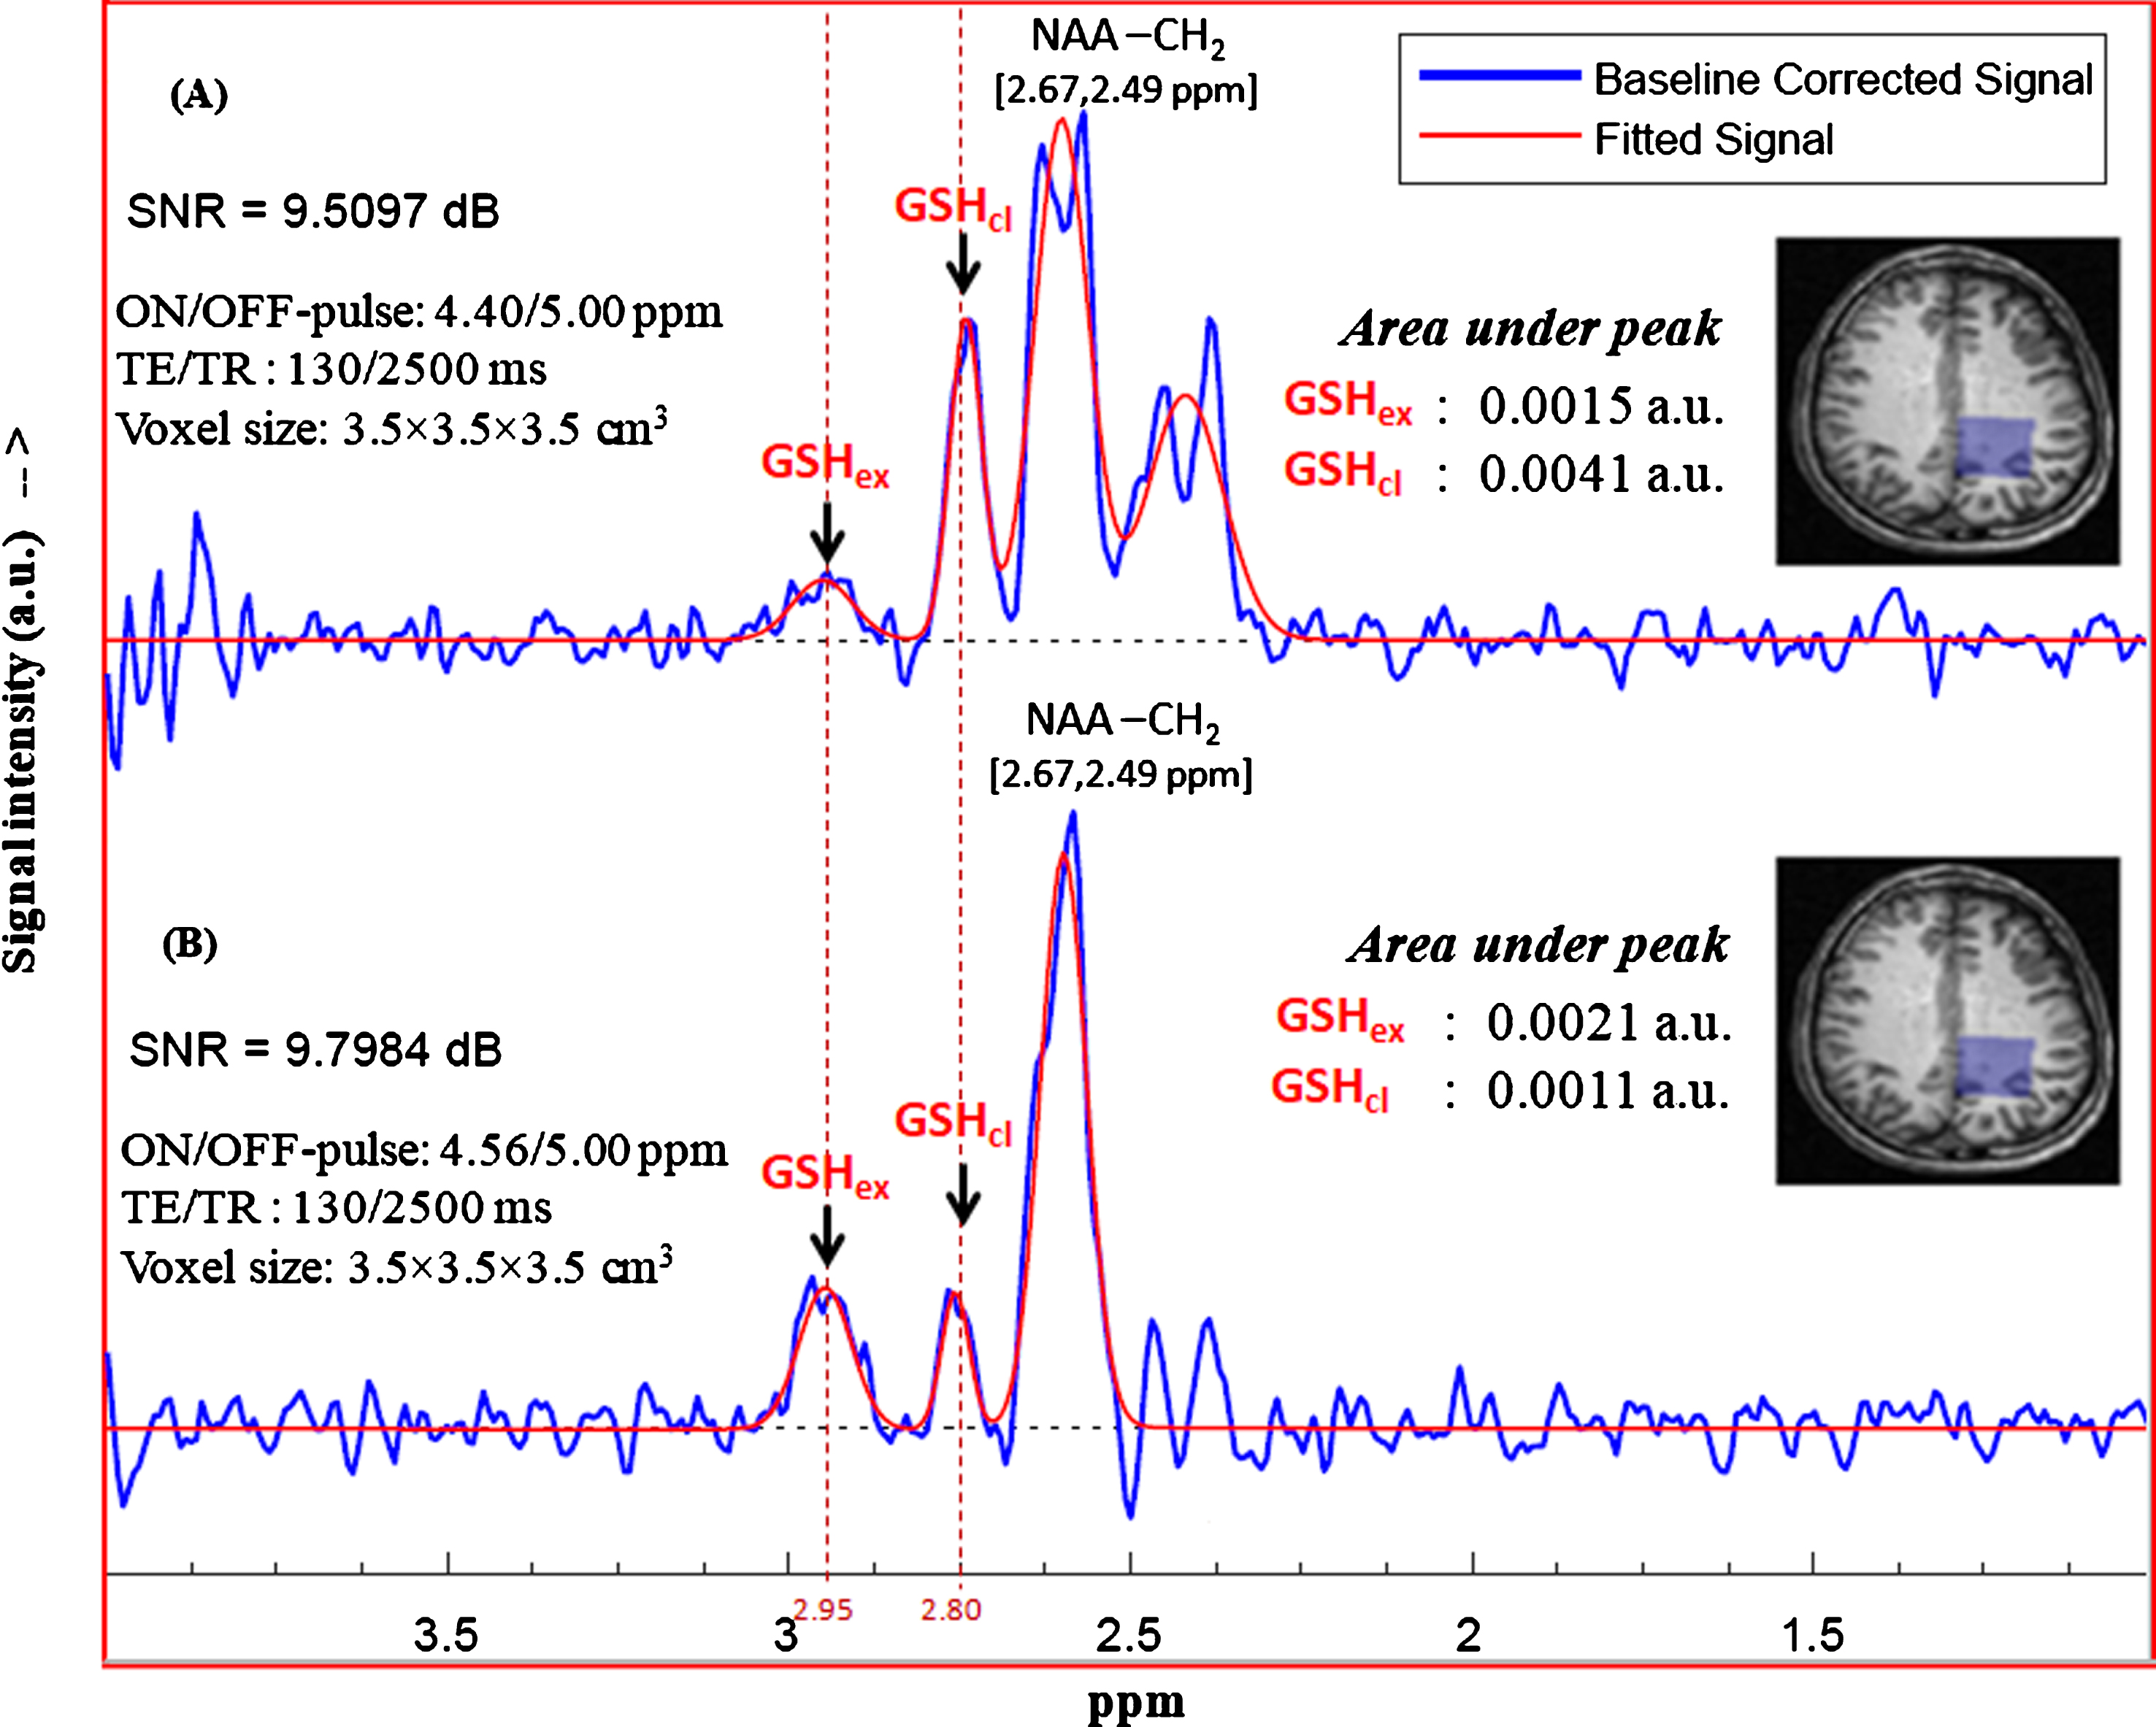
The results of in vitro NMR studies of GSH in aqueous medium confirmed the existence of two structural conformations of GSH at physiologically relevant temperatures and pH. To investigate the same in vivo, MEGA-PRESS sequence using the two sets of excitation pulses based on the J-coupling peaks for closed and extended conformations were chosen. MEGA-PRESS selective ON-pulse at 4.40 ppm relating closed conformation and ON-pulse at 4.56 ppm relating to extended GSH conformation were applied to get corresponding edited spectra. Figure 9 shows the fitted GSH edited spectra for the two set of MEGA-PRESS sequence parameters and the corresponding areas under the peaks of interest. It is found that both the conformational states of GSH are present in brain as characterized by the two Cys-Hβ peaks at 2.80 ppm and 2.95 ppm. Applying editing pulse at 4.40 ppm shows relatively intense peak at ∼2.80 ppm (closed/stable form of GSH), compared to the peak at ∼2.95 ppm (extended form of GSH) (Fig. 9A). Editing pulse at 4.56 ppm for estimating the extended form of GSH also resulted the two conformer peaks at same positions, and their relative amounts obtained with this editing pulse sequence were comparable (Fig. 9B). It is found that excitation at 4.56 ppm (ON-pulse) leads to the relatively intense peak for extended GSH conformer, while the similar processing in case of 4.40 ppm excitation results relatively intense peak for stable form of GSH. This relative content of the GSH can be linked to the probable distribution of the two conformations and choosing editing ON-pulse position at 4.40 ppm actually measures the stable form of GSH (Cys Hβ peak at 2.80 ppm) within the voxel.
Fig.9
Quantitation of the two in vivo GSH peaks using the two sets of excitation pulse positions at 4.40 ppm and 4.56 ppm. The MEGA-ON and MEGA-OFF excitation pulse positions are (A) 4.40 ppm and 5.00 ppm, (B) 4.56 ppm and 5.00 ppm, respectively. Data acquired from healthy young subject (voxel size = 3.5×3.5×3.5 cm3 on left parietal cortex) was processed to get absolute concentration of individual interest peaks (peak at ∼2.90 links to extended conformation and peak at ∼2.78 ppm links to closed (stable) form of in vivo GSH). The two peaks appear in-phase for the selected parameter set of TE = 130 ms, TR = 2500 ms).
Impact of GSH conformation identification in clinical studies
Most of the other published in vivo studies reported only one form of GSH (extended form) [3, 23, 26, 40] on healthy subjects. The closed form of GSH was obtained with the application of MEGA-PRESS editing ON-pulse at 4.40 ppm on three healthy age groups (20–40Y, 41–60Y, 61Y and above) [1], which indicates decrease in the closed form of GSH in the frontal cortices with healthy aging.
Studies from AD, PD, and DLB autopsy brains have reported that the GSH level in the cingulate cortex region of AD patients is reduced by 49% as compared to age-matched control subjects; but this GSH depletion is not specific to PD and DLB patients [36].
In our earlier in vivo MRS studies with AD, MCI, and age-matched healthy control subjects, we have reported that GSH is reduced significantly [2, 29]. The GSH reported earlier is now identified as the closed form of GSH. However, the two GSHcl and GSHex forms together need be detected simultaneously to investigate the role of the two GSH conformers with AD progression. Hence an extensive multi-center clinical investigation on AD patients using the same protocol for identification of relative modulation of the two GSH conformers in pathological conditions is required.
Conclusion
This is the first report providing important evidence for the co-existence of two i n vivo GSH conformations in the human brain, linked with the observation from the state-of-the-art in vitro NMR studies on GSH. Critical observation and analysis led to the conclusion for the presence of different GSH conformations and their identification with MEGA-PRESS pulse sequence for in vivo study. Our work is expected to have a huge impact on the understanding of GSH and its profound role in the individual’s cognitive reserve and disease affinity depending upon their lifestyle and upbringing in different geographical environments. Furthermore observational studies on GSH supplement and its impact on cognitive reserve for healthy old and MCI patients using the present protocol is planned at NBRC.
ACKNOWLEDGMENTS
Dr. Pravat K. Mandal (Principal Investigator) thanks to the Department of Biotechnology, Government of India for funding this project (Grant No. BT/PR7361/MED/30/953/2013). Financial support in the form of TATA Innovation Fellowship (Ministry of Science and Technology, Govt. of India) to Dr. Mandal is appreciated (Award No. BT/HRD/01/05/2015). Dr. Mandal thanks Professor Peter Barker and Dr. Richard Edden (Radiology, Johns Hopkins Medicine, Baltimore, Maryland, USA) for providing the MEGA-PRESS sequence to Dr. Mandal. Dr. Lars Ersland thanks Dr. Ralph Noeske, Applied Science Laboratory Europe, GE Healthcare, Berlin, Germany for support and providing the MEGA-PRESS sequence. We gratefully acknowledge the Neuroimaging and Neurospectroscopy Lab members especially Ms. Kanika Sandal (Research Manager) and Ms. Vaishali Badhautia (Project Assistant) for data organization. Sincere thanks to all volunteers at NBRC and Bergen sites are appreciated for their help and cooperation.
Copyright permissions from respective publishers have also been taken for each published figure mentioned in this manuscript.
Authors’ disclosures available online (https://www.j-alz.com/manuscript-disclosures/18-0648r1).
SUPPLEMENTARY MATERIAL
[1] The supplementary material is available in the electronic version of this article: 10.3233/JAD-180648.
REFERENCES
[1] | Shukla D , Tripathi M , Mandal PK ((2018) ) Pattern of glutathione conformation (close) from frontal and hippocampal regions in three healthy age groups using non-invasive magnetic resonance spectroscopy, 73rd Society of Biological Psychiatry Meeting, New York. |
[2] | Mandal PK , Saharan S , Tripathi M , Murari G ((2015) ) Brain glutathione levels–a novel biomarker for mild cognitive impairment and Alzheimer’s disease. Biol Psychiatry 78: , 702–710. |
[3] | Matsuzawa D , Obata T , Shirayama Y , Nonaka H , Kanazawa Y , Yoshitome E , Takanashi J , Matsuda T , Shimizu E , Ikehira H , Iyo M , Hashimoto K ((2008) ) Negative correlation between brain glutathione level and negative symptoms in schizophrenia: A 3T 1H-MRS study. PLoS One 3: , e1944. |
[4] | Yao JK , Leonard S , Reddy R ((2006) ) Altered glutathione redox state in schizophrenia. Dis Markers 22: , 83–93. |
[5] | Mandal PK , Shukla D ((2018) ) Brain metabolic, structural, and behavioral pattern learning for early predictive diagnosis of Alzheimer’s disease. J Alzheimers Dis 63: , 935–939. |
[6] | Mandal PK , Shukla D , Govind V , Boulard Y , Ersland L ((2017) ) Glutathione conformations and its implications formagnetic resonance spectroscopy. J Alzheimers Dis 59: , 537–541. |
[7] | Mandal PK ((2007) ) Magnetic resonance spectroscopy (MRS) and its application in Alzheimer’s disease. Concepts Magn Reson Part A Bridg Educ Res 30: , 40–64. |
[8] | Govindaraju V , Young K , Maudsley AA ((2000) ) Proton NMR chemical shifts and coupling constants for brain metabolites. NMR Biomed 13: , 129–153. |
[9] | Govind V , Young K , Maudsley AA ((2015) ) Corrigendum: Proton NMR chemical shifts and coupling constants for brain metabolites. Govindaraju V, Young K, Maudsley AA, NMR Biomed. 2000; 13:129-153. NMR Biomed 28: , 923–924. |
[10] | Ying J , Clavreul N , Sethuraman M , Adachi T , Cohen RA ((2007) ) Thiol oxidation in signaling and response to stress: Detection and quantification of physiological and pathophysiological thiol modifications. Free Radic Biol Med 43: , 1099–1108. |
[11] | Lampela O , Juffer AH , Rauk A ((2003) ) Conformational analysis of glutathione in aqueous solution with molecular dynamics. J Phys Chem A 107: , 9208–9220. |
[12] | Zhang R , Wu W , Luo S ((2011) ) Different behaviors of glutathione in aqueous and DMSO solutions: Molecular dynamics simulation and NMR experimental study. J Solution Chem 40: , 1784–1795. |
[13] | Seifert G ((2008) ) Quantum molecular dynamics: The physics of explosive chemistry. Nat Physics 4: , 12–13. |
[14] | Singh G , Dogra SD , Kaur S , Tripathi SK , Prakash S , Rai B , Saini GS ((2015) ) Structure and vibrations of glutathione studied by vibrational spectroscopy and density functional theory. Spectrochim Acta A Mol Biomol Spectrosc 149: , 505–515. |
[15] | Wood S , Hollis JR , Kim JS ((2017) ) Raman spectroscopy as an advanced structural nanoprobe for conjugated molecular semiconductors. J Phys D Appl Phys 50: , 073001. |
[16] | Glusic M , Ropret P , Vogel-Mikus K , Grdadolnik J ((2013) ) The binding sites of cadmium to a reduced form of glutathione. Acta Chim Slov 60: , 61–69. |
[17] | York MJ , Beilharz GR , Kuchel PW ((1987) ) Conformation of reduced glutathione in aqueous solution by 1H and 13C n.m.r. Int J Pept Protein Res 29: , 638–646. |
[18] | Duddeck H , Dietrich W , Toth G ((1998) ) Structure elucidation by modern NMR - A workbook. Steinkopff-Verlag Heidelberg, pp. 76–78. |
[19] | Delalande O , Desvaux H , Godat E , Valleix A , Junot C , Labarre J , Boulard Y ((2010) ) Cadmium-glutathione solution structures provide new insights into heavy metal detoxification. FEBS J 277: , 5086–5096. |
[20] | Kato N , Nakamura M , Uchiyama T ((1999) ) 1H NMR studies of the reactions of copper(I) and copper(II) with D-penicillamine and glutathione. J Inorg Biochem 75: , 117–121. |
[21] | Kennett EC , Bubb WA , Bansal P , Alewood P , Kuchel PW ((2005) ) NMR studies of exchange between intra- and extracellular glutathione in human erythrocytes. Redox Rep 10: , 83–90. |
[22] | Rey NA , Howarth OW , Pereira-Maia EC ((2004) ) Equilibrium characterization of the As(III)-cysteine and the As(III)-glutathione systems in aqueous solution. J Inorg Biochem 98: , 1151–1159. |
[23] | Terpstra M , Henry PG , Gruetter R ((2003) ) Measurement of reduced glutathione (GSH) in human brain using LCModel analysis of difference-edited spectra. Magn Reson Med 50: , 19–23. |
[24] | Gawryluk JW , Wang JF , Andreazza AC , Shao L , Young LT ((2011) ) Decreased levels of glutathione, the major brain antioxidant, in post-mortem prefrontal cortex from patients with psychiatric disorders. Int J Neuropsychopharmacol 14: , 123–130. |
[25] | Slivka A , Spina MB , Cohen G ((1987) ) Reduced and oxidized glutathione in human and monkey brain. Neurosci Lett 74: , 112–118. |
[26] | Sanaei Nezhad F , Anton A , Parkes LM , Deakin B , Williams SR ((2017) ) Quantification of glutathione in the human brain by MR spectroscopy at 3 Tesla: Comparison of PRESS and MEGA-PRESS. Magn Reson Med 78: , 1257–1266. |
[27] | Browne K , Qiao S , Wei Y ((2009) ) A Lanczos bidiagonalization algorithm for Hankel matrices, Linear Algebra and its Applications. J Phys D Appl Phys 430: , 1531–1543. |
[28] | Drost DJ , Riddle WR , Clarke GD , Group AMT ((2002) ) Proton magnetic resonance spectroscopy in the brain: Report of AAPM MR Task Group #9. Med Phys 29: , 2177–2197. |
[29] | Mandal PK , Tripathi M , Sugunan S ((2012) ) Brain oxidative stress: Detection and mapping of anti-oxidant marker ‘Glutathione’ in different brain regions of healthy male/female, MCI and Alzheimer patients using non-invasive magnetic resonance spectroscopy. Biochem Biophys Res Commun 417: , 43–48. |
[30] | Sanaei Nezhad F , Anton A , Parkes LM , Deakin B , Williams SR ((2016) ) Quantification of glutathione in the human brain by MR spectroscopy at 3 Tesla: Comparison of PRESS and MEGA-PRESS. Magn Reson Med 78: , 1257–1266. |
[31] | Chakravarthi S , Jessop CE , Bulleid NJ ((2006) ) The role of glutathione in disulphide bond formation and endoplasmic-reticulum-generated oxidative stress. EMBO Rep 7: , 271–275. |
[32] | Sjoberg L , Eriksen TE , Revesz L ((1982) ) The reaction of the hydroxyl radical with glutathione in neutral and alkaline aqueous solution. Radiat Res 89: , 255–263. |
[33] | Liu H , Wang H , Shenvi S , Hagen TM , Liu RM ((2004) ) Glutathione metabolism during aging and in Alzheimer disease. Ann N Y Acad Sci 1019: , 346–349. |
[34] | Venkateshappa C , Harish G , Mahadevan A , Srinivas Bharath MM , Shankar SK ((2012) ) Elevated oxidative stress and decreased antioxidant function in the human hippocampus and frontal cortex with increasing age: Implications for neurodegeneration in Alzheimer’s disease. Neurochem Res 37: , 1601–1614. |
[35] | Bermejo P , Martin-Aragon S , Benedi J , Susin C , Felici E , Gil P , Ribera JM , Villar AM ((2008) ) Peripheral levels of glutathione and protein oxidation as markers in the development of Alzheimer’s disease from mild cognitive impairment. Free Radic Res 42: , 162–170. |
[36] | Gu M , Owen AD , Toffa SE , Cooper JM , Dexter DT , Jenner P , Marsden CD , Schapira AH ((1998) ) Mitochondrial function, GSH and iron in neurodegeneration and Lewy body diseases. J Neurol Sci 158: , 24–29. |
[37] | Ansari MA , Scheff SW ((2010) ) Oxidative stress in the progression of Alzheimer disease in the frontal cortex. J Neuropathol Exp Neurol 69: , 155–167. |
[38] | Lyon RP , Atkins WM ((2001) ) Self-assembly and gelation of oxidized glutathione in organic solvents. J Am Chem Soc 123: , 4408–4413. |
[39] | Naressi A , Couturier C , Castang I , de Beer R , Graveron-Demilly D ((2001) ) Java-based graphical user interface for MRUI, a software package for quantitation of/medical magnetic resonance spectroscopy signals. Comput Biol Med 31: , 269–286. |
[40] | An L , Zhang Y , Thomasson DM , Latour LL , Baker EH , Shen J , Warach S ((2009) ) Measurement of glutathione in normal volunteers and stroke patients at 3T using J-difference spectroscopy with minimized subtraction errors. J Magn Reson Imaging 30: , 263–270. |

