
Postsynaptic Proteome of Non-Demented Individuals with Alzheimer’s Disease Neuropathology
Abstract
Some individuals, here referred to as Non-Demented with Alzheimer’s Neuropathology (NDAN), retain their cognitive function despite the presence of amyloid plaques and tau tangles typical of symptomatic Alzheimer’s disease (AD). In NDAN, unlike AD, toxic amyloid-β oligomers do not localize to the postsynaptic densities (PSDs). Synaptic resistance to amyloid-β in NDAN may thus enable these individuals to remain cognitively intact despite the AD-like pathology. The mechanism(s) responsible for this resistance remains unresolved and understanding such protective biological processes could reveal novel targets for the development of effective treatments for AD. The present study uses a proteomic approach to compare the hippocampal postsynaptic densities of NDAN, AD, and healthy age-matched persons to identify protein signatures characteristic for these groups. Subcellular fractionation followed by 2D gel electrophoresis and mass spectrometry were used to analyze the PSDs. We describe fifteen proteins which comprise the unique proteomic signature of NDAN PSDs, thus setting them apart from control subjects and AD patients.
INTRODUCTION
Alzheimer’s disease (AD) is the most common form of dementia, affecting more than 5 million Americans [1]. Old age is the greatest risk factor for AD, which thus affects over one third of people older than 85 years of age. Other risk factors include family history/genetics (apolipoprotein ɛ, APOE; amyloid-β precursor protein, AβPP; presenilin, PSEN1 and PSEN2), brain injury, cardiovascular health, physical activity, and social interactions among others [2–4]. While available therapies have limited efficacy and only temporarily mitigate cognitive decline, currently there are no disease-modifying treatments for AD.
Typical AD pathology is characterized by two main neurodegenerative processes: amyloidogenesis and neurofibrillary degeneration [5]. Amyloidogenesis leads to deposition of extracellular amyloid-β (Aβ) peptide, while neurofibrillary tangles (NFTs) contain hyperphosphorylated tau protein. However, there is no correlation between presence of mature Aβ deposits and NFTs with the cell loss or cognitive decline [6–10]. On the other hand, presence of soluble oligomeric species of Aβ and tau in the brain correlates with cognitive dysfunction [7, 11–13]. Early oligomers, the most toxic forms of misfolded Aβ and tau forming during the aggregation process, can accumulate at the synapse and synergistically impair dendritic spines in the hippocampus [7, 14–19]. Microscopic changes in the brain begin long before memory loss [20]. Synapse loss is believed to occur at early stages of the disease [20, 21], while cell death occurs at later stages and contributes to ultimate cognitive decline [20]. AD has a long asymptomatic stage and with the development of improved neuroimaging techniques it has become evident that some individuals with AD-like neuropathology do not exhibit any cognitive decline during their lifetime ([8, 20, 22]; reviewed by [23]). Such individuals can be described as “asymptomatic at risk for AD dementia”, or “not normal, not MCI (mild cognitive impairment)” [22]. We refer to this cohort of individuals as Non-Demented with Alzheimer’s Neuropathology (NDAN) [24]. Several research groups, including ours, are trying to understand the mechanisms involved in preservation of cognition in NDAN, with the goal of identifying treatment targets to develop novel therapeutic concepts based on intrinsic resistance to AD [6, 8, 22, 24–30].
Synaptic dysfunction in AD is observed as a result of Aβ oligomers association with the postsynaptic density (PSD) [16]. At the PSD, Aβ oligomers oppose expression of long-term potentiation (LTP), modify protein content, and induce dendritic spine shrinkage and eventually loss [16, 31, 32]. Since the size of the PSD is proportional to the strength of the synapse, Aβ-driven synapse damage can result in the loss of cognitive function. In AD, plasticity and cognition are affected through the perturbation of Ca2 + /calmodulin-dependent protein kinase II-α (CaMKII) autophosphorylation [32]. Association of Aβ oligomers with the PSD implicates dephosphorylation (deactivation) of CREB (cAMP response element-binding protein factor), which in turn affects transcription of genes regulating long-term changes in synaptic strength [33].
We have previously reported that NDAN synapses reject Aβ oligomers, which could explain why NDAN subjects remain cognitively intact. Our laboratory has demonstrated for the first time that the PSD of NDAN subjects is free of Aβ oligomers [24]. Based on this observation, we hypothesized that there might be unique changes in protein expression levels at the PSDs of NDAN subjects that specifically mark the ability of their PSDs in the hippocampus to reject binding of toxic Aβ oligomers. To test our hypothesis, in the present work we performed proteomic analysis of the PSDs isolated from healthy control, AD, and NDAN individuals. The protein levels in AD and NDAN were compared to control, in addition to direct NDAN versus AD comparison. As a result, we identified a unique PSD protein signature of NDAN which consists of fifteen proteins, setting them apart from control and AD.
METHODS
15.1Case subjects
Frozen mid-hippocampus tissue was obtained from the Oregon Brain Bank at Oregon Health and Science University (OHSU) in Portland, OR. Donor subjects were enrolled and clinically evaluated in studies at the NIH-sponsored Layton Aging and AD Center (ADC) at OHSU. Subjects were participants in brain aging studies at the ADC and received annual neurological and neuropsychological evaluations, with a Clinical Dementia Rating (CDR) assigned by an experienced clinician. Controls and NDAN had normal cognitive and functional examinations with CDR <1. The AD subjects were diagnosed by a clinical team consensus conference, met the National Institute for Neurological and Communicative Disorders and Stroke-Alzheimer’s Disease and Related Disorder Association diagnostic criteria for clinical AD, had a CDR of greater than 1.0 and neuropathologic confirmation at autopsy (after informed consent). Tissue use conformed to institutional review board-approved protocols. Neuropathologic assessment conformed to National Institute on Aging-Reagan consensus criteria. All brain tissue was examined by a neuropathologist for neurodegenerative pathology including NFTs and neuritic plaques. Using standardized CERAD criteria [34], cases were assigned an amyloid score based on the deposition of amyloid plaques in the brain (0 = no plaques, 1 = sparse plaques, 2 = moderate plaques and 3 = dense plaques) and a Braak stage (0–6; with 6 being the most severe) indicative of the level and location of hyperphosphorylated tau tangles [35]. In addition to the pathological information detailed above, demographical data were received along with the frozen tissue. These included age, sex, and MMSE score [34] for each case. Several AD patients presented with relatively high MMSE scores, which is attributable to multiple factors: 1) the last MMSE was collected several months prior to death, 2) the diagnosis is mainly based on consensus CDR assessments and several tests beyond MMSE, 3) even milder impairments sometimes led to the diagnosis of AD with the understanding that this was earlier-stage disease. When these scores are looked at as a whole, it can be appreciated that these patients do tend to be in earlier stages of dementia, both in terms of their clinical ratings and in terms of their pathologies, with intermediate (3–4) versus high (5–6) Braak scores.
Hippocampal regions from twenty-four cases were used for proteomic analysis using 2D gel electrophoresis (eight samples per group were pooled). An independent set of fifteen samples (five cases per group) different from those assayed by 2D gel electrophoresis was used for validation of protein levels using immunoblotting.
15.2Synaptic fractionation
For proteomic studies, synaptic fractionation was performed as described previously [36–38]. Briefly, hippocampal tissue was homogenized in 0.32 M sucrose solution containing 1x Protease Inhibitor Cocktail (Sigma-Aldrich) and Halt Phosphatase Inhibitor Cocktail (Life Technologies, Inc) using a Dounce glass homogenizer. Synaptosomes were isolated using a sucrose gradient and ultracentrifugation (100,000×g for 3 h at 4°C). Synaptic junctions were obtained by incubating the synaptosomes in pH = 6 buffer (1 M Tris in 0.1 mM CaCl2) and then centrifuging at 40,000×g for 30 min at 4°C. The supernatant (containing synaptic vesicles) and the pellet were collected separately. The pellet was solubilized and incubated in pH = 8 buffer (20 mM Tris, 1% Triton X-100 in 0.1 mM CaCl2) and then centrifuged at 40,000×g for 30 min at 4°C to generate the PSD pellet. This pellet was solubilized in 1% SDS.
To confirm protein changes using immunoblotting, the isolation of synaptosomes was performed using Syn-PER Synaptic Protein Extraction Reagent (ThermoFisher Scientific) as described previously [39], followed by ultracentrifugation to obtain PSD fractions. Similarly to sucrose gradient protocol described above, the hippocampal tissue was homogenized using a Dounce glass homogenizer in Syn-PER Reagent and centrifuged at 1,200×g for 10 min at 4°C. The supernatant containing synaptosomes was collected and centrifuged at 15,000×g for 20 min at 4°C. The supernatant (cytosolic fraction) and pellet (synaptosomes) were collected separately. Synaptic junctions were obtained by incubating the synaptosomes in pH = 6 buffer (as described above) and then centrifuging at 40,000×g for 30 min at 4°C. The supernatant (containing synaptic vesicles) and the pellet were collected separately. The pellet was solubilized and incubated in pH = 8 buffer (as described above) and then centrifuged at 40,000×g for 30 min at 4°C to generate the PSD pellet. This pellet was solubilized in 1% SDS.
15.3Proteomics
Control, NDAN, and AD samples were processed for proteomic analysis as described previously (for examples, see [40, 41]). Triplicate samples from control, AD, and NDAN PSD (200μg) were extracted with 7 M urea, 2 M thiourea, 2% CHAPS, and 50 mM Tris pH 7.5, treated with sodium ascorbate (Asc) to reverse S-nitrosylation and then dialyzed against the urea buffer to remove Asc, which interferes with labeling. Protein concentrations were determined with the Lowry method and cysteines (cysteic acid) determined by amino acid analysis (Model L8800, Hitachi High Technologies America, Pleasanton, CA). Proteins from the tissues were then labeled with BODIPY® FL N- (2-aminoethyl) maleimide (Life Technologies, Inc., Carlsbad, CA) at 60 fold excess cysteine to BODIPY FL-maleimide (BD) as published previously [42]. After quenching the labeling reactions with 10x molar excess β-mercaptoethanol (BD: βME), 200μg labeled proteins in 0.5% IPG buffer pH 3–10 (GE Healthcare) were loaded onto a 11 cm pH 3–10 IPG strip (GE Healthcare) and proteins were focused according to the previously published protocol [43]. After focusing, the IPG strips were equilibrated in 6 M Urea, 2% SDS, 50 mM Tris, pH 8.8, 20% glycerol for 30 min at room temperature, applied to an 8–16% Tris-glycine-SDS gel and run at 150V×2.25 h at 4°C. The gels were fixed for 1 h in 10% methanol and 7% acetic acid and washed overnight in 10% ethanol. Finally, gels were imaged on a Typhoon Trio Imaging System (GE Healthcare; excitation λ= 480/40 nm & emission λ= 535/50 nm). We have previously demonstrated that this covalent sulfhydryl alkylation method using an uncharged thiol-reactive dye exhibits excellent specificity for cysteine thiols— little to no modification of other amino acid residues, does not impact protein electrophoretic mobility— for spot matching with unlabeled proteins, and accomplishes highly accurate and reproducible quantification— by virtue of its specificity and saturating concentration over protein thiols [40, 42].
15.4Protein quantification and image analysis
The 2D gel electrophoresis (2DE) images were analyzed using SameSpots software (TotalLab, Ltd. Newcastle Upon Tyne, UK). The software performs pixel-to-pixel matching before spot detection, ensuring that spot boundaries are the same for all gels, and eliminating errors that accumulate in the reference gel(s) as the number of gels within one experiment increases. Once the pixel matching and spot detection is complete, a reference gel is selected according to several criteria, including quality and number of spots. Subsequent to automatic spot detection, spot filtering is manually performed and spots with an area of less than 250 pixels are filtered out, and spots with a volume (intensity) / area ratio of less than 375 pixels (whose abundance is insufficient for mass spectrometry (MS) identification) are also filtered. Typically, some manual spot editing is required to correct for spots that are not split correctly, not detected, or split unnecessarily during the automated detection process. The matching of spots between the gels is manually reviewed and adjusted as necessary. The software normalizes spot volumes using a calculated bias value based on the assumption that the great majority of spot volumes represent no change in abundance (ratio control to experimental = 1.0) (TotalLab documentation).
Ratiometric calculation from BODIPY-fluorescence units was conducted for quantifying differential protein abundance for the samples, and parametric t-test performed on log 2 normalized abundance ratios.
15.5Mass spectrometry and protein identification
Selected 2DE spots that exhibited significant differential prevalence (p≤0.05) were picked robotically (ProPick II, Digilab, Ann Arbor, MI), and trypsin digested. In brief, gel spots were incubated at 37°C for 30 min in 50 mM NH4HCO3, dehydrated twice for 5 min each in 100μl acetonitrile, dried, and proteins were digested in-gel at 37°C overnight with 10μl of trypsin solution (1% trypsin in 25 mM ammonium bicarbonate). Peptide mixtures (1μl), obtained after tryptic digestion, were directly spotted onto a target plate with 1μl of alpha-cyano-4-hydroxycinnamic acid matrix solution (5 mg/ml in 50% acetonitrile) and analyzed by matrix assisted laser desorption ionization-time of flight (MALDI-TOF/TOF) MS using the ABI 4800 Proteomics Analyzer (AB Sciex, Foster City, CA). The Applied Biosystems software package included the 4000 Series Explorer (v.3.6 RC1) with Oracle Database Schema (v.3.19.0) and Data Version (3.80.0) to acquire and analyze MS and MS/MS spectral data. The instrument was operated in a positive ion reflectron mode with the focus mass set at 1700 Da (mass range: 850–3000 Da). For MS data, 1000–2000 laser shots were acquired and averaged from each protein spot. Automatic external calibration was performed by using a peptide mixture with the reference masses 904.468, 1296.685, 1570.677, and 2465.199. Following MALDI MS analysis, MALDI MS/MS was performed on several (5–10) abundant ions from each protein spot. A 1 kV positive ion MS/MS method was used to acquire data under post-source decay conditions. The instrument precursor selection window was±3 Da. Automatic external calibration was performed by using reference fragment masses 175.120, 480.257, 684.347, 1056.475, and 1441.635 (from precursor mass 1570.700).
AB Sciex GPS ExplorerTM (v.3.6) software was employed in conjunction with MASCOT (v.2.2.07) to search the UniProt human protein database (last accessed: June 7, 2015; 87,656 sequences 35,208,664 residues) by using both MS and MS/MS spectral data for protein identification. Protein match probabilities were determined by using expectation values and/or MASCOT protein scores. The MS peak filtering included the following parameters: a mass range of 800 Da to 3000 Da, minimum S/N filter = 10, mass exclusion list tolerance = 0.5 Da, and mass exclusion list for some trypsin and keratin-containing compounds included masses (Da) 842.51, 870.45, 1045.56, 1179.60, 1277.71, 1475.79, and 2211.1. The MS/MS peak filtering included the following parameters: minimum S/N filter = 10, maximum missed cleavages = 1, fixed modification of carbamidomethyl (C), variable modifications due to oxidation (M), precursor tolerance = 0.2 Da, MS/MS fragment tolerance = 0.3 Da, mass = monoisotopic, and peptide charges = +1. The significance of a protein match, based on the peptide mass fingerprint in the MS and the MS/MS data from several precursor ions, is presented as expectation values (p < 0.001).
In addition, where MALDI protein confidence scores left ambiguous identification, the trypsin digested protein spots were analyzed by nano-LC-MS/MS using a Thermo Scientific Orbitrap Fusion MS (San Jose, CA), coupled with a Dionex Ultimat 3000 nanoHPLC with a 40 well standard auto sampler. The samples were injected onto a nanotrap (100μm i.d.×1 cm, C18 PepMap 100), followed by a C18 reversed-phase (RP) home-packed column (SB-C18, ZORBAX, 5 micron from Agilent; Santa Clara, CA) at a flow rate of 400 nL/min with 60 min LC gradient (5% AcN, 0.1% trifluoroacetic acid (TFA) to 100% AcN, 0.1% TFA). The RP column was further eluted for several min with 90% AcN and TFA to minimize intersample contamination. Mass spectrometer parameters include the following: spray tip voltage at +2.2 kV, Fourier-transform MS mode for MS acquisition of precursor ions (resolution 120,000); ITMS mode for subsequent MS/MS of top 10 precursors selected; same ions were excluded for 15 s; MS/MS was accomplished via collision induced dissociation.
Data analysis was performed using the MASCOT server by interrogating the total organism database. The selected analytical parameters included: the enzyme as trypsin; maximum missed cleavages = 2; variable modifications included oxidation (methionine); precursor ion mass tolerance was set at 5 ppm; fragment ion mass tolerance was 0.6 Da. The significance of a protein match is based on peptide expectation values and the numbers of peptides found (≥2). The default significance threshold is p≤0.05 to achieve a false discovery rate (FDR) of less than 1.0%. Protein identifications were accepted if they could be established at 95.0% probability to achieve an FDR [44] of less than 1.0%.
15.6Western blot
Western blot analysis was performed on the PSD fractions isolated using Syn-PER Reagent, followed by ultracentrifugation to enrich for PSD as described above. Separation of the proteins in the samples obtained was done by 12% SDS- polyacrylamide gel electrophoresis. The separated proteins were transferred to a nitrocellulose membrane (Bio-Rad) and incubated with PSD95, CAMK2A, GAPDH, UCHL1, and PFN (all 1:1,000; Cell Signaling) antibodies overnight. Actin (1:1,000; Cell Signaling) was used as a loading control. The membrane was incubated with proper fluorescent secondary antibodies (1:10,000) (LI-COR Biosciences) and scanned using Odyssey infrared fluorescent imaging system (LI-COR Biosciences). The band densities were analyzed using ImageJ software, normalizing using the densities of the loading control obtained by reprobing the membranes for actin. All fifteen samples were run on the same blot. Differences between groups were assessed using Student’s t-test.
RESULTS
16.1Proteins identified
The goal of this study was to determine if the unique ability of NDAN PSDs to reject Aβ oligomer binding can be explained by a unique protein signature that sets NDAN aside from AD and healthy age-matched control individuals. PSD fractions from three experimental groups (control, AD, and NDAN) were used in a discovery-mode proteomics, the cases were pooled in order to increase the likelihood that the proteins identified would be universal to the experimental group, while decreasing the inter-individual variability. Case subject data is provided in Table 1. In order to analyze the PSD proteome, we determined the ratios of expression levels in three different ways: AD versus control, NDAN versus control, and NDAN versus AD.
Table 1
Demographic data of the cases used in the proteomics study
| Case number | Diagnosis | Age, y | Sex | PMI, h | Braak stage | MMSE |
| 1525 | Control | 88 | F | 3 | 1 | 28 |
| 1716 | Control | >89 | M | 5 | 1 | 29 |
| 1944 | Control | >89 | F | 8 | 3 | 29 |
| 1957 | Control | >89 | F | 8 | 3 | 30 |
| 1965 | Control | >89 | F | 5.5 | 2 | 26 |
| 1977 | Control | >89 | F | 4 | 3 | 28 |
| 2337 | Control | 86 | M | 28.5 | 3 | 26 |
| 2376 | Control | >89 | M | 4 | 3 | 26 |
| Average | 92 | 3/5 | 8.3 | 2.4 | 27.8 | |
| 1791 | AD | >89 | M | 10 | 4 | 19 |
| 2010 | AD | 87 | F | 6 | 4 | 23 |
| 2126 | AD | >89 | F | 9 | 4 | 26 |
| 2146 | AD | >89 | F | 9.5 | 4 | 30 |
| 2157 | AD | >89 | M | 11.5 | 4 | 12 |
| 2221 | AD | >89 | F | 15.5 | 4 | 29 |
| 2315 | AD | >89 | M | 4 | 4 | 28 |
| 2330 | AD | >89 | F | 4.5 | 4 | 28 |
| Average | 95 | 3/5 | 8.8 | 4.0 | 24.4 | |
| 697 | NDAN | >89 | M | 5 | 4 | 29 |
| 1095 | NDAN | 88 | M | 3 | 5 | 29 |
| 1179 | NDAN | 89 | F | 2.5 | 4 | 27 |
| 1362 | NDAN | >89 | F | 48 | 4 | 27 |
| 1644 | NDAN | 76 | F | 30 | 5 | 30 |
| 1677 | NDAN | >89 | F | 18 | 6 | 30 |
| 1686 | NDAN | 87 | F | 3 | 4 | 29 |
| 1845 | NDAN | 86 | M | 5 | 4 | 29 |
| Average | 90 | 3/5 | 14.3 | 4.5 | 28.8 |
PMI, postmortem interval; MMSE, Mini-Mental State Exam.
Seven hundred and twenty-seven individual spots were detected on Coomassie-stained 2DE of isolated PSDs (Fig. 1). Three hundred and forty most abundant spots were collected for protein digestion. Following digestion, the resulting peptides were separated by liquid chromatography and the amino acid sequences were determined. Using MS/MS we identified 122 proteins that have the p-value≤0.05 in at least one comparison (i.e., AD versus control, NDAN versus control, or NDAN versus AD) and MALDI protein score cut-off≥62. In Supplementary Table 1, we have additionally included 10 proteins that presented with the p-values greater than 0.05, yet are relevant and contribute to the discussion. Since the goal of this work was to determine differences between AD and NDAN that would reflect their diverse cognitive status and synaptic vulnerability to Aβ oligomers, we selected proteins that were statistically changed (cut-off≥±1.5 fold) in NDAN versus AD, regardless of whether they were changed in either group as compared to controls. Following this criterion, thirty-one proteins with the fold change of at least±1.5 in NDAN versus AD were chosen for further analysis (Table 2). Using this set of 31 proteins we then looked at AD versus control and NDAN versus control (Fig. 2) to determine if the changed protein would fall into any of the following categories: 1) progression of neuropathology– proteins that have more pronounced change in either AD, or NDAN when compared to control; 2) unique to AD– proteins that change in AD versus control, but not in NDAN versus control; 3) unique to NDAN– proteins that change in NDAN versus control, but not in AD versus control.
Fig.1
Representative 2DE of proteins identified. The highlighted spots were excised and analyzed in the present study. The x-axis is calibrated in pH units, while y-axis is calibrated in mass units (kDa).
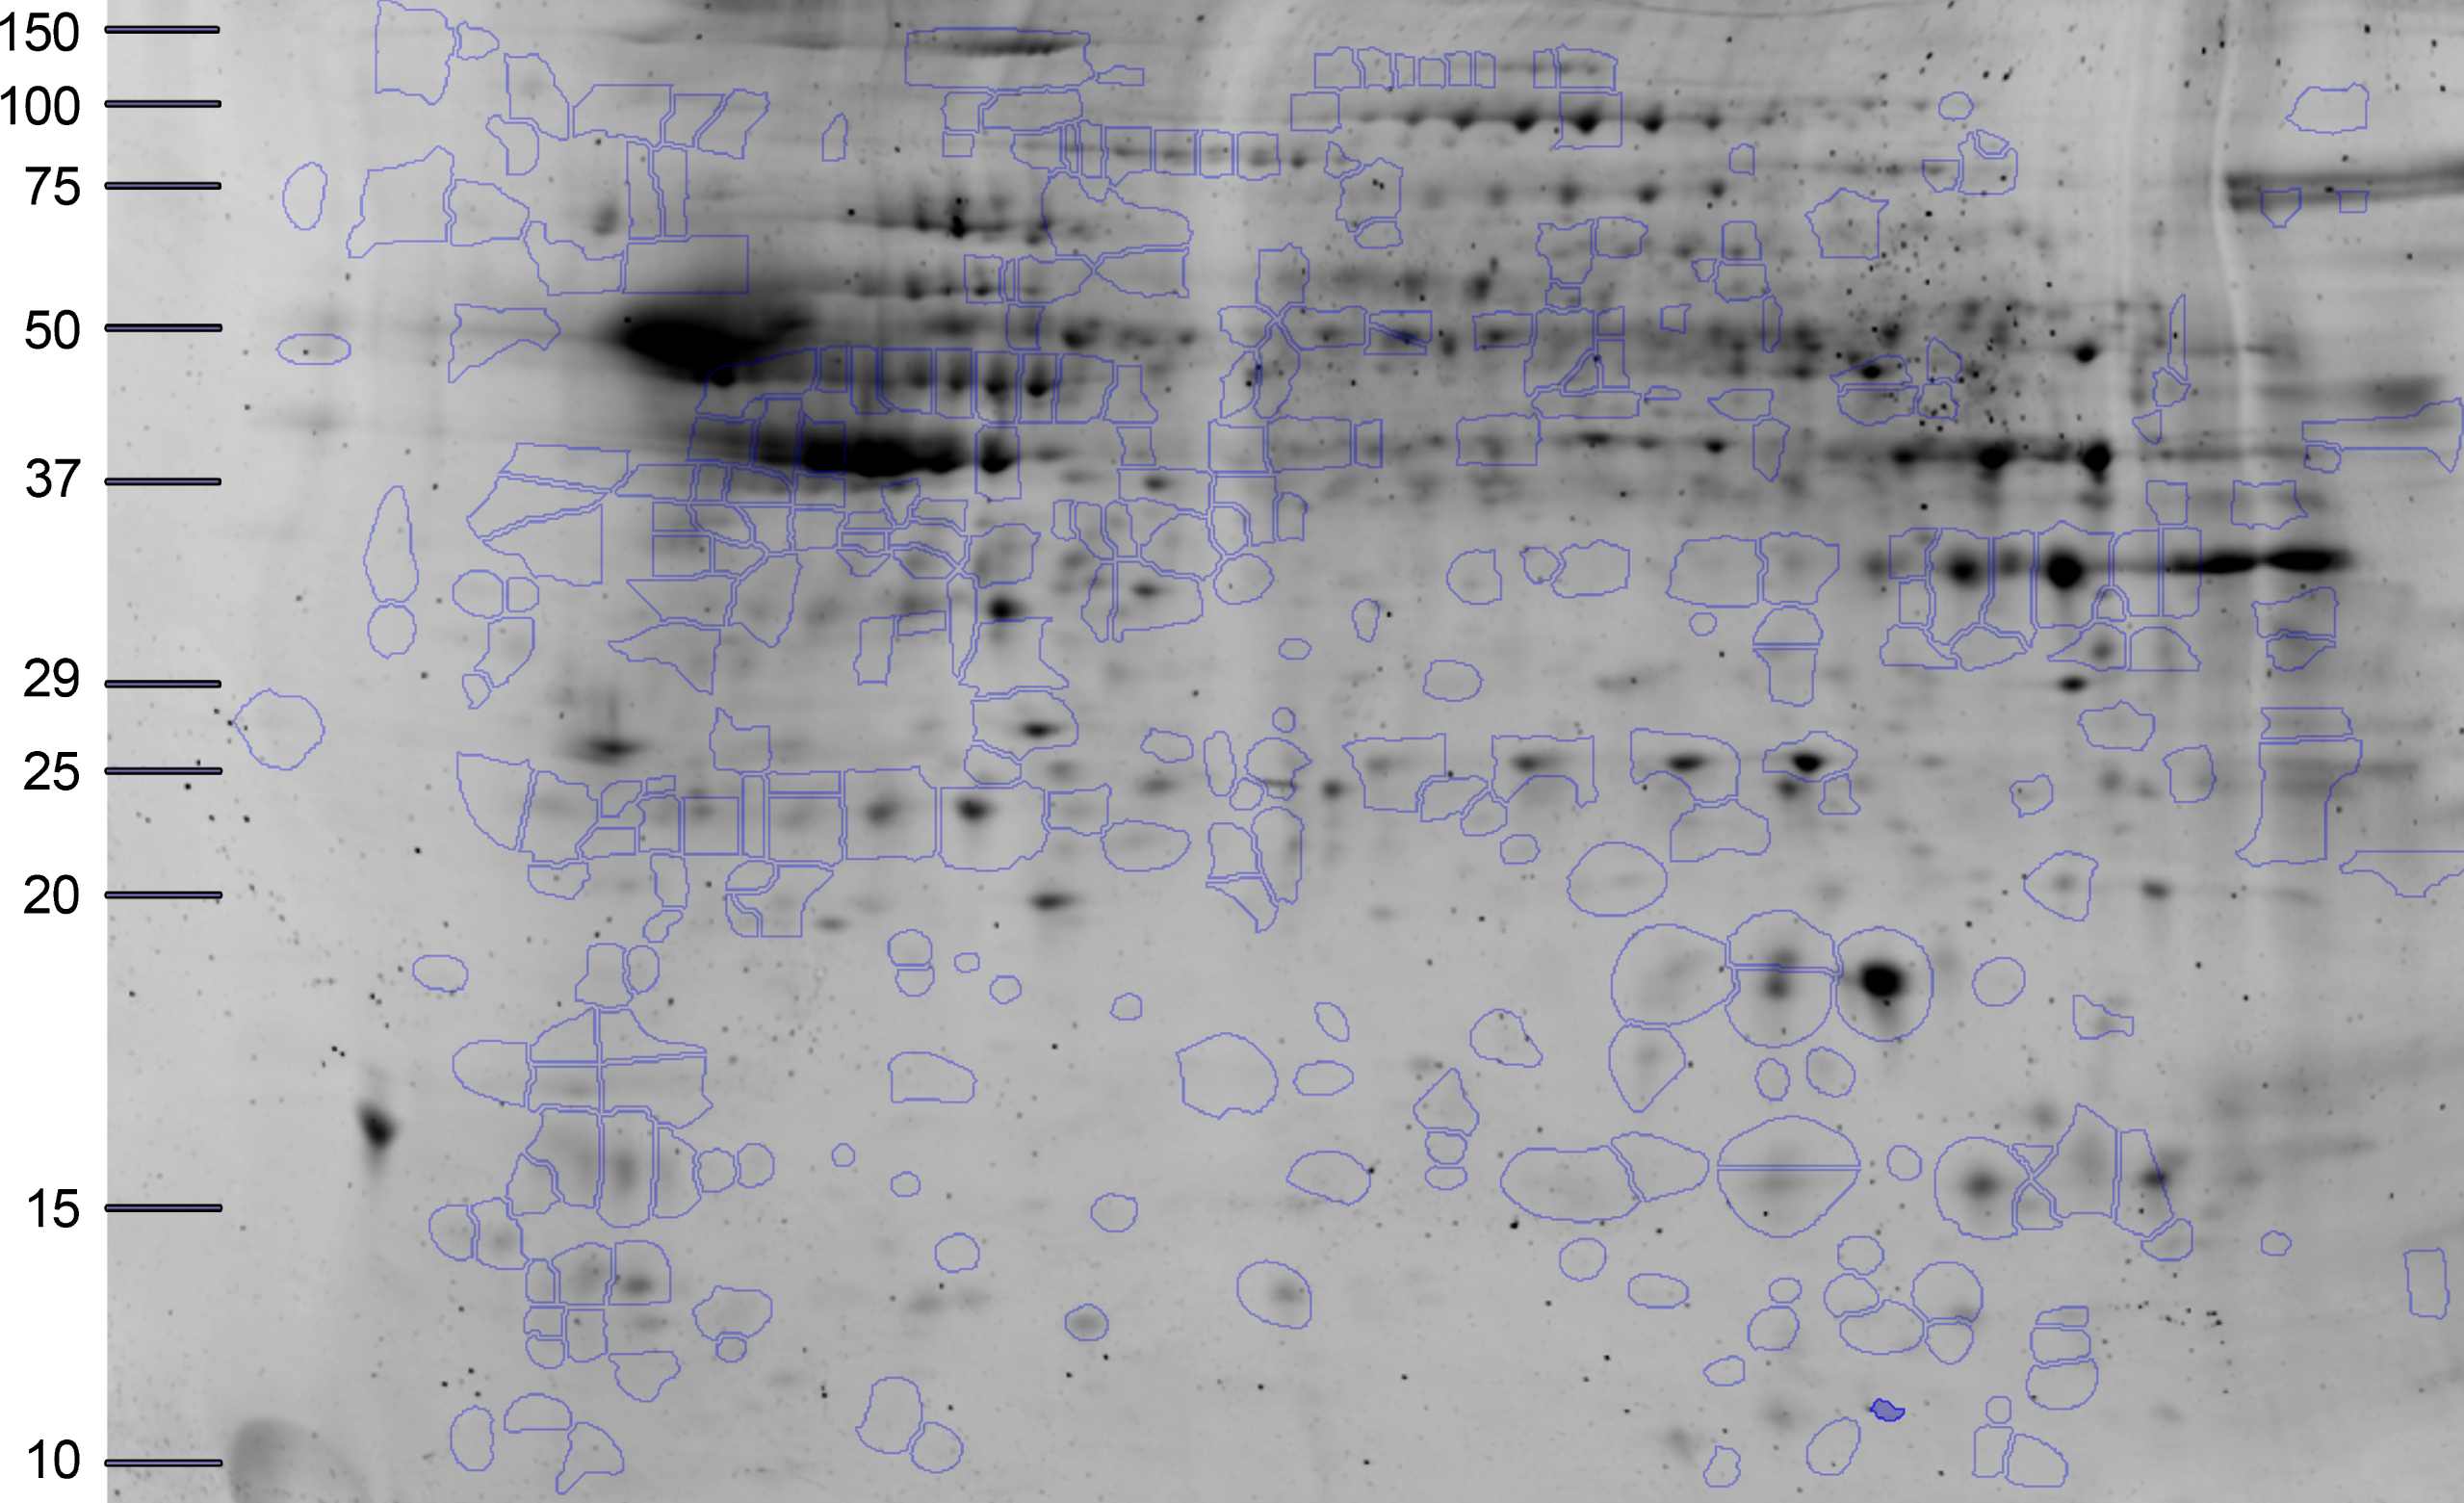
Fig.2
Venn diagram of the total number of proteins with significant differential expression in NDAN versus AD, including the number of proteins that change in AD versus control and NDAN versus control.
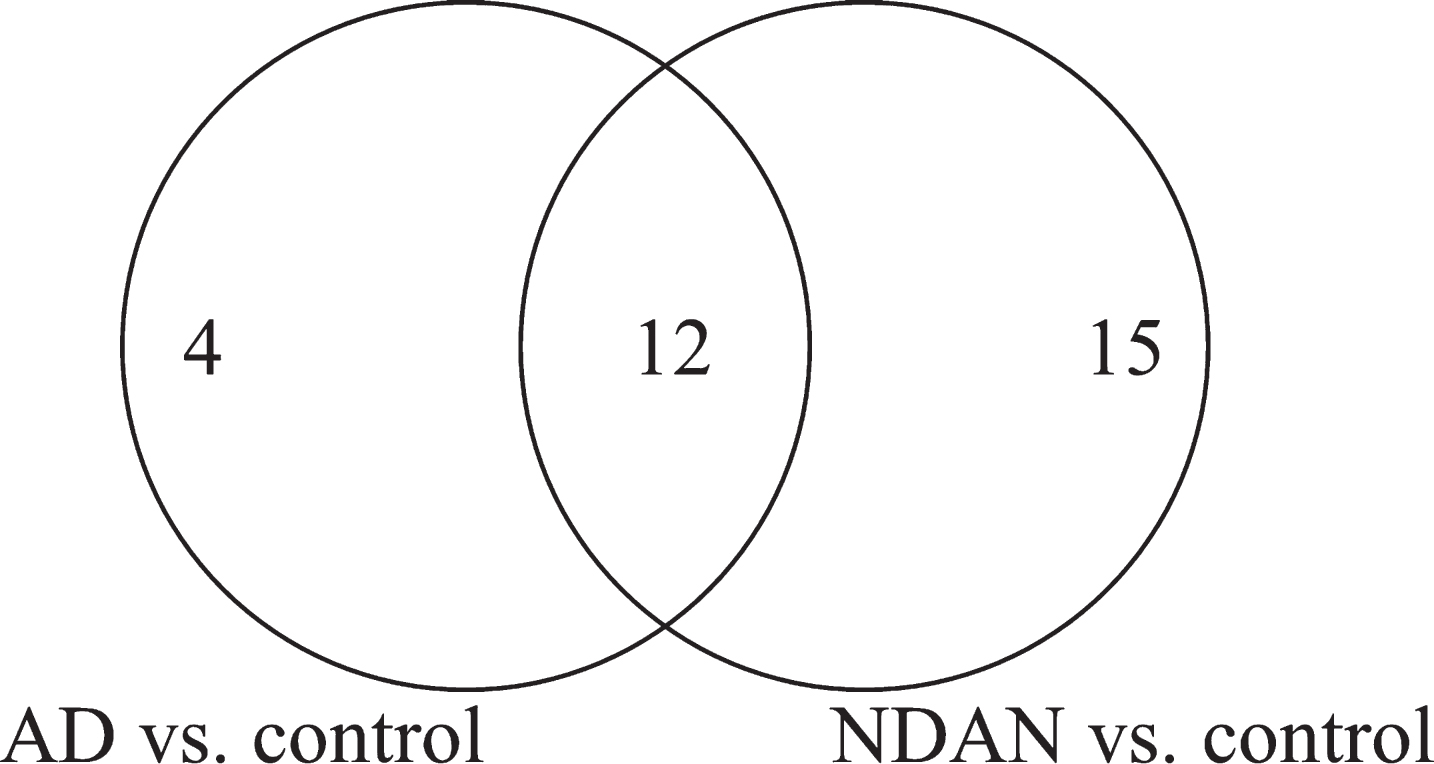
Table 2
Postsynaptic density proteins identified using MS/MS that have±1.5 fold change in NDAN versus AD
| Protein name | Gene ID | Accession Number | Theoretical pI | Measured pI | Theoretical Mw, kDa | Measured Mw, kDa | MS ID protein score | AD versus control | NDAN versus AD | NDAN versus control |
| Actin, cytoplasmic 2 | ACTG1 | P63261 | 5.31 | 6.31 | 42 | 15 | 78 | – 1.50 | – 1.49 | – 2.23 |
| Annexin (Fragment) | ANXA2 | H0YN42 | 5.56 | 8.03 | 29 | 30 | 141 | 1.55 | 1.83 | 2.85 |
| Calcium/calmodulin-dependent protein kinase type II subunit alpha | CAMK2A | Q9UQM7 | 6.61 | 5.84 | 54 | 17 | 115 | 1.43 | 1.98 | 2.83 |
| Calreticulin | CALR | P27797 | 4.29 | 4.65 | 48 | 71 | 70 | – 1.15 | – 2.85 | – 3.27 |
| Creatine kinase B-type | CKB | P12277 | 4.29 | 6.93 | 48 | 17 | 70 | 1.05 | – 1.98 | – 1.88 |
| Creatine kinase B-type (Fragment) | CKB | G3V4N7 | 4.89 | 5 | 24 | 20 | 116 | 1.09 | – 2.80 | – 2.57 |
| Glial fibrillary acidic protein | GFAP | P14136 | 5.42 | 5.39 | 50 | 46 | 1010 | – 1.44 | 2.58 | 1.79 |
| Glial fibrillary acidic protein | GFAP | P14136 | 5.42 | 5.34 | 50 | 46 | 950 | – 1.23 | 2.18 | 1.77 |
| Glial fibrillary acidic protein | GFAP | P14136 | 5.42 | 5.28 | 50 | 46 | 969 | – 1.32 | 2.15 | 1.63 |
| Glial fibrillary acidic protein | GFAP | P14136 | 5.42 | 5.43 | 50 | 46 | 1050 | – 1.25 | 2.12 | 1.69 |
| Glial fibrillary acidic protein | GFAP | P14136 | 5.42 | 5.18 | 50 | 46 | 863 | – 1.02 | 2.06 | 2.02 |
| Glial fibrillary acidic protein | GFAP | P14136 | 5.42 | 5.07 | 50 | 37 | 915 | – 1.48 | 1.53 | 1.03 |
| Glial fibrillary acidic protein | GFAP | E9PAX3 | 5.42 | 4.98 | 50 | 18 | 374 | 1.27 | – 1.98 | – 1.56 |
| Glial fibrillary acidic protein | GFAP | P14136 | 5.42 | 5.06 | 50 | 34 | 850 | – 1.44 | – 2.07 | – 2.97 |
| Glial fibrillary acidic protein | GFAP | E9PAX3 | 5.42 | 5 | 50 | 20 | 400 | – 1.12 | – 4.32 | – 4.84 |
| Glial fibrillary acidic protein (Fragment) | GFAP | K7EJU1 | 5.6 | 5.61 | 28 | 21 | 339 | – 4.13 | 2.00 | – 2.07 |
| Glyceraldehyde-3-phosphate dehydrogenase | GAPDH | E7EUT4 | 8.57 | 9.17 | 36 | 32 | 88 | – 6.19 | 6.55 | 1.06 |
| Hemoglobin subunit beta | HBB | P68871 | 6.74 | 7.35 | 16 | 13 | 170 | 1.26 | 2.90 | 3.66 |
| Hemoglobin subunit beta | HBB | P68871 | 6.74 | 7 | 16 | 14 | 70 | 1.68 | 1.84 | 3.09 |
| Hemoglobin subunit beta | HBB | P68871 | 6.74 | 7.34 | 16 | 14 | 212 | 1.75 | 1.67 | 2.92 |
| Isoform 1 of Vinculin | VCL | P18206-2 | 5.83 | 5.88 | 117 | 118 | 322 | 1.03 | 1.92 | 1.97 |
| Isoform 2 of Glial fibrillary acidic protein | GFAP | P14136-2 | 5.42 | 5.09 | 50 | 36 | 223 | – 2.19 | 2.42 | 1.10 |
| Isoform 2 of Glial fibrillary acidic protein | GFAP | P14136-2 | 5.42 | 5.16 | 50 | 35 | 92 | – 1.91 | 1.70 | – 1.12 |
| Isoform 2 of Glial fibrillary acidic protein | GFAP | P14136-2 | 5.42 | 5.17 | 50 | 38 | 885 | – 1.12 | 1.63 | 1.46 |
| Isoform 2 of Glial fibrillary acidic protein | GFAP | P14136-2 | 5.42 | 5.23 | 50 | 46 | 945 | 1.02 | 1.63 | 1.66 |
| Isoform 2 of Glial fibrillary acidic protein | GFAP | P14136-2 | 5.42 | 5.5 | 50 | 46 | 974 | – 1.08 | 1.60 | 1.48 |
| Isoform 2 of Glial fibrillary acidic protein | GFAP | P14136-2 | 5.42 | 5.07 | 50 | 37 | 790 | – 1.53 | 1.56 | 1.02 |
| Isoform 2 of Glial fibrillary acidic protein | GFAP | P14136-2 | 5.42 | 5.16 | 50 | 49 | 828 | – 1.19 | 1.53 | 1.28 |
| Isoform 2 of Glial fibrillary acidic protein | GFAP | P14136-2 | 5.42 | 5.74 | 50 | 48 | 284 | 2.04 | – 1.60 | 1.27 |
| Isoform 3 of Dynamin-1 | DNM1 | Q05193-3 | 6.57 | 4.93 | 96 | 20 | 346 | – 1.23 | 1.69 | 1.38 |
| Isoform 3 of Dynamin-1 | DNM1 | Q05193-3 | 6.57 | 4.88 | 96 | 19 | 300 | – 1.35 | – 1.60 | – 2.16 |
| Isoform 3 of Peroxiredoxin-5, mitochondrial | PRDX5 | P30044-3 | 9.12 | 7.7 | 17 | 15 | 154 | 1.29 | – 1.77 | – 1.37 |
| Isoform 3 of Ras-related protein Rap-1b | PAR1B | P61224-3 | 8.72 | 6.37 | 19 | 19 | 112 | – 1.19 | 1.92 | 1.62 |
| Isoform CNPI of 2’,3’-cyclic-nucleotide 3’-phosphodiesterase | CNP | P09543-2 | 8.73 | 9.11 | 45 | 40 | 97 | – 1.66 | 1.82 | 1.10 |
| Isoform Cytoplasmic+peroxisomal of Peroxiredoxin-5, mitochondrial | PRDX5 | P30044-2 | 6.73 | 7.75 | 17 | 16 | 143 | 1.31 | – 2.27 | – 1.73 |
| Isoform IB of Synapsin-1 | SYN1 | P17600-2 | 9.88 | 9.17 | 70 | 75 | 271 | 1.16 | – 1.72 | – 1.48 |
| Isoform IB of Synapsin-1 | SYN1 | P17600-2 | 9.88 | 8.87 | 70 | 74 | 290 | 1.17 | – 2.00 | – 1.71 |
| Isoform Non-brain of Clathrin light chain A | CLTA | P09496-2 | 4.45 | 4.69 | 24 | 30 | 62 | – 1.01 | – 3.31 | – 3.34 |
| Keratin, type I cytoskeletal 10 | KRT10 | P13645 | 5.13 | 5.33 | 59 | 102 | 78 | – 1.04 | – 1.80 | – 1.87 |
| Keratin, type I cytoskeletal 9 | KRT9 | P35527 | 5.14 | 6.14 | 62 | 17 | 95 | – 1.37 | 1.55 | 1.13 |
| Keratin, type I cytoskeletal 9 | KRT9 | P35527 | 5.14 | 4.82 | 62 | 13 | 213 | – 1.21 | – 1.56 | – 1.89 |
| Keratin, type II cytoskeletal 1 | KRT1 | P04264 | 8.15 | 7.55 | 66 | 12 | 181 | 1.32 | – 1.54 | – 1.17 |
| Keratin, type II cytoskeletal 1 | KRT1 | P04264 | 8.15 | 4.66 | 66 | 35 | 63 | – 1.14 | – 1.81 | – 2.07 |
| Keratin, type II cytoskeletal 1 | KRT1 | P04264 | 8.15 | 5.54 | 66 | 17 | 130 | 1.33 | – 3.10 | – 2.33 |
| Malate dehydrogenase, mitochondrial | MDH2 | P40926 | 8.92 | 8.94 | 36 | 30 | 228 | 1.67 | 1.77 | 2.97 |
| NADH dehydrogenase [ubiquinone] 1 alpha subcomplex subunit 5 | NDUFA5 | F8WAS3 | 5.75 | 5.5 | 13 | 13 | 237 | – 3.21 | – 1.44 | – 4.62 |
| NADH dehydrogenase [ubiquinone] flavoprotein 1, mitochondrial (Fragment) | NDUFV1 | E9PQP1 | 8.51 | 8.26 | 51 | 46 | 105 | 2.77 | – 1.47 | 1.88 |
| Neurofilament medium polypeptide | NEFM | E7EMV2 | 4.76 | 5.4 | 79 | 50 | 210 | – 1.28 | 1.50 | 1.17 |
| Profilin-2 | PFN2 | C9J0J7 | 9.26 | 5.76 | 10 | 14 | 126 | 1.80 | – 1.54 | 1.17 |
| Profilin-2 | PFN2 | C9J0J7 | 9.26 | 5.06 | 10 | 13 | 78 | 1.01 | – 2.08 | – 2.06 |
| Pyruvate carboxylase, mitochondrial | PC | P11498 | 6.37 | 6.28 | 130 | 119 | 96 | 1.12 | – 1.59 | – 1.42 |
| Rho GDP-dissociation inhibitor 1 (Fragment) | ARHGDIA | J3KTF8 | 5.37 | 5.02 | 22 | 20 | 185 | 1.18 | – 1.77 | – 1.50 |
| Septin-7 | SEPT7 | F5GZE5 | 8.76 | 8.68 | 51 | 45 | 84 | 1.48 | – 1.66 | – 1.12 |
| Spectrin alpha chain, non-erythrocytic 1 | SPTAN1 | Q13813 | 5.22 | 5.38 | 285 | 134 | 439 | 1.22 | – 1.91 | – 1.56 |
| Syntaxin-binding protein 1 | STXBP1 | P61764 | 6.5 | 5.52 | 68 | 31 | 171 | 1.12 | 2.00 | 2.24 |
| Tubulin alpha-1A chain (Fragment) | TUBA1A | F8VRZ4 | 5.44 | 5.09 | 12 | 22 | 67 | – 2.13 | 1.56 | – 1.37 |
| Tubulin alpha-1B chain (Fragment) | TUBA1B | F8VVB9 | 5.03 | 5.54 | 28 | 46 | 91 | – 1.31 | 2.04 | 1.55 |
| Tubulin alpha-1B chain (Fragment) | TUBA1B | F8VVB9 | 5.03 | 5.29 | 28 | 33 | 342 | – 1.26 | – 1.66 | – 2.09 |
| Tubulin alpha-1B chain (Fragment) | TUBA1B | F8VVB9 | 5.03 | 5.23 | 28 | 33 | 128 | – 1.32 | – 2.97 | – 3.93 |
| Tubulin beta-2A chain | TUBB2A | Q13885 | 4.78 | 5.45 | 50 | 34 | 139 | 1.19 | – 1.84 | – 1.55 |
| Tubulin beta-4A chain | TUBB4A | P04350 | 4.78 | 4.81 | 50 | 16 | 62 | – 1.20 | – 1.84 | – 2.20 |
| Tubulin beta-6 chain (Fragment) | TUBB6 | K7ESM5 | 5.49 | 5.26 | 37 | 12 | 123 | – 1.59 | – 2.51 | – 4.01 |
| Ubiquitin carboxyl-terminal hydrolase isozyme L1 | UCHL1 | D6R974 | 5.67 | 5.15 | 17 | 20 | 133 | 1.04 | – 2.47 | – 2.37 |
We also found several sets of protein spots on the 2DE with different isoelectric points and/or sizes that were identified as the same protein (“protein trains”) (Table 3). The differences in theoretical and detected isoelectric points, with little to no change in sizes, could suggest post-translational modifications of the protein, while differences in protein size could indicate post-translational modifications and/or protein cleavage.
Table 3
Proteins detected in trains of spots on the 2DE
| Protein | Theoretical pI | Theoretical Mw, kDa | Measured pI | Measured Mw | Fold change in NDAN versus AD |
| Isoform 3 of dynamin-1, DNM1 | 6.57 | 96.04 | 4.88 | 19 | – 1.6 |
| 4.93 | 20 | 1.96 | |||
| Glial fibrillary acidic protein, GFAP | 5.42 | 49.88 | 5 | 20 | – 4.32 |
| 5.06 | 34 | – 2.07 | |||
| 4.98 | 18 | – 1.98 | |||
| 5.07 | 37 | 1.53 | |||
| 5.18 | 46 | 2.06 | |||
| 5.43 | 46 | 2.12 | |||
| 5.28 | 46 | 2.15 | |||
| 5.34 | 46 | 2.18 | |||
| 5.39 | 46 | 2.58 | |||
| Isoform 2 of glial fibrillary acidic protein, GFAP | 5.53 | 50.28 | 5.74 | 48 | – 1.6 |
| 5.16 | 49 | 1.53 | |||
| 5.07 | 37 | 1.56 | |||
| 5.5 | 46 | 1.6 | |||
| 5.23 | 46 | 1.63 | |||
| 5.17 | 38 | 1.63 | |||
| 5.16 | 35 | 1.7 | |||
| 5.09 | 36 | 2.42 | |||
| Hemoglobin subunit beta, HBB | 6.74 | 16 | 7.34 | 14 | 1.67 |
| 7 | 14 | 1.84 | |||
| 7.35 | 14 | 2.9 | |||
| Keratin type I cytoskeletal 9, KRT9 | 5.14 | 62.06 | 4.82 | 13 | – 1.56 |
| 6.14 | 17 | 1.55 | |||
| Keratin type II cytoskeletal 1, KRT1 | 8.15 | 66.04 | 5.54 | 17 | – 3.1 |
| 4.66 | 35 | – 1.81 | |||
| 7.55 | 12 | – 1.54 | |||
| Profilin-2, PFN2 | 9.26 | 9.84 | 5.06 | 13 | – 2.08 |
| 5.76 | 14 | – 1.54 | |||
| Isoform cytoplasmic + peroxiredoxin-5, mitochondrial | 6.73 | 17 | 7.75 | 16 | – 2.27 |
| Isoform 3 of peroxiredoxin-5, mitochondrial | 9.12 | 17 | 7.7 | 15 | – 1.77 |
| Isoform IB of synapsin-1, SYN1 | 9.88 | 70.03 | 8.87 | 74 | – 2 |
| 9.17 | 75 | – 1.72 | |||
| Tubulin alpha-1B chain, TUBA1B | 5.03 | 27.55 | 5.23 | 33 | – 2.97 |
| 5.29 | 33 | – 1.66 | |||
| 5.54 | 46 | 2.04 |
16.2Validation of selected protein targets
To validate the protein changes observed using the 2DE we selected four target proteins based on the fold change and availability of commercial antibodies. Additionally, we included one protein (PSD95) that was not changed in our proteomic dataset. Validation was performed on a different set of hippocampal samples (five cases per group) different from those used for proteomics (Table 4) that were analyzed individually.
Table 4
Demographic data of the cases used for validation of protein levels using immunoblotting
| Case number | Diagnosis | Age, y | Sex | PMI, h | Braak stage | MMSE |
| 2467 | Control | >89 | F | 4.5 | 3 | 28 |
| 2553 | Control | >89 | M | 4 | 2 | 28 |
| 2682 | Control | >89 | F | 9 | 2 | 29 |
| 2755 | Control | >89 | F | 18 | 2 | 29 |
| 2953 | Control | >89 | M | 2.5 | 3 | 27 |
| Average | 97 | 2/3 | 8 | 2 | 28 | |
| 2272 | AD | >89 | F | 5 | 6 | 20 |
| 2312 | AD | 87 | F | 2.5 | 6 | 19 |
| 2316 | AD | 83 | M | 13 | 5 | N/A |
| 2317 | AD | 88 | M | 4.5 | 6 | N/A |
| 2374 | AD | >89 | M | 24 | 6 | N/A |
| Average | 88 | 3/2 | 10 | 6 | 20 | |
| 2322 | NDAN | >89 | F | 14 | 4 | 29 |
| 2474 | NDAN | >89 | F | 8 | 4 | 28 |
| 2491 | NDAN | 82 | M | 17 | 4 | 27 |
| 2556 | NDAN | >89 | M | 12 | 4 | 28 |
| 2753 | NDAN | >89 | M | 12 | 4 | 28 |
| Average | 89 | 3/2 | 13 | 4 | 28 |
PMI, postmortem interval; MMSE, Mni-Mental State Exam.
For validation using immunoblotting we selected CAMK2A, GAPDH, UCHL1, and PFN proteins (Fig. 3). Blotting for CAMK2A was not consistent with the proteomics results (Table 5), possibly due to inter-individual variability which was more pronounced in AD. Nonetheless, in direct comparison of NDAN versus AD, we noted a same trend for increased levels of this protein (1.23), which, however, did not reach the same fold change (1.98 in proteomics).
Fig.3
Confirmation of proteomic changes for selected proteins. Five cases per group were assayed individually. Case information is provided in Table 4.
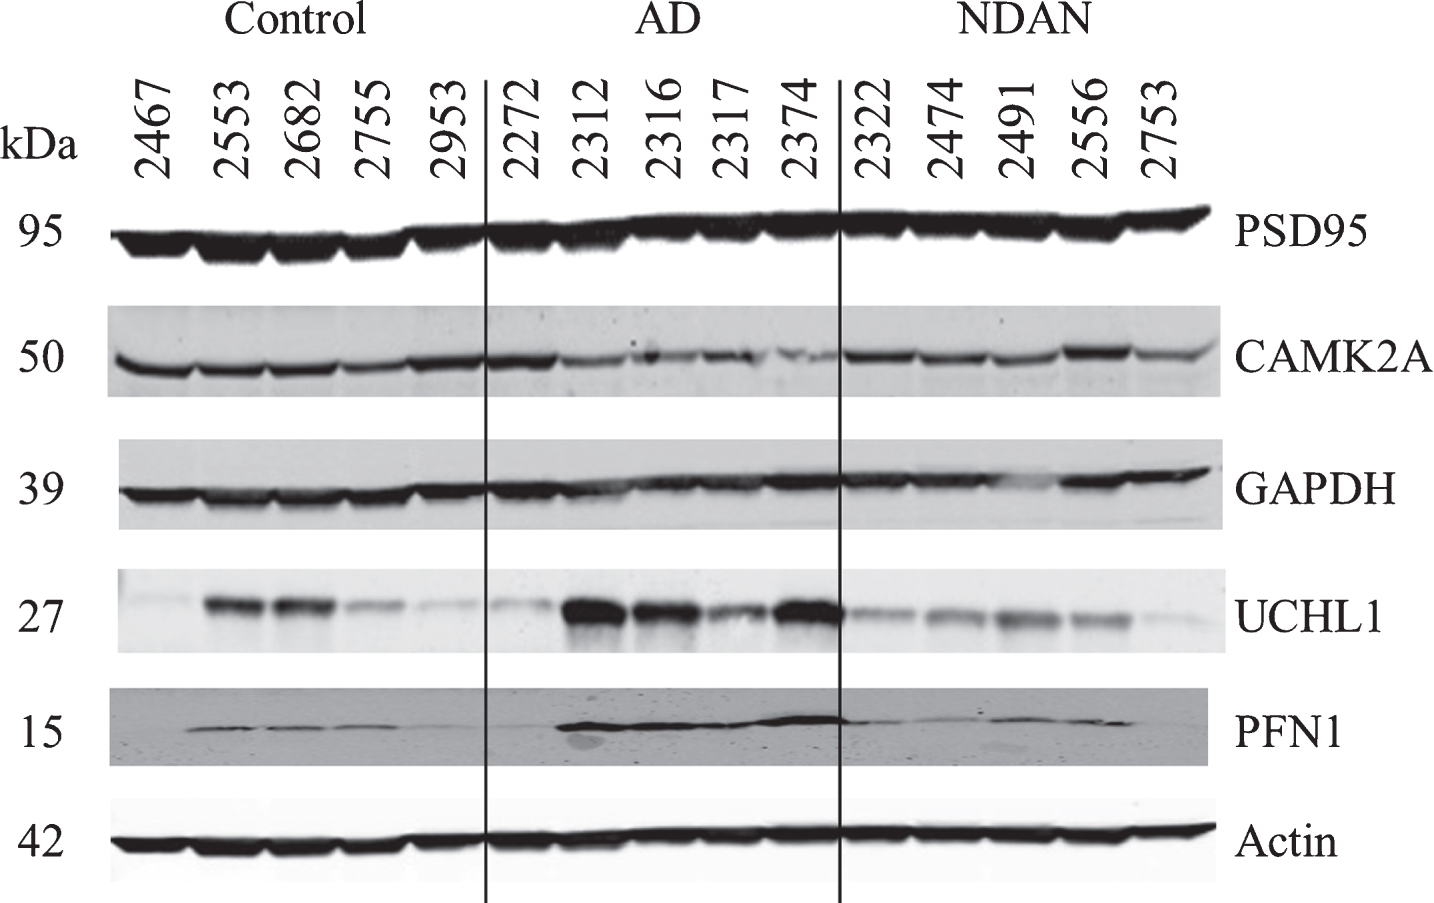
Table 5
Densitometry analysis of Western blots for PSD95, CAMK2A, GAPDH, UCHL1 and PFN
| Protein name | AD versus Control | p | NDAN versus AD | p | NDAN versus Control | p |
| PSD95 | – 1.35±0.07 | 0.025 | 1.14±0.04 | 0.237 | – 1.18±0.04 | 0.069 |
| CAMK2A | – 1.44±0.13 | 0.081 | 1.23±0.08 | 0.350 | – 1.17±0.09 | 0.271 |
| GAPDH | – 1.03±0.03 | 0.627 | – 1.18±0.06 | 0.248 | – 1.21±0.12 | 0.191 |
| UCHL1 | 2.67±0.76 | 0.091 | – 2.86±0.47 | 0.062 | – 1.07±0.23 | 0.892 |
| PFN | 3.49±0.84 | 0.024 | – 2.65±0.56 | 0.043 | 1.32±0.32 | 0.492 |
Data are presented as mean ± standard error of 5 cases per group; statistical significance was determined by Student’s t-test.
Assessment of GAPDH levels revealed no change across experimental groups (Fig. 3 and Table 5), which could be explained by the presence of four isoforms in the proteomic dataset, three of which had no change in NDAN versus AD, that could mask the detection of changes in only one out of the four isoforms detected by the immunoblotting antibody.
UCHL1 (Fig. 3 and Table 5) presented with some inter-individual variability, overall confirming the proteomics data (NDAN versus AD: – 2.47 in proteomics and – 2.86 in densitometry analysis of immunoblotting).
Similarly, immunoblotting and proteomics quantification of PFN demonstrated a similar decrease of protein levels in NDAN versus AD (Fig. 3 and Table 5).
Levels of PSD95 were not changed significantly across three groups (Fig. 3 and Table 5) as determined by immunoblotting, confirming the proteomic data.
In the following discussion, some of the proteins we have identified are usually found in the presynaptic terminals. Our samples were prepared using a PSD-enrichment protocol, therefore, some of the presynaptic proteins were identified during the proteomic analysis. We elected to present these results as the presynaptic proteins contribute to the observed changes at the synaptic level.
16.3Main upstream regulators
The thirty-one proteins were analyzed using Ingenuity Pathway Analysis (IPA) to determine main upstream regulators and pathways. Five upstream elements were identified as regulators of the changes that were observed: MAPT (microtubule-associated protein tau), PSEN1 (presenilin 1), AβPP (amyloid-β precursor protein), HTT (huntingtin), and D-glucose. MAPT, PSEN1, AβPP, and HTT are known to play a role in AD pathogenesis ([11, 45, 46]; reviewed by [47–49]). Multiple studies with 18F-fluorodeoxyglucose demonstrate that in AD there is a progressive reduction of glucose metabolism which correlates with severity of the disease (reviewed by [50]). Impaired glucose metabolism in the brain is one of the pathophysiological features that frequently precedes clinical manifestation in AD (reviewed by [50]).
16.4Canonical pathways and molecular and cellular functions
IPA was used to identify pathways that the 31 changed proteins collectively represent or are a part of. The top canonical pathways returned by the IPA were: remodeling of epithelial adherens junctions (p = 5.14*10-12), epithelial adherens junction signaling (p = 1.07*10-9), phagosome maturation (p = 1.18*10-9), 14-3-3 mediated signaling (p = 2.49*10-8), axonal guidance signaling (p = 2.42*10-6), and gap junction signaling (p = 3.75*10-6).
The molecular and cellular functions identified by IPA included cellular assembly and organization, cellular function and maintenance, and cell morphology. Interestingly, eleven proteins from our dataset cluster into the nervous system development and function pathway. This is consistent with our previous findings showing that when compared to AD and MCI, NDAN individuals have higher rate of neurogenesis in the dentate gyrus, which is positively correlated to their ability to escape (or significantly delay) dementia [51].
PANTHER [52–54] was used to analyze relevant proteins by function (Fig. 4). Table 6 describes identified proteins in NDAN versus AD by functional category.
Fig.4
Pie chart representing the PANTHER classification of proteins based on protein class. The number of proteins in each category is shown in parenthesis.
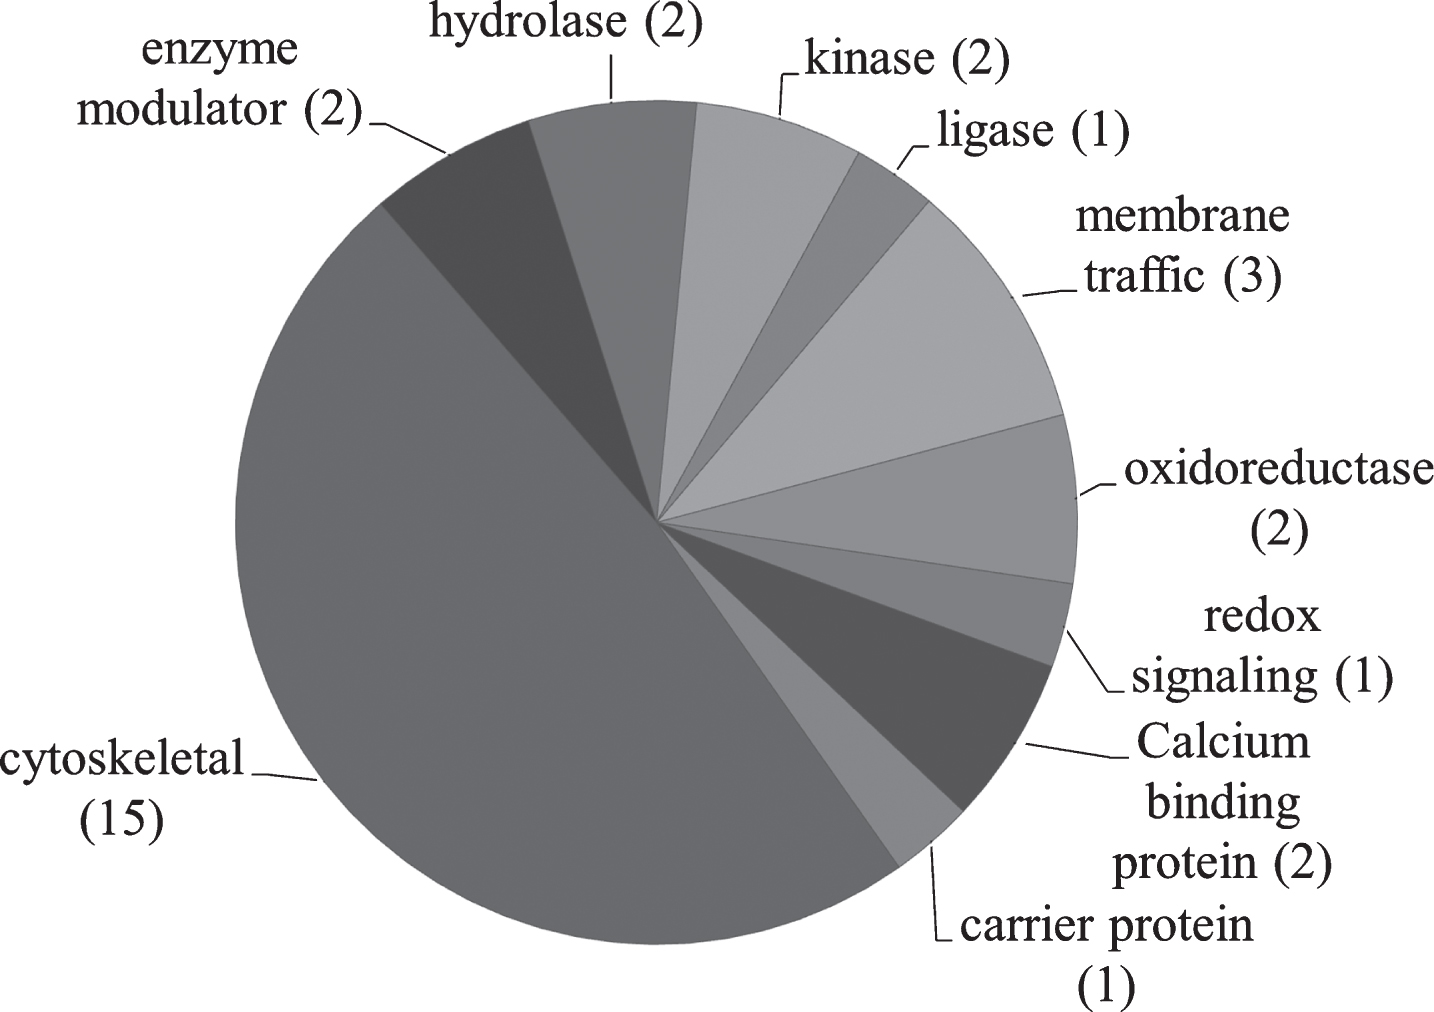
Table 6
PANTHER protein class analysis
| Functional category | Name of protein |
| Calcium binding proteins | Annexin 2 |
| Calreticulin | |
| Carrier proteins | Hemoglobin |
| Enzyme modulators | Ras-related protein Rap-1b |
| Rho GDP-dissociation inhibitor 1 | |
| Hydrolases | 2’,3’-cyclin-nucleotide |
| 3’-phosphodiesterase | |
| Ubiquitin carboxyl-terminal | |
| hydrolase isozyme L1 | |
| Kinases | Calcium/calmodulin-dependent protein kinase II subunit alpha |
| Creatine kinase B | |
| Ligases | Pyruvate carboxylase |
| Membrane traffic | Clathrin light chain A |
| Synapsin 1 | |
| Syntaxin binding protein 1 | |
| Oxidoreductases | Glyceraldehyde-3-phosphate dehydrogenase |
| Malate dehydrogenase | |
| Redox signaling | Peroxiredoxin 5 |
| Cytoskeletal | Dynamin-1 |
| Glial fibrillary acidic protein | |
| Keratin type I cytoskeletal 10 | |
| Keratin type I cytoskeletal 9 | |
| Keratin type II cytoskeletal 1 | |
| Neurofilament medium polypeptide | |
| Profilin-2 | |
| Septin-7 | |
| Spectrin alpha chain | |
| Tubulin alpha-1A | |
| Tubulin alpha-1B | |
| Tubulin beta-2A | |
| Tubulin beta-4A | |
| Tubulin beta-6 chain | |
| Vinculin |
DISCUSSION
17.1Protein function and pathway analysis
The samples employed in this study consisted of PSD-enriched hippocampal fractions; the purity of PSD fractions prepared according to our protocol was previously described [24]. The proteomic methodology for this study was chosen for the superior quantitative aspects, but due to technical limitations of extraction and the 2DE methodology, hydrophobic or transmembrane proteins are not reliably represented in our dataset. Future studies focusing on transmembrane proteins will complement this initial work that therefore centers on soluble, non-transmembrane proteins. Among the 31 proteins that have significantly different levels in NDAN versus AD, fifteen form a unique expression pattern in NDAN, setting these individuals aside from both age-matched healthy controls and AD patients. Existence of the unique protein “signature” at the PSD of NDAN cases suggests that these non-demented subjects should not be considered pre-symptomatic AD, but rather individuals who are clearly distinct from both control and those who have clinical manifestation of the disease.
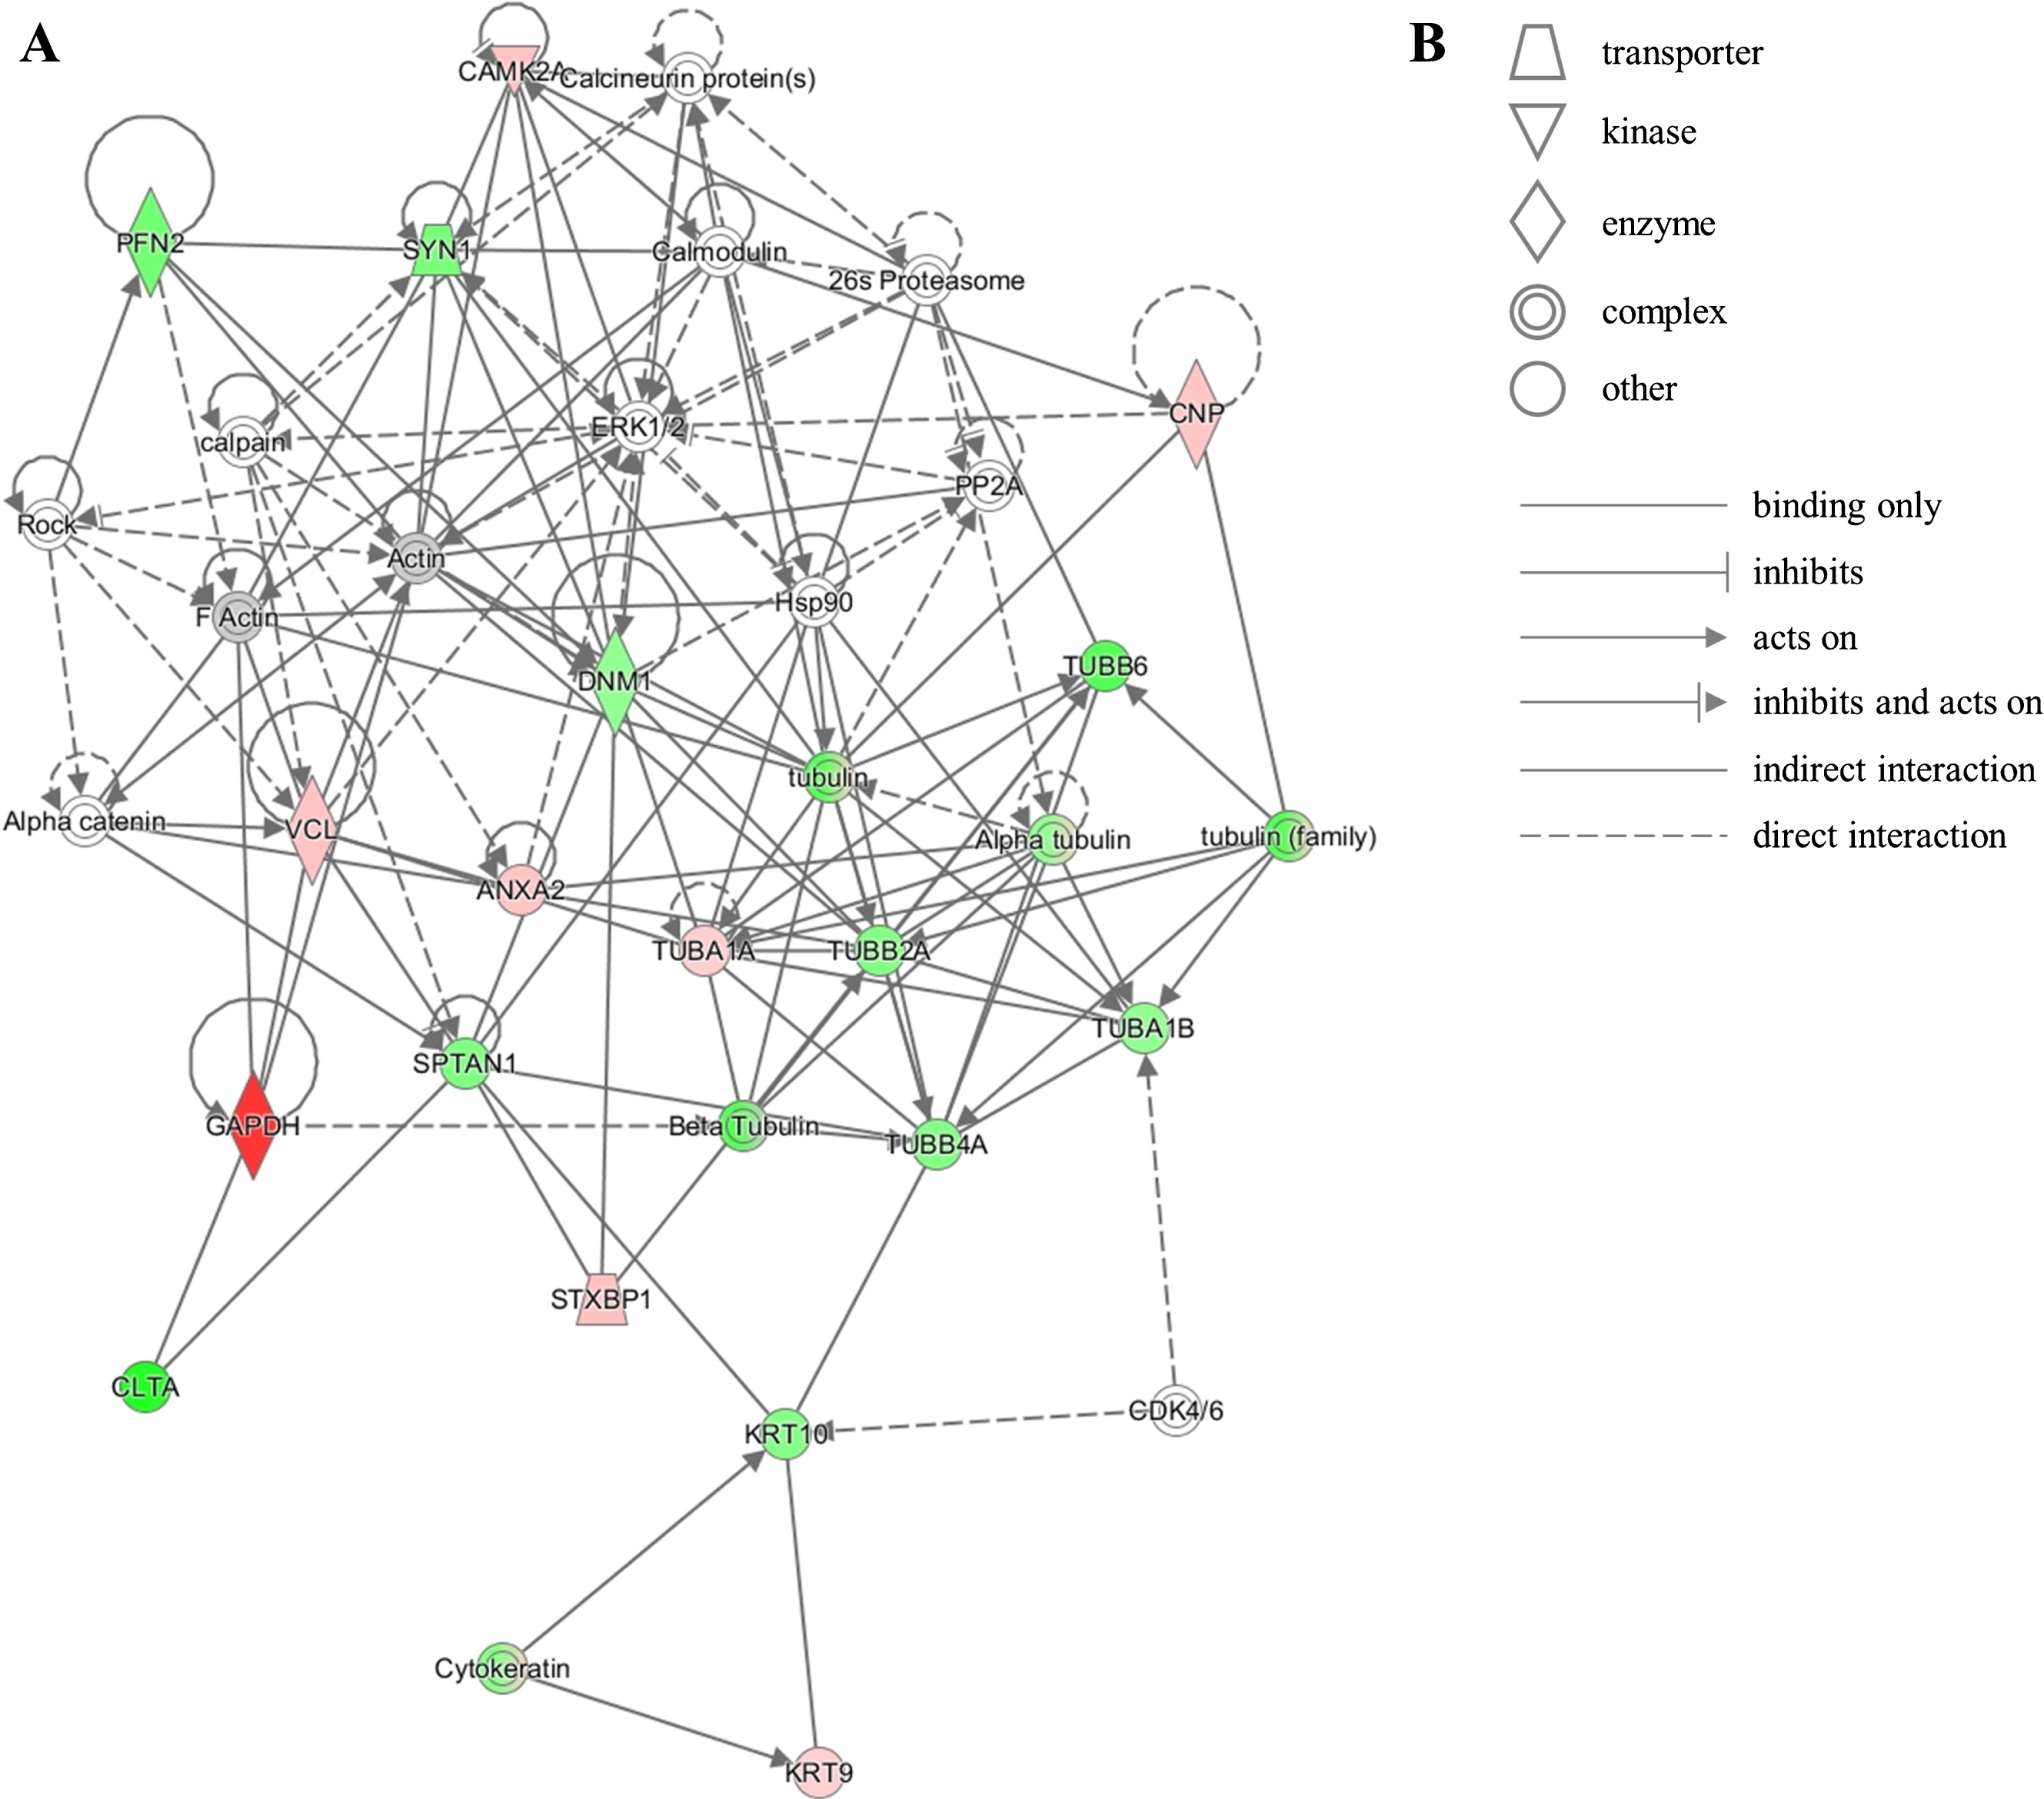
The unique protein expression signature in our dataset represents several pathways that converge onto junction signaling, phagosome maturation and 14-3-3 pathway. Additionally, twenty proteins from our dataset were clustered by IPA into the neurological disease pathway, which reveals that these proteins are closely related to each other and have been previously shown by other investigators to be implicated in brain diseases (Fig. 5). This latter observation corroborates the notion that relevant mechanisms may be acting at the NDAN synapses to mediate their resilience to neurodegeneration and associated dementia.
Fig.5
IPA identifies twenty proteins from our dataset that are associated with the neurological disease network. A) Upregulated (red) or downregulated (green) proteins from our dataset are highlighted in the network. Solid and dashed lines indicate direct and indirect correlation between proteins, respectively. CAMK2A, calcium/calmodulin-dependent protein kinase type II subunit alpha; PFN2, profilin-2; SYN1, synapsin-1; CNP, 2’,3’-cyclic-nucleotide 3’-phosphodiesterase; PP2A, protein phosphatase 2; ERK1/2, mitogen-activated protein kinase 1/2; DNM1, dynamin-1; Hsp90, heat shock protein 90; TUBB6, tubulin beta-6 chain; VCL, vinculin; ANXA2, annexin 2; TUBA1A, tubulin alpha-1A chain; TUBB2A, tubulin beta-2A chain; TUBA1B, tubulin alpha-1B chain; TUBB4A, tubulin beta-4A chain; SPTAN1, spectrin alpha chain, non-erythrocytic 1; GAPDH, glyceraldehyde-3-phosphate dehydrogenase; CLTA, clathrin light chain A; STXBP1, syntaxin-binding protein 1; KRT10, keratin, type I cytoskeletal 10; CDK4/6, cyclin-dependent kinases 4/6; KRT9, keratin, type I cytoskeletal 9. B) Figure legend for the IPA network. Nodes in the network are depicted by different shapes that represent various functional classes of the proteins. Arrows/lines represent different molecular relationships in the IPA network.
17.2Progression of neuropathology: Proteins with a more pronounced change in either AD or NDAN
We found higher levels (1.83 fold) of annexin 2 (ANXA2) at the PSDs of NDAN subjects (1.55 AD versus control, 2.85 NDAN versus control). ANXA2 belongs to a group of soluble, hydrophilic proteins which can bind to negatively charged phospholipids in a Ca2 +-dependent manner [55]. ANXA2 has Ca2 +-dependent filament bundling activity and can participate in membrane vesicle aggregation, where it forms membrane-membrane or membrane-cytoskeleton connections by interacting with F-actin [55]. Notably, decreased levels of F-actin have been associated with synapse structural instability in AD (reviewed by [56]). ANXA2 has been demonstrated to modulate the activity of membrane channels, including Cl- and Ca2 +; in addition, ANXA2 functions as a GLUT-4 transporter upon insulin stimulation [57]. Furthermore, ANXA2 interaction with tau modulates the tau mobility in the tips of neurites [58]. Therefore, higher levels of ANXA2 present in NDAN synapses could be indicative of preserved synaptic structure, function and insulin responsiveness.
Calcium/calmodulin-dependent protein kinase type II subunit alpha (CAMK2A) is a serine/threonine protein kinase and is required for hippocampal long-term potentiation (LTP) and spatial learning (as reviewed by [59]). Exposure to Aβ oligomers decreases the CAMK2 pool at the synapse [60]. CAMK2A-containing neurons are selectively lost in the CA1 of hippocampus in AD patients [61]. CAMK2 serves as a molecular switch for LTP and is capable of long-term memory storage [62]. CAMK2A levels are increased by 1.98 fold in NDAN when compared to AD (1.43 AD versus control, 2.83 NDAN versus control), which could indicate that robust CAMK2 upregulation is a necessary event to provide resistance of synapses to AD-related disruption as seen in NDAN, an event that may occur to an insufficient extent in symptomatic AD. The functionality of CAMK2A is measured by the subcellular localization and phosphorylation at Thr286 [63], which were not assessed in this study. However, our previous study demonstrated that in AD the PSD immunoreactivity of the p(Thr286)CAMK2 is shifted away from the dendritic spines as it accumulates at the neuron’s cell body in an Aβ oligomer-dependent phenomenon ([32], reviewed by [59]), and therefore, present results of CAMK2A levels at the PSD could reflect the compartmentalization of this protein.
Hemoglobin (HBB) was increased in NDAN versus AD, a phenomenon consistently observed for each of the detected isoforms: 1.67 (1.75 AD versus control, 2.92 NDAN versus control), 1.84 (1.68 AD versus control, 3.09 NDAN versus control) and 2.9 fold (1.26 AD versus control, 3.66 NDAN versus control), which could suggest multiple scenarios. First, increased levels of HBB can indicate a response to hypoxia in the brain. Indeed, decreased expression of hemoglobin in AD was observed in neurons containing NFTs [64]. Furthermore, nitric oxide and its metabolites have high affinity for HBB, and HBB can be considered a protectant from oxidative and nitrosative stress [65]. Besides nitric oxide scavenging, HBB is capable of binding Aβ and enhancing its aggregation ability due to the presence of the iron core; HBB was previously shown to localize to amyloid plaques in AD brains [66]. It is thus possible that in NDAN HBB is promoting Aβ removal from the synapses which is supportive of our previous findings [24]. On the other hand, HBB presence at the synapse could be due to leaky blood-brain barrier, which has been shown to occur in the aged and diseased CNS ([67, 68], reviewed by [69]). However, mRNAs for hemoglobin α- and β-chains were previously detected in rat and human neuronal cultures [70, 71], whereas human brain sections stained for HBB showed a granular pattern in the cytoplasm without localization to specific compartments [70, 72], collectively suggesting a possible role of local HBB within neurons.
Malate dehydrogenase (MDH) is the terminal enzyme of the TCA cycle; its function is to catalyze the conversion of L-malate to oxaloacetate, which requires NAD as a cofactor [73]. In our dataset we found an increase in MDH2 at the PSD of 1.77 fold in NDAN as compared to AD patients (1.67 AD versus control, 2.97 NDAN versus control). While it has been reported that MDH levels can be elevated during caloric restriction in mice [74], a diet regimen known to reduce age-associated CNS deficits (reviewed by [75, 76]), the physiological significance of increased MDH at the synapses remains to be established [74].
Tubulin alpha-1A (– 2.13 AD versus control, – 1.37 NDAN versus control, 1.56 fold in NDAN versus AD) and beta-6 (– 1.59 AD versus control, – 4.01 NDAN versus control, – 2.51 fold in NDAN versus AD) have significantly different abundance in NDAN versus AD (Table 3). Tubulin alpha and beta are the main components of microtubules which are very dynamic structures. Microtubules undergo rapid growth and disassembly which could potentially explain the protein level variability in our dataset, as well as the possibility of multiple post-translational modifications (reviewed by [77]).
Interestingly, the majority of proteins in this category presented with higher fold change in NDAN versus control, than in AD versus control. It is therefore tempting to speculate that these proteins participate in the protective phenotype in NDAN, which is also observed in AD to a limited extent and is therefore possibly ineffective (and/or abortive).
17.3Protein changes unique to AD
2’,3’-cyclin-nucleotide 3’-phosphodiesterase (CNP) levels in AD were found to be – 1.66 fold decreased versus control. Our data is in agreement with previously published findings by Reinikainen et al. where they describe decreased CNP activity in hippocampus of AD patients [78]. Activity of CNP can be used as a measure of myelination of axons and lower levels of CNP in AD could be indicative of the loss of myelination of hippocampal neurons [79]. CNP hydrolyses 2’,3’-cyclic nucleotides to create 2’-derivatives [80]. CNP can regulate tubulin polymerization and microtubule distribution [81], as microtubules use CNP as a linker, which allows them to connect to the plasma membrane. Additionally, CNP stimulates F-actin reorganization, which is essential for filopodia and lamellipodia formation [81]. CNP levels were unchanged in NDAN versus control and were decreased in AD, which once again supports the idea that NDAN synapses remain healthy.
Glyceraldehyde-3-phosphate dehydrogenase (GAPDH) was found to be dramatically downregulated in AD versus control (– 6.19 fold). As reviewed by Butterfield et al., in addition to glycolytic activity, GAPDH performs many other functions: DNA and RNA binding, transcription regulation, kinase, catalysis of microtubule formation and polymerization, vesicular transport and interaction with multiple molecules and proteins, including nitric oxide, huntingtin, and AβPP [82]. In addition, GAPDH can undergo multiple post-translational modifications: oxidation, phosphorylation, S-nitrosylation, as well as direct or indirect interaction with oxidative species. GAPDH can interact with Aβ [83], and has been found to be a major component of amyloid plaques and NFTs in AD brains [82]. Aβ, on the other hand, was shown to stimulate inactivation of GAPDH in addition to promoting its nuclear translocation and pro-apoptotic function [82]. GAPDH levels are decreased in AD which can indicate reduced glucose metabolism [84]. GAPDH has been suggested to be a potent target to prevent neurodegeneration in AD brains, due to ability of GAPDH to serve as scaffold for AβPP, Aβ40 and Aβ42, and tau protein [82, 83]. Levels of GAPDH in NDAN are unaltered when compared to control, which distinguishes NDAN from AD and can indicate better overall brain health of NDAN individuals.
Neurofilament medium polypeptide (NEFM) was measured at – 1.28 in AD versus control, which indicates a trend toward decrease in AD. Overall in NDAN versus AD NEFM was changed by 1.5 fold (1.17 in NDAN versus control). Neurofilaments play a role in establishing and maintenance of the 3D structure of axons [85]. NEFM is essential for the formation of the cross-bridge, stabilization, and extension of filament network [85, 86]. NEFM tail and its phosphorylation are required for radial growth of large myelinated motor axons [85]. Neurofilaments allow neurons to maintain their shape and are required for axon growth [87]. Neurofilaments can interact with microtubules, certain receptors that are located at the PSD and many other proteins that are transported along neurofilaments.
We found that the level of Septin-7 (SEPT7) was increased by 1.48 fold in the PSD of AD patients as compared to control subjects while remaining unchanged in NDAN versus control. Septins are evolutionary conserved cytoskeletal GTPases. Septins can be found in NFTs, dystrophic neurites in senile plaques, and neuropil threads in AD brains [88]. Some septin species are also found in granular or fine fibrillary deposits in neuronal soma [88]. Formation of septin fibrils suggests that aggregation of this protein may accompany NFT formation. In order to function properly, septins form filaments following a process regulated by GTP hydrolysis [88]. Dysregulation of normal septin assembly in neurons may result in affected vesicular transport and structural integrity, leading to accelerated neurodegeneration. Interactions with phospholipids, microtubules and actin can influence septin assembly [89]. Septin assemblies can modulate the distribution of surface proteins and receptors and can also play a role in clathrin-mediated endocytosis [89]. It is thought that septins can serve as scaffolds for submembranous structures, assisting in neuronal polarity and vesicle trafficking [89]. SEPT7, in particular, can be located on the cytoplasmic side of presynaptic membranes and in endfeet of astroglia [90]. As reviewed by Mostowy and Cossart, SEPT7 plays a role in actin dynamics, axon growth, cell shape, chromosome segregation, cytokinesis, dendrite formation, DNA repair, membrane trafficking and microtubule regulation in addition to serving as a scaffolding protein [89].
17.4Protein changes unique to NDAN
Calreticulin, a key upstream regulator of calcineurin [91], is a chaperone protein that can be found in several organelles in neurons and glial cells [92]. It is known to interact with AβPP, Aβ, and Ca2 + [91, 93–97]. Calreticulin was found at lower levels (– 3.27 fold) at the PSDs in NDAN when compared to control. While lower levels of calreticulin have been shown to be associated with decreased calcineurin activity [98, 99], increased calcineurin has been reported in the AD brain and correlates with disease severity [100, 101]. Furthermore, we have previously shown that calcineurin mediates the toxic action of Aβ oligomers at synapses and that pharmacological inhibition of calcineurin protects from AD-related memory deficits in both experimental animals and humans ([31, 102–104]; reviewed by [33]). Furthermore, we found that calcineurin levels are unaltered in the brain of NDAN subjects as compared to demented AD patients (Taglialatela et al., unpublished observation). Therefore, reduced calreticulin levels at the synapses in NDAN individuals may be one of the mechanisms maintaining low calcineurin, thus contributing to preservation of synaptic integrity in the face of the presence of toxic amyloid oligomers.
Clathrin was downregulated in NDAN versus control (– 3.34 fold). Clathrin plays an important role in sorting and recycling of the proteins at the synaptic membrane [105]. While the protein levels of clathrin in AD are preserved when compared to control, the regulation of clathrin transport is known to be impaired in AD brains [105]. Under normal conditions clathrin is transported from neuronal perikarya to axonal terminals, with the highest concentration of clathrin found at the synaptic terminals [105]. However, Nakamura et al. report that in AD the amount of clathrin at synaptic terminals is decreased, while NFTs and neuronal perikarya have detectable levels of clathrin [105]. In the growth cones, repulsive Ca2 + signals cause asymmetric clathrin-mediated endocytosis via calcineurin [106]. Calcineurin activation results in clathrin- and dynamin-dependent endocytosis. Additionally, Aβ42 reduces axonal density by promotion of clathrin-mediated endocytosis in the growth cones, which results in a growth cone collapse due to Ca2 + signaling, and calcineurin and calpain activation [107]. Moreover, inhibition of clathrin-mediated endocytosis was demonstrated to rescue the Aβ42-induced toxicity [107]. Reduction of clathrin levels at PSD in NDAN in comparison to AD could thus be another contributing factor to the ability of NDAN synapses to withstand the toxic hit by Aβ which in AD results in increased endocytosis and growth cone retraction.
Creatine kinase B (CKB) levels were decreased at the PSDs of NDAN versus control (– 2.57 and – 1.88 fold). The CKB family of enzymes is involved in the regulation of the ATP and ADP levels by reversible transfer of phosphate onto creatine to form phosphocreatine, which can provide energy when ATP concentrations drop [108, 109]. Additionally, CKB is identified as a part of slow axonal transport [110]. CKB-deficient cells show significantly increased fraction of motile mitochondria [108]. While initial evidence suggests that synaptic mitochondria in NDAN have less DNA damage through a preserved mitochondrial DNA repair system (Taglialatela et al., unpublished observation), we have not yet analyzed mitochondria function in NDAN versus AD, nevertheless, it has been reported that mitochondria are severely impaired in AD [111, 112]. Interestingly, two subunits of the mitochondrial membrane respiratory chain complex I were detected in our dataset. NADH dehydrogenase [ubiquinone] 1 alpha subcomplex subunit 5 (NDUFA5) and NADH dehydrogenase [ubiquinone] flavoprotein 1 (NDUFV1) did not meet the±1.5 fold cut-off criteria in NDAN versus AD, however, they were measured at – 1.44 and – 1.47 fold changes, respectively. Collectively these findings indicate the dysregulation of mitochondrial function in the presence of AD-like pathology. Mitochondria function and ATP generation in the brain can be affected by the improper glucose metabolism since Krebs cycle and oxidative phosphorylation of glucose occur in mitochondria (reviewed by [50]).
Activity of pyruvate carboxylase (PC) is tightly regulated. PC activity can be downregulated by insulin, which reduces the carbon flux when the glucose levels are high [113]. Lower levels of PC in NDAN (– 1.59 fold versus AD) could be explained by the fact that NDAN subjects, unlike AD, have preserved insulin responsiveness (Taglialatela et al., unpublished observation). One of the important roles of PC pathway is detoxification of ammonia from the brain, during which glutamine synthetase catalyzes formation of glutamine from ammonia and glutamate. Conversion of pyruvate to oxaloacetate replenishes the TCA cycle, which is utilized during detoxification of ammonia or oxidation of glutamate [114].
Synapsin 1 (SYN1) is downregulated in NDAN versus control (– 1.71 and – 1.48 fold). SYN1 is a member of a family of neuron-specific phosphoproteins that can be localized pre- and postsynaptically [115, 116]. SYN1 plays a role in regulation of axonogenesis, synaptogenesis and regulation of nerve terminal function in mature synapses [116]. SYN1 is differentially distributed in different regions of the hippocampus. It is suggested that presynaptic SYN1 (approximately 60% of total SYN1) becomes associated with synaptic vesicles, while the postsynaptic 40% of this protein possibly represent the newly synthesized protein that will be transported to the nerve terminals [115].
Syntaxin binding protein 1 (STXBP1) is upregulated in NDAN versus control (2.24 fold). Syntaxin 1 and STXBP1 form a complex in 1:1 ratio [117]. STXBP1 can act as a chaperone for syntaxin [118]. Proteins of the STXBP1 family can interact with Rabs, small GTPases, and together they may play a role in vesicle trafficking and membrane fusion [118]. STXBP1 proteins can also contribute to the specificity of membrane trafficking. It has been suggested that protein kinase C regulates the STXBP1-syntaxin interaction [118]. Syntaxin bound to STXBP1 cannot interact with other proteins, which indicates that STXBP1 can play a role in determining the binding partners for syntaxin and further complex formation [118]. We have not detected syntaxin in the current proteomics set, therefore, we cannot unequivocally conclude if the higher levels of STXBP1 correlate with those of syntaxin as part of the complex that these proteins are known to form.
Donovan et al. reported increased levels of ubiquitin carboxyl-terminal hydrolase isozyme L1 (UCHL1) in AD when compared to healthy individuals [119]; we found a decrease in UCHL1 levels at the PSD in NDAN (– 2.37 NDAN versus control). UCHL1 can associate with free ubiquitin in neurons, which suggests that this interaction is important for maintenance of the free ubiquitin pool in neuronal cells [120, 121]. UCHL1 is expressed mostly by neurons and neuroendocrine cells, and it was found in Lewy bodies [122] and NFTs [123]. Interestingly, Lombardino et al. showed that replaceable neurons have lower levels of UCHL1 when compared to non-replaceable neurons [124], which can be in concordance with the increased neurogenesis in NDAN [51] one of the hypothesis behind NDAN preserved cognitive function.
Several proteins involved in actin dynamics were uniquely affected in NDAN. Actin and other cytoskeletal proteins are responsible for changes in spine morphology. Dendritic spine dynamics are determined by actin cytoskeleton organization [125]. Ability of spines to change their structure allows for synaptic plasticity and plays an important role in memory formation [125]. Therefore, it is not unreasonable to argue that the changes in this class of proteins described below and uniquely observed in NDAN subjects are intimately associated with their preservation of synaptic integrity and cognitive ability ([24–26, 30], reviewed by [23, 33]). Cytoplasmic actin 2 showed a trend for downregulation in NDAN when compared to AD (– 1.49 fold). Actin is responsible for stabilization of synaptic boutons in addition to modulation of bouton’s structure to adjust to postsynaptic signaling [125]. The interaction between actin and profilins is essential for proper actin polymerization [126]. Profilins provide actin monomers to the barbed-end polymerization of actin filaments [125]. We found profilin 2 to be downregulated in NDAN when compared to control by – 2.06 fold. We further found vinculin (VCL) to be upregulated in NDAN versus control by 1.97 fold. VCL plays an important role in focal adhesion strengthening and stabilization due to its interaction with actin and talin [127]. At the leading edge of focal adhesion, VCL coordinates actin organization and dynamics. VCL determines the architecture of the leading edge by engaging actin flow to the extracellular matrix at maturing focal adhesion [127]. Vinculin binds to actin directly; however, vinculin also has an effect on actin dynamics independent of direct binding [127, 128]. Interestingly, stabilization and maturation of focal adhesion are two distinct processes, as VCL inhibits the maturation of focal adhesion, but stimulates the stabilization [127].
Keratin type I cytoskeletal 10 (KRT10) is downregulated in NDAN versus control by – 1.87 fold. Changes in KRT10 in tear proteome were reported by Kalló et al. in AD patients [129]. Keratins are normally abundant in epidermal tissue; however, several other research groups have identified keratin 1 and 9 in samples of blood and cerebrospinal fluid (keratin 1 and 9 are discussed in section Protein isoforms).
Significant decreases in tubulin beta-2A and 4A were observed in NDAN versus control (– 1.55 and – 2.2, respectively). As discussed above in “Progression of neuropathology” section, tubulin is a major component of microtubules and is a very dynamic protein.
NDAN PSDs have higher levels of Ras-related protein Rap-1b (1.62 in NDAN versus control). Rap1B, a small GTP-binding protein [130], in growth cones of hippocampal neurons is required for axonal development and growth [131]. Rap1B works together with Cdc42, whereas Rho and Rac function as antagonists to regulate extension of axons and neurites [125]. Cdc42 is a member of Rho GTPase family that plays a role in differentiation of oligodendrocytes, axon outgrowth, and neuronal polarity and migration (reviewed by [132]). Rap1B is reported to regulate plasma membrane Ca2 + transport, enhancing protein kinase C activity which is needed at the tip of axon [131]. Consequently, Rap1B possibly functions as a positioning factor for protein kinase C [131] and increased Rap-1b at NDAN synapses could support the notion that NDAN synapses retain proper function.
Another molecule, Rho GDP-dissociation inhibitor 1 (RhoGDI), from the same pathway was downregulated in our dataset (– 1.5 fold in NDAN versus control). Levels of RhoGDI are typically in balance and roughly equivalent to combined levels of RhoA, Rac1, and Cdc42 [133]. RhoGDI functions as stabilizer for Rho proteins, protecting them from degradation [133]. Due to the complex regulation of RhoA/Rac1 cell signaling and the fact that we have not detected RhoA, Rac1, or Cdc42 in the PSD fractions, the exact meaning of altered RhoGDI levels in the NDAN PSD remains unclear. On the other hand, Cdc42/RhoA/Rac1 network is involved in actin assembly/disassembly in response to extracellular stimuli [134, 135], and our data indicate that this signaling pathway regulation differs in NDAN versus AD as can be inferred by the levels of some key players of this network, including RhoGDI and Rac1.
As reviewed by Yan and Jeromin, remodeling and degradation and overall metabolism of spectrin (SPTAN1) play a role in the maintenance of membranes and cytoskeleton, protein cleavage, recycling and degradation [136]. SPTAN1 was downregulated in NDAN versus control (– 1.56 fold). Interactions between spectrin and other membrane-anchored proteins allow for proper trafficking and dynamics of proteins within the lipid bilayer. In the brain, SPTAN1 is estimated to comprise approximately 3% of total membrane protein content, being present in neuronal cell bodies, dendrites and postsynaptic terminals [136]. Additionally, SPTAN1 can localize to plasma membrane, microtubules, mitochondria, endoplasmic reticulum and nuclear envelope. In AD, SPTAN1 and its breakdown products are increased and have been proposed to be used as biomarkers in AD patients [136–138]. At the PSD, spectrin functions as a connector between integral membrane proteins and actin (reviewed by [139]). SPTAN1/synaptosomal membrane interaction is inhibited by Ca2 + /calmodulin [140]. Spectrin interaction with NMDAR mediates the regulation of NMDAR activity, which can be the basis for plasticity-induced changes in spines (reviewed by [139]).
We detected multiple cytoskeletal proteins as well as their regulators to be altered in NDAN versus AD, which could indicate active remodeling of the synapses. Our findings concur with the observations reported by others regarding preserved synaptic integrity in NDAN [6, 141–143]. Collectively these results suggest that the complex regulation of structural proteins in NDAN contributes to Aβ resistance.
17.5Protein isoforms
Dynamin-1 (DNM1) is a large neuron-specific GTPase that is present at presynaptic terminals, where it is involved in synaptic vesicle budding off the membrane and recycling for future release [144]. DNM1 expression is dependent on CREB1 level [145]. DNM1 plays a role in formation of associative memory in hippocampus [146]. Dynamin in complex with other presynaptic proteins (e.g., synapthophysin) participates in plasticity by modulating the efficiency of vesicle release. When DNM1 was knocked down in AD animal models, Aβ levels were lowered possibly due to regulation of BACE1 internalization [147]. Conversely, in tissue culture (hippocampal neurons) application of Aβ causes the decrease of DNM1 levels via calpain-mediated proteolysis [144]. Interestingly, this reduction of DNM1 occurs prior to synapse loss in cultured hippocampal neurons, which suggests the intriguing hypothesis that synapses become dysfunctional first and later the synapse retraction/loss occurs. In our dataset we have identified 2 protein spots for DNM1 on 2DE with fold change of 1.69 and – 1.6 in NDAN versus AD. It remains to be established if the DNM1 undergoes a post-translational modification which could explain different levels of this protein in our dataset.
We have detected several isoforms of glial fibrillary acidic protein (GFAP), which can be expressed by several cell types in the brain, including neurons [148]. In concordance with other published studies [149], we have identified several horizontal “trains” of GFAP on the 2DE in our study (18 spots on the gel) (Table 3), which could indicate protein cleavage and/or degradation, co-translational or post-translational modifications that can affect the structure and function of GFAP. GFAP can undergo many post-translational modifications, such as phosphorylation, sulfation, glycosylation, oxidation, acetylation and other [150]. Each modification can result in different alteration of GFAP function and/or localization, although the exact mechanisms are still under investigation.
Keratin type I cytoskeletal 9 (1.55 and – 1.56 fold in NDAN versus AD) and keratin type II cytoskeletal 1 (– 3.1, – 1.54, and – 1.81 fold in NDAN versus AD) are expressed at significantly different levels in NDAN versus AD (Table 3). Notably, keratin 9 was identified by multiple research groups in the cerebrospinal fluid and has been even proposed as a biomarker for AD [151–153]. Furthermore, keratin 1 was identified in 5xFAD mouse hippocampi using proteomics [154], and keratin 1 and 9 show different expression patterns in other neurodegenerative disorders [155].
Several isoforms of tubulin alpha-1B with fold change of 2.04, – 1.66, and – 2.97 were significantly different between NDAN and AD. The possible significance of tubulins in the maintenance of synaptic function/stability in NDAN versus AD has been discussed earlier.
Peroxiredoxins (PRDX) play a role in protection from oxidative stress, cell differentiation, proliferation, immune response and apoptosis [156]. In our data set we find lower levels of PRDX5 (– 1.77 and – 2.27 fold) at the PSD of NDAN versus AD which can potentially indicate decreased oxidative stress in the brains of these individuals [157]. PRDX5 can neutralize hydrogen peroxide, alkyl hydroperoxides and peroxynitrite [158, 159] and its expression is increased during oxidative stress [160]. Peroxynitrite can alter the mitochondrial electron transport chain, therefore, efficient neutralization of peroxynitrite can be neuroprotective [160].
17.6Conclusion
In summary, we used subcellular fractionation combined with 2DE and mass spectrometry protein identification to study the postsynaptic density proteome of the hippocampus from cognitively intact NDAN subjects in comparison to demented AD patients. We identified 15 unique proteins that set NDAN apart from AD, thus supporting the notion that NDAN individuals are distinct from both control subjects and AD patients, and should likely not be considered pre-AD. The subset of proteins identified in our study can be further investigated in order to establish the mechanisms responsible for preservation of cognitive function in NDAN despite the presence of AD pathology. Additional analysis of post-translational modifications would be of interest as it can yield more insights into the protective mechanisms at play in NDAN, which in turn can result in development of novel therapeutic targets.
ACKNOWLEDGMENTS
The authors would like to thank Ms. Wen Ru Zhang for technical assistance.
Research reported in this publication was supported by the Alzheimer’s Art Quilt Initiative (NB), National Institute of Environmental Health Sciences of the National Institutes of Health under award number T32ES007254 (NB, OZ), National Institute On Aging of the National Institutes of Health under award number R01AG042890 (GT) and F31AG057217 (OZ). The content is solely the responsibility of the authors and does not necessarily represent the official views of the National Institutes of Health.
Authors’ disclosures available online (https://www.j-alz.com/manuscript-disclosures/18-0179r2).
SUPPLEMENTARY MATERIAL
[1] The supplementary material is available in the electronic version of this article: 10.3233/JAD-180179.
REFERENCES
[1] | Alzheimer’s Association ((2017) ) 2017 Alzheimer’s disease facts and figures, Alzheimers Dement 13: , 325–373. |
[2] | Assessing Risk for Alzheimer’s Disease, https://www.nia.nih.gov/health/assessing-risk-alzheimers-disease, Last updated May 19, 2017, Accessed on July 06, 2017. |
[3] | Matrone C , Djelloul M , Taglialatela G , Perrone L ((2015) ) Inflammatory risk factors and pathologies promoting Alzheimer’s disease progression: Is RAGE the key?, Histol Histopathol 30: , 125–139. |
[4] | Aluise CD , Robinson RA , Cai J , Pierce WM , Markesbery WR , Butterfield DA ((2011) ) Redox proteomics analysis of brains from subjects with amnestic mild cognitive impairment compared to brains from subjects with preclinical Alzheimer’s disease: Insights into memory loss in MCI, J Alzheimers Dis 23: , 257–269. |
[5] | Picone P , Nuzzo D , Caruana L , Scafidi V , Di Carlo M ((2014) ) Mitochondrial dysfunction: Different routes to Alzheimer’s disease therapy, Oxid Med Cell Longev 2014: , 780179. |
[6] | Maarouf CL , Daugs ID , Kokjohn TA , Walker DG , Hunter JM , Kruchowsky JC , Woltjer R , Kaye J , Castaño EM , Sabbagh MN , Beach TG , Roher AE ((2011) ) Alzheimer’s disease and non-demented high pathology control nonagenarians: Comparing and contrasting the biochemistry of cognitively successful aging. PLoS One 6: , e27291. |
[7] | Aisenbrey C , Borowik T , Byström R , Bokvist M , Lindström F , Misiak H , Sani MA , Gröbner G ((2008) ) How is protein aggregation in amyloidogenic diseases modulated by biological membranes?, Eur Biophys J 37: , 247–255. |
[8] | Aizenstein HJ , Nebes RD , Saxton JA , Price JC , Mathis CA , Tsopelas ND , Ziolko SK , James JA , Snitz BE , Houck PR , Bi W , Cohen AD , Lopresti BJ , DeKosky ST , Halligan EM , Klunk WE ((2008) ) Frequent amyloid deposition without significant cognitive impairment among the elderly, Arch Neurol 65: , 1509–1517. |
[9] | Gómez-Isla T , Hollister R , West H , Mui S , Growdon JH , Petersen RC , Parisi JE , Hyman BT ((1997) ) Neuronal loss correlates with but exceeds neurofibrillary tangles in Alzheimer’s disease, Ann Neurol 41: , 17–24. |
[10] | Karran E , Mercken M , De Strooper B ((2011) ) The amyloid cascade hypothesis for Alzheimer’s disease: An appraisal for the development of therapeutics, Nat Rev Drug Discov 10: , 698–712. |
[11] | Guerrero-Muñoz MJ , Gerson J , Castillo-Carranza DL ((2015) ) Tau oligomers: The toxic player at synapses in Alzheimer’s disease, Front Cell Neurosci 9: , 464. |
[12] | Lasagna-Reeves CA , Castillo-Carranza DL , Sengupta U , Sarmiento J , Troncoso J , Jackson GR , Kayed R ((2012) ) Identification of oligomers at early stages of tau aggregation in Alzheimer’s disease, FASEB J 26: , 1946–1959. |
[13] | Stains CI , Mondal K , Ghosh I ((2007) ) Molecules that target beta-amyloid, ChemMedChem 2: , 1674–1692. |
[14] | Chabrier MA , Cheng D , Castello NA , Green KN , LaFerla FM ((2014) ) Synergistic effects of amyloid-beta and wild-type human tau on dendritic spine loss in a floxed double transgenic model of Alzheimer’s disease, Neurobiol Dis 64: , 107–117. |
[15] | Fá M , Puzzo D , Piacentini R , Staniszewski A , Zhang H , Baltrons MA , Li Puma DD , Chatterjee I , Li J , Saeed F , Berman HL , Ripoli C , Gulisano W , Gonzalez J , Tian H , Costa JA , Lopez P , Davidowitz E , Yu WH , Haroutunian V , Brown LM , Palmeri A , Sigurdsson EM , Duff KE , Teich AF , Honig LS , Sierks M , Moe JG , D’Adamio L , Grassi C , Kanaan NM , Fraser PE , Arancio O ((2016) ) Extracellular tau oligomers produce an immediate impairment of LTP and memory, Sci Rep 6: , 19393. |
[16] | Koffie RM , Meyer-Luehmann M , Hashimoto T , Adams KW , Mielke ML , Garcia-Alloza M , Micheva KD , Smith SJ , Kim ML , Lee VM , Hyman BT , Spires-Jones TL ((2009) ) Oligomeric amyloid beta associates with postsynaptic densities and correlates with excitatory synapse loss near senile plaques, Proc Natl Acad Sci U S A 106: , 4012–4017. |
[17] | Lacor PN , Buniel MC , Chang L , Fernandez SJ , Gong Y , Viola KL , Lambert MP , Velasco PT , Bigio EH , Finch CE , Krafft GA , Klein WL ((2004) ) Synaptic targeting by Alzheimer’s-related amyloid beta oligomers, J Neurosci 24: , 10191–10200. |
[18] | Lasagna-Reeves CA , Castillo-Carranza DL , Sengupta U , Clos AL , Jackson GR , Kayed R ((2011) ) Tau oligomers impair memory and induce synaptic and mitochondrial dysfunction in wild-type mice, Mol Neurodegener 6: , 39. |
[19] | Reese LC , Zhang W , Dineley KT , Kayed R , Taglialatela G ((2008) ) Selective induction of calcineurin activity and signaling by oligomeric amyloid beta, Aging Cell 7: , 824–835. |
[20] | Vandenberghe R ((2014) ) The relationship between amyloid deposition, neurodegeneration, and cognitive decline in dementia, Curr Neurol Neurosci Rep 14: , 498. |
[21] | Yaari R , Corey-Bloom J ((2007) ) Alzheimer’s disease, Semin Neurol 27: , 32–41. |
[22] | Sperling RA , Aisen PS , Beckett LA , Bennett DA , Craft S , Fagan AM , Iwatsubo T , Jack CR , Kaye J , Montine TJ , Park DC , Reiman EM , Rowe CC , Siemers E , Stern Y , Yaffe K , Carrillo MC , Thies B , Morrison-Bogorad M , Wagster MV , Phelps CH ((2011) ) Toward defining the preclinical stages of Alzheimer’s disease: Recommendations from the National Institute on Aging-Alzheimer’s Association workgroups on diagnostic guidelines for Alzheimer’s disease, Alzheimers Dement 7: , 280–292. |
[23] | Zolochevska O , Taglialatela G ((2016) ) Non-demented individuals with Alzheimer’s disease neuropathology: Resistance to cognitive decline may reveal new treatment strategies, Curr Pharm Des 22: , 4063–4068. |
[24] | Bjorklund NL , Reese LC , Sadagoparamanujam VM , Ghirardi V , Woltjer RL , Taglialatela G ((2012) ) Absence of amyloid β oligomers at the postsynapse and regulated synaptic Zn2+ in cognitively intact aged individuals with Alzheimer’s disease neuropathology, Mol Neurodegener 7: , 23. |
[25] | Erten-Lyons D , Woltjer RL , Dodge H , Nixon R , Vorobik R , Calvert JF , Leahy M , Montine T , Kaye J ((2009) ) Factors associated with resistance to dementia despite high Alzheimer disease pathology, Neurology 72: , 354–360. |
[26] | Iacono D , O’Brien R , Resnick SM , Zonderman AB , Pletnikova O , Rudow G , An Y , West MJ , Crain B , Troncoso JC ((2008) ) Neuronal hypertrophy in asymptomatic Alzheimer disease, J Neuropathol Exp Neurol 67: , 578–589. |
[27] | Kramer PL , Xu H , Woltjer RL , Westaway SK , Clark D , Erten-Lyons D , Kaye JA , Welsh-Bohmer KA , Troncoso JC , Markesbery WR , Petersen RC , Turner RS , Kukull WA , Bennett DA , Galasko D , Morris JC , Ott J ((2011) ) Alzheimer disease pathology in cognitively healthy elderly: A genome-wide study, Neurobiol Aging 32: , 2113–2122. |
[28] | Liang WS , Dunckley T , Beach TG , Grover A , Mastroeni D , Ramsey K , Caselli RJ , Kukull WA , McKeel D , Morris JC , Hulette CM , Schmechel D , Reiman EM , Rogers J , Stephan DA ((2010) ) Neuronal gene expression in non-demented individuals with intermediate Alzheimer’s Disease neuropathology, Neurobiol Aging 31: , 549–566. |
[29] | Price JL , McKeel DW , Buckles VD , Roe CM , Xiong C , Grundman M , Hansen LA , Petersen RC , Parisi JE , Dickson DW , Smith CD , Davis DG , Schmitt FA , Markesbery WR , Kaye J , Kurlan R , Hulette C , Kurland BF , Higdon R , Kukull W , Morris JC ((2009) ) Neuropathology of nondemented aging: Presumptive evidence for preclinical Alzheimer disease, Neurobiol Aging 30: , 1026–1036. |
[30] | Riudavets MA , Iacono D , Resnick SM , O’Brien R , Zonderman AB , Martin LJ , Rudow G , Pletnikova O , Troncoso JC ((2007) ) Resistance to Alzheimer’s pathology is associated with nuclear hypertrophy in neurons, Neurobiol Aging 28: , 1484–1492. |
[31] | Dineley KT , Kayed R , Neugebauer V , Fu Y , Zhang W , Reese LC , Taglialatela G ((2010) ) Amyloid-beta oligomers impair fear conditioned memory in a calcineurin-dependent fashion in mice, J Neurosci Res 88: , 2923–2932. |
[32] | Reese LC , Laezza F , Woltjer R , Taglialatela G ((2011) ) Dysregulated phosphorylation of Ca(2+) /calmodulin-dependent protein kinase II-α in the hippocampus of subjects with mild cognitive impairment and Alzheimer’s disease, J Neurochem 119: , 791–804. |
[33] | Reese LC , Taglialatela G ((2011) ) A role for calcineurin in Alzheimer’s disease, Curr Neuropharmacol 9: , 685–692. |
[34] | Folstein MF , Folstein SE , McHugh PR ((1975) ) “Mini-mental state”. A practical method for grading the cognitive state of patients for the clinician, J Psychiatr Res 12: , 189–198. |
[35] | Braak H , Braak E ((1991) ) Neuropathological stageing of Alzheimer-related changes, Acta Neuropathol 82: , 239–259. |
[36] | Bjorklund NL , Sadagoparamanujam VM , Taglialatela G ((2012) ) Selective, quantitative measurement of releasable synaptic zinc in human autopsy hippocampal brain tissue from Alzheimer’s disease patients, J Neurosci Methods 203: , 146–151. |
[37] | Philipps V , Amieva H , Andrieu S , Dufouil C , Berr C , Dartigues JF , Jacqmin-Gadda H , Proust-Lima C ((2014) ) Normalized Mini-Mental State Examination for assessing cognitive change in population-based brain aging studies, Neuroepidemiology 43: , 15–25. |
[38] | Franklin W , Taglialatela G ((2016) ) A method to determine insulin responsiveness in synaptosomes isolated from frozen brain tissue, J Neurosci Methods 261: , 128–134. |
[39] | Comerota MM , Krishnan B , Taglialatela G ((2017) ) Near infrared light decreases synaptic vulnerability to amyloid beta oligomers, Sci Rep 7: , 15012. |
[40] | Wiktorowicz JE , Stafford S , Rea H , Urvil P , Soman K , Kurosky A , Perez-Polo JR , Savidge TC ((2011) ) Quantification of cysteinyl S-nitrosylation by fluorescence in unbiased proteomic studies, Biochemistry 50: , 5601–5614. |
[41] | Wiktorowicz JE , Stafford SJ , Garg NJ ((2017) ) Protein cysteinyl-S-nitrosylation: Analysis and quantification, Methods Enzym 586: , 1–14. |
[42] | Pretzer E , Wiktorowicz JE ((2008) ) Saturation fluorescence labeling of proteins for proteomic analyses, Anal Biochem 374: , 250–262. |
[43] | Straub C , Pazdrak K , Young TW , Stafford SJ , Wu Z , Wiktorowicz JE , Haag AM , English RD , Soman KV , Kurosky A ((2009) ) Toward the proteome of the human peripheral blood eosinophil, Proteomics Clin Appl 3: , 1151–1173. |
[44] | Benjamini Y , Hochberg Y ((1995) ) Controlling the False Discovery Rate: A practical and powerful approach to multiple testing, J R Stat Soc Ser B 57: , 289–300. |
[45] | Allen M , Kachadoorian M , Quicksall Z , Zou F , Chai HS , Younkin C , Crook JE , Pankratz VS , Carrasquillo MM , Krishnan S , Nguyen T , Ma L , Malphrus K , Lincoln S , Bisceglio G , Kolbert CP , Jen J , Mukherjee S , Kauwe JK , Crane PK , Haines JL , Mayeux R , Pericak-Vance MA , Farrer LA , Schellenberg GD , Parisi JE , Petersen RC , Graff-Radford NR , Dickson DW , Younkin SG , Ertekin-Taner N ((2014) ) Association of MAPT haplotypes with Alzheimer’s disease risk and MAPT brain gene expression levels, Alzheimers Res Ther 6: , 39. |
[46] | Singhrao SK , Thomas P , Wood JD , MacMillan JC , Neal JW , Harper PS , Jones AL ((1998) ) Huntingtin protein colocalizes with lesions of neurodegenerative diseases: An investigation in Huntington’s, Alzheimer’s, and Pick’s diseases, Exp Neurol 150: , 213–222. |
[47] | Kelleher RJ , Shen J ((2017) ) Presenilin-1 mutations and Alzheimer’s disease, Proc Natl Acad Sci U S A 114: , 629–631. |
[48] | O’Brien RJ , Wong PC ((2011) ) Amyloid precursor protein processing and Alzheimer’s disease, Annu Rev Neurosci 34: , 185–204. |
[49] | Van Cauwenberghe C , Van Broeckhoven C , Sleegers K ((2016) ) The genetic landscape of Alzheimer disease: Clinical implications and perspectives, Genet Med 18: , 421–430. |
[50] | Chen Z , Zhong C ((2013) ) Decoding Alzheimer’s disease from perturbed cerebral glucose metabolism: Implications for diagnostic and therapeutic strategies, Prog Neurobiol 108: , 21–43. |
[51] | Briley D , Ghirardi V , Woltjer R , Renck A , Zolochevska O , Taglialatela G , Micci MA ((2016) ) Preserved neurogenesis in non-demented individuals with AD neuropathology, Sci Rep 6: , 27812. |
[52] | Huang da W , Sherman BT , Lempicki RA ((2009) ) Systematic and integrative analysis of large gene lists using DAVID bioinformatics resources, Nat Protoc 4: , 44–57. |
[53] | Mi H , Lazareva-Ulitsky B , Loo R , Kejariwal A , Vandergriff J , Rabkin S , Guo N , Muruganujan A , Doremieux O , Campbell MJ , Kitano H , Thomas PD ((2005) ) The PANTHER database of protein families, subfamilies, functions and pathways, Nucleic Acids Res 33: , D284–288. |
[54] | Thomas PD , Campbell MJ , Kejariwal A , Mi H , Karlak B , Daverman R , Diemer K , Muruganujan A , Narechania A ((2003) ) PANTHER: A library of protein families and subfamilies indexed by function, Genome Res 13: , 2129–2141. |
[55] | Gerke V , Moss SE ((2002) ) Annexins: From structure to function, Physiol Rev 82: , 331–371. |
[56] | Bamburg JR , Bernstein BW ((2016) ) Actin dynamics and cofilin-actin rods in alzheimer disease, Cytoskeleton (Hoboken) 73: , 477–497. |
[57] | Rescher U , Gerke V ((2004) ) Annexins–unique membrane binding proteins with diverse functions, J Cell Sci 117: , 2631–2639. |
[58] | Gauthier-Kemper A , Weissmann C , Golovyashkina N , Sebö-Lemke Z , Drewes G , Gerke V , Heinisch JJ , Brandt R ((2011) ) The frontotemporal dementia mutation R406W blocks tau’s interaction with the membrane in an annexin A2-dependent manner, J Cell Biol 192: , 647–661. |
[59] | Ghosh A , Giese KP ((2015) ) Calcium/calmodulin-dependent kinase II and Alzheimer’s disease, Mol Brain 8: , 78. |
[60] | Gu Z , Liu W , Yan Z ((2009) ) beta-Amyloid impairs AMPA receptor trafficking and function by reducing Ca2+/calmodulin-dependent protein kinase II synaptic distribution, J Biol Chem 284: , 10639–10649. |
[61] | Wang YJ , Chen GH , Hu XY , Lu YP , Zhou JN , Liu RY ((2005) ) The expression of calcium/calmodulin-dependent protein kinase II-alpha in the hippocampus of patients with Alzheimer’s disease and its links with AD-related pathology, Brain Res 1031: , 101–108. |
[62] | Lisman J , Schulman H , Cline H ((2002) ) The molecular basis of CaMKII function in synaptic and behavioural memory, Nat Rev Neurosci 3: , 175–190. |
[63] | Kennedy MB ((2000) ) Signal-processing machines at the postsynaptic density, Science 290: , 750–754. |
[64] | Ferrer I , Gómez A , Carmona M , Huesa G , Porta S , Riera-Codina M , Biagioli M , Gustincich S , Aso E ((2011) ) Neuronal hemoglobin is reduced in Alzheimer’s disease, argyrophilic grain disease, Parkinson’s disease, and dementia with Lewy bodies, J Alzheimers Dis 23: , 537–550. |
[65] | Wilson MT , Reeder BJ ((2008) ) Oxygen-binding haem proteins, Exp Physiol 93: , 128–132. |
[66] | Chuang JY , Lee CW , Shih YH , Yang T , Yu L , Kuo YM ((2012) ) Interactions between amyloid-β and hemoglobin: Imlications for amyloid plaque formation in Alzheimer’s disease. PLoS One 7: , e33120. |
[67] | Ryu JK , McLarnon JG ((2009) ) A leaky blood-brain barrier, fibrinogen infiltration and microglial reactivity in inflamed Alzheimer’s disease brain, J Cell Mol Med 13: , 2911–2925. |
[68] | van de Haar HJ , Burgmans S , Jansen JF , van Osch MJ , van Buchem MA , Muller M , Hofman PA , Verhey FR , Backes WH ((2017) ) Blood-brain barrier leakage in patients with early Alzheimer disease, Radiology 282: , 615. |
[69] | Ueno M , Chiba Y , Murakami R , Matsumoto K , Kawauchi M , Fujihara R ((2016) ) Blood-brain barrier and blood-cerebrospinal fluid barrier in normal and pathological conditions, Brain Tumor Pathol 33: , 89–96. |
[70] | Richter F , Meurers BH , Zhu C , Medvedeva VP , Chesselet MF ((2009) ) Neurons express hemoglobin alpha- and beta-chains in rat and human brains, J Comp Neurol 515: , 538–547. |
[71] | Schelshorn DW , Schneider A , Kuschinsky W , Weber D , Krüger C , Dittgen T , Bürgers HF , Sabouri F , Gassler N , Bach A , Maurer MH ((2009) ) Expression of hemoglobin in rodent neurons, J Cereb Blood Flow Metab 29: , 585–595. |
[72] | Shephard F , Greville-Heygate O , Marsh O , Anderson S , Chakrabarti L ((2014) ) A mitochondrial location for haemoglobins–dynamic distribution in ageing and Parkinson’s disease, Mitochondrion 14: , 64–72. |
[73] | Shi Q , Xu H , Kleinman WA , Gibson GE ((2008) ) Novel functions of the alpha-ketoglutarate dehydrogenase complex may mediate diverse oxidant-induced changes in mitochondrial enzymes associated with Alzheimer’s disease, Biochim Biophys Acta 1782: , 229–238. |
[74] | Shi Q , Gibson GE ((2011) ) Up-regulation of the mitochondrial malate dehydrogenase by oxidative stress is mediated by miR-743a, J Neurochem 118: , 440–448. |
[75] | Balasubramanian P , Howell PR , Anderson RM ((2017) ) Aging and caloric restriction research: A biological perspective with translational potential, EBioMedicine 21: , 37–44. |
[76] | Ntsapi C , Loos B ((2016) ) Caloric restriction and the precision-control of autophagy: A strategy for delaying neurodegenerative disease progression, Exp Gerontol 83: , 97–111. |
[77] | Janke C , Bulinski JC ((2011) ) Post-translational regulation of the microtubule cytoskeleton: Mechanisms and functions, Nat Rev Mol Cell Biol 12: , 773–786. |
[78] | Reinikainen KJ , Pitkänen A , Riekkinen PJ ((1989) ) 2’,3’-cyclic nucleotide-3’-phosphodiesterase activity as an index of myelin in the post-mortem brains of patients with Alzheimer’s disease, Neurosci Lett 106: , 229–232. |
[79] | Vlkolinský R , Cairns N , Fountoulakis M , Lubec G ((2001) ) Decreased brain levels of 2’,3’-cyclic nucleotide-3’-phosphodiesterase in Down syndrome and Alzheimer’s disease, Neurobiol Aging 22: , 547–553. |
[80] | Thompson RJ ((1992) ) 2’,3’-cyclic nucleotide-3’-phosphohydrolase and signal transduction in central nervous system myelin, Biochem Soc Trans 20: , 621–626. |
[81] | Lee J , Gravel M , Zhang R , Thibault P , Braun PE ((2005) ) Process outgrowth in oligodendrocytes is mediated by CNP, a novel microtubule assembly myelin protein, J Cell Biol 170: , 661–673. |
[82] | Butterfield DA , Hardas SS , Lange ML ((2010) ) Oxidatively modified glyceraldehyde-3-phosphate dehydrogenase (GAPDH) and Alzheimer’s disease: Many pathways to neurodegeneration, J Alzheimers Dis 20: , 369–393. |
[83] | Schulze H , Schuler A , Stüber D , Döbeli H , Langen H , Huber G ((1993) ) Rat brain glyceraldehyde-3-phosphate dehydrogenase interacts with the recombinant cytoplasmic domain of Alzheimer’s beta-amyloid precursor protein, J Neurochem 60: , 1915–1922. |
[84] | Mazzola JL , Sirover MA ((2001) ) Reduction of glyceraldehyde-3-phosphate dehydrogenase activity in Alzheimer’s disease and in Huntington’s disease fibroblasts, J Neurochem 76: , 442–449. |
[85] | Garcia ML , Lobsiger CS , Shah SB , Deerinck TJ , Crum J , Young D , Ward CM , Crawford TO , Gotow T , Uchiyama Y , Ellisman MH , Calcutt NA , Cleveland DW ((2003) ) NF-M is an essential target for the myelin-directed “outside-in” signaling cascade that mediates radial axonal growth, J Cell Biol 163: , 1011–1020. |
[86] | Elder GA , Friedrich VL , Bosco P , Kang C , Gourov A , Tu PH , Lee VM , Lazzarini RA ((1998) ) Absence of the mid-sized neurofilament subunit decreases axonal calibers, levels of light neurofilament (NF-L), and neurofilament content, J Cell Biol 141: , 727–739. |
[87] | Yuan A , Rao M V , Veeranna , Nixon RA ((2012) ) Neurofilaments at a glance, J Cell Sci 125: , 3257–3263. |
[88] | Kinoshita A , Kinoshita M , Akiyama H , Tomimoto H , Akiguchi I , Kumar S , Noda M , Kimura J ((1998) ) Identification of septins in neurofibrillary tangles in Alzheimer’s disease, Am J Pathol 153: , 1551–1560. |
[89] | Mostowy S , Cossart P ((2012) ) Septins: The fourth component of the cytoskeleton, Nat Rev Mol Cell Biol 13: , 183–194. |
[90] | Kinoshita A , Noda M , Kinoshita M ((2000) ) Differential localization of septins in the mouse brain, J Comp Neurol 428: , 223–239. |
[91] | Groenendyk J , Lynch J , Michalak M ((2004) ) Calreticulin, Ca2+, and calcineurin - signaling from the endoplasmic reticulum, Mol Cells 17: , 383–389. |
[92] | Taguchi J , Fujii A , Fujino Y , Tsujioka Y , Takahashi M , Tsuboi Y , Wada I , Yamada T ((2000) ) Different expression of calreticulin and immunoglobulin binding protein in Alzheimer’s disease brain, Acta Neuropathol 100: , 153–160. |
[93] | Duus K , Hansen PR , Houen G ((2008) ) Interaction of calreticulin with amyloid beta peptide 1-42, Protein Pept Lett 15: , 103–107. |
[94] | Johnson RJ , Xiao G , Shanmugaratnam J , Fine RE ((2001) ) Calreticulin functions as a molecular chaperone for the beta-amyloid precursor protein, Neurobiol Aging 22: , 387–395. |
[95] | Michalak M , Corbett EF , Mesaeli N , Nakamura K , Opas M ((1999) ) Calreticulin: One protein, one gene, many functions, Biochem J 344 Pt 2: , 281–292. |
[96] | Stemmer N , Strekalova E , Djogo N , Plöger F , Loers G , Lutz D , Buck F , Michalak M , Schachner M , Kleene R ((2013) ) Generation of amyloid-β is reduced by the interaction of calreticulin with amyloid precursor protein, presenilin and nicastrin, PLoS One 8: , e61299. |
[97] | Vattemi G , Engel WK , McFerrin J , Askanas V ((2004) ) Endoplasmic reticulum stress and unfolded protein response in inclusion body myositis muscle, Am J Pathol 164: , 1–7. |
[98] | Lynch J , Guo L , Gelebart P , Chilibeck K , Xu J , Molkentin JD , Agellon LB , Michalak M ((2005) ) Calreticulin signals upstream of calcineurin and MEF2C in a critical Ca(2+)-dependent signaling cascade, J Cell Biol 170: , 37–47. |
[99] | Lynch J , Michalak M ((2003) ) Calreticulin is an upstream regulator of calcineurin, Biochem Biophys Res Commun 311: , 1173–1179. |
[100] | Abdul HM , Sama MA , Furman JL , Mathis DM , Beckett TL , Weidner AM , Patel ES , Baig I , Murphy MP , LeVine H , Kraner SD , Norris CM ((2009) ) Cognitive decline in Alzheimer’s disease is associated with selective changes in calcineurin/NFAT signaling, J Neurosci 29: , 12957–12969. |
[101] | Norris CM , Kadish I , Blalock EM , Chen KC , Thibault V , Porter NM , Landfield PW , Kraner SD ((2005) ) Calcineurin triggers reactive/inflammatory processes in astrocytes and is upregulated in aging and Alzheimer’s models, J Neurosci 25: , 4649–4658. |
[102] | Dineley KT , Hogan D , Zhang WR , Taglialatela G ((2007) ) Acute inhibition of calcineurin restores associative learning and memory in Tg2576 APP transgenic mice, Neurobiol Learn Mem 88: , 217–224. |
[103] | Taglialatela G , Hogan D , Zhang WR , Dineley KT ((2009) ) Intermediate- and long-term recognition memory deficits in Tg2576 mice are reversed with acute calcineurin inhibition, Behav Brain Res 200: , 95–99. |
[104] | Taglialatela G , Rastellini C , Cicalese L ((2015) ) Reduced incidence of dementia in solid organ transplant patients treated with calcineurin inhibitors, J Alzheimers Dis 47: , 329–333. |
[105] | Nakamura Y , Takeda M , Yoshimi K , Hattori H , Hariguchi S , Kitajima S , Hashimoto S , Nishimura T ((1994) ) Involvement of clathrin light chains in the pathology of Alzheimer’s disease, Acta Neuropathol 87: , 23–31. |
[106] | Tojima T , Itofusa R , Kamiguchi H ((2010) ) Asymmetric clathrin-mediated endocytosis drives repulsive growth cone guidance, Neuron 66: , 370–377. |
[107] | Kuboyama T , Lee YA , Nishiko H , Tohda C ((2015) ) Inhibition of clathrin-mediated endocytosis prevents amyloid β-induced axonal damage, Neurobiol Aging 36: , 1808–1819. |
[108] | Kuiper JW , Oerlemans FT , Fransen JA , Wieringa B ((2008) ) Creatine kinase B deficient neurons exhibit an increased fraction of motile mitochondria, BMC Neurosci 9: , 73. |
[109] | Schlattner U , Tokarska-Schlattner M , Wallimann T ((2006) ) Mitochondrial creatine kinase in human health and disease, Biochim Biophys Acta 1762: , 164–180. |
[110] | Brady ST , Lasek RJ ((1981) ) Nerve-specific enolase and creatine phosphokinase in axonal transport: Soluble proteins and the axoplasmic matrix, Cell 23: , 515–523. |
[111] | Moreira PI , Carvalho C , Zhu X , Smith MA , Perry G ((2010) ) Mitochondrial dysfunction is a trigger of Alzheimer’s disease pathophysiology, Biochim Biophys Acta 1802: , 2–10. |
[112] | Swerdlow RH , Burns JM , Khan SM ((2010) ) The Alzheimer’s disease mitochondrial cascade hypothesis, J Alzheimers Dis 20 Suppl 2: , S265–79. |
[113] | Gray LR , Tompkins SC , Taylor EB ((2014) ) Regulation of pyruvate metabolism and human disease, Cell Mol Life Sci 71: , 2577–2604. |
[114] | Tiwari V , Patel AB ((2014) ) Pyruvate carboxylase and pentose phosphate fluxes are reduced in AβPP-PS1 mouse model of Alzheimer’s disease: A 13C NMR study, J Alzheimers Dis 41: , 387–399. |
[115] | Nestler EJ , Greengard P ((1982) ) Distribution of protein I and regulation of its state of phosphorylation in the rabbit superior cervical ganglion, J Neurosci 2: , 1011–1023. |
[116] | Qin S , Hu XY , Xu H , Zhou JN ((2004) ) Regional alteration of synapsin I in the hippocampal formation of Alzheimer’s disease patients, Acta Neuropathol 107: , 209–215. |
[117] | Pevsner J , Hsu SC , Scheller RH ((1994) ) n-Sec1: A neural-specific syntaxin-binding protein, Proc Natl Acad Sci U S A 91: , 1445–1449. |
[118] | Misura KM , Scheller RH , Weis WI ((2000) ) Three-dimensional structure of the neuronal-Sec1-syntaxin 1a complex, Nature 404: , 355–362. |
[119] | Donovan LE , Higginbotham L , Dammer EB , Gearing M , Rees HD , Xia Q , Duong DM , Seyfried NT , Lah JJ , Levey AI ((2012) ) Analysis of a membrane-enriched proteome from postmortem human brain tissue in Alzheimer’s disease, Proteomics Clin Appl 6: , 201–211. |
[120] | Liu Y , Fallon L , Lashuel HA , Liu Z , Lansbury PT ((2002) ) The UCH-L1 gene encodes two opposing enzymatic activities that affect alpha-synuclein degradation and Parkinson’s disease susceptibility, Cell 111: , 209–218. |
[121] | Osaka H , Wang YL , Takada K , Takizawa S , Setsuie R , Li H , Sato Y , Nishikawa K , Sun YJ , Sakurai M , Harada T , Hara Y , Kimura I , Chiba S , Namikawa K , Kiyama H , Noda M , Aoki S , Wada K ((2003) ) Ubiquitin carboxy-terminal hydrolase L1 binds to and stabilizes monoubiquitin in neuron, Hum Mol Genet 12: , 1945–1958. |
[122] | Satoh JI , Kuroda Y ((2001) ) Ubiquitin C-terminal hydrolase-L1 (PGP9.5) expression in human neural cell lines following induction of neuronal differentiation and exposure to cytokines, neurotrophic factors or heat stress, Neuropathol Appl Neurobiol 27: , 95–104. |
[123] | Choi J , Levey AI , Weintraub ST , Rees HD , Gearing M , Chin LS , Li L ((2004) ) Oxidative modifications and down-regulation of ubiquitin carboxyl-terminal hydrolase L1 associated with idiopathic Parkinson’s and Alzheimer’s diseases, J Biol Chem 279: , 13256–13264. |
[124] | Lombardino AJ , Li XC , Hertel M , Nottebohm F ((2005) ) Replaceable neurons and neurodegenerative disease share depressed UCHL1 levels, Proc Natl Acad Sci U S A 102: , 8036–8041. |
[125] | Hotulainen P , Hoogenraad CC ((2010) ) Actin in dendritic spines: Connecting dynamics to function, J Cell Biol 189: , 619–629. |
[126] | Pollard TD , Blanchoin L , Mullins RD ((2000) ) Molecular mechanisms controlling actin filament dynamics in nonmuscle cells, Annu Rev Biophys Biomol Struct 29: , 545–576. |
[127] | Thievessen I , Thompson PM , Berlemont S , Plevock KM , Plotnikov S V , Zemljic-Harpf A , Ross RS , Davidson MW , Danuser G , Campbell SL , Waterman CM ((2013) ) Vinculin-actin interaction couples actin retrograde flow to focal adhesions, but is dispensable for focal adhesion growth, J Cell Biol 202: , 163–177. |
[128] | Quinlan MP ((2004) ) Vinculin, VASP, and profilin are coordinately regulated during actin remodeling in epithelial cells, which requires de novo protein synthesis and protein kinase signal transduction pathways, J Cell Physiol 200: , 277–290. |
[129] | Kalló G , Emri M , Varga Z , Ujhelyi B , Tőzsér J , Csutak A , Csősz É ((2016) ) Changes in the chemical barrier composition of tears in Alzheimer’s disease reveal potential tear diagnostic biomarkers. PLoS One 11: , e0158000. |
[130] | Ohtsuka T , Shimizu K , Yamamori B , Kuroda S , Takai Y ((1996) ) Activation of brain B-Raf protein kinase by Rap1B small GTP-binding protein, J Biol Chem 271: , 1258–1261. |
[131] | Schwamborn JC , Püschel AW ((2004) ) The sequential activity of the GTPases Rap1B and Cdc42 determines neuronal polarity, Nat Neurosci 7: , 923–929. |
[132] | Melendez J , Grogg M , Zheng Y ((2011) ) Signaling role of Cdc42 in regulating mammalian physiology, J Biol Chem 286: , 2375–2381. |
[133] | Boulter E , Garcia-Mata R , Guilluy C , Dubash A , Rossi G , Brennwald PJ , Burridge K ((2010) ) Regulation of Rho GTPase crosstalk, degradation and activity by RhoGDI1, Nat Cell Biol 12: , 477–483. |
[134] | Nobes CD , Hall A ((1995) ) Rho, rac, and cdc42 GTPases regulate the assembly of multimolecular focal complexes associated with actin stress fibers, lamellipodia, and filopodia, Cell 81: , 53–62. |
[135] | Tapon N , Hall A ((1997) ) Rho, Rac and Cdc42 GTPases regulate the organization of the actin cytoskeleton, Curr Opin Cell Biol 9: , 86–92. |
[136] | Yan XX , Jeromin A ((2012) ) Spectrin breakdown products (SBDPs) as potential biomarkers for neurodegenerative diseases, Curr Transl Geriatr Exp Gerontol Rep 1: , 85–93. |
[137] | Fernández-Shaw C , Marina A , Cazorla P , Valdivieso F , Vázquez J ((1997) ) Anti-brain spectrin immunoreactivity in Alzheimer’s disease: Degradation of spectrin in an animal model of cholinergic degeneration, J Neuroimmunol 77: , 91–98. |
[138] | Masliah E , Iimoto DS , Saitoh T , Hansen LA , Terry RD ((1990) ) Increased immunoreactivity of brain spectrin in Alzheimer disease: A marker for synapse loss?, Brain Res 531: , 36–44. |
[139] | Wechsler A , Teichberg VI ((1998) ) Brain spectrin binding to the NMDA receptor is regulated by phosphorylation, calcium and calmodulin, EMBO J 17: , 3931–3939. |
[140] | Steiner JP , Walke HT , Bennett V ((1989) ) Calcium/calmodulin inhibits direct binding of spectrin to synaptosomal membranes, J Biol Chem 264: , 2783–2791. |
[141] | Lue LF , Kuo YM , Roher AE , Brachova L , Shen Y , Sue L , Beach T , Kurth JH , Rydel RE , Rogers J ((1999) ) Soluble amyloid beta peptide concentration as a predictor of synaptic change in Alzheimer’s disease, Am J Pathol 155: , 853–862. |
[142] | Scheff SW , Price DA , Ansari MA , Roberts KN , Schmitt FA , Ikonomovic MD , Mufson EJ ((2015) ) Synaptic change in the posterior cingulate gyrus in the progression of Alzheimer’s disease, J Alzheimers Dis 43: , 1073–1090. |
[143] | Scheff SW , Price DA , Schmitt FA , DeKosky ST , Mufson EJ ((2007) ) Synaptic alterations in CA1 in mild Alzheimer disease and mild cognitive impairment, Neurology 68: , 1501–1508. |
[144] | Kelly BL , Vassar R , Ferreira A ((2005) ) Beta-amyloid-induced dynamin 1 depletion in hippocampal neurons. A potential mechanism for early cognitive decline in Alzheimer disease, J Biol Chem 280: , 31746–31753. |
[145] | Guo CH , Senzel A , Li K , Feng ZP ((2010) ) De novo protein synthesis of syntaxin-1 and dynamin-1 in long-term memory formation requires CREB1 gene transcription in Lymnaea stagnalis, Behav Genet 40: , 680–693. |
[146] | Fá M , Staniszewski A , Saeed F , Francis YI , Arancio O ((2014) ) Dynamin 1 is required for memory formation, PLoS One 9: , e91954. |
[147] | Zhu L , Su M , Lucast L , Liu L , Netzer WJ , Gandy SE , Cai D ((2012) ) Dynamin 1 regulates amyloid generation through modulation of BACE-1, PLoS One 7: , e45033. |
[148] | Hol EM , Roelofs RF , Moraal E , Sonnemans MA , Sluijs JA , Proper EA , de Graan PN , Fischer DF , van Leeuwen FW ((2003) ) Neuronal expression of GFAP in patients with Alzheimer pathology and identification of novel GFAP splice forms, Mol Psychiatry 8: , 786–796. |
[149] | Shiozaki A , Tsuji T , Kohno R , Kawamata J , Uemura K , Teraoka H , Shimohama S ((2004) ) Proteome analysis of brain proteins in Alzheimer’s disease: Subproteomics following sequentially extracted protein preparation, J Alzheimers Dis 6: , 257–268. |
[150] | Korolainen MA , Auriola S , Nyman TA , Alafuzoff I , Pirttilä T ((2005) ) Proteomic analysis of glial fibrillary acidic protein in Alzheimer’s disease and aging brain, Neurobiol Dis 20: , 858–870. |
[151] | Richens JL , Spencer HL , Butler M , Cantlay F , Vere KA , Bajaj N , Morgan K , O’Shea P ((2016) ) Rationalising the role of Keratin 9 as a biomarker for Alzheimer’s disease, Sci Rep 6: , 22962. |
[152] | Richens JL , Vere KA , Light RA , Soria D , Garibaldi J , Smith AD , Warden D , Wilcock G , Bajaj N , Morgan K , O’Shea P ((2014) ) Practical detection of a definitive biomarker panel for Alzheimer’s disease; comparisons between matched plasma and cerebrospinal fluid, Int J Mol Epidemiol Genet 5: , 53–70. |
[153] | Vafadar-Isfahani B , Ball G , Coveney C , Lemetre C , Boocock D , Minthon L , Hansson O , Miles AK , Janciauskiene SM , Warden D , Smith AD , Wilcock G , Kalsheker N , Rees R , Matharoo-Ball B , Morgan K ((2012) ) Identification of SPARC-like 1 protein as part of a biomarker panel for Alzheimer’s disease in cerebrospinal fluid, J Alzheimers Dis 28: , 625–636. |
[154] | Neuner SM , Wilmott LA , Hoffmann BR , Mozhui K , Kaczorowski CC ((2017) ) Hippocampal proteomics defines pathways associated with memory decline and resilience in normal aging and Alzheimer’s disease mouse models, Behav Brain Res 322: , 288–298. |
[155] | Jiang S , Wu J , Yang Y , Liu J , Ding Y , Ding M ((2012) ) Proteomic analysis of the cerebrospinal fluid in multiple sclerosis and neuromyelitis optica patients, Mol Med Rep 6: , 1081–1086. |
[156] | Knoops B , Clippe A , Bogard C , Arsalane K , Wattiez R , Hermans C , Duconseille E , Falmagne P , Bernard A ((1999) ) Cloning and characterization of AOEB166, a novel mammalian antioxidant enzyme of the peroxiredoxin family, J Biol Chem 274: , 30451–30458. |
[157] | Silva AR , Santos AC , Farfel JM , Grinberg LT , Ferretti RE , Campos AH , Cunha IW , Begnami MD , Rocha RM , Carraro DM , de Bragança Pereira CA , Jacob-Filho W , Brentani H ((2014) ) Repair of oxidative DNA damage, cell-cycle regulation and neuronal death may influence the clinical manifestation of Alzheimer’s disease. PLoS One 9: , e99897. |
[158] | Davey GP , Bolaños JP ((2013) ) Peroxiredoxin 5 links mitochondrial redox signalling with calcium dynamics: Impact on Parkinson’s disease, J Neurochem 125: , 332–333. |
[159] | Dubuisson M , Vander Stricht D , Clippe A , Etienne F , Nauser T , Kissner R , Koppenol WH , Rees JF , Knoops B ((2004) ) Human peroxiredoxin 5 is a peroxynitrite reductase, FEBS Lett 571: , 161–165. |
[160] | Trujillo M , Clippe A , Manta B , Ferrer-Sueta G , Smeets A , Declercq JP , Knoops B , Radi R ((2007) ) Pre-steady state kinetic characterization of human peroxiredoxin 5: Taking advantage of Trp84 fluorescence increase upon oxidation, Arch Biochem Biophys 467: , 95–106. |

