
Clinical Trials for Disease-Modifying Therapies in Alzheimer’s Disease: A Primer, Lessons Learned, and a Blueprint for the Future
Abstract
Alzheimer’s disease (AD) has no currently approved disease-modifying therapies (DMTs), and treatments to prevent, delay the onset, or slow the progression are urgently needed. A delay of 5 years if available by 2025 would decrease the total number of patients with AD by 50% in 2050. To meet the definition of DMT, an agent must produce an enduring change in the course of AD; clinical trials of DMTs have the goal of demonstrating this effect. AD drug discovery entails target identification followed by high throughput screening and lead optimization of drug-like compounds. Once an optimized agent is available and has been assessed for efficacy and toxicity in animals, it progresses through Phase I testing with healthy volunteers, Phase II learning trials to establish proof-of-mechanism and dose, and Phase III confirmatory trials to demonstrate efficacy and safety in larger populations. Phase III is followed by Food and Drug Administration review and, if appropriate, market access. Trial populations include cognitively normal at-risk participants in prevention trials, mildly impaired participants with biomarker evidence of AD in prodromal AD trials, and subjects with cognitive and functional impairment in AD dementia trials. Biomarkers are critical in trials of DMTs, assisting in participant characterization and diagnosis, target engagement and proof-of-pharmacology, demonstration of disease-modification, and monitoring side effects. Clinical trial designs include randomized, parallel group; delayed start; staggered withdrawal; and adaptive. Lessons learned from completed trials inform future trials and increase the likelihood of success.
INTRODUCTION
Alzheimer’s disease (AD) is a progressive neurodegenerative disease that produces gradual decline in cognition and function [1, 2]. The most common form, late onset AD, becomes symptomatic in late life but biomarker studies show that the amyloid protein considered the major risk factor for the disease begins to accumulate in the brain up to 20 years before symptoms begin [3].
The total number of individuals with AD will double every 20 years [4]. The annual cost of AD currently exceeds $230 billion and the total annual cost will exceed $1 trillion by 2050 if means of preventing, delaying, slowing the progression, or improving the symptoms are not found [5].
There is a high rate of negative clinical trials in AD drug development programs; 99% of drugs tested between 2002 and 2014 showed no drug-placebo difference and only one drug was approved by the US Food and Drug Administration (FDA) during that period [6]. Drugs in the AD pipeline include agents intended to intervene in the basic biology of AD and modify disease progression, symptomatic cognitive enhancers, and drugs to treat neuropsychiatric symptoms [7, 8].
The greatest need in AD drug development is for disease-modifying therapies (DMTs) that will delay or slow the clinical course of AD by intervening in the processes leading to cell death [9]. Approximately two-thirds of the current AD drug development pipeline involves DMTs—either immunotherapies or small molecule agents administered orally [7, 8]. In this paper, we describe the methods for AD clinical trials of DMTs, review past failures to identify lessons for AD drug development, and look ahead to new approaches to improving AD drug development and optimizing success in bringing new treatments to patients with AD or those at high risk for the disorder.
OVERVIEW
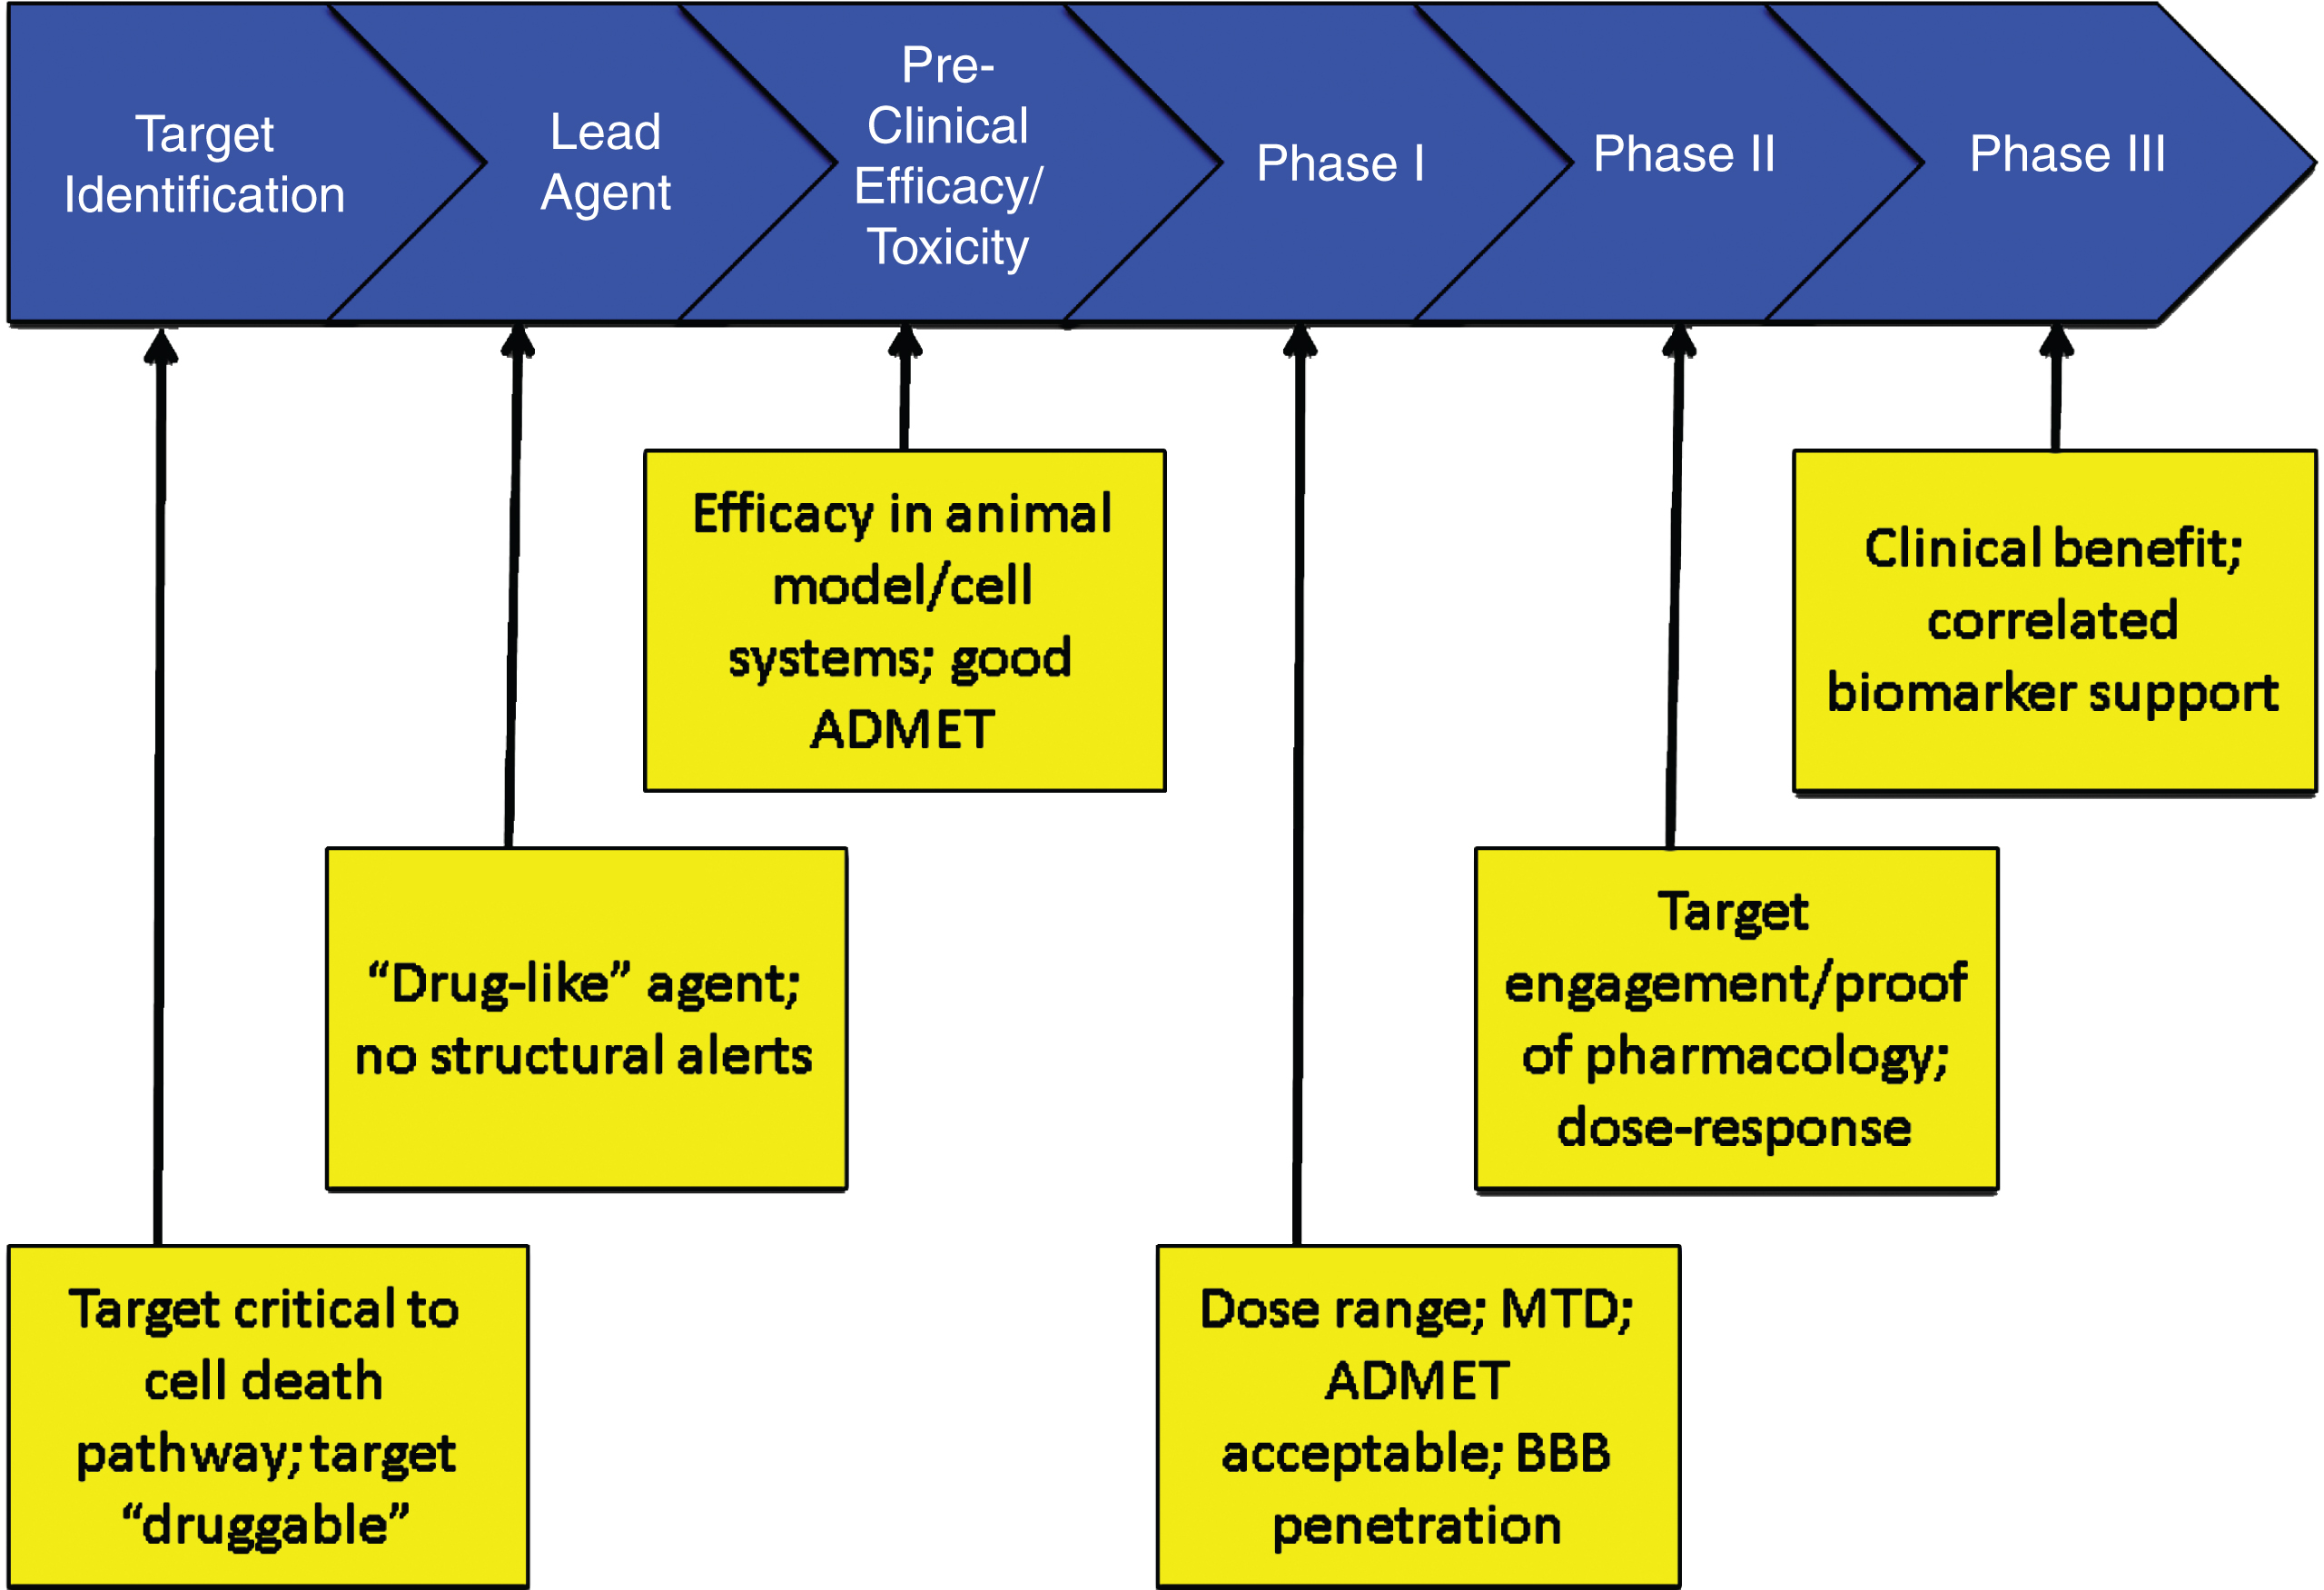
Figure 1 shows the overview of an AD treatment discovery and development program beginning with identification of a target and proceeding through preclinical (sometimes called non-clinical) characterization; to Phase I, Phase II, and Phase III clinical trials; and to regulatory review and patient access through marketing. On average, development for an AD treatment requires 13 years and is expected to cost $5.6 billion U.S. dollars. Preclinical evaluation requires approximately 2 years, Phase I averages 2.8 months, Phase II requires 27.7 months, Phase III is typically 50.9 months, and FDA review requires 18 months [10]. These figures are for AD drugs of all types and likely under-estimate the time taken to develop an AD DMT.
Fig.1
Overview of the drug development process.
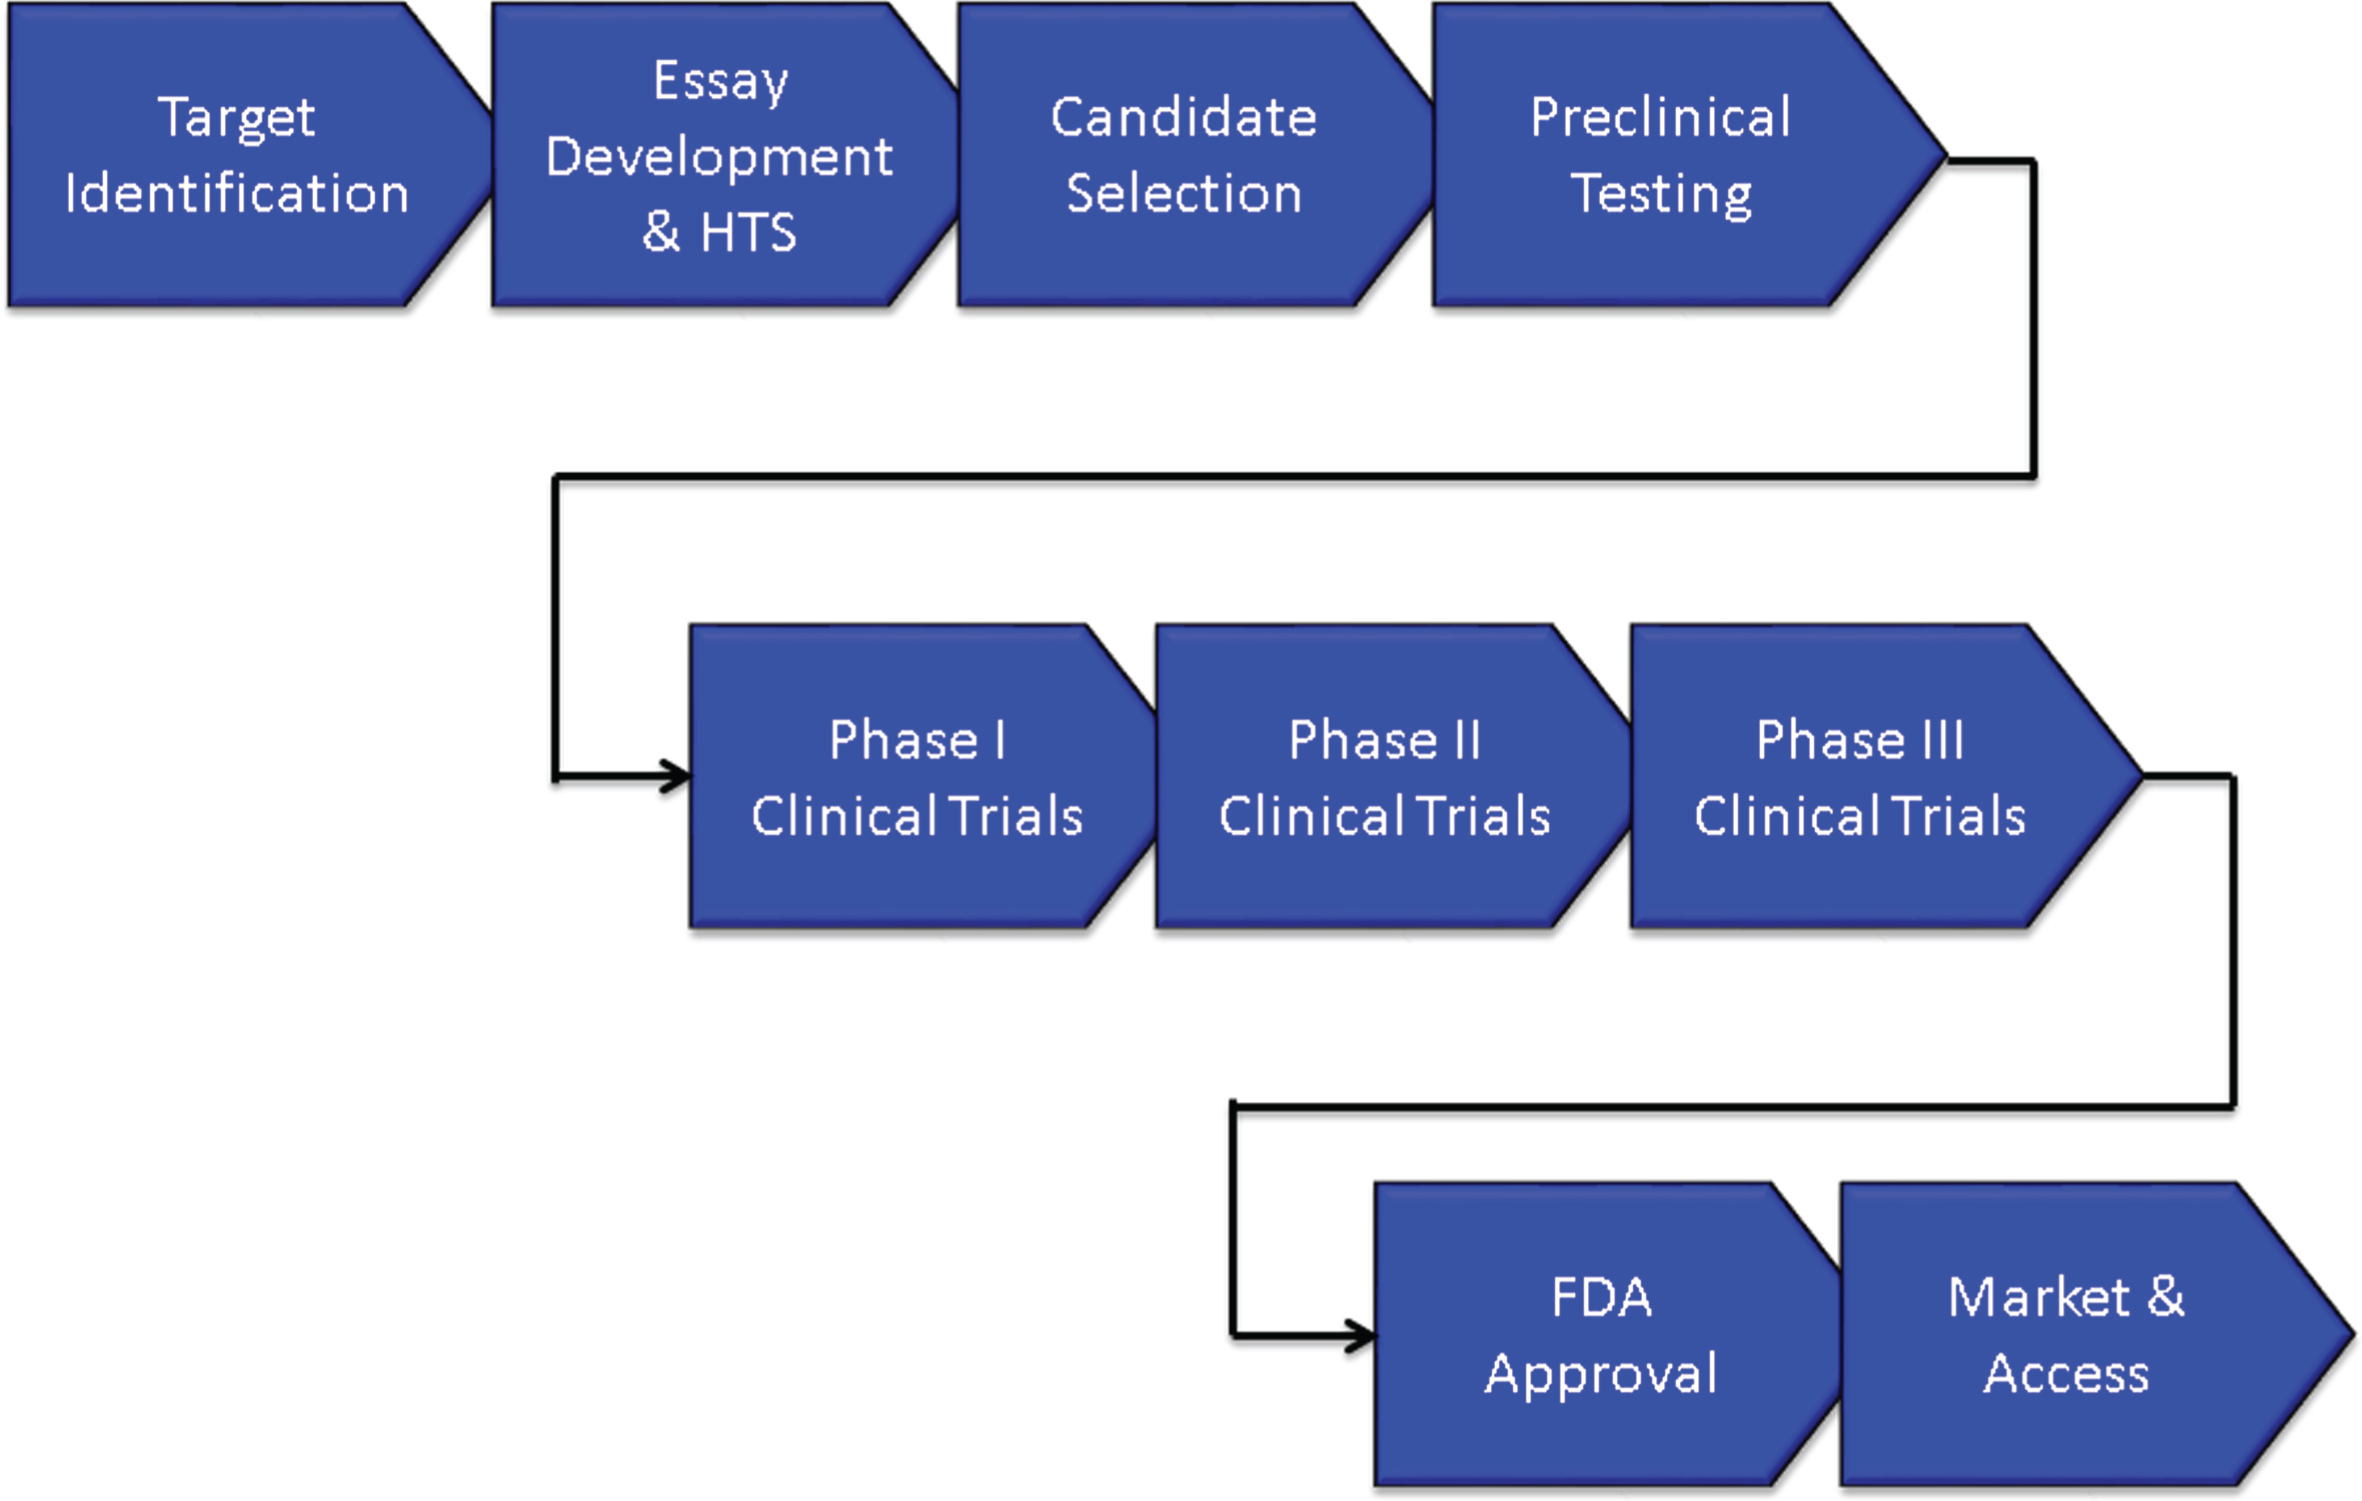
The biography of new agents can be divided into discovery phases extending from the first characterization of the compound to the final optimization of the lead candidate and development extending from preclinical/animal testing to Phase I First-in-Human (FIH) studies through Food and Drug Administration (FDA) review and to Phase IV for those agents undergoing post-approval assessment.
DRUG DISCOVERY
Target identification and drug discovery
A DMT must intervene in the basic biology of AD leading to cell death [9]. Common targets in AD are processes of production, oligomerization, or clearance of the amyloid-β protein (Aβ); the development of neurofibrillary tangles from the tau protein; processes associated with cellular metabolism; neuroinflammation; oxidative injury to membranes; or cell maintenance and regeneration strategies such as stem cells or growth factors. Targets must be “druggable” to provide the basis for a drug discovery and development programs; druggable targets have properties that can be modulated by small molecules (e.g., drugs) or antibodies [11].
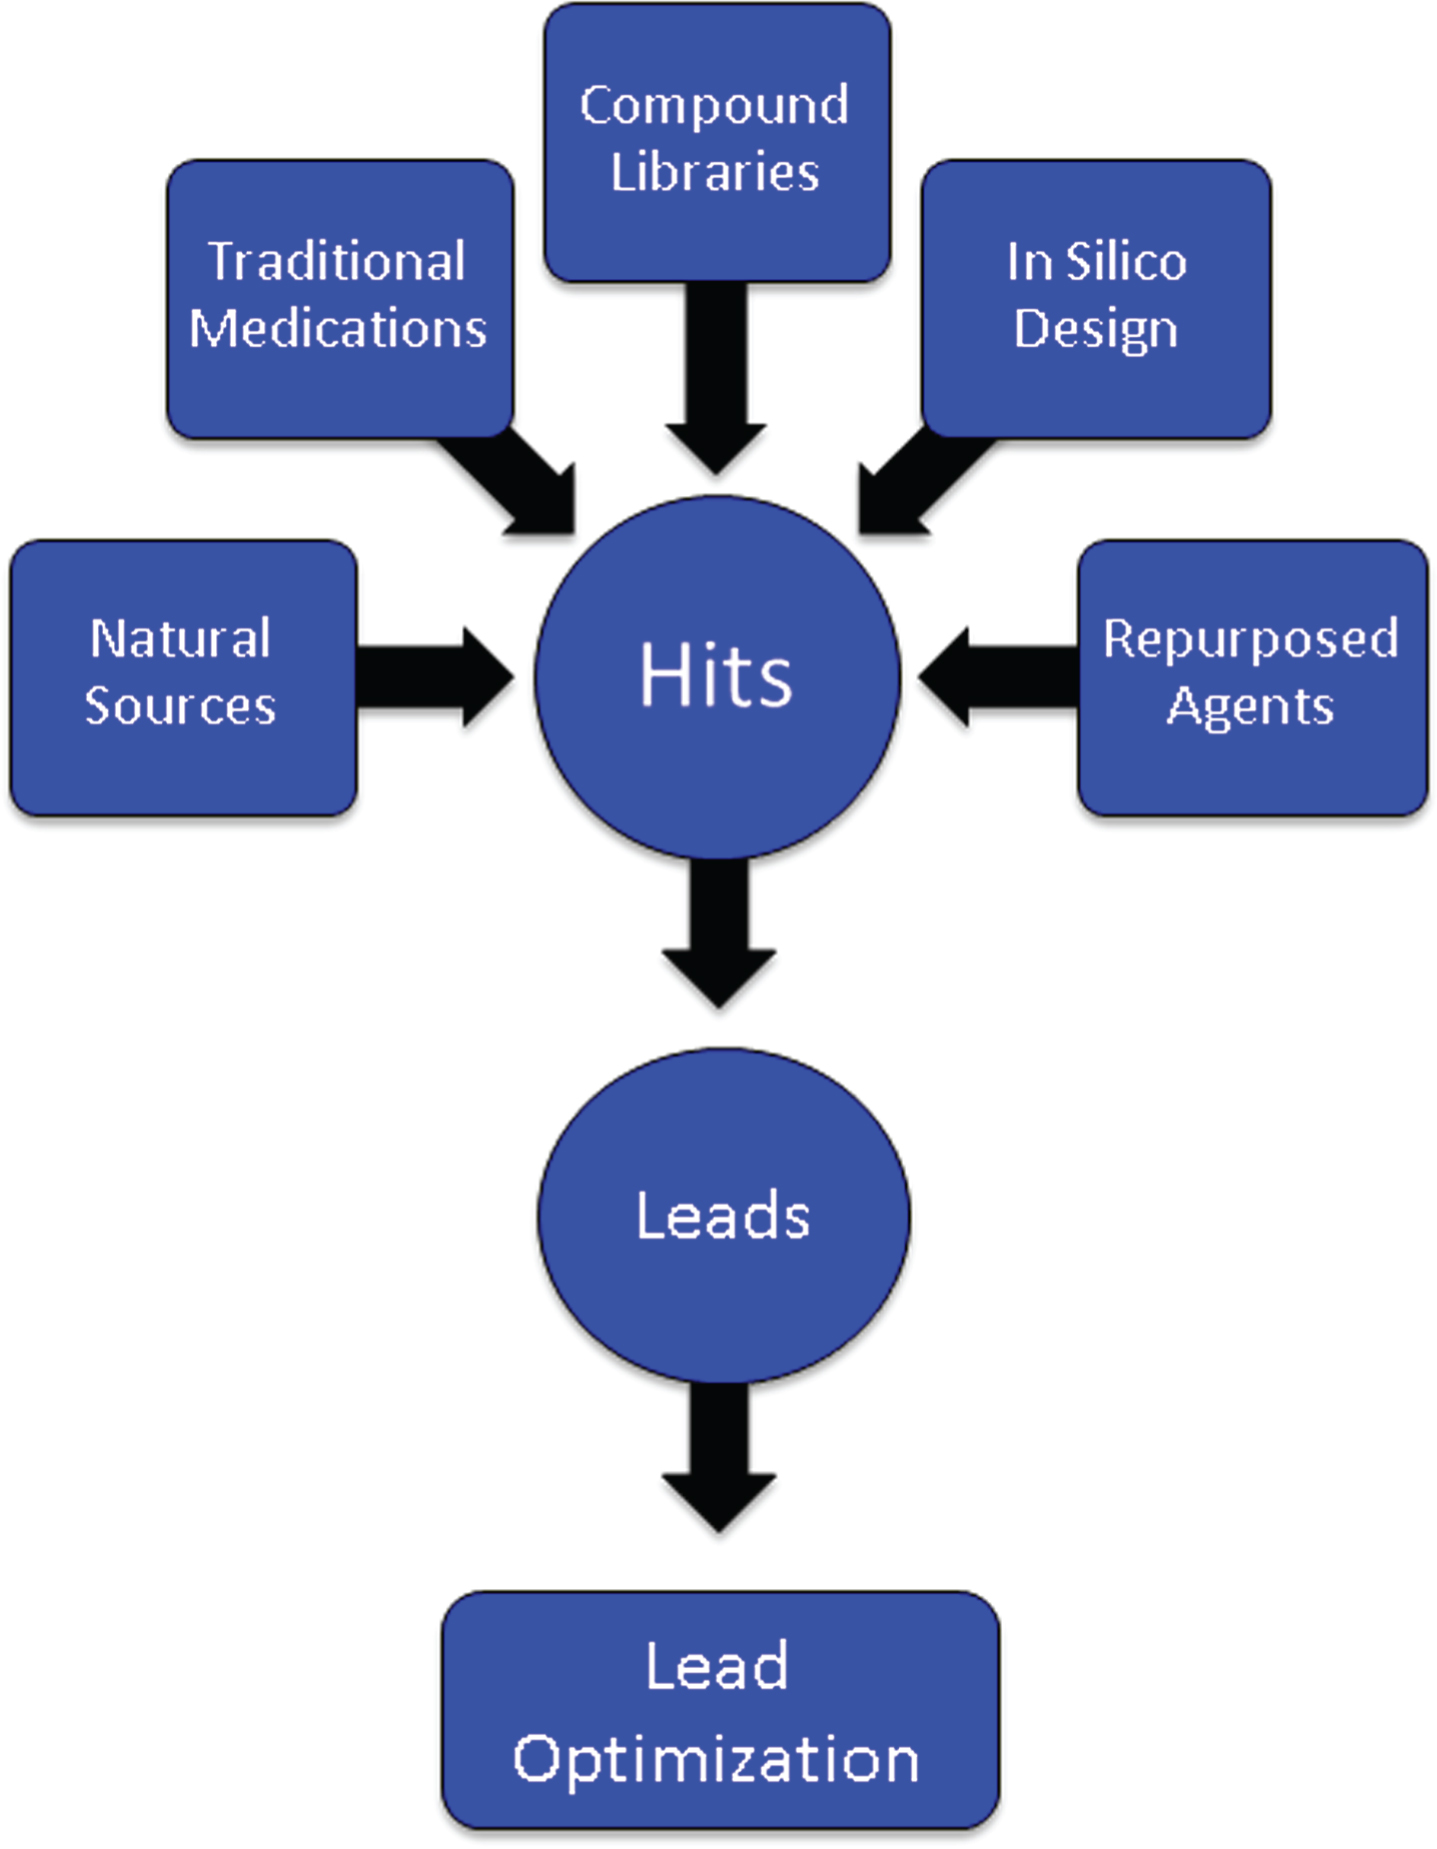
After a target has been identified, an assay is developed for the proposed mechanism of action (MOA) such as inhibition of the β-secretase enzyme necessary for Aβ production, modulation of the γ-secretase enzyme also critical to Aβ generation, inhibition of oligomerization of Aβ into its most toxic form, phosphorylation of the tau protein required for the formation of neurofibrillary tangles, activation of microglia in the inflammatory process, or manipulation of cell survival through growth factors. Large numbers of compounds (“libraries”) are screened for “hits” that have the desired effects in the assay (Fig. 2). Libraries are constructed from pharmacophores with multiple molecular forms, traditional medications (e.g., Traditional Chinese Medicines), natural sources and biodiversity, repurposed agents that may have AD-related effects, and compounds designed by computer where structure-activity relationships can be modeled in silico [12]. Several hundred thousand compounds may be screened to identify a sufficient number of hits to provide a foundation for further development. The hits are reviewed by medicinal chemists for “drug-likeness” including features that predict good absorption and membrane penetration [13, 14]. Agents with promising characteristics are optimized for molecular features that enhance the likelihood of being successful as a drug for human therapy—potency, half-life, predictable toxicity, blood-brain barrier (BBB) penetration, etc. Once a lead compound and several backups are identified, testing in animals can begin [15].
Fig.2
Origin of compounds that are assayed through high throughput screening to produce “hits” that are then subject to medicinal chemistry refinement to produce leads and optimized leads.
An alternative to high-throughput screening with biological assays is high content analysis (HCA), conducted in intact cells using automated microscopy and image analysis. HCA can be used to screen for effects on protein aggregation, synaptic integrity, neuron and synapse number, and apoptosis as well as other cellular processes relevant to AD treatment [16]. HCA may more closely reflect the neurological environment in which drugs must act when administered in the human setting.
Preclinical assessment
Assessment of the lead candidate in animals establishes the pharmacokinetic characteristics, toxicity, and efficacy of the molecule in the test species. Testing involves both short-term and long-term treatment in a wide range of doses to establish the absorption, distribution, metabolism, excretion (ADME), and toxicity of the potential treatment [17]. Testing is required in two species, usually mice and rats. Dogs have a high sensitivity to cardiac effects of drugs and are the usual assay species for cardiac toxicity [18]. Special attention is paid to liver and bone marrow toxicity; laboratory and necropsy studies are performed to thoroughly assess any off-target adverse effects in the animals. In addition, panels of enzymes, ion channels, and other biological mechanisms are used to search for unanticipated off-target effects of the candidate therapy [19]. If no unusual toxicity is identified, the highest drug dose level at which no adverse events (NOAEL) are seen is determined and becomes the basis for dose calculations for the maximum recommended safe starting dose (MRSD) for FIH studies [20].
Development of monoclonal antibodies (mAb) differs from that of the approach to developing small molecules. Monoclonal antibodies are manufactured to interact with a specific epitope of a target such as a portion of the Aβ molecule to limit is oligomerization into a more toxic form, facilitate its removal by brain microglia, or bind with peripheral Aβ to form a “peripheral sink” to remove AD from the brain [21, 22]. Monoclonal antibodies have fewer risks for off-target effects since they are exquisitely targeted to specific molecular sites.
Animal species are also used to explore the efficacy of candidate therapies. Throughout the drug development process, every effort is made to minimize the use of animals and to develop alternatives to animal observations in the assessment of both the toxicity and efficacy of candidate therapies. Although success in animal models has not yet predicted success of a DMT in humans, the failure to see the desired effect in an animal model system of AD biology would constitute a reason not to advance the molecular candidate to human testing [23]. The most commonly used animal model systems are transgenic (tg) mice that have one or more human genes known to cause familial AD in their genome. The amyloid precursor protein/presenilin 1 double tg is a widely used test animal. These genetically modified mice begin to deposit brain amyloid by 6 months of age and by 9 months of age show mild cognitive impairment. Anti-amyloid approaches can be tested in this model. Triple tg and 5x tg as well as many types of gene knock-in (KI) and knock-out (KO) species have been developed. The model animals exhibit specific aspects of the AD pathology observed in humans. Tg animals develop brain amyloidosis with plaques similar to those of humans but typically have little tau formation, inflammation, or cell death characteristic of human AD. They provide a means of assessing the anti-amyloid effect of the agent but not its likely success in the complex multifactorial AD process observed in humans [24].
Human-derived induced pluripotent stem (iPS) cells are increasingly used to screen drugs and to move the early screening process toward a more human biological context with the hope of having greater predictability for human response. The stem cells may be derived from fibroblasts of patients with autosomal dominant AD and the induced stem cells undergo directed transformation to neurons which bear the genetic abnormality and can be the substrate for drug efficacy assessment, or skin cells from unaffected donors can be transformed into iPS cells and then into neurons and an amyloid-related mutation is introduced to create a platform for treatment assessment [25, 26]. The cells are grown in gels allowing 3-dimensional growth and spontaneously form organoid structures with brain-like features. The iPS cell platforms show both amyloid and tau protein accumulation further recapitulating the human disease and creating a more ecologically valid system for drug efficacy assessment [25].
If the candidate agent has acceptable ADME and toxicity characteristics and shows desirable activity in the model used to assess efficacy, it will be advanced to human testing.
CLINICAL TRIALS
Introduction
The development phase—and to a lesser extent the discovery phase—of drug creation is guided by a Target Product Profile (TPP) [27]. The TPP defines the desirable features of a drug and its use including the primary indication, patient population, treatment duration, delivery mode, dosage, regimen, tolerability, risk/side effects, tolerability, and differentiating features in a competitive landscape. A minimally acceptable profile and an ideal profile are identified. Failure to achieve the minimally acceptable profile may lead to discontinuation of the development program. Using the TPP, the indication and proposed package insert are constructed and the development program is designed in reverse to insure that all the features of the TPP are fully defined for the compound in the course of development.
Clinical trials must be reported in a specific format called the Consolidated Standards of Reporting Trials (CONSORT) when they are submitted to journals [28]. The International Committee of Medical Journal Editors has subscribed to these requirements to achieve standardized reporting of clinical trials. Table 1 provides the CONSORT checklist of elements to be included in any report of a clinical trial. Anticipation of the features to be reported allows the checklist to function as a useful guide to planning a clinical trial.
Table 1
CONSORT checklist [28]
| Section / Topic | Checklist Item |
| Introduction | |
| Background and objectives | Scientific background and explanation of rationale; specific objectives or hypotheses |
| Methods | |
| Trial design | Description of trial design (such as parallel, factorial) including allocation ratio; important changes to methods after trial commencement (such as eligibility criteria), with reasons |
| Participants | Eligibility criteria for participants; settings and locations where the data were collected |
| Interventions | The interventions for each group with sufficient details to allow replication, including how and when they were actually administered |
| Outcomes | Completely defined pre-specified primary and secondary outcome measures, including how and when they were accessed; any changes to trial outcomes after the trial commenced, with reasons |
| Sample size | How sample size was determined; When applicable, explanation of any interim analyses and stopping guidelines |
| Random sequence generation | Method used to generate the random allocation sequence; type of randomization; details of any restriction (such as blocking and block size) |
| Allocation concealment mechanism | Mechanism used to implement the random allocation sequence (such as sequentially numbered containers) |
| Randomization implementation | Who generated the random allocation sequence, who enrolled the participants, and who assigned participants to interviews |
| Blinding | If done, who was blinded after assignment to interventions (for example, participants, care providers, those assessing outcomes) and; if relevant, description of the similarity of interventions |
| Statistical methods | Statistical methods used to compare groups for primary and secondary outcomes |
| Results | |
| Participant flow diagram | For each group, the numbers of participants who were randomly assigned, received intended treatment, and were analyzed for the primary outcome; for each group, losses and exclusions after randomization, together with reasons |
| Recruitment | Dates defining the periods of recruitment and follow-up |
| Baseline data | A table showing baseline demographic and clinical characteristics for each group |
| Numbers analyzed | For each group, number of participants (denominator) included in each analysis and whether the analysis was by original assigned group |
| Outcomes and estimation | For each primary and secondary outcome, results for each group, and the estimated effect size and its precision (such as 95% confidence interval); for binary outcomes, presentation of both absolute and relative effect sizes |
| Ancillary analyses | Results of any other analyses performed, including subgroup analyses and adjusted analyses, distinguishing pre-specified from exploratory |
| Harms | All important harms or unintended effects in each group (for specific guidance see CONSORT for harms (28) |
| Discussion | |
| Limitations | Trial limitations, addressing sources of potential bias, imprecision, and, if relevant, multiplicity of analyses |
| Generalizability | Generalizability (external validity, applicability) of the trial findings |
| Interpretation | Interpretation consistent with results, balancing benefits and harms, and considering other relevant evidence |
| Other Information | |
| Registration | Registration number and name of trial registry |
| Funding | Sources of funding and other support (such as supply of drugs); role of funders |
The National Institutes of Health (NIH) has developed a template that can be used to plan a clinical trial including all elements necessary to meet Good Clinical Practice (GCP) guidelines and CONSORT requirements (http://osp.od.nih.gov/sites/default/files/Protocol_Template_05Feb2016_508.pdf). This extensive template serves as a precise guide to clinical trial planning and presentation for Institutional Review Board, funder, and FDA review.
Phase I
Phase I involves the FIH exposure of the drug. In small molecule development programs, the persons participating in the Phase I trial are normal healthy volunteers [29]. If a mAb or vaccine is being developed, the FIH testing is usually done with patients with AD. Immunotherapies can permanently alter the immune system—this is more likely with a vaccine than a mAb—and the unknown consequences of this cannot be risked in young healthy individuals.
Single ascending dose (SAD) studies where cohorts of individuals are exposed to a single dose of progressively higher doses of the agent are followed by multiple ascending dose (MAD) studies where cohorts are treated for 14–28 days with progressively higher doses of the agent [30]. A cohort is typically 8–12 individuals randomized in a 4:1 ratio of active agent to placebo. SAD studies and some portions of MAD studies are conducted in specially designed Phase I in-patient units. Serial blood samples as well as urine and stool samples are collected to determine ADME characteristics in humans. Patient reports, physical examination, electrocardiography, and blood tests are collected to determine the safety and tolerability of each dose.
Ideally, a maximum tolerated dose (MTD) is determined at this stage of drug development. There are several ways of determining the lowest dose to be tested in Phase I; typically a dose representing 1/10 of the NOAEL observed in the most sensitive animal species is the beginning dose and the dose is doubled in each successive cohort [20]. The MTD informs future studies since it represents the upper limit of dosing. Low, medium, and high doses are typically advanced to Phase II. Failure to establish an MTD in Phase I can lead to future challenges in the development process; if later trials are negative, it may be difficult to know whether the agent is ineffective or was not given in a sufficient dose.
Assessing CSF drug levels in Phase I can provide important insights about a candidate compound’s ability to penetrate the human BBB and exert CNS effects. Treatments should not exit Phase I without evidence of BBB penetration and an understanding of plasma/CSF ratios. Consisting of tight junctions joining the endothelial cells of the central nervous system, the BBB creates a physical barrier that severely restricts the size and ionic properties of molecules permitted to cross into the brain [31]. Augmenting the physical barrier is a complex network of enzymes and transport proteins, such as P-glycoprotein (P-gp), breast cancer resistance protein, and multidrug resistance protein that metabolize and expel molecules that are able to pass through the physical barrier. The BBB thus represents a significant obstacle for agents intended to reach targets deep within the brain parenchyma and failure to penetrate the BBB has contributed to failed development programs [32].
The challenges of BBB penetration require confirmation of drug delivery into the brain in early phase testing. Lumbar CSF measures provide an approximation of the brain exposure in humans. Levels of unbound, pharmacologically active drug in CSF can be drawn during continuous intravenous infusion or at fixed time points after systemic delivery [33]. Differences in the human and rodent BBB, particularly the robustness of the P-gp system, leads to differences in human CSF levels and makes extrapolations between human and animal data problematic [34]. Observations made from CSF in the healthy state must later be confirmed in the disease state as differences in cerebral blood flow, activity of efflux transport proteins, and BBB permeability with disease may fundamentally alter drug delivery [35].
Phase II
Drugs that appear safe and have acceptable ADME and safety profiles when tested in normal human volunteers are advanced to Phase II to be tested in the population of interest, AD. Repurposed agents that have been gone through Phase I while being developed for another indication (e.g., hypertension, cancer, Parkinson’s disease, diabetes, etc.) may enter directly into Phase II or occasionally directly into Phase III [36, 37].
Phase II generally encompasses Phase IIa proof-of-concept (POC) trials and Phase IIb dose-finding studies. The goal of Phase II is to gain confidence in the treatment and provide information for Phase III trials. Phase II involves patients with AD dementia or prodromal AD [38]. A conundrum has evolved for Phase II trials of AD DMTs. The decision to advance an agent to Phase II could be based on a Phase IIa study with a biomarker outcome, using the biomarker to decide if there is a sufficient likelihood of clinical success. The challenge with this approach is that there is no AD biomarker that has gained surrogate status and none is known to predict a clinical outcome. Alternately, one can require clinical POC with benefit on a traditional clinical measure such as the AD Assessment Scale – cognitive portion (ADAS-cog) [39] or Clinical Dementia Rating – Sum of Boxes (CDR-sb) [40]. To show clinical benefit typically requires a large long trial equivalent to a Phase III trial [41]. Thus, some development programs move from Phase I directly to Phase III. This often results in a Phase III program that is advancing an agent with limited information regarding safety, tolerability, biomarker effects, or dosing. This strategy may contribute to the high failure rate of AD drug development and the absence of any successful DMTs [6].
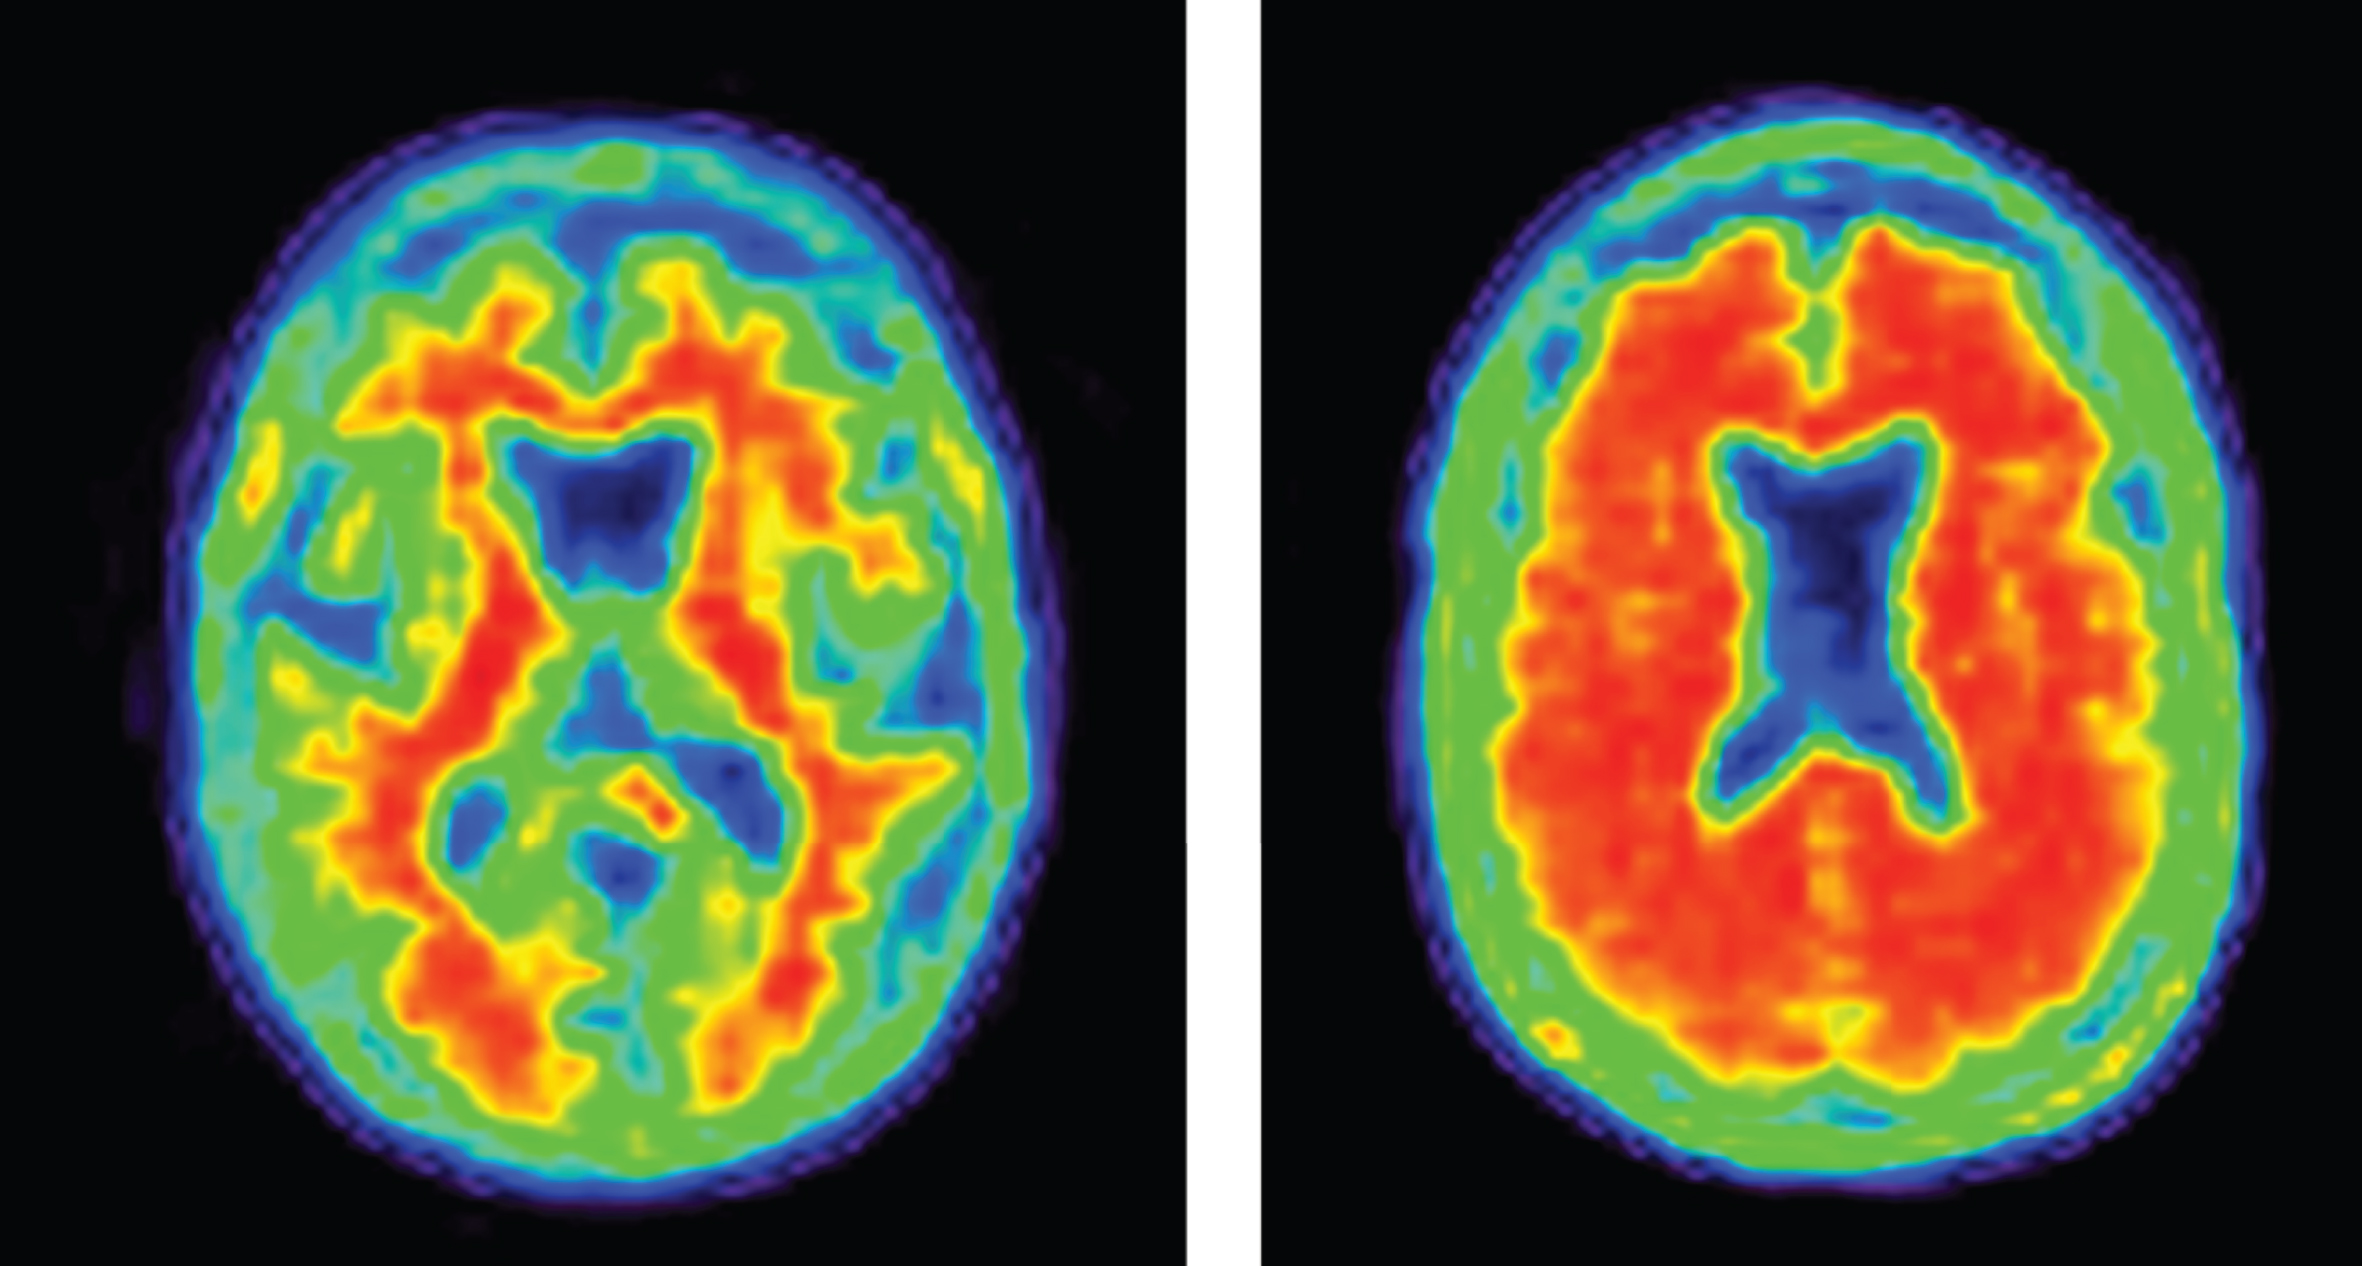
Increasingly, biomarkers are used in Phase II to support decision making for development programs (Fig. 3). Biomarkers are used to confirm the diagnosis of AD. The clinical diagnosis of AD dementia is not confirmed by amyloid or CSF amyloid and tau measures in approximately 25% of patients diagnosed clinically with AD [42], indicating that they do not have the pathobiology of AD. Approximately 50% of mild cognitive impairment patients have abnormal amyloid measures and constitute a prodromal AD population—50% do not have early AD [43]. AD trials must have individuals with AD to draw accurate conclusions about efficacy of AD-directed therapies. Figure 4 shows normal and AD-type amyloid positron emission tomography (PET) used to support the diagnosis of AD.
Fig.3
Roles of biomarkers in Phase II of drug development (BACE inhibition is included as an example of one type of target engagement biomarker; each drug mechanism will have a corresponding target engagement/proof of pharmacology biomarker), CSF, cerebrospinal fluid; AD, Alzheimer’s disease; fMRI, functional magnetic resonance imaging; QEEG, quantitative electroencephalography; FDG PET, fluorodeoxyglucose positron emission tomography; NF-light, neurofilament light chain protein; ARIA, amyloid-related imaging abnormalities.
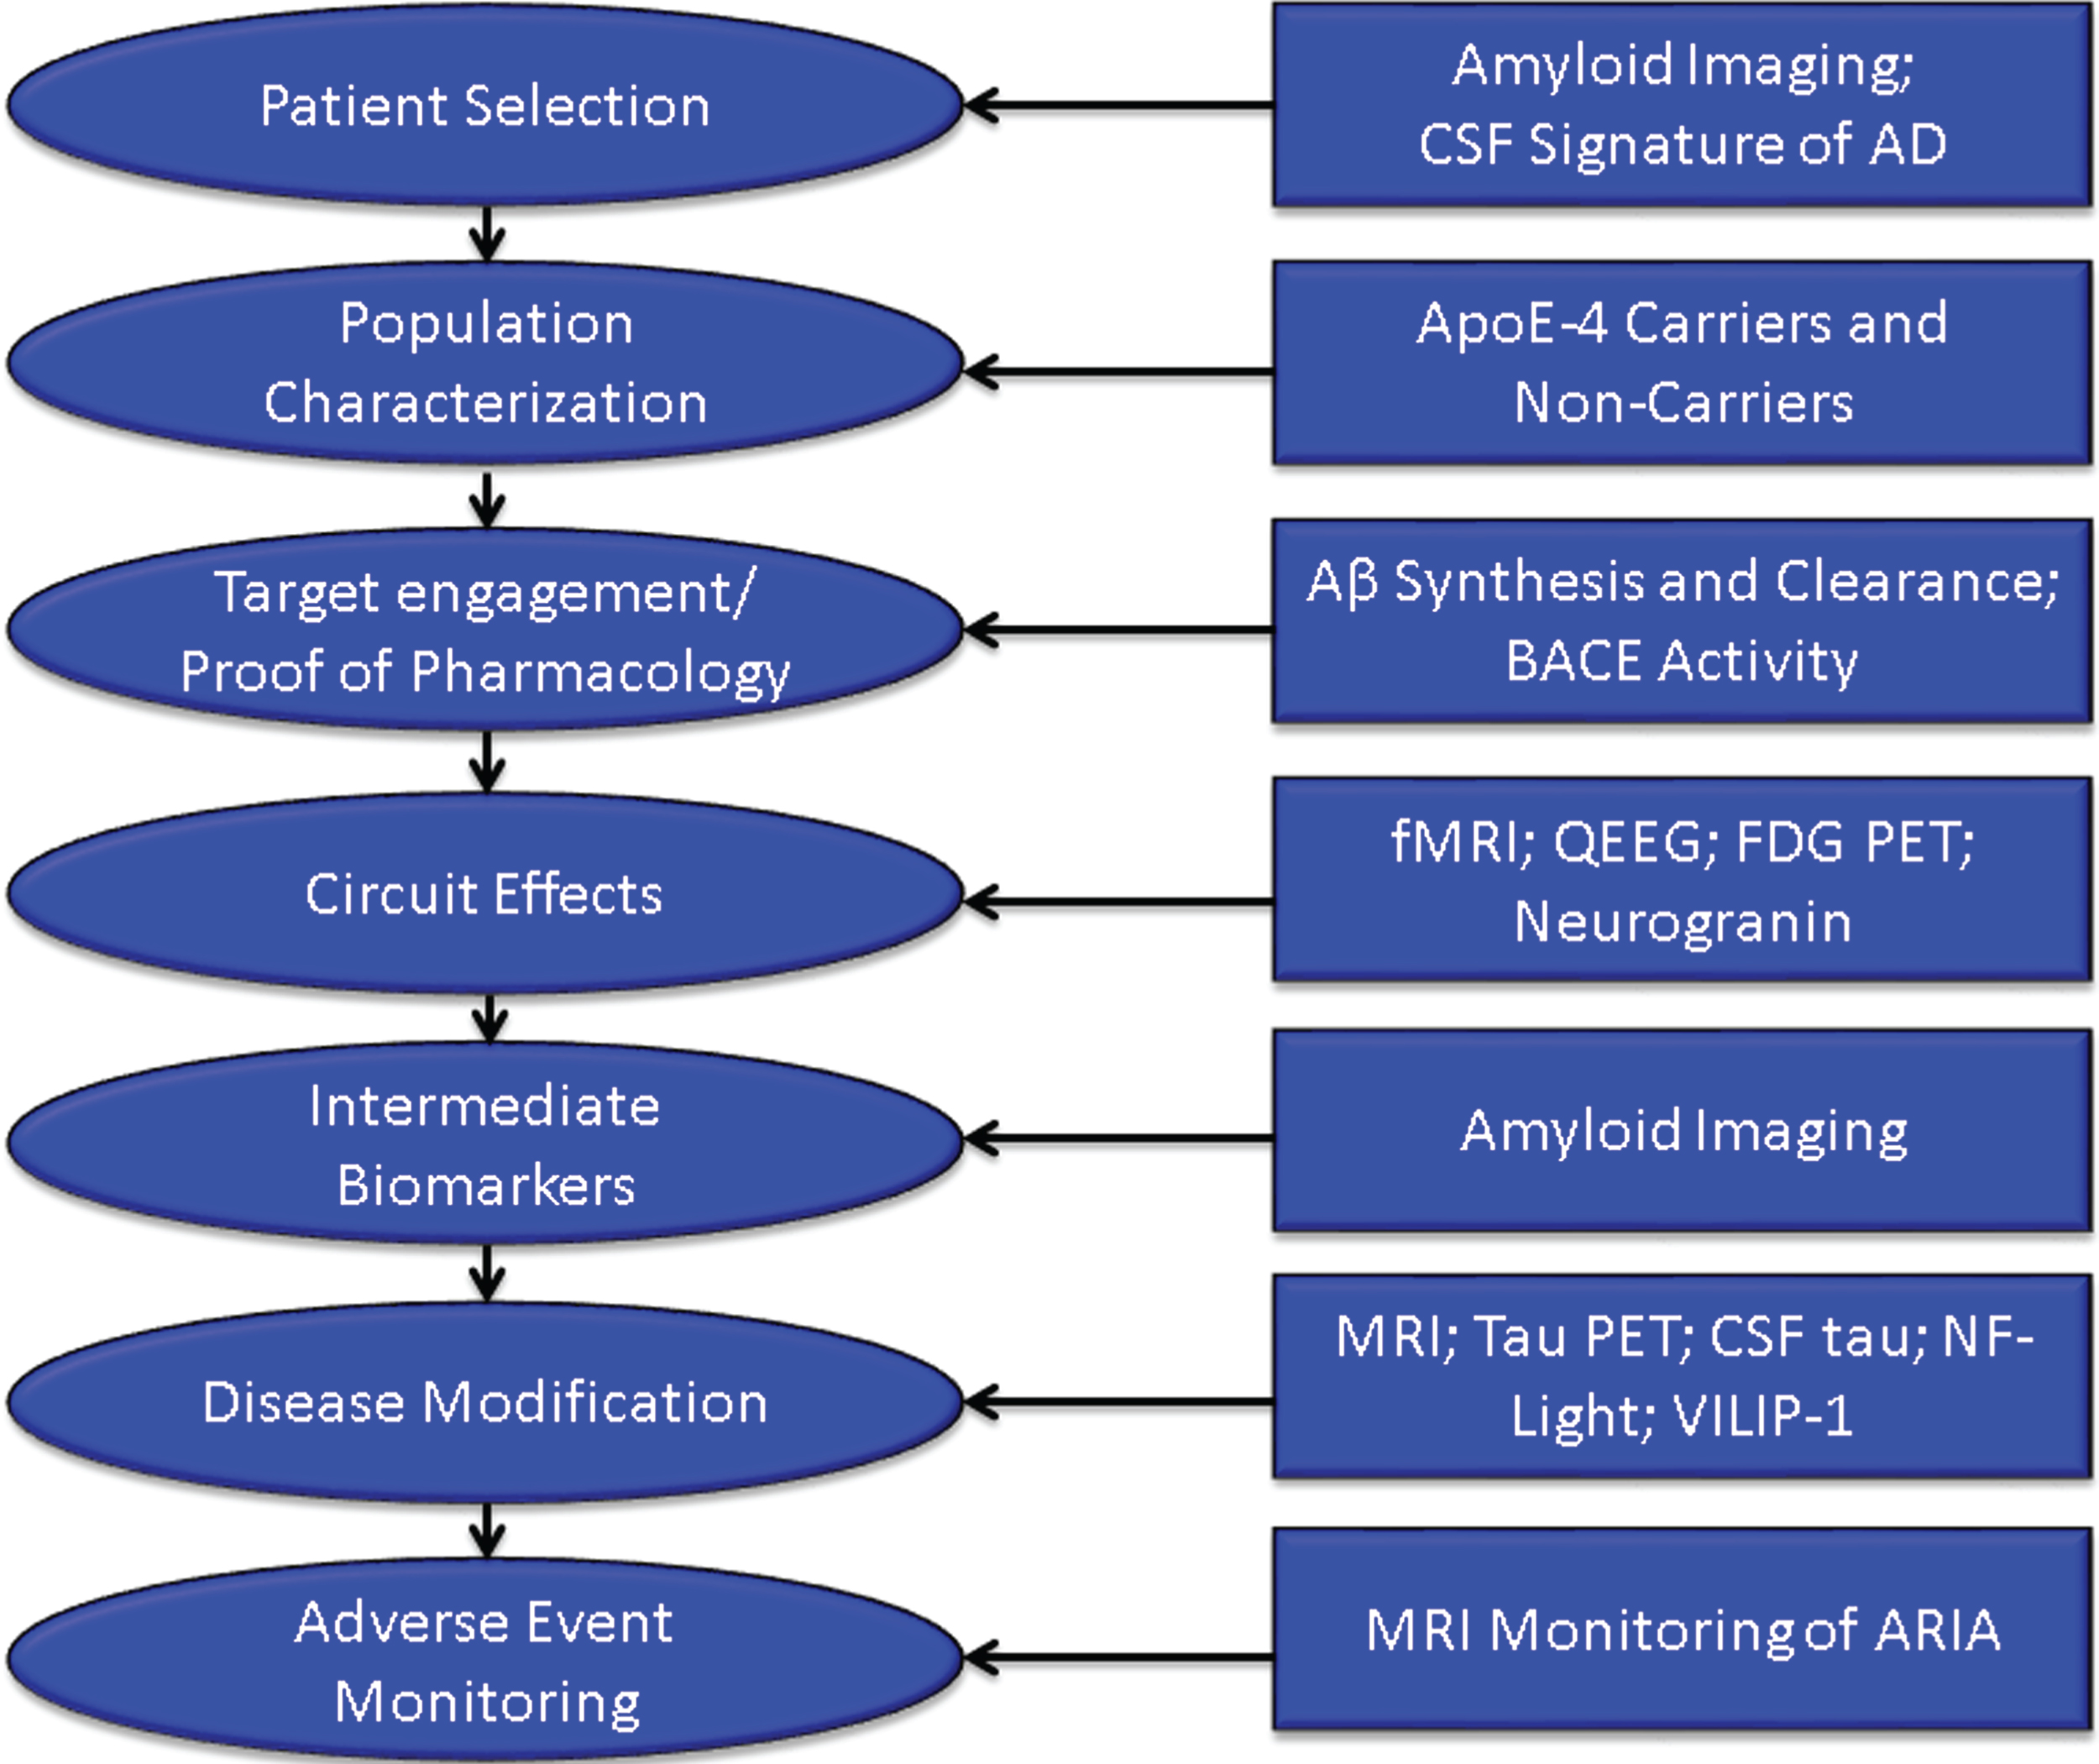
Fig.4
Negative (normal) and positive (abnormal; consistent with AD) amyloid PET images.
Populations in AD trials are typically divided by apolipoprotein E (ApoE) genotype into ApoE4 allele carriers and noncarriers. Allele status may affect efficacy and side effects and often influences dosing in mAb trials [42, 44, 45]. Recruitment may not be stratified by genotype but the statistical analysis plans will contrast carriers and noncarriers for efficacy and toxicity.
Target engagement biomarkers are critical to demonstrating that the drug is having the desired clinical effect on the near-term target. Without target engagement, the disease-modifying properties of the drug cannot be assessed. For example, if a beta-site cleavage enzyme (BACE) inhibitor is not producing BACE inhibition or is not affecting amyloid synthesis, then the hypothesis that BACE inhibition will produce disease-modification cannot be assessed. Amyloid deposition is an intermediate biomarker of drug efficacy. It may not be immediately related to cell death but appears necessary to establish an environment in which cell death occurs. Effects on amyloid deposition can serve as an intermediate biomarker of anti-plaque effects of anti-amyloid drug activity. In the PRIME study of aducanumab, for example, reduced brain amyloid was demonstrated after 6 months of therapy and was more marked after 12 months of treatment [43].
Cognition is mediated by integrated cerebral circuits and preservation of circuit integrity is a precondition for a beneficial cognitive impact of therapy. Circuit function can be assessed by fMRI or quantitative electroencephalography [46, 47]. Fluorodeoxyglucose PET reflects synaptic integrity and is a measure of circuit synaptic function [48]. Neurogranin is a measure of synaptic integrity that may represent a fluid biomarker of circuit preservation. These circuit measures can assess the circuit level impact of therapy and may better predict the cognitive outcome [49].
Biomarkers suggesting that an agent has produced disease modification are those that are closely correlated with processes leading to cell death. A drug-placebo difference in these biomarkers in favor of less degeneration and more neuroprotection by the active agent indicates that the drug is a DMT [9].
Biomarkers currently considered as indicative of disease-modification in AD include volumetric MRI as well as measures of tau protein aggregation (tau PET, CSF tau), neurofilament light chain protein, and VILIP-1 [50–54].
Finally, MRI is used to monitor amyloid-related imaging abnormalities (ARIA) occurring as a side effect in patients treated with some anti-amyloid mAbs [44]. Other biomarkers commonly used to monitor adverse events of medications include liver functions, hematologic measures, and electrocardiography.
At the end of Phase II, the ADME, safety, tolerability, and target engagement of the test agent should be known. Dosing should be narrowed to one or two doses before proceeding to Phase III. Understanding these aspects of the candidate therapy at the end of Phase II builds confidence in the therapeutic approach and makes it more likely that the agent will succeed in Phase III.
Phase III
Phase II and Phase III are often conceived as “learn” and “confirm” trials [55]. The learnings of Phase II are tested in Phase III and, if benefits are confirmed, the agent will be submitted to the FDA for review. Phase III trials for DMTs are 12 to 24 months in duration and typically involve 600–1000 patients per arm of the study (each dose and the placebo comprise 1 arm each). The reasons for failure of drugs to advance from Phase III to regulatory review include lack of efficacy (50%), unacceptable toxicity (14%), and commercial, strategic, and operational issues (31%) [56]. These figures are for all classes of agents (not limited to AD-directed drugs); they emphasize the importance of accruing efficacy data in Phase II. Drugs that have genetic connections to the neurobiology of the disease and that have biomarkers to inform drug development decisions are more likely to advance from one phase to the next than drugs that lack this information [57].
As noted above, biomarkers are used in Phase III to diagnose participants, support disease-modifying activity, and monitor amyloid-related imaging abnormalities in mAb studies.
Phase IV and post-marketing studies
Phase IV studies occur after the drug has been approved by the FDA or other regulatory agency and is available on the market. Phase IV studies may be used to extend treatment to a new indication, for example, the assessment and eventual approval of rivastigmine for the treatment of Parkinson’s disease dementia after its approval for mild-moderate AD dementia [58]. Phase IV trials can also be used to extend an indication within the same disease such as the extension of donepezil and rivastigmine into severe AD after approval for mild-moderate AD [59, 60]. The FDA may also require demonstration of efficacy with Phase IV studies after approval of an agent on the basis of a change in a biomarker that is considered reasonably likely to predict a clinical benefit. This type of conditional approval is a consideration in prevention treatments where trial outcomes will emphasize biomarkers in populations without clinical symptoms.
If there are safety concerns, the FDA may require the sponsor to construct a Risk Evaluation and Management Strategy (REMS) to be monitor the safety of an agent once it is marketed [61]. Figure 5 summarizes the critical data to be accrued at each stage of drug development that should be known before proceeding to the next stage.
Fig.5
Critical data to be accrued in each stage of drug discovery and development (ADMET – absorption, distribution, metabolism, excretion, toxicity; BBB – blood brain barrier; MTD – maximum tolerated dose).
TRIALS OF DISEASE-MODIFYING THERAPIES IN ALZHEIMER’S DISEASE
Defining disease modification
A DMT is defined as an intervention that produces an enduring change in the clinical progression of AD by interfering in the underlying pathophysiological mechanisms of the disease process that lead to neuronal death [9]. DMT efficacy is demonstrated through clinical trial designs and biomarkers. Evidence of disease modification in the drug development process is based on clinical trial designs such as staggered start and delayed withdrawal or with parallel designs incorporating combined clinical outcomes and correlated biomarker evidence of an effect on the underlying pathophysiological processes of the disease. Most development programs rely on biomarkers to provide support for DM rather than using clinical trial design strategies. The biological change associated with disease modification (DM) is neuroprotection, and biomarker support for DM depends on demonstration of neuronal preservation. DM and neuronal preservation cannot be observed directly and must be inferred from biomarker evidence. To support DM, the biomarker must be indicative of a change in the processes leading to the loss of neurons. Biomarkers commonly used in clinical trials of DMT are discussed above (Fig. 3).
DM is not equivalent to “cure” or to prevention of decline; DM refers to a permanent change in disease trajectory that will delay the onset of symptoms or slow progression in symptomatic patients. A delay of 5 years would equate to decreasing the total number of affected individuals by 50%. If the treatment is available by 2025 the annual savings to the US economy by 2050 is projected to be $369 billion [62].
Populations
Phases of AD are recognized; these are not distinct stages but represent a seamless progression from a high risk state in which amyloid is present in the brain in the form of neuritic plaques, to prodromal AD with episodic memory impairment (in the typical presentation of AD) and biomarker evidence of AD, to AD dementia with cognitive and functional impairment characterized as mild, moderate or severe [38] (Fig. 6). Although these phases represent progression along a seamless spectrum of severity, they are artificially divided for purposes of clinical trials. Tools and outcomes appropriate for one phase of disease (e.g., preclinical) are not the same as those one would choose for later phases (e.g., mild-moderate AD). Table 2 provides examples of cognitive and functional measures used as outcome measures for different phases of AD [39, 40, 63–70].
Fig.6
Phases of Alzheimer’s disease (AD) as defined by cognitive, functional, and biomarker observations. Trial goals for each phase are noted.
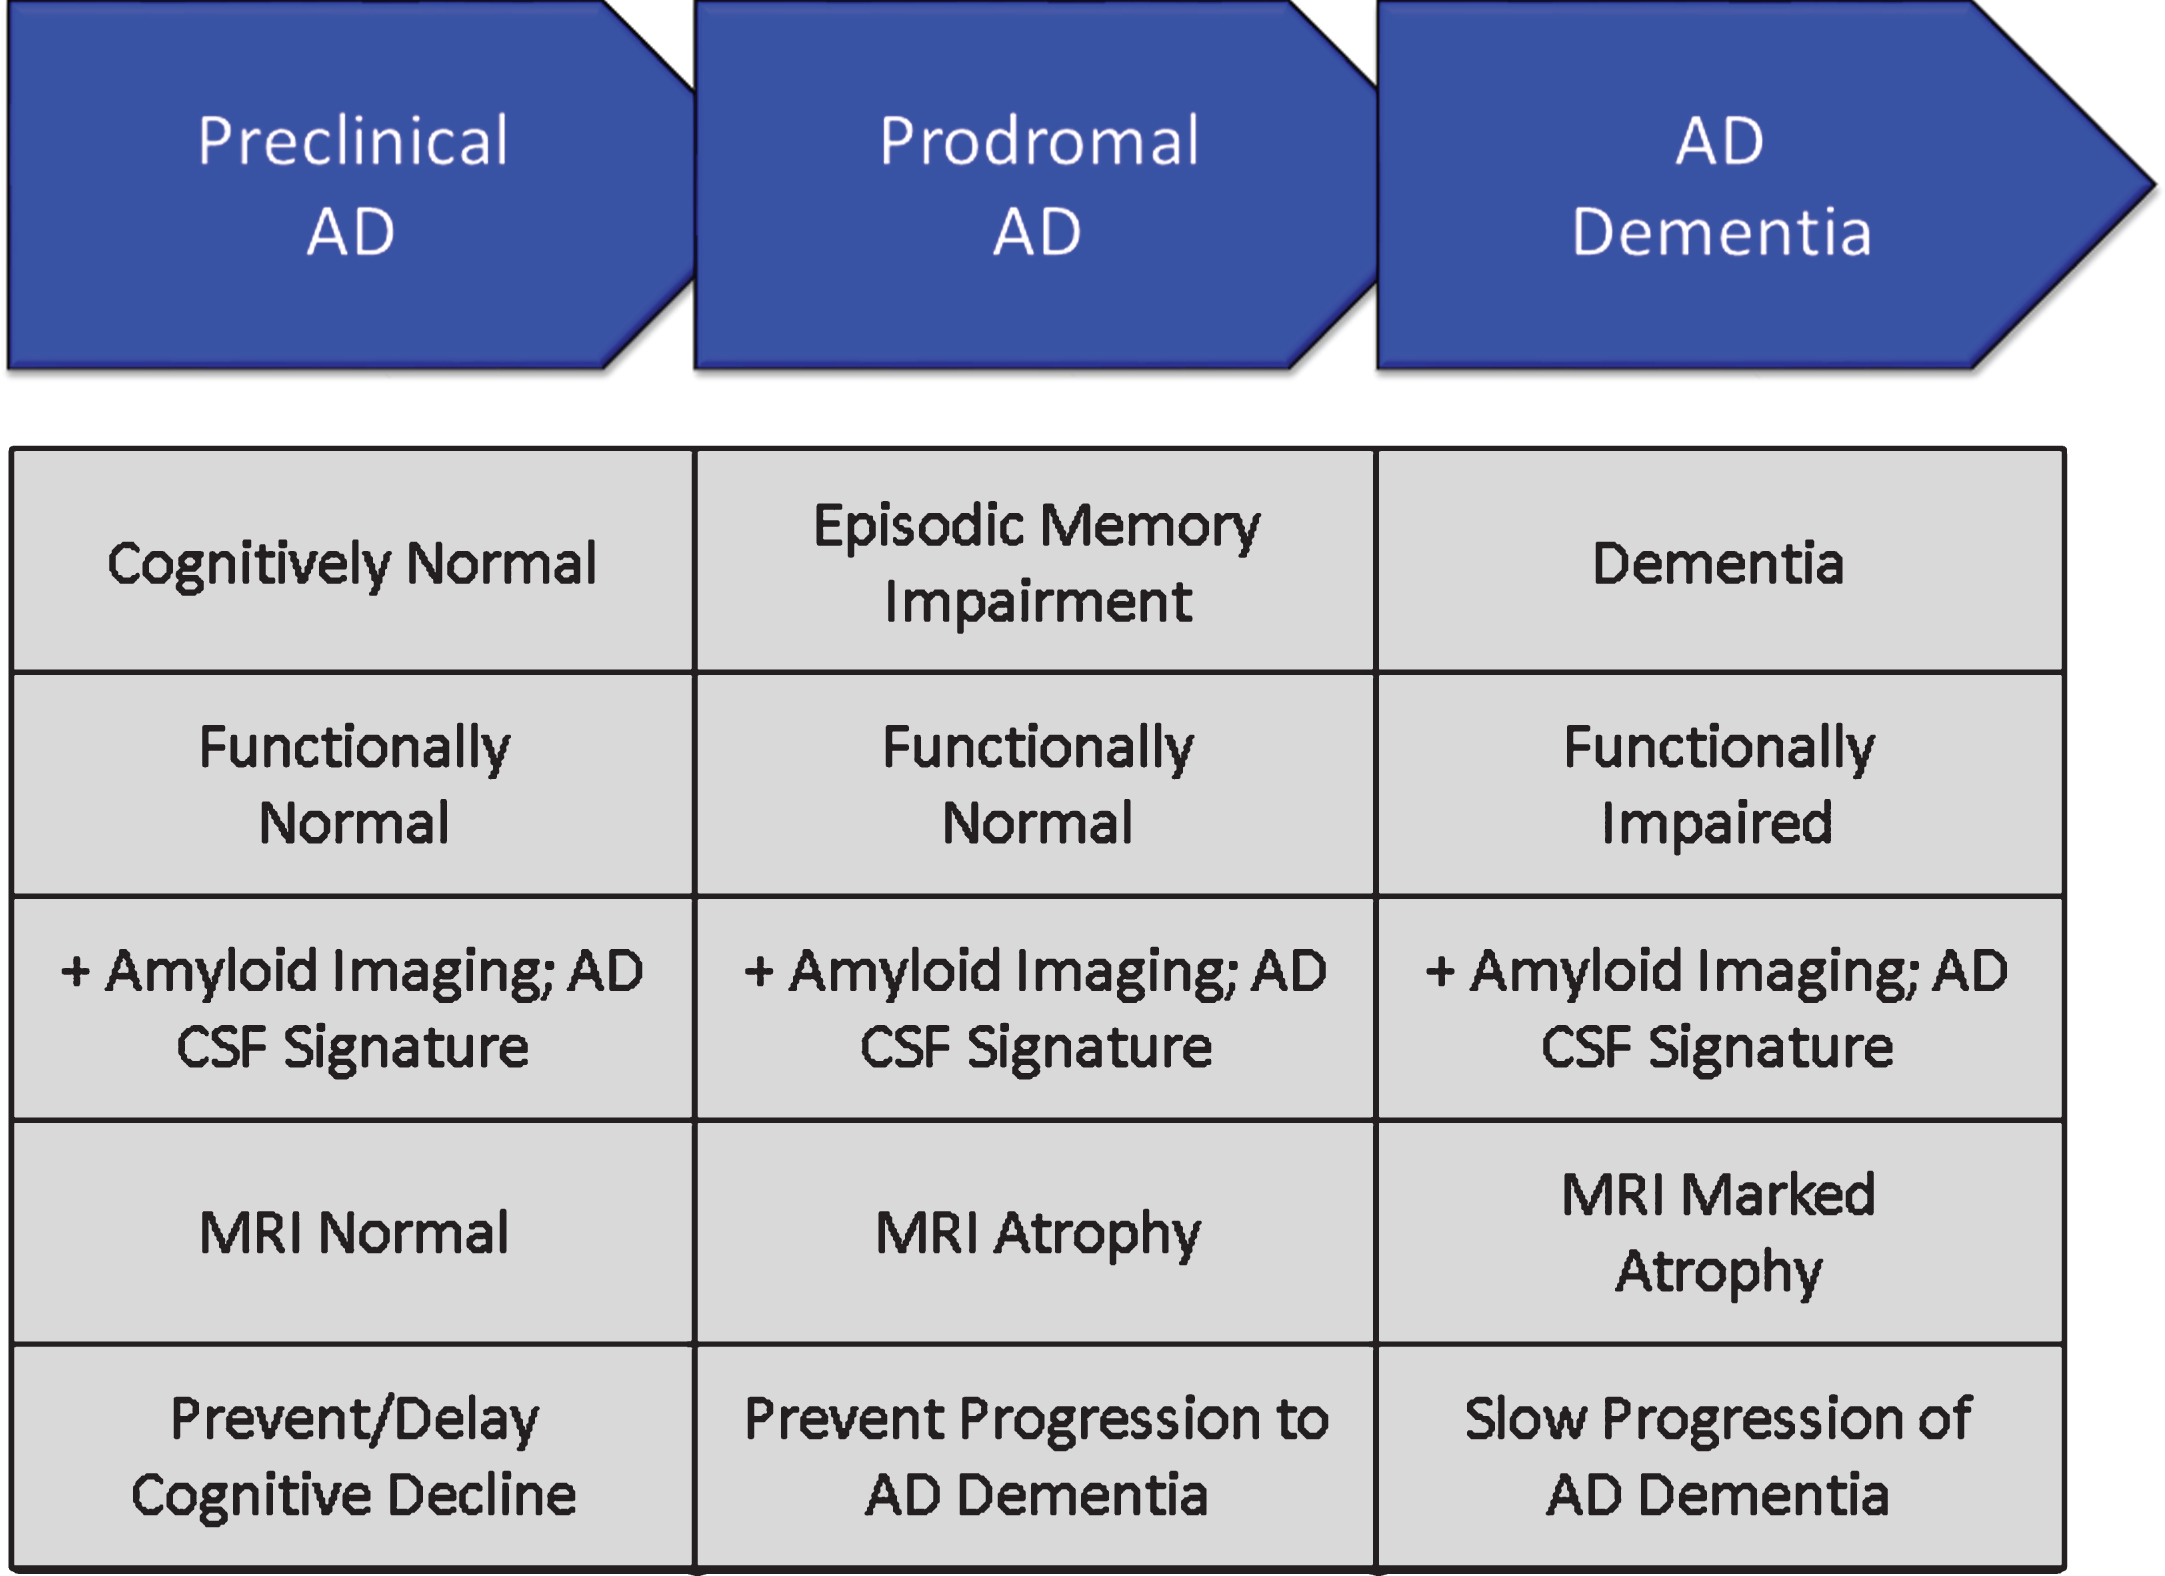
Table 2
Outcome tools used for the progressive phases of Alzheimer’s disease [39, 40, 63–70]
| Feature | Preclinical AD | Prodromal AD | AD Dementia |
| Cognition | Preclinical Alzheimer Cognitive Composite (PACC); Alzheimer Prevention Initiative Cognitive Composite (APCC) Test | Clinical Dementia Rating- Sum of Boxes (CDR-sb); AD Composite Score (ADCOMS); Integrated AD Rating Scale (iADRS) | Alzheimer’s Disease Assessment Scale – Cognitive Subscale (ADAS-cog); Severe Impairment Battery (SIB); Neuropsychological Test Battery (NTB) |
| Function | None | Alzheimer’s Disease Cooperative Study – Activities of Daily Living (ADCS ADL) Scale, Mild Cognitive Impairment (MCI) | Alzheimer’s Disease Cooperative Study – Activities of Daily Living (ADCS ADL) Scale; Disability Assessment for Dementia (DAD) |
| Trial Outcome | Drug-placebo difference in biomarker considered reasonably likely to predict clinical benefit; Reduction in cognitive decline compared to placebo | Drug-placebo difference in a composite outcome plus biomarker outcomes supportive of disease modification (composite differences between drug and placebo should not be due exclusively to cognitive benefits of therapy) | Drug-placebo difference in dual cognitive and functional or global outcomes plus biomarker outcomes supportive of disease modification |
Clinical outcomes in AD dementia trials are well established and have been used to demonstrate efficacy of cholinesterase inhibitors and memantine. Cognitive measures for mild-moderate AD dementia include the ADAS-cog [39] and the Neuropsychological Test Battery [66]. Common secondary measures include the CDR-sb [40], Clinical Global Impression of Change (CGIC), and the Neuropsychiatric Inventory [71]. Dual outcomes are required in AD dementia trials and include a cognitive measure with a functional or global outcome.
Prodromal trials commonly use a composite endpoint comprised of cognitive and functional elements or of cognitive elements derived from several scales. Composite endpoints include the CDR-sb [40], the AD Composite Scale (ADCOMS) [69], and the integrated AD Rating Scale (iADRS) [70]. The FDA has indicated that demonstration of both cognitive and functional benefit is necessary for drug approval in the prodromal phase of AD; a drug-placebo difference on a composite scale should not depend entirely on differences in cognition [72]. Some trials of DMTs include both patients with prodromal AD and those with mild AD dementia; the differences in these populations is arbitrary, and the groups can be usefully combined to facilitate recruitment of a broader population and show benefit in patients who have more than minimal impairment.
Prevention trials include primary prevention studies involving participants with no cognitive symptoms and no state biomarker changes of AD or secondary prevention studies including participants who have no cognitive symptoms but in whom amyloid imaging or CSF amyloid measures show that amyloidosis is present. Studies of asymptomatic participants with autosomal dominant mutations often have mixtures of some patients with amyloid abnormalities and some without, offering the possibility of evaluating a DMT as either primary or secondary prevention [73, 74]. Highly sensitive cognitive measures are combined with biomarkers to determine the impact of anti-amyloid therapies [63, 67, 73, 74]. Participants in this stage of preclinical or presymptomatic AD show very mild cognitive decline that may provide an opportunity to establish a drug-placebo difference in cognitive change [75, 76]. Biomarkers reasonably likely to predict future cognitive decline include amyloid imaging and tau imaging. Tau PET correlates better with cognitive decline and MRI measures of brain atrophy and may provide more insight into DM than amyloid measures [77, 78].
Clinical trial design
The most common Phase III design for DMT trials is the randomized, parallel group, placebo controlled, two or more arm, 18–24 month trial. The primary outcome is the drug-placebo difference at trial end on co-primary clinical and functional outcomes or clinical and global outcomes. Biomarker measures typically include MRI volumetrics; amyloid PET (if the agent has a mechanism expected to impact fibrillar amyloid); and CSF Aβ, total tau, and p-tau. Additional biomarkers might be chosen depending on drug MOA and specifics of the trial. Drug-placebo differences at trial end are analyzed for both clinical and biomarker outcomes. Analyses that offer supporting data expected in DM include change in slope of decline, increasing drug-placebo difference over time, and delay to milestones captured in the data (e.g., in a trial of prodromal patients, the percent of patients at each time point who have progressed to a diagnosis of dementia or advanced from a CDR score of 0.5 to a CDR score of 1). These supporting analyses can be affected by symptomatic agents and do not by themselves prove DM. Clinical and biomarker data are expected to be correlated if they are mediated by the same mechanism [79].
The delayed start and staggered withdrawal designs provide evidence of DM without depending on biomarkers. They demonstrate an enduring change in the course of the disease in comparison with a group begun on treatment earlier (in the case of the delayed start design) or withdrawn from therapy (in the case of the staggered withdrawal design) [80–82]. These trials have been difficult to implement and have had limited use in programs attempting to show DM. The switch from placebo to active therapy when a trial is terminated and participants enter an open label extension (all are on active therapy) provides an opportunity for a delayed start observation [83], although the absence of blinding at this stage of the trial could bias the observations. This open-label delayed start analysis could add support to a claim of DM without providing definitive evidence.
Adaptive clinical trial designs use data from the on-going trial to make decisions about trial conduct. For example, the Dominantly Inherited AD-Treatment Unit (DIAN-TU) uses an adaptive strategy for dose-selection of test agents [84]. Adaptive strategies can be used for dose, treatment duration, sample size, and entry criteria. The decision structure must be comprehensively pre-specified but adaptive designs have the advantage of responding to the in-trial observations and can save time and resources while optimizing the opportunity to demonstrate a drug-placebo difference [85].
Another resource-saving strategy in clinical trial design and analysis is the incorporation of futility analyses at a time when a sufficient number of patients have been exposed to treatment for a sufficiently long period time to predict the possible outcomes. If the drug-placebo difference at the time of the analysis suggests that the study has a very low possibility of finding a drug-placebo difference at trial conclusion, the trial can be stopped [64, 86]. Futility analyses avoid exposing patients to agents and potential side effects when a positive conclusion of the trial is deemed highly unlikely. Criteria for futility are evolving; they must be liberal enough to insure that potentially viable drugs are not terminated prematurely and conservative enough that trials with very little chance of success are not continued.
The sample size of the trial is determined by the anticipated effect size of the intervention, the variability of the key measurements, and the desired length of the trial. Assuming that a slowing of 20% or more is clinically meaningful for participants and families, the typical trial for a DMT anticipates including 600–1000 subjects per arm and observing them for 18–24 months [87]. Individuals with more severe disease have faster rates of decline. Prodromal patients who are ApoE4 carriers decline more rapidly than those who are not carriers [88]. The decline in the placebo group is critical to assessing the efficacy of the intervention and decline on placebo is a critical determinant of the success of a trial.
LESSONS LEARNED FROM TRIALS OF DMTs
There have been frequent failures in attempts to develop new drugs for AD, and 100% of DMT development programs have failed [6]. Every trial, however, is a learning opportunity and many lessons have been learned that will assist in future drug development [89].
Animal models of AD provide limited evidence of efficacy
Animal models of AD are an important means of investigating efficacy and toxicity in the preclinical state prior to exposing humans to possibly toxic or ineffective compounds. Many of the tg animal models overexpress the amyloid protein leading to cortical plaques similar to those observed in human AD [90]. These genetically engineered animals have abnormalities of amyloid metabolism but generally lack other aspects of human AD; they lack tau or cell death and have limited inflammatory changes [91]. The tg mice have mild cognitive changes but do not develop severe dementia equivalent to the human disease. Many types of therapy have been successful in reducing amyloid abnormalities in these animals and have often lead to improved cognitive performance on tests such as Morris Water Maze or Novel Object Recognition [90]. None of these successes at the preclinical level has predicted success at the human level. The animals serve as important gateways in the drug development process showing that they impact specific pathways; advancing a drug to human testing that did not succeed as expected in animals would be unwise. The models, however, recreate limited aspects of human AD such as amyloidosis and cannot be taken as models of the full spectrum of pathology of human AD or predictors of human benefit [23].
Another concern with regard to animal models is their reproducibility [92]. If an experiment cannot be reproduced within a single model or across related models then its ability to predict human outcomes is suspect. Strain, age, gender, handler behavior, diet, and light conditions may all influence animal behavior. Randomization and sample size are important aspects of animal trial design that have sometimes been ignored [93]. Lack of rigor with regard to these aspects of animal model testing may contribute to the lack of reproducibility both across models and in translating results from animals to humans.
Establish BBB penetration in Phase I
BBB penetration is shown in preclinical studies by the effects of drug on behavioral studies and post-exposure necropsy. Differences between rodent and human BBB function, especially activity of p-gp transporter make extrapolation of animal model results to humans uncertain, requiring demonstration of BBB penetration in Phase I FIH studies [34]. Tarenflurbil is an example of an agent advanced as treatment for AD with in vivo activity in animal models but likely low entrance into the CNS in humans [94]. Before candidate agents exit Phase I, investigators should establish BBB penetration, the plasma/CSF ratio, and the relationship of predicted human brain exposure to concentrations associated with benefit in animal models.
Determine a maximum tolerated dose in Phase I
Dose escalation studies in Phase I and dose refinement studies in Phase II should provide confidence in the dose(s) selected for Phase III. In particular, it is important to establish a MTD whenever possible to ensure that the highest possible doses have been explored. In some cases, occupancy studies may allow conclusions about dosing without an MTD if the receptor is fully occupied at lower doses. In other situations, solubility or physical features may limit the administered dose and the MTD cannot be determined. Beyond these exceptional circumstances, an MTD should be determined. Without an MTD, failure to show a drug-placebo difference in Phase II or Phase III will raise questions about the adequacy of the dose.
The diagnosis of AD should be supported by biomarkers
An important learning is the relatively large number of individuals who have a prodromal AD or AD dementia phenotype but are not amyloid-bearing when studied with amyloid PET [42]. These non-amyloid individuals have suspected non-Alzheimer pathology (SNAP) and are presumed not to have AD. They should be excluded from trials of agents for AD. Table 3 shows the percentage of patients meeting clinical criteria for prodromal AD or mild AD dementia who are amyloid-bearing [42]. Amyloid is more common in those with ApoE genotypes but genetic characterization is insufficient to ensure the presence of amyloid. To be confident that the trial population has AD, amyloid imaging or CSF evidence of the AD Aβ/tau signature should be collected (Fig. 4).
Table 3
Amyloid PET findings in patients meeting clinical criteria for prodromal AD or mild AD dementia (stratified by ApoE genotype) [42]
| Group | Amyloid Positive | Amyloid Positive |
| All | 61% | 39% |
| All prodromal AD | 50% | 50% |
| Prodromal ApoE4 carriers | 71% | 29% |
| Prodromal ApoE4 non-carriers | 31% | 69% |
| All mild AD dementia | 75% | 25% |
| Mild AD dementia ApoE4 carriers | 90% | 10% |
| Mild AD dementia ApoE4 non- carriers | 58% | 42% |
Assure target engagement in Phase II
DM is supported by an impact on “downstream” measures of cell death such as MRI atrophy, CSF tau, or possibly other biomarkers of neuronal degeneration such as neurofilament light chain protein [54]. These downstream consequences can reasonably be expected only if the “upstream” target of the pharmacologic intervention is successful. Target engagement measures will depend on the MOA of the candidate therapy. BACE inhibitors, gamma secretase inhibitors, and gamma secretase modulators will have an effect on amyloid production as measured by stable isotope-labeled kinetics (SILK) [95]. BACE inhibitors will also inhibit BACE activity as measured in the CSF and reflected in sAβPPβ, a by-product of BACE activity; gamma secretase modulators result in Aβ fragments of 15/16 amino acid lengths in the CSF which are not normally present in AD [95–97]. Proof of pharmacology is one goal of Phase II and compounds should not be advanced to Phase III without well documented support for a pharmacologic effect.
Establish a dose-response relationship in Phase II
Dosing approaches in Phase II ideally establish a low dose that is ineffective, one or two mid-range doses that are effective, and a high dose that is not tolerated and not acceptable. A dose-response on clinical or biomarker measures increases confidence in the pharmacology of the molecule. Regulatory agencies usually seek assurance that patients are given the lowest effective dose to ensure that they are not being exposed to unnecessary side effects. Doses established in Phase II inform decisions of which dose should be advanced to Phase III. Drug formulation decisions should be completed in Phase II prior to Phase III.
Collect multiple biomarkers to assess outcomes
Knowledge of the neurobiology of AD is incomplete. Systems biology studies demonstrate that AD biology is complex [98] and biomarkers provide limited windows onto this complex and ill-understood disease. Although working models of the order of events in AD have been constructed, none have been proven and none have guided successful DMT development. Agnostic approaches to biomarkers (e.g., amyloid; tau, neurodegeneration; A/T/N) are used to acknowledge the exploratory nature of our biomarker documentation of drug effects [99]. To support DM as the outcome of a therapy, trial sponsors should collect A/T/N biomarker data, emerging biomarkers, and biomarkers specifically linked to the mechanism of the intervention to gain a comprehensive view of the impact of treatment.
Recruitment is a major challenge
Trial recruitment is a difficult process and each population—cognitively normal at-risk participants for prevention trials, minimally impaired biomarker positive participants for prodromal AD trials, and cognitive and functionally impaired participants for AD dementia trials—have unique requirements for identification, recruitment, informed consent, and retention in the trial. There are too few highly functioning trial sites in the world. The world’s populations are generally poorly educated about clinical trials and often have few opportunities to participate. Many trials spend more time in the recruitment phase of the trial than in the drug exposure phase. Slow recruitment slows the cycle time of trials and increases their cost. Many AD-concerned organizations are constructing responses to this challenge. The Global Alzheimer Platform (GAP) network of trial sites in the US and the European Prevention of Alzheimer’s Disease (EPAD) initiatives are among the leaders of the attempt to reduce recruitment times and accelerate trials [100, 101].
Global trials have greater variability
One response to slow recruitment is to include many trial sites with each site recruiting only a few participants to the trial. In most trials, each site is expected to contribute 6–12 participants, but many sites contribute only 1 or 2 participants. This amplifies “noise” in the data and decreases the ability to demonstrate a drug-placebo difference.
Globalization of trials creates another set of challenges. Sites distributed around the world are culturally and linguistically diverse, have different standards of health care, and include participants with different histories of nutrition and levels of education. Trial sites are highly variable in terms of experience, expertise, training, and infrastructure. Local hospital and university institutional review boards (IRBs) may have limited experience with hosting and reviewing AD trials [102]. Global sites impose challenges in terms of drug manufacturing and distribution, supply lines, biomarker collection, laboratory availability, and data collection and quality assurance. The result of this complexity is that populations recruited into trials from around the world vary in terms of age, education, genotype, and other clinical characteristics, and they progress somewhat differently in clinical trials [103, 104]. North America and Western European trial populations are similar and results are likely to be most interpretable if these populations comprise the majority of the study population.
Efficacy and safety data are needed on all populations where the agents will be marketed; smaller trials in local populations may be the best way to address these needs.
Comprehensive trial networks are needed to conduct AD trials
Conducting clinical trials is demanding and requires expertise, commitment, and infrastructure. Some academic medical centers support trials while others do not, industry sponsors support trials but tend not to support trial infrastructure. In the US, the National Center for Advancing Translational Sciences (NCATS) sponsors Clinical and Translational Science Awards (CTSAs) to provide trial infrastructure in major university medical centers [105]. Trial networks are currently re-created for each trial and raters are re-trained on the same outcomes for each trial. Each institution often has its own IRB for reviewing trials. Legal review of contracts further slows trial initiation. Construction of a highly efficient trial network with standing non-redundant training, and a central IRB are goals of GAP and EPAD [100, 101].
Negative trials may indicate an ineffective drug or a failed trial
The failure to show a drug-placebo difference at the end of a trial may be due to lack of efficacy of the candidate therapy or flawed conduct of the clinical trial. Table 4 summarizes the reasons for negative outcomes in trials. Drug-related reasons for negative trials include lack of efficacy and excessive toxicity [106]. In some cases, the dose range has not been adequately explored in early drug development and a negative trial opens the question of whether the agent might have been efficacious at higher doses. Such agents must return to Phase I for dose escalation trials and sponsors rarely have an interest in pursuing this alternative. Trial-related reasons for failed trials of DMTs include lack of decline in the placebo group, enrollment of non-AD patients, and excessive measurement variability.
Table 4
Reasons for failure to show a drug-placebo difference at the end of a clinical trial of a disease-modifying agent. AD, Alzheimer’s disease
| Drug-related |
| •Lack of efficacy of the agent |
| •Inappropriately low dosing of an effective agent |
| •Excessive toxicity or lack of tolerability leading to high discontinuation rates in the active treatment arms |
| •Excessive toxicity or lack of tolerability leading to early termination of the trial |
| Trial-related |
| •Lack of decline in the placebo group |
| •Recruitment of non-AD patients into trials requiring an AD substrate for drug benefit to occur |
| •Excessive measurement variability |
| •Lack of measurable effect of active comparator drugs (if available) |
Placebo decline determines drug-placebo difference
Successful DMTs will slow the course of decline in AD. Slowing of decline is established by contrasting the decline in the active treatment group with the trajectory of the placebo group. The placebo trajectory will determine the drug-placebo difference at end of trial. The rate of decline of the placebo group is a crucial consideration in understanding the treatment effect. Placebo groups with SNAP patients do no decline as rapidly as those with confirmed AD, emphasizing the importance of confirming the diagnosis of AD in trial participants [107]. Slow decline in the placebo group will minimize the drug-placebo difference and the agent will appear less efficacious than when compared with a more rapidly declining group. Similarly, an unusually rapidly declining placebo group may lead to an overestimation of drug efficacy since the drug-placebo difference will be exaggerated and this may not be reproduced in a later trial. A meta-analysis of placebo decline showed that patients with mild AD are expected to decline 5.6 points on the ADAS-cog or 3 points on the Mini-Mental State Examination in 18 months [108]. This figure is based on trials that included patients without biologically confirmed AD and may underestimate the decline in those confirmed with amyloid imaging or CSF studies to have AD.
Phase II subgroup analyses do not provide guidance for Phase III
Negative trials are often analyzed to detect treatment-responsive subgroups that can be exploited in future trials. This approach entails substantial risk of being misled by spurious trial specific results. Subgroups are not subject to the same recruitment or randomization as the original group, the sample sizes of subgroups are often small leading to underpowered results, and the outcome measures are typically not optimized for a specific subgroup. Basing a Phase III program on a subgroup analysis of a Phase II trial with a negative outcome has usually resulted in a negative Phase III trial.
To reduce the risk of being misled, one can apply guidelines for interpretation of Phase II subgroup analyses. Table 5 shows the principal recommendations for subgroup analysis [109–111]. Subgroup analyses suggesting benefit in one group of patients require conducting a Phase II trial for this subgroup to gain additional confidence in this treatment approach.
Table 5
Questions to ask to determine how much confidence can be placed in a subgroup analysis [109–111]
| Guide: Questions to Ask of Subgroup Claims | Supportive of Subgroup Claim if “Yes” |
| Design | |
| Was the subgroup variable a baseline characteristic? | |
| Was the subgroup variable a stratification factor at randomization? | |
| Was the subgroup hypothesis specified a priori? | |
| Was the subgroup analysis one of a small number of subgroup hypotheses tested (≤5)? | |
| Analysis | |
| Can chance explain the subgroup difference? | |
| Was the test of interaction significant (p < 0.05)? | |
| Was the significant interaction effect independent, if there were multiple significant interactions? | |
| Context | |
| Was the direction of the subgroup effect correctly pre-specified? | |
| Was the subgroup effect consistent with evidence from previous related studies? | |
| Was the subgroup effect consistent across related outcomes? | |
| Was there indirect evidence to support the apparent subgroup effect – for example, biological rationale, laboratory tests, animal studies? | |
| Systematic reviews | |
| Is the subgroup difference suggested by comparisons within rather than between studies? |
BLUEPRINT OF A DEVELOPMENT PROGRAM FOR A DMT
This primer of DMT trials plus the lessons learned from negative trials suggest a blueprint for future trials of DMTs. The key elements of success for a DMT development program include:
• Comprehensive understanding of target biology
• Selective, potent agents impacting a key element of AD biology leading to cell death
• Disciplined conduct of a drug development program organized around a TPP
• Success in preclinical models of AD
• Acceptable ADME and toxicity in preclinical studies
• Acceptable ADME and toxicity in FIH studies
• BBB penetration demonstrated with relevant extrapolated brain exposures achieved in Phase I
• MTD established in Phase I
• Use of biomarkers in Phase II and III to establish accurate diagnosis of AD
• POC established in Phase II with target engagement and proof-of-pharmacology
• Dose-response shown in Phase II
• Trials implemented in high functioning trial network
• Globalization-dependent variability minimized in Phases II and III
• Demonstration of robust clinical and correlated DM-type biomarker response in Phase III
• Report Phase II and III trials using CONSORT criteria
• Continued assessment of safety and clinical utility after market introduction
SUMMARY
Development of DMTs for AD is a difficult, long, and expensive process. No development program has yet succeeded. A systematic approach to drug development advancing the scientific understanding of the candidate molecule from preclinical studies through Phases I, II, and III of clinical trials can increase the probability of success and de-risk development programs. Biomarkers for diagnosis, target engagement and proof-of-pharmacology, outcome assessment, and side effect monitoring assist in drug development. Excellent conduct of trials and awareness of the trial pitfalls are critical to development success. New therapeutic targets such as tau-related processes and the use of combination therapies may enhance the chances of successful DMT development. Quality development and trial strategies for drugs that are potent, selective, and impactful on the biology of AD are necessary to bring urgently needed new treatments to patients with AD and those at risk for the disease.
ACKNOWLEDGMENTS
The authors acknowledge support of a COBRE grant from the NIH/MIGMS (P20GM109025) and Keep Memory Alive.
Authors’ disclosures available online (https://www.j-alz.com/manuscript-disclosures/17-9901).
REFERENCES
[1] | Masters CL , Bateman R , Blennow K , Rowe CC , Sperling RA , Cummings JL ((2015) ) Alzheimer’s disease. Nat Rev Dis Primer 1: , 15056. |
[2] | Scheltens P , Blennow K , Breteler MM , de Strooper B , Frisoni GB , Salloway S , Van der Flier WM ((2016) ) Alzheimer’s disease. Lancet 388: , 505–517. |
[3] | Jack CR Jr , Knopman DS , Jagust WJ , Petersen RC , Weiner MW , Aisen PS , Shaw LM , Vemuri P , Wiste HJ , Weigand SD , Lesnick TG , Pankratz VS , Donohue MC , Trojanowski JQ ((2013) ) Tracking pathophysiological processes in Alzheimer’s disease: An updated hypothetical model of dynamic biomarkers. Lancet Neurol 12: , 207–216. |
[4] | Sosa-Ortiz AL , Acosta-Castillo I , Prince MJ ((2012) ) Epidemiology of dementias and Alzheimer’s disease. Arch Med Res 43: , 600–608. |
[5] | ((2016) ) 2016 Alzheimer’s disease facts and figures. Alzheimer Dement 12: , 459–509. |
[6] | Cummings JL , Morstorf T , Zhong K ((2014) ) Alzheimer’s disease drug-development pipeline: Few candidates, frequent failures. Alzheimers Res Ther 6: , 37–43. |
[7] | Cummings J , Morstorf T , Lee G ((2016) ) Alzheimer’s drug development pipeline: 2016. Alzheimers Dement 2: , 222–232. |
[8] | Cummings J , Lee G , Mortsdorf T , Ritter A , Zhong K ((2017) ) Alzheimer’s disease drug development pipeline: 2017. Alzheimers Dement (N Y) 3: , 367–384. |
[9] | Cummings JL , Fox N ((2017) ) Defining disease modification for Alzheimer’s disease clinical trials. J Prev Alzheimers Dis 4: , 109–115. |
[10] | Scott TJ , O’Connor AC , Link AN , Beaulieu TJ ((2014) ) Economic analysis of opportunities to accelerate Alzheimer’s disease research and development. Ann N Y Acad Sci 1313: , 17–34. |
[11] | Fauman EB , Rai BK , Huang ES ((2011) ) Structure-based druggability assessment–identifying suitable targets for small molecule therapeutics. Curr Opin Chem Biol 15: , 463–468. |
[12] | Ambure P , Roy K ((2014) ) Advances in quantitative structure-activity relationship models of anti-Alzheimer’s agents. Expert Opin Drug Discov 9: , 697–723. |
[13] | Gimenez BG , Santos MS , Ferrarini M , Fernandes JP ((2010) ) Evaluation of blockbuster drugs under the rule-of-five. Pharmazie 65: , 148–152. |
[14] | Leeson PD ((2016) ) Molecular inflation, attrition and the rule of five. Adv Drug Deliv Rev 101: , 22–33. |
[15] | Hughes JP , Rees S , Kalindjian SB , Philpott KL ((2011) ) Principles of early drug discovery. Br J Pharmacol 162: , 1239–1249. |
[16] | Dragunow M ((2008) ) High-content analysis in neuroscience. Nat Rev Neurosci 9: , 779–788. |
[17] | Alqahtani S , Mohamed LA , Kaddoumi A ((2013) ) Experimental models for predicting drug absorption and metabolism. Expert Opin Drug Metab Toxicol 9: , 1241–1254. |
[18] | Redfern WS , Carlsson L , Davis AS , Lynch WG , MacKenzie I , Palethorpe S , Siegl PK , Strang I , Sullivan AT , Wallis R , Camm AJ , Hammond TG ((2003) ) Relationships between preclinical cardiac electrophysiology, clinical QT interval prolongation and torsade de pointes for a broad range of drugs: Evidence for a provisional safety margin in drug development. Cardiovasc Res 58: , 32–45. |
[19] | Bass AS , Cartwright ME , Mahon C , Morrison R , Snyder R , McNamara P , Bradley P , Zhou YY , Hunter J ((2009) ) Exploratory drug safety: A discovery strategy to reduce attrition in development. J Pharmacol Toxicol Methods 60: , 69–78. |
[20] | Freed LM ((2006) ) Dose selection for first-in-human (FIH) trials – regulatory perspective. Krishna R, ed. In Dose Optimization in Drug Development Taylor & Francis Group, LLC, New York, NY, pp. 45–60. |
[21] | Presta LG ((2005) ) Selection, design, and engineering of therapeutic antibodies. J Allergy Clin Immunol 116: , 731–736. |
[22] | Pul R , Dodel R , Stangel M ((2011) ) Antibody-based therapy in Alzheimer’s disease. Expert Opin Biol Ther 11: , 343–357. |
[23] | Sabbagh JJ , Kinney JW , Cummings JL ((2013) ) Alzheimer’s disease biomarkers in animal models: Closing the translational gap. Am J Neurodegener Dis 2: , 108–120. |
[24] | Puzzo D , Gulisano W , Palmeri A , Arancio O ((2015) ) Rodent models for Alzheimer’s disease drug discovery. Expert Opin Drug Discov 10: , 703–711. |
[25] | Choi SH , Kim YH , Hebisch M , Sliwinski C , Lee S , D’Avanzo C , Chen H , Hooli B , Asselin C , Muffat J , Klee JB , Zhang C , Wainger BJ , Peitz M , Kovacs DM , Woolf CJ , Wagner SL , Tanzi RE , Kim DY ((2014) ) A three-dimensional human neural cell culture model of Alzheimer’s disease. Nature 515: , 274–278. |
[26] | Liu Q , Waltz S , Woodruff G , Ouyang J , Israel MA , Herrera C , Sarsoza F , Tanzi RE , Koo EH , Ringman JM , Goldstein LS , Wagner SL , Yuan SH ((2014) ) Effect of potent gamma-secretase modulator in human neurons derived from multiple presenilin 1-induced pluripotent stem cell mutant carriers. JAMA Neurol 71: , 1481–1489. |
[27] | Tyndall A , Du W , Breder CD ((2017) ) Regulatory watch: The target product profile as a tool for regulatory communication: Advantageous but underused. Nat Rev Drug Disco 16: , 156. |
[28] | Schulz KF , Altman DG , Moher D , Consort Group ((2010) ) CONSORT 2010 statement: Updated guidelines for reporting parallel group randomised trials. BMJ 340: , c332. |
[29] | Umscheid CA , Margolis DJ , Grossman CE ((2011) ) Key concepts of clinical trials: A narrative review. Postgrad Med 123: , 194–204. |
[30] | Emilien G , van Meurs W , Maloteaux JM ((2000) ) The dose-response relationship in phase I clinical trials and beyond: Use, meaning, and assessment. Pharmacol Ther 88: , 33–58. |
[31] | Marques F , Sousa JC , Sousa N , Palha JA ((2013) ) Blood-brain-barriers in aging and in Alzheimer’s disease. Mol Neurodegener 8: , 38–46. |
[32] | Karran E , Hardy J ((2014) ) A critique of the drug discovery and phase 3 clinical programs targeting the amyloid hypothesis for Alzheimer disease. Ann Neurol 76: , 185–205. |
[33] | Hammarlund-Udenaes M , Friden M , Syvanen S , Gupta A ((2008) ) On the rate and extent of drug delivery to the brain. Pharm Res 25: , 1737–1750. |
[34] | de Lange EC ((2013) ) Utility of CSF in translational neuroscience. J Pharmacokinet Pharmacodyn 40: , 315–326. |
[35] | Banks WA ((2012) ) Drug delivery to the brain in Alzheimer’s disease: Consideration of the blood-brain barrier. Adv Drug Deliv Rev 64: , 629–639. |
[36] | Appleby BS , Nacopoulos D , Milano N , Zhong K , Cummings JL ((2013) ) A review: Treatment of Alzheimer’s disease discovered in repurposed agents. Dement Geriatr Cogn Disord 35: , 1–22. |
[37] | Appleby BS , Cummings JL ((2013) ) Discovering new treatments for Alzheimer’s disease by repurposing approved medications. Curr Top Med Chem 13: , 2306–2327. |
[38] | Dubois B , Feldman HH , Jacova C , Hampel H , Molinuevo JL , Blennow K , DeKosky ST , Gauthier S , Selkoe D , Bateman R , Cappa S , Crutch S , Engelborghs S , Frisoni GB , Fox NC , Galasko D , Habert MO , Jicha GA , Nordberg A , Pasquier F , Rabinovici G , Robert P , Rowe C , Salloway S , Sarazin M , Epelbaum S , de Souza LC , Vellas B , Visser PJ , Schneider L , Stern Y , Scheltens P , Cummings JL ((2014) ) Advancing research diagnostic criteria for Alzheimer’s disease: The IWG-2 criteria. Lancet Neurol 13: , 614–629. |
[39] | Rosen WG , Mohs RC , Davis KL ((1984) ) A new rating scale for Alzheimer’s disease. Am J Psychiatry 141: , 1356–1364. |
[40] | Morris JC ((1993) ) The Clinical Dementia Rating (CDR): Current version and scoring rules. Neurology 43: , 2412–2414. |
[41] | Cummings JL ((2008) ) Optimizing phase II of drug development for disease-modifying compounds.S15-S. Alzheimers Dement 4: , 20. |
[42] | Sevigny J , Suhy J , Chiao P , Chen T , Klein G , Purcell D , Oh J , Verma A , Sampat M , Barakos J ((2016) ) Amyloid PET screening for enrichment of early-stage Alzheimer disease clinical trials: Experience in a Phase 1b clinical trial. Alzheimer Dis Assoc Disord 30: , 1–7. |
[43] | Sevigny J , Chiao P , Bussiere T , Weinreb PH , Williams L , Maier M , Dunstan R , Salloway S , Chen T , Ling Y , O’Gorman J , Qian F , Arastu M , Li M , Chollate S , Brennan MS , Quintero-Monzon O , Scannevin RH , Arnold HM , Engber T , Rhodes K , Ferrero J , Hang Y , Mikulskis A , Grimm J , Hock C , Nitsch RM , Sandrock A ((2016) ) The antibody aducanumab reduces Abeta plaques in Alzheimer’s disease. Nature 537: , 50–56. |
[44] | Sperling RA , Jack CR Jr , Black SE , Frosch MP , Greenberg SM , Hyman BT , Scheltens P , Carrillo MC , Thies W , Bednar MM , Black RS , Brashear HR , Grundman M , Siemers ER , Feldman HH , Schindler RJ ((2011) ) Amyloid-related imaging abnormalities in amyloid-modifying therapeutic trials: Recommendations from the Alzheimer’s Association Research Roundtable Workgroup. Alzheimers Dement 7: , 367–385. |
[45] | Sperling R , Salloway S , Brooks DJ , Tampieri D , Barakos J , Fox NC , Raskind M , Sabbagh M , Honig LS , Porsteinsson AP , Lieberburg I , Arrighi HM , Morris KA , Lu Y , Liu E , Gregg KM , Brashear HR , Kinney GG , Black R , Grundman M ((2012) ) Amyloid-related imaging abnormalities in patients with Alzheimer’s disease treated with bapineuzumab: A retrospective analysis. Lancet Neurol 11: , 241–249. |
[46] | Babiloni C , Lizio R , Marzano N , Capotosto P , Soricelli A , Triggiani AI , Cordone S , Gesualdo L , Del Percio C ((2016) ) Brain neural synchronization and functional coupling in Alzheimer’s disease as revealed by resting state EEG rhythms. Int J Psychophysiol 103: , 88–102. |
[47] | Sperling RA , Dickerson BC , Pihlajamaki M , Vannini P , LaViolette PS , Vitolo OV , Hedden T , Becker JA , Rentz DM , Selkoe DJ , Johnson KA ((2010) ) Functional alterations in memory networks in early Alzheimer’s disease. Neuromolecular Med 12: , 27–43. |
[48] | Zippo AG , Castiglioni I ((2016) ) Integration of (18)FDG-PET metabolic and functional connectomes in the early diagnosis and prognosis of the Alzheimer’s disease. Curr Alzheimer Res 13: , 487–497. |
[49] | Cummings J , Zhong K , Cordes D ((2017) ) Drug development in Alzheimer’s disease – the role of default mode network assessment in phase II. US Neurol 13: , 67–69. |
[50] | Harada R , Okamura N , Furumoto S , Furukawa K , Ishiki A , Tomita N , Tago T , Hiraoka K , Watanuki S , Shidahara M , Miyake M , Ishikawa Y , Matsuda R , Inami A , Yoshikawa T , Funaki Y , Iwata R , Tashiro M , Yanai K , Arai H , Kudo Y ((2016) ) 18F-THK5351: A novel PET radiotracer for imaging neurofibrillary pathology in Alzheimer disease. J Nucl Med 57: , 208–214. |
[51] | Tapiola T , Alafuzoff I , Herukka SK , Parkkinen L , Hartikainen P , Soininen H , Pirttila T ((2009) ) Cerebrospinal fluid beta-amyloid 42 and tau proteins as biomarkers of Alzheimer-type pathologic changes in the brain. Arch Neurol 66: , 382–389. |
[52] | Tarawneh R , Lee JM , Ladenson JH , Morris JC , Holtzman DM ((2012) ) CSF VILIP-1 predicts rates of cognitive decline in early Alzheimer disease. Neurology 78: , 709–719. |
[53] | Whitwell JL , Josephs KA , Murray ME , Kantarci K , Przybelski SA , Weigand SD , Vemuri P , Senjem ML , Parisi JE , Knopman DS , Boeve BF , Petersen RC , Dickson DW , Jack CR Jr ((2008) ) MRI correlates of neurofibrillary tangle pathology at autopsy: A voxel-based morphometry study. Neurology 71: , 743–749. |
[54] | Zetterberg H , Skillback T , Mattsson N , Trojanowski JQ , Portelius E , Shaw LM , Weiner MW , Blennow K , Alzheimer’s Disease Neuroimaging Initiative ((2016) ) Association of cerebrospinal fluid neurofilament light concentration with Alzheimer disease progression. JAMA Neurol 73: , 60–67. |
[55] | Sheiner LB ((1997) ) Learning versus confirming in clinical drug development. Clin Pharmacol Ther 61: , 275–291. |
[56] | Harrison RK ((2016) ) Phase II and phase III failures: 2013-2015. Nat Rev Drug Discov 15: , 817–818. |
[57] | Cook D , Brown D , Alexander R , March R , Morgan P , Satterthwaite G , Pangalos MN ((2014) ) Lessons learned from the fate of AstraZeneca’s drug pipeline: A five-dimensional framework. Nat Rev Drug Discov 13: , 419–431. |
[58] | Emre M , Aarsland D , Albanese A , Byrne EJ , Deuschl G , De Deyn PP , Durif F , Kulisevsky J , van LT , Lees A , Poewe W , Robillard A , Rosa MM , Wolters E , Quarg P , Tekin S , Lane R ((2004) ) Rivastigmine for dementia associated with Parkinson’s disease. N Engl J Med 351: , 2509–2518. |
[59] | Cummings JL , Froelich L , Black SE , Bakchine S , Bellelli G , Molinuevo JL , Kressig RW , Downs P , Caputo A , Strohmaier C ((2012) ) Randomized, double-blind, parallel-group, 48-week study for efficacy and safety of a higher-dose rivastigmine patch (15 vs. 10 cm(2)) in Alzheimer’s disease. Dement Geriatr Cogn Disord 33: , 341–353. |
[60] | Farlow M , Veloso F , Moline M , Yardley J , Brand-Schieber E , Bibbiani F , Zou H , Hsu T , Satlin A ((2011) ) Safety and tolerability of donepezil 23 mg in moderate to severe Alzheimer’s disease. BMC Neurol 11: , 57–64. |
[61] | Rodriguez-Monguio R , Spielberger K , Seoane-Vazquez E ((2014) ) Examination of risk evaluation and mitigation strategies and drug safety in the US. Res Social Adm Pharm 10: , 232–238. |
[62] | Alzheimer’s Association ((2015) ) Changing the trajectory of Alzheimer’s disease: How a treatment by 2025 saves lives and dollars. Alzheimer’s Association, Chicago, IL pp 1–16. |
[63] | Donohue MC , Sperling RA , Salmon DP , Rentz DM , Raman R , Thomas RG , Weiner M , Aisen PS , Australian Imaging Biomarkers, Lifestyle Flagship Study of Ageing, Alzheimer’s Disease Neuroimaging Initiative, Alzheimer’s Disease Cooperative Study ((2014) ) The preclinical Alzheimer cognitive composite: Measuring amyloid-related decline. JAMA Neurol 71: , 961–970. |
[64] | Galasko D , Bell J , Mancuso JY , Kupiec JW , Sabbagh MN , van DC , Thomas RG , Aisen PS ((2014) ) Clinical trial of an inhibitor of RAGE-Abeta interactions in Alzheimer disease. Neurology 82: , 1536–1542. |
[65] | Gelinas I , Gauthier L , McIntyre M , Gauthier S ((1999) ) Development of a functional measure for persons with Alzheimer’s disease: The disability assessment for dementia. Am J Occup Ther 53: , 471–481. |
[66] | Harrison J , Minassian SL , Jenkins L , Black RS , Koller M , Grundman M ((2007) ) A neuropsychological test battery for use in Alzheimer disease clinical trials. Arch Neurol 64: , 1323–1329. |
[67] | Langbaum JB , Hendrix SB , Ayutyanont N , Chen K , Fleisher AS , Shah RC , Barnes LL , Bennett DA , Tariot PN , Reiman EM ((2014) ) An empirically derived composite cognitive test score with improved power to track and evaluate treatments for preclinical Alzheimer’s disease. Alzheimers Dement 10: , 666–674. |
[68] | Saxton J , Swihart AA ((1989) ) Neuropsychological assessment of the severely impaired elderly patient. Clin Geriatr Med 5: , 531–543. |
[69] | Wang J , Logovinsky V , Hendrix SB , Stanworth SH , Perdomo C , Xu L , Dhadda S , Do I , Rabe M , Luthman J , Cummings J , Satlin A ((2016) ) ADCOMS: A composite clinical outcome for prodromal Alzheimer’s disease trials. J Neurol Neurosurg Psychiatry 87: , 993–999. |
[70] | Wessels AM , Siemers ER , Yu P , Andersen SW , Holdridge KC , Sims JR , Sundell K , Stern Y , Rentz DM , Dubois B , Jones RW , Cummings J , Aisen PS ((2015) ) A combined measure of cognition and function for clinical trials: The integrated Alzheimer’s Disease Rating Scale (iADRS). J Prev Alzheimers Dis 2: , 227–241. |
[71] | Cummings JL , Mega M , Gray K , Rosenberg-Thompson S , Carusi DA , Gornbein J ((1994) ) The Neuropsychiatric Inventory: Comprehensive assessment of psychopathology in dementia. Neurology 44: , 2308–2314. |
[72] | U.S. Food and Drug Administration, Guidance for Industry Alzheimer’s Disease: Developing drugs for the treatment of early stage disease, http://www.fda.gov/downloads/drugs/guidancecomplianceregulatoryinformation/guidances/ucm338287.pdf, 2/2013. |
[73] | Mills SM , Mallmann J , Santacruz AM , Fuqua A , Carril M , Aisen PS , Althage MC , Belyew S , Benzinger TL , Brooks WS , Buckles VD , Cairns NJ , Clifford D , Danek A , Fagan AM , Farlow M , Fox N , Ghetti B , Goate AM , Heinrichs D , Hornbeck R , Jack C , Jucker M , Klunk WE , Marcus DS , Martins RN , Masters CM , Mayeux R , McDade E , Morris JC , Oliver A , Ringman JM , Rossor MN , Salloway S , Schofield PR , Snider J , Snyder P , Sperling RA , Stewart C , Thomas RG , Xiong C , Bateman RJ ((2013) ) Preclinical trials in autosomal dominant AD: Implementation of the DIAN-TU trial. Rev Neurol (Paris) 169: , 737–743. |
[74] | Reiman EM , Langbaum JB , Fleisher AS , Caselli RJ , Chen K , Ayutyanont N , Quiroz YT , Kosik KS , Lopera F , Tariot PN ((2011) ) Alzheimer’s Prevention Initiative: A plan to accelerate the evaluation of presymptomatic treatments. J Alzheimers Dis 26: (Suppl 3), 321–329. |
[75] | Mormino EC , Papp KV , Rentz DM , Donohue MC , Amariglio R , Quiroz YT , Chhatwal J , Marshall GA , Donovan N , Jackson J , Gatchel JR , Hanseeuw BJ , Schultz AP , Aisen PS , Johnson KA , Sperling RA ((2017) ) Early and late change on the preclinical Alzheimer’s cognitive composite in clinically normal older individuals with elevated amyloid-beta. Alzheimers Dement 13: , 1004–1012. |
[76] | Donohue MC , Sperling RA , Petersen R , Sun CK , Weiner MW , Aisen PS ((2017) ) Association between elevated brain amyloid and subsequent cognitive decline among cognitively normal persons. JAMA 317: , 2305–2316. |
[77] | Brier MR , Gordon B , Friedrichsen K , McCarthy J , Stern A , Christensen J , Owen C , Aldea P , Su Y , Hassenstab J , Cairns NJ , Holtzman DM , Fagan AM , Morris JC , Benzinger TL , Ances BM ((2016) ) Tau and Abeta imaging, CSF measures, and cognition in Alzheimer’s disease. Sci Transl Med 8: , 338ra366. |
[78] | Wang L , Benzinger TL , Su Y , Christensen J , Friedrichsen K , Aldea P , McConathy J , Cairns NJ , Fagan AM , Morris JC , Ances BM ((2016) ) Evaluation of tau imaging in staging Alzheimer disease and revealing interactions between beta-amyloid and tauopathy. JAMA Neurol 73: , 1070–1077. |
[79] | Katz R ((2004) ) Biomarkers and surrogate markers: An FDA perspective. NeuroRx 1: , 189–195. |
[80] | Bodick N , Forette F , Hadler D , Harvey RJ , Leber P , McKeith IG , Riekkinen PJ , Rossor MN , Scheltens P , Shimohama S , Spiegel R , Tanaka S , Thal LJ , Urata Y , Whitehouse P , Wilcock G ((1997) ) Protocols to demonstrate slowing of Alzheimer disease progression. Position paper from the International Working Group on Harmonization of Dementia Drug Guidelines. The Disease Progression Sub-Group. Alzheimer Dis Assoc Disord 11: (Suppl 3), 50–53. |
[81] | Leber P ((1996) ) Observations and suggestions on antidementia drug development. Alzheimer Dis Assoc Disord 10: (Suppl 1), 31–35. |
[82] | Leber P ((1997) ) Slowing the progression of Alzheimer disease: Methodologic issues. Alzheimer Dis Assoc Disord 11: (Suppl 5), S10–S21; discussion S37-S19. |
[83] | Liu-Seifert H , Andersen SW , Lipkovich I , Holdridge KC , Siemers E ((2015) ) A novel approach to delayed-start analyses for demonstrating disease-modifying effects in Alzheimer’s disease. PLoS One 10: , e0119632. |
[84] | Bateman RJ , Benzinger TL , Berry S , Clifford DB , Duggan C , Fagan AM , Fanning K , Farlow MR , Hassenstab J , McDade EM , Mills S , Paumier K , Quintana M , Salloway SP , Santacruz A , Schneider LS , Wang G , Xiong C , Dian-Tu Pharma Consortium for the Dominantly Inherited Alzheimer Network ((2017) ) The DIAN-TU Next Generation Alzheimer’s prevention trial: Adaptive design and disease progression model. Alzheimers Dement 13: , 8–19. |
[85] | Chow SC ((2014) ) Adaptive clinical trial design. Annu Rev Med 65: , 405–415. |
[86] | Katsuno M , Tanaka F , Sobue G ((2012) ) Perspectives on molecular targeted therapies and clinical trials for neurodegenerative diseases. J Neurol Neurosurg Psychiatry 83: , 329–335. |
[87] | Grill JD , Di L , Lu PH , Lee C , Ringman J , Apostolova LG , Chow N , Kohannim O , Cummings JL , Thompson PM , Elashoff D , Alzheimer’s Disease Neuroimaging Initiative ((2013) ) Estimating sample sizes for predementia Alzheimer’s trials based on the Alzheimer’s Disease Neuroimaging Initiative. Neurobiol Aging 34: , 62–72. |
[88] | Liu Y , Tan L , Wang HF , Liu Y , Hao XK , Tan CC , Jiang T , Liu B , Zhang DQ , Yu JT , Alzheimer’s Disease Neuroimaging Initiative ((2016) ) Multiple effect of APOE genotype on clinical and neuroimaging biomarkers across Alzheimer’s disease spectrum. Mol Neurobiol 53: , 4539–4547. |
[89] | Cummings J ((2017) ) Lessons learned from Alzheimer’s disease clinical trials with negative outcomes. Clin Transl Sci. doi: 10.1111/cts.12491 |
[90] | LaFerla FM , Green KN ((2012) ) Animal models of Alzheimer disease. Cold Spring Harb Perspect Med 2: , a006320. |
[91] | Giacobini E , Gold G ((2013) ) Alzheimer disease therapy[mdash]moving from amyloid-[beta] to tau. Nat Rev Neurol 9: , 677–686. |
[92] | Freedman LP , Gibson MC ((2015) ) The impact of preclinical irreproducibility on drug development. Clin Pharmacol Ther 97: , 16–18. |
[93] | Shineman DW , Basi GS , Bizon JL , Colton CA , Greenberg BD , Hollister BA , Lincecum J , Leblanc GG , Lee LH , Luo F , Morgan D , Morse I , Refolo LM , Riddell DR , Scearce-Levie K , Sweeney P , Yrjanheikki J , Fillit HM ((2011) ) Accelerating drug discovery for Alzheimer’s disease: Best practices for preclinical animal studies. Alzheimer Res Ther 3: , 28–39. |
[94] | Wan HI , Jacobsen JS , Rutkowski JL , Feuerstein GZ ((2009) ) Translational medicine lessons from flurizan’s failure in Alzheimer’s disease (AD) trial: Implication for future drug discovery and development for AD. Clin Transl Sci 2: , 242–247. |
[95] | Holtta M , Dean RA , Siemers E , Mawuenyega KG , Sigurdson W , May PC , Holtzman DM , Portelius E , Zetterberg H , Bateman RJ , Blennow K , Gobom J ((2016) ) A single dose of the gamma-secretase inhibitor semagacestat alters the cerebrospinal fluid peptidome in humans. Alzheimers Res Ther 8: , 11–18. |
[96] | Dobrowolska JA , Michener MS , Wu G , Patterson BW , Chott R , Ovod V , Pyatkivskyy Y , Wildsmith KR , Kasten T , Mathers P , Dancho M , Lennox C , Smith BE , Gilberto D , McLoughlin D , Holder DJ , Stamford AW , Yarasheski KE , Kennedy ME , Savage MJ , Bateman RJ ((2014) ) CNS amyloid-beta, soluble APP-alpha and -beta kinetics during BACE inhibition. J Neurosci 34: , 8336–8346. |
[97] | Portelius E , Zetterberg H , Dean RA , Marcil A , Bourgeois P , Nutu M , Andreasson U , Siemers E , Mawuenyega KG , Sigurdson WC , May PC , Paul SM , Holtzman DM , Blennow K , Bateman RJ ((2012) ) Amyloid-beta(1-15/16) as a marker for gamma-secretase inhibition in Alzheimer’s disease. J Alzheimers Dis 31: , 335–341. |
[98] | Ogishima S , Mizuno S , Kikuchi M , Miyashita A , Kuwano R , Tanaka H , Nakaya J ((2013) ) A map of Alzheimer’s disease-signaling pathways: A hope for drug target discovery. Clin Pharmacol Ther 93: , 399–401. |
[99] | Jack CR Jr , Bennett DA , Blennow K , Carrillo MC , Feldman HH , Frisoni GB , Hampel H , Jagust WJ , Johnson KA , Knopman DS , Petersen RC , Scheltens P , Sperling RA , Dubois B ((2016) ) A/T/N: An unbiased descriptive classification scheme for Alzheimer disease biomarkers. Neurology 87: , 539–547. |
[100] | Cummings JL , Aisen P , Barton R , Bork J , Doody R , Dwyer J , Egan JC , Feldman H , Lappin D , Truyen L , Salloway S , Sperling R , Vradenburg G ((2016) ) Re-engineering Alzheimer clinical trials: Global Alzheimer Platform Network. J Prev Alzheimers Dis 3: , 114–120. |
[101] | Ritchie CW , Molinuevo JL , Truyen L , Satlin A , Van der Geyten S , LovestoneS, European Prevention of Alzheimer’s Dementia (EPAD) Consortium ((2015) ) Development of interventions for the secondary prevention of Alzheimer’s dementia: The European Prevention of Alzheimer’s Dementia (EPAD) project. Lancet Psychiatry 3: , 179–186. |
[102] | Cummings J , Reynders R , Zhong K ((2011) ) Globalization of Alzheimer’s disease clinical trials. Alzheimers Res Ther 3: , 24–32. |
[103] | Grill JD , Raman R , Ernstrom K , Aisen P , Dowsett SA , Chen YF , Liu-Seifert H , Hake AM , Miller DS , Doody RS , Henley DB , Cummings JL ((2015) ) Comparing recruitment, retention, and safety reporting among geographic regions in multinational Alzheimer’s disease clinical trials. Alzheimers Res Ther 7: , 39–53. |
[104] | Henley DB , Dowsett SA , Chen YF , Liu-Seifert H , Grill JD , Doody RS , Aisen P , Raman R , Miller DS , Hake AM , Cummings J ((2015) ) Alzheimer’s disease progression by geographical region in a clinical trial setting. Alzheimers Res Ther 7: , 43–52. |
[105] | Colvis CM , Austin CP ((2014) ) Innovation in therapeutics development at the NCATS. Neuropsychopharmacology 39: , 230–232. |
[106] | Doody RS , Raman R , Farlow M , Iwatsubo T , Vellas B , Joffe S , Kieburtz K , He F , Sun X , Thomas RG , Aisen PS , Siemers E , Sethuraman G , Mohs R ((2013) ) A phase 3 trial of semagacestat for treatment of Alzheimer’s disease. N Engl J Med 369: , 341–350. |
[107] | Schreiber S , Schreiber F , Lockhart SN , Horng A , Bejanin A , Landau SM , Jagust WJ , Alzheimer’s Disease Neuroimaging Initiative ((2017) ) Alzheimer disease signature neurodegeneration and APOE genotype in mild cognitive impairment with suspected non-Alzheimer disease pathophysiology. JAMA Neurol 74: , 650–659. |
[108] | Thomas RG , Albert M , Petersen RC , Aisen PS ((2016) ) Longitudinal decline in mild-to-moderate Alzheimer’s disease: Analyses of placebo data from clinical trials. Alzheimers Dement 12: , 598–603. |
[109] | Sun X , Briel M , Busse JW , You JJ , Akl EA , Mejza F , Bala MM , Bassler D , Mertz D , Diaz-Granados N , Vandvik PO , Malaga G , Srinathan SK , Dahm P , Johnston BC , Alonso-Coello P , Hassouneh B , Walter SD , Heels-Ansdell D , Bhatnagar N , Altman DG , Guyatt GH ((2012) ) Credibility of claims of subgroup effects in randomised controlled trials: Systematic review. BMJ 344: , e1553. |
[110] | Sun X , Ioannidis JP , Agoritsas T , Alba AC , Guyatt G ((2014) ) How to use a subgroup analysis: Users’ guide to the medical literature. JAMA 311: , 405–411. |
[111] | Sun H , Vach W ((2016) ) A framework to assess the value of subgroup analyses when the overall treatment effect is significant. J Biopharm Stat 26: , 565–578. |

