
Quantification of Butyrylcholinesterase Activity as a Sensitive and Specific Biomarker of Alzheimer’s Disease
Abstract
Amyloid-β (Aβ) plaques are a neuropathological hallmark of Alzheimer’s disease (AD); however, a significant number of cognitively normal older adults can also have Aβ plaques. Thus, distinguishing AD from cognitively normal individuals with Aβ plaques (NwAβ) based on Aβ plaque detection is challenging. It has been observed that butyrylcholinesterase (BChE) accumulates in plaques preferentially in AD. Thus, detecting BChE-associated plaques has the potential as an improved AD biomarker. We present Aβ, thioflavin-S, and BChE quantification of 26 postmortem brain tissues; AD (n = 8), NwAβ (n = 6), cognitively normal without plaques (n = 8), and other common dementias including corticobasal degeneration, frontotemporal dementia with tau, dementia with Lewy bodies, and vascular dementia. Pathology burden in the orbitofrontal cortex, entorhinal cortex, amygdala, and hippocampal formation was determined and compared. The predictive value of Aβ and BChE quantification was determined, via receiver-operating characteristic plots, to evaluate their AD diagnostic performance using sensitivity, specificity, and area under curve (AUC) metrics. In general, Aβ and BChE-associated pathology were greater in AD, particularly in the orbitofrontal cortex. In this region, the largest increase (9.3-fold) was in BChE-associated pathology, observed between NwAβ and AD, due to the virtual absence of BChE-associated plaques in NwAβ brains. Furthermore, BChE did not associate with pathology of the other dementias. In this sample, BChE-associated pathology provided better diagnostic performance (AUC = 1.0, sensitivity/specificity = 100% /100%) when compared to Aβ (AUC = 0.98, 100% /85.7%). These findings highlight the predictive value of BChE as a biomarker for AD that could facilitate timely disease diagnosis and management.
INTRODUCTION
Alzheimer’s disease (AD) is the most common cause of dementia and its prevalence is predicted to dramatically rise over the next decades with concomitant substantial increases in social and economic burdens [1–3]. Efforts toward the development of disease-modifying interventions for AD have been hampered, in part, by the lack of an early and definitive diagnosis [4]. Currently, a definitive diagnosis of AD requires a clinical syndrome of dementia [5], confirmed by postmortem brain examination for the presence of amyloid-β (Aβ) plaques and tau neurofibrillary tangles (NFTs), two hallmarks of the disease [6–8].
In AD, the neocortex is one of the earliest areas for accumulation of Aβ pathology [9]. As Aβ deposition increases, the entorhinal region, insula, and hippocampal formation become involved. Eventually, other subcortical regions, such as the amygdala, basal ganglia, thalamus, and brainstem are affected. Thus, the progression of Aβ deposition occurs in an ‘outward-in’ direction [9], thereby offering the cerebral cortex as a prime region to target for early detection of AD pathology. Tau NFTs, on the other hand, are first detected in the transentorhinal cortex, progress to involve entorhinal and hippocampal regions, followed by neocortex of the fusiform and lingual gyri, then to neocortical association areas, and, in advanced stages, to primary cortex such as the striate cortex of the occipital lobe [10].
At present, three positron emission tomography (PET) imaging agents have been approved to visualize Aβ deposition in the human brain [11]. In addition, several experimental tau PET radiotracers are being explored as potential agents for AD diagnosis [12]. Although Aβ plaques and NFTs are considered hallmarks of AD, they are also found in the brains of up to 40% of cognitively normal older adults [13–16]. Therefore, other markers that are more indicative of AD, than Aβ or NFTs alone, are desirable to facilitate a more accurate diagnosis of this disease during life.
Butyrylcholinesterase (BChE) has a widespread distribution in the human body. In the brain it is found in glia, white matter, and specific populations of neurons in the amygdala and hippocampal formation [17], as well as the thalamus [18]. Although the functions of BChE have not been fully elucidated, it has been shown to be involved, along with acetylcholinesterase (AChE), as a co-regulator of cholinergic neurotransmission [19, 20]. Furthermore, BChE has been shown to be involved in a number of processes including drug metabolism [21], lipid metabolism [22], neurodevelopment [23], inflammation [24], diabetes mellitus [25], and cancer [26].
Changes in the cholinergic system have long been shown to be associated with AD [27–29]. Cholinesterases, in particular BChE, are also found to associate with Aβ plaques and NFTs in human AD brain tissue [30–36] as well as in Aβ plaques in AD mouse models [37–39]. Although the role of BChE in AD pathology has not been fully elucidated, it may be responsible for the maturation of these structures into presumed neurotoxic species, thus, leading to neurodegeneration and subsequent clinical manifestations of the disease [35, 36]. On the other hand, it has been suggested that BChE may attenuate plaque deposition [40]. However, when the BCHE gene is knocked out from an AD mouse model, there is reduction in fibrillar Aβ plaque deposition suggesting that this enzyme may be involved in accumulation of AD pathology [38, 39]. Thus, BChE may represent a specific marker indicative of AD pathology.
The present study was undertaken to confirm earlier qualitative reports [36], and extend these observations to provide quantitative data related to the association of BChE with AD pathology. Here we quantify BChE and Aβ plaque burden in cortical and subcortical regions of human postmortem AD brains and compare that with cognitively normal individuals with and without Aβ plaque pathology. In addition, we also examined whether BChE associates with pathology in other dementias to determine specificity of this enzyme for AD pathology. The present study aims to determine the suitability of BChE as a diagnostic and therapeutic target for AD and that visualization of this enzyme associated with AD pathology, using imaging techniques [41, 42], may offer a definitive diagnosis of the disease during life.
MATERIALS AND METHODS
Brain tissues
A total of 26 postmortem human brains were obtained from the Maritime Brain Tissue Bank (Halifax, Nova Scotia, Canada) after approval from the Nova Scotia Health Authority Research Ethics Board. These included brains from eight AD, six cognitively normal with amyloid plaques (NwAβ), eight cognitively normal without Aβ plaque pathology (herein referred to as normal), one corticobasal degeneration (CBD), one frontotemporal dementia with tau (FTD-tau), one dementia with Lewy bodies (DLB), and one vascular dementia (VaD) cases. These were compared with respect to Aβ plaque pathology detected by immunohistochemistry, fibrillary Aβ plaque pathology detected with thioflavin-S(Th-S) histofluorescence, and BChE-associated plaque pathology detected through histochemistry. Case demographics are summarized in Table 1. AD cases chosen were those with moderate to high Braak stages (IV-VI), as reported by the neuropathologist as well as with a clinical history consistent with AD, in order to have a high certainty of diagnostic accuracy. NwAβ cases had reported neuropathology, including the presence of Aβ plaques; however, no clinical indication of a dementing process was noted. All neuropathologically normal cases had no reported clinical history of dementia. Neuropathologically, the CBD brain showed neuronal loss with many of the remaining neurons demonstrating cytoplasmic chromatolysis (ballooned neurons). In addition, throughout both the grey and white matter, immunostaining with tau 4R antibodies revealed abundant tau-positive neuropil threads irregularly distributed and occasionally clustered. 4-Repeat isoform ED4 of tau (tau 4R) immunostaining showed many neurons with tau inclusions and abundant tau-positive neuropil threads. The FTD-tau brain exhibited scattered swollen neurons immunopositive for tau protein. Immunostaining with the 3-repeat isoform ED3 of tau (tau 3R) antibodies demonstrated a number of positive neuropil threads situated in all cortical layers. In the DLB brain, the cingulate cortex had several neurons containing cortical Lewy bodies which was confirmed with α-synuclein immunostaining. No NFTs or Pick bodies were seen with tau immunostaining and there was no Aβ deposition in vessels with immunostaining. In the hippocampus, there were α-synuclein positive dystrophic neurites (Lewy neurites). Lewy bodies were seen in the hypothalamus, the basal ganglia, nucleus basalis, thalamus, and subthalamus. In the brainstem, the substantia nigra showed moderate neuronal depletion with Lewy bodies in several remaining neurons. These observations were in keeping with neuropathological criteria for diffuse Lewy body disease [43]. The VaD brain demonstrated subcortical arteriopathy with extensive confluent areas of myelin pallor with ischemic changes that were confined to the white matter. There were no cortical infarcts, no neuritic plaques, and only scattered NFTs in the neocortex.
Table 1
Demographic data for Alzheimer’s disease (AD), cognitively normal with amyloid-β (Aβ) plaques (NwAβ), cognitively normal without Aβ plaques (normal), corticobasal degeneration (CBD), frontotemporal dementia with tau (FTD–tau), Dementia with Lewy bodies (DLB), and vascular dementia (VaD) human postmortem brain tissues
| Age (Y) | Sex | Braak Staging | |
| AD | 88 | M | 6 |
| 58 | M | 6 | |
| 72 | M | 4 | |
| 92 | F | 4 | |
| 86 | M | 6 | |
| 70 | F | 6 | |
| 84 | F | 6 | |
| 91 | F | 5 | |
| NwAβ | 69 | M | 2 |
| 61 | M | 1 | |
| 86 | F | 4 | |
| 63 | F | 1 | |
| 61 | F | 1 | |
| 71 | F | 1 | |
| Normal | 72 | M | 0 |
| 59 | M | 0 | |
| 63 | M | 0 | |
| 55 | M | 0 | |
| 80 | F | 1 | |
| 80 | F | 2 | |
| 59 | F | 0 | |
| 91 | M | 2 | |
| CBD | 74 | F | 2 |
| FTD-Tau | 89 | F | 1 |
| DLB | 69 | M | 1 |
| VaD | 82 | M | 3 |
Hemisected brains used in this study were immersion fixed in 10% formalin in 0.1 M phosphate buffer (pH 7.4; PB) at 4°C between 1.9–5 days, cryoprotected, and stored in PB containing 40% sucrose and 0.6% sodium azide. Blocks of tissue from the orbitofrontal cortex, amygdala, hippocampal formation, and entorhinal cortex were removed and cut into 50 μm coronal sections using a Leica SM2000R microtome (Leica Microsystems Inc., Nussloch, Germany) with a Physitemp freezing stage and PFS 30TC controller (Physitemp Instruments, Inc., Clifton, NJ). Adjacent brain tissue sections from all brains (5 sections/stain/region of interest) were stained using histochemical techniques for BChE activity, thioflavin-S histofluorescence that stains fibrillar β-sheets, or Aβ immunohistochemistry using an antibody specific for 4 to 5-kDa amyloid peptide [44]. Brain tissue sections from non-AD neurodegenerative disorders were also stained using immunohistochemical techniques for corresponding neuropathological hallmarks, including tau antibodies, corresponding to amino acids 209–224 of tau 3R (CBD) and amino acids 275–291 of 4R (FTD-tau), and an α-synuclein antibody (DLB).
Butyrylcholinesterase histochemistry
BChE histochemical staining was performed using a modified Karnovsky-Roots method [34, 45]. All reagents were purchased from Sigma-Aldrich (St. Louis, MO). The substrate used for visualization of BChE activity was butyrylthiocholine, where AChE activity was inhibited by BW 284C 51 (1,5-bis [4-allyl dimethylammonium phenyl] pentan- 3-one dibromide). Briefly, tissue sections were rinsed in 0.1 M maleate buffer (MB, pH 7.4) for 30 min then quenched in 0.15% hydrogen peroxide in MB for 30 min and rinsed in MB for an additional 30 min. Sections were incubated between 1.75 to 3.5 h, depending on the fixation time of individual cases, in 0.1 M MB (pH 6.8) containing 0.5 mM sodium citrate, 0.47 mM cupric sulfate, 0.05 mM potassium ferricyanide, 0.8 mM butyrylthiocholine iodide, and 0.01 mM BW 284C 51. All sections were rinsed for 30 min in distilled water (dH2O) and placed in 0.1% cobalt chloride solution in dH2O for 10 min. Following another rinse in dH2O sections were placed in 0.1 M PB containing 1.39 mM 3,3’-diaminobenzidine tetrahydrochloride (DAB). After 5 min, 50 μL of 0.15% hydrogen peroxide in dH2O was added per mL of DAB solution and the reaction was carried out for approximately 5 min. Sections were then washed in 0.01 M acetate buffer (pH 3.3), mounted on slides, coverslipped, and examined with brightfield microscopy. In control experiments, no staining occurred when substrate was omitted. Specificity of this method for BChE has been demonstrated previously [34].
Thioflavin-S histofluorescence
Brain tissues were rinsed in 0.1 M PB (pH 7.4) for 30 min, 0.15% hydrogen peroxide in PB for 30 min and rinsed again in PB. Sections were mounted onto glass slides, air-dried overnight, rehydrated in dH2O, dehydrated in a series of ethanol washes, cleared in xylene, and rinsed in 50% ethanol. The mounted sections were placed in a 0.05% Th-S (T1892, Sigma-Aldrich, St. Louis, MO) in 50% ethanol solution and were incubated overnight (16 h) at room temperature. Sections were rinsed in 80% ethanol and coverslipped with an aqueous mounting medium.
Immunohistochemistry
Standard immunohistochemical staining procedures were performed using primary antibodies to detect for Aβ (polyclonal rabbit anti-Aβ; 1 : 400; 71–5800, Life Technologies, Rockford, IL), tau 3R (monoclonal mouse anti-tau, 3-repeat isoform RD3, clone 8E6/C11; 1 : 1000; 05–803, Millipore, Temecula, CA), tau 4R (monoclonal mouse anti-tau, 4-repeat isoform RD4, clone 1E1/A6; 1 : 1000; 05–804, Millipore, Temecula, CA), and Lewy body (monoclonal mouse anti-α-synuclein; 1 : 200; 18–0215, Life Technologies, Frederick, MD) deposits.
Briefly, sections were rinsed in 0.1 M PB (pH 7.4) for 30 min. Sections to be stained for Aβ and tau isoforms were rinsed for 5 min in 0.05 M PB followed by a final rinse in dH2O for 15 min. These sections were gently agitated in 95% formic acid for 2 min to improve Aβ and tau immunohistochemical staining and were subsequently rinsed 5 times in dH2O for 1 min each and twice in 0.1 M PB for 15 min. All sections were placed in 0.3% hydrogen peroxide in 0.1 M PB for 30 min to quench endogenous peroxidase activity and rinsed again for 30 min in PB. Sections to be stained for α-synuclein were incubated in 0.01 M citrate buffer at 80°C for 30 min to improve staining. All sections were then incubated in 0.1 M PB containing 0.1% Triton X-100, normal goat serum (1 : 100), and primary antibody overnight (16 h) at room temperature. After rinsing with 0.1 M PB for 30 min, sections were incubated in PB with 0.1% Triton X-100, the corresponding secondary antibody (1 : 500), and normal goat serum (1 : 1000) for 1 h at room temperature. Tissues were rinsed in PB, then placed in PB with 0.1% Triton X-100 and Vectastain Elite ABC kit (1 : 182; PK-6100, Vector Laboratories, Burlingame, CA), according to the manufacturer’s instructions, for 1 h at room temperature. Sections were rinsed and developed in a solution of in 0.1 M PB containing 1.39 mM DAB. After 5 min, 50 μL of 0.3% hydrogen peroxide in dH2O was then added per mL of DAB solution. The sections were incubated for 5 min and the reaction was stopped by rinsing the sections in 0.01 M acetate buffer (pH 3.3). In control experiments, no staining was observed when the primary antibody was omitted.
Data analysis
All microscopes used in this study were located in the Cellular Microscopy and Digital Imaging CORES facility at Dalhousie University. Sections to be analyzed for plaque load quantification were photographed using a Zeiss Axio Imager Z2 microscope with a Zeiss Axiocam HRc digital camera and AxioVision 4.8 software (Carl Zeiss Canada Ltd., Toronto, Canada). Separate images within each brain section were stitched together using the AxioVision 4.8 software. Remaining slides were photographed using a Zeiss Axioplan 2 motorized microscope with a Zeiss Axiocam HRc digital camera using AxioVision 4.6 software (Carl Zeiss Canada Ltd., Toronto, Canada). These images were assembled using Adobe Photoshop (CS 5 version 12.0) and the brightness of images was adjusted to match the background of different images.
Stained plaque loads were quantified using National Institutes of Health ImageJ 1.51 g software and recorded as a percentage of the total area as described previously [37–39, 46]. Gray-scale images of adjacent sections stained for Aβ, Th-S, and BChE activity were taken throughout the orbitofrontal cortex, amygdala, hippocampal formation, and entorhinal cortex. The color of Th-S images was inverted for quantification. An intensity threshold level was set such that positive staining, but not background, was selected. Three of the authors, in a blinded independent fashion, assessed and arrived at a consensus for a suitable threshold for each brain section. Regions of interest were used to define boundaries for orbitofrontal cortex, entorhinal cortex, amygdala, and hippocampal formation in each tissue section and the plaque burden, defined by the percentage of area covered by Aβ, Th-S, or BChE-associated plaque pathology, was measured and averaged for each brain and compared.
Statistical analysis
Comparison of mean Aβ, Th-S, and BChE plaque loads between groups (normal, NwAβ, and AD) were performed for each brain region via a one-way analysis of variance (ANOVA) followed by Tukey honest significant difference post-hoc tests. Significant differences between individual groups were concluded at a level of p < 0.0167 (Bonferroni correction after multiple (three) comparisons). Significant differences are denoted as follows: *p < 0.0167; **p < 0.01; ***p < 0.001; ****p < 0.0001. Intra-group comparisons of plaque burden between structures were also made by one-way ANOVA. The ratio of BChE to Aβ was compared in each brain structure between NwAβ and AD groups using a two-tailed independent samples t-test, assuming unequal variances with significance level of p < 0.05. Significant differences were denoted with ** for p < 0.01. All statistical comparisons were performed using SPSS (SPSS IBM, Inc.).
To determine the diagnostic performance of Aβ, Th-S, and BChE plaque load metrics for AD, receiver-operating characteristic (ROC) plots [47] were generated using clinical [5] and neuropathological [7] criteria as the gold standard. True- and false-positive/negative classifications were assigned to the range of values for each quantification metric (Aβ, Th-S, and BChE) and ROC curves (sensitivity versus 1-specificity) were generated and compared. The area under the curve (AUC) is a common summary measure of a diagnostic test’s performance, interpreted as the average sensitivity for all possible values of specificity [47]. AUC represents the overall performance and diagnostic accuracy of a test, with values approaching 1 indicating perfect accuracy. The optimal cutoff value of each quantification metric was determined from the ROC curve and corresponding diagnostic sensitivities and specificities were determined (Table 2). ROC analysis was performed using SPSS (SPSS IBM, Inc.) and fitted ROC curves were generated using ROC-KIT ROC analysis software[48, 49].
Table 2
Receiver-operating characteristic (ROC) and area under the curve (AUC) analysis of amyloid-β (Aβ), thioflavin-S (Th-S), and butyrylcholinesterase (BChE) associated pathology in the orbitofrontal cortex in predicting confirmed neuropathological diagnosis (gold standard)
| Plaque Burden | AUC | % Area with | Sensitivity (%) | Specificity (%) |
| pathology cut-off | ||||
| Aβ | 0.98±0.02 | 10.5 | 100.0 | 85.7 |
| Th-S | 0.99±0.01 | 0.5 | 100.0 | 92.9 |
| BChE | 1.00±0.00 | 5.8 | 100.0 | 100.0 |
RESULTS
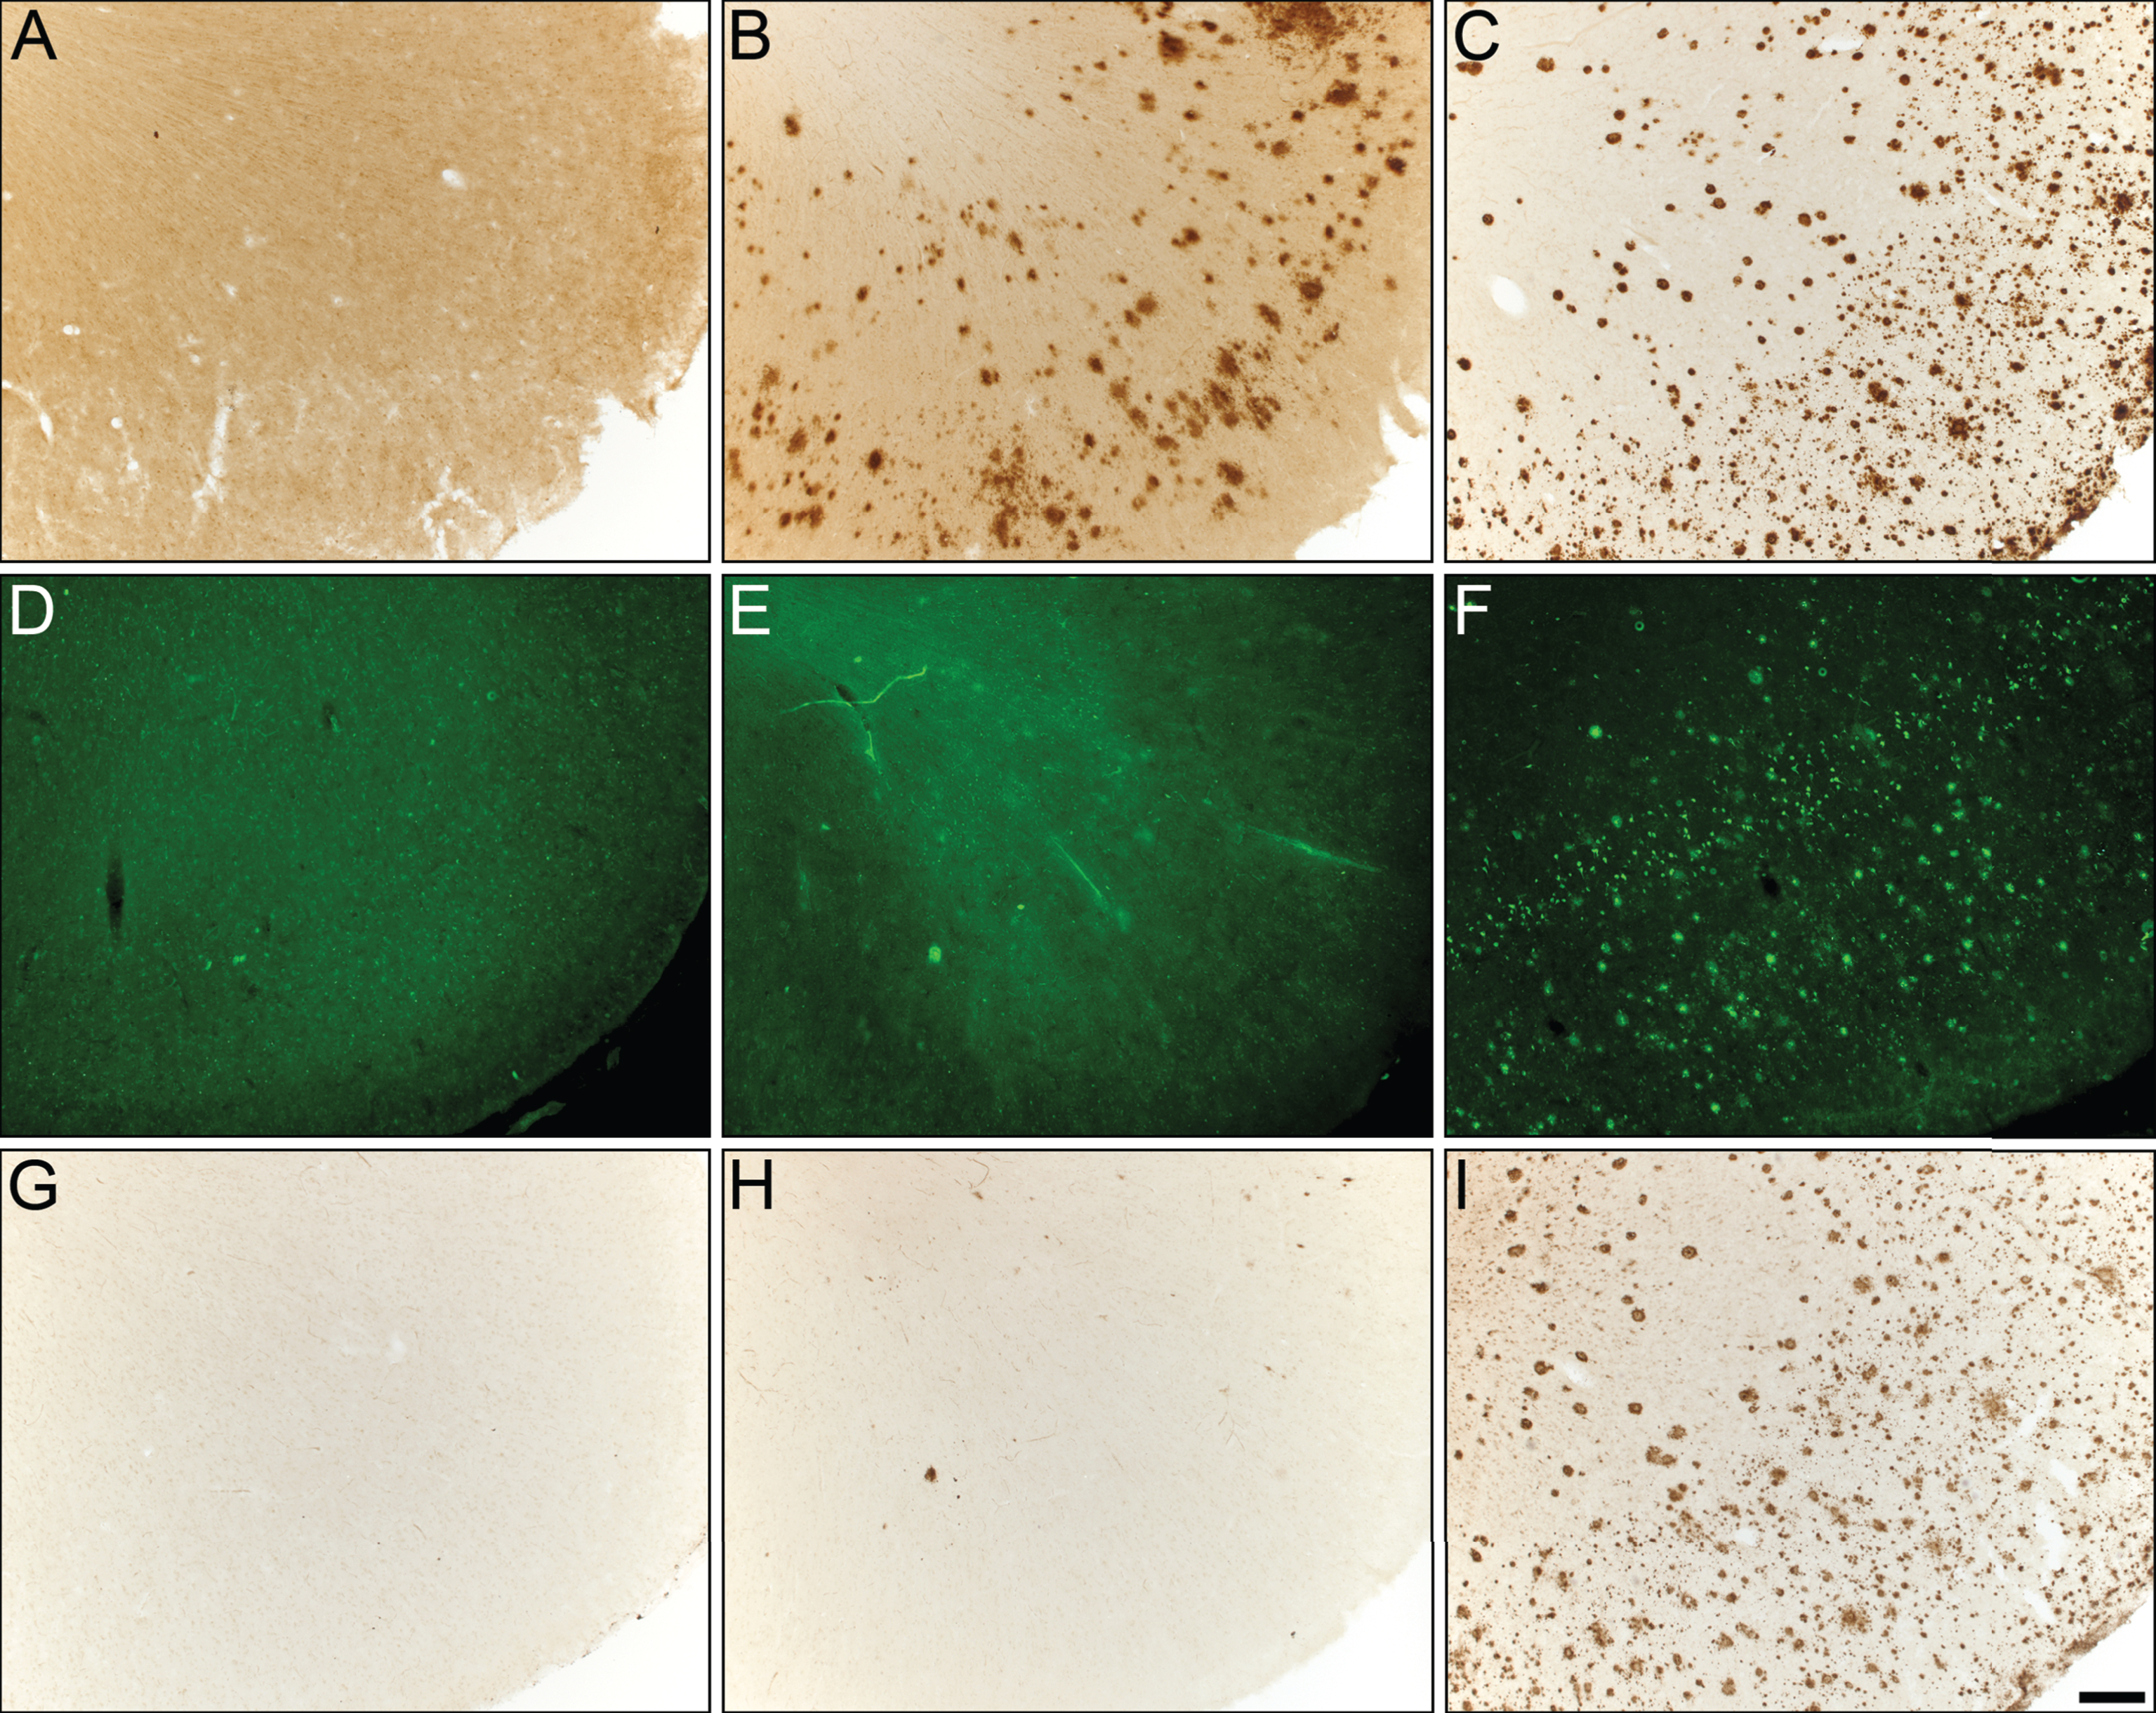
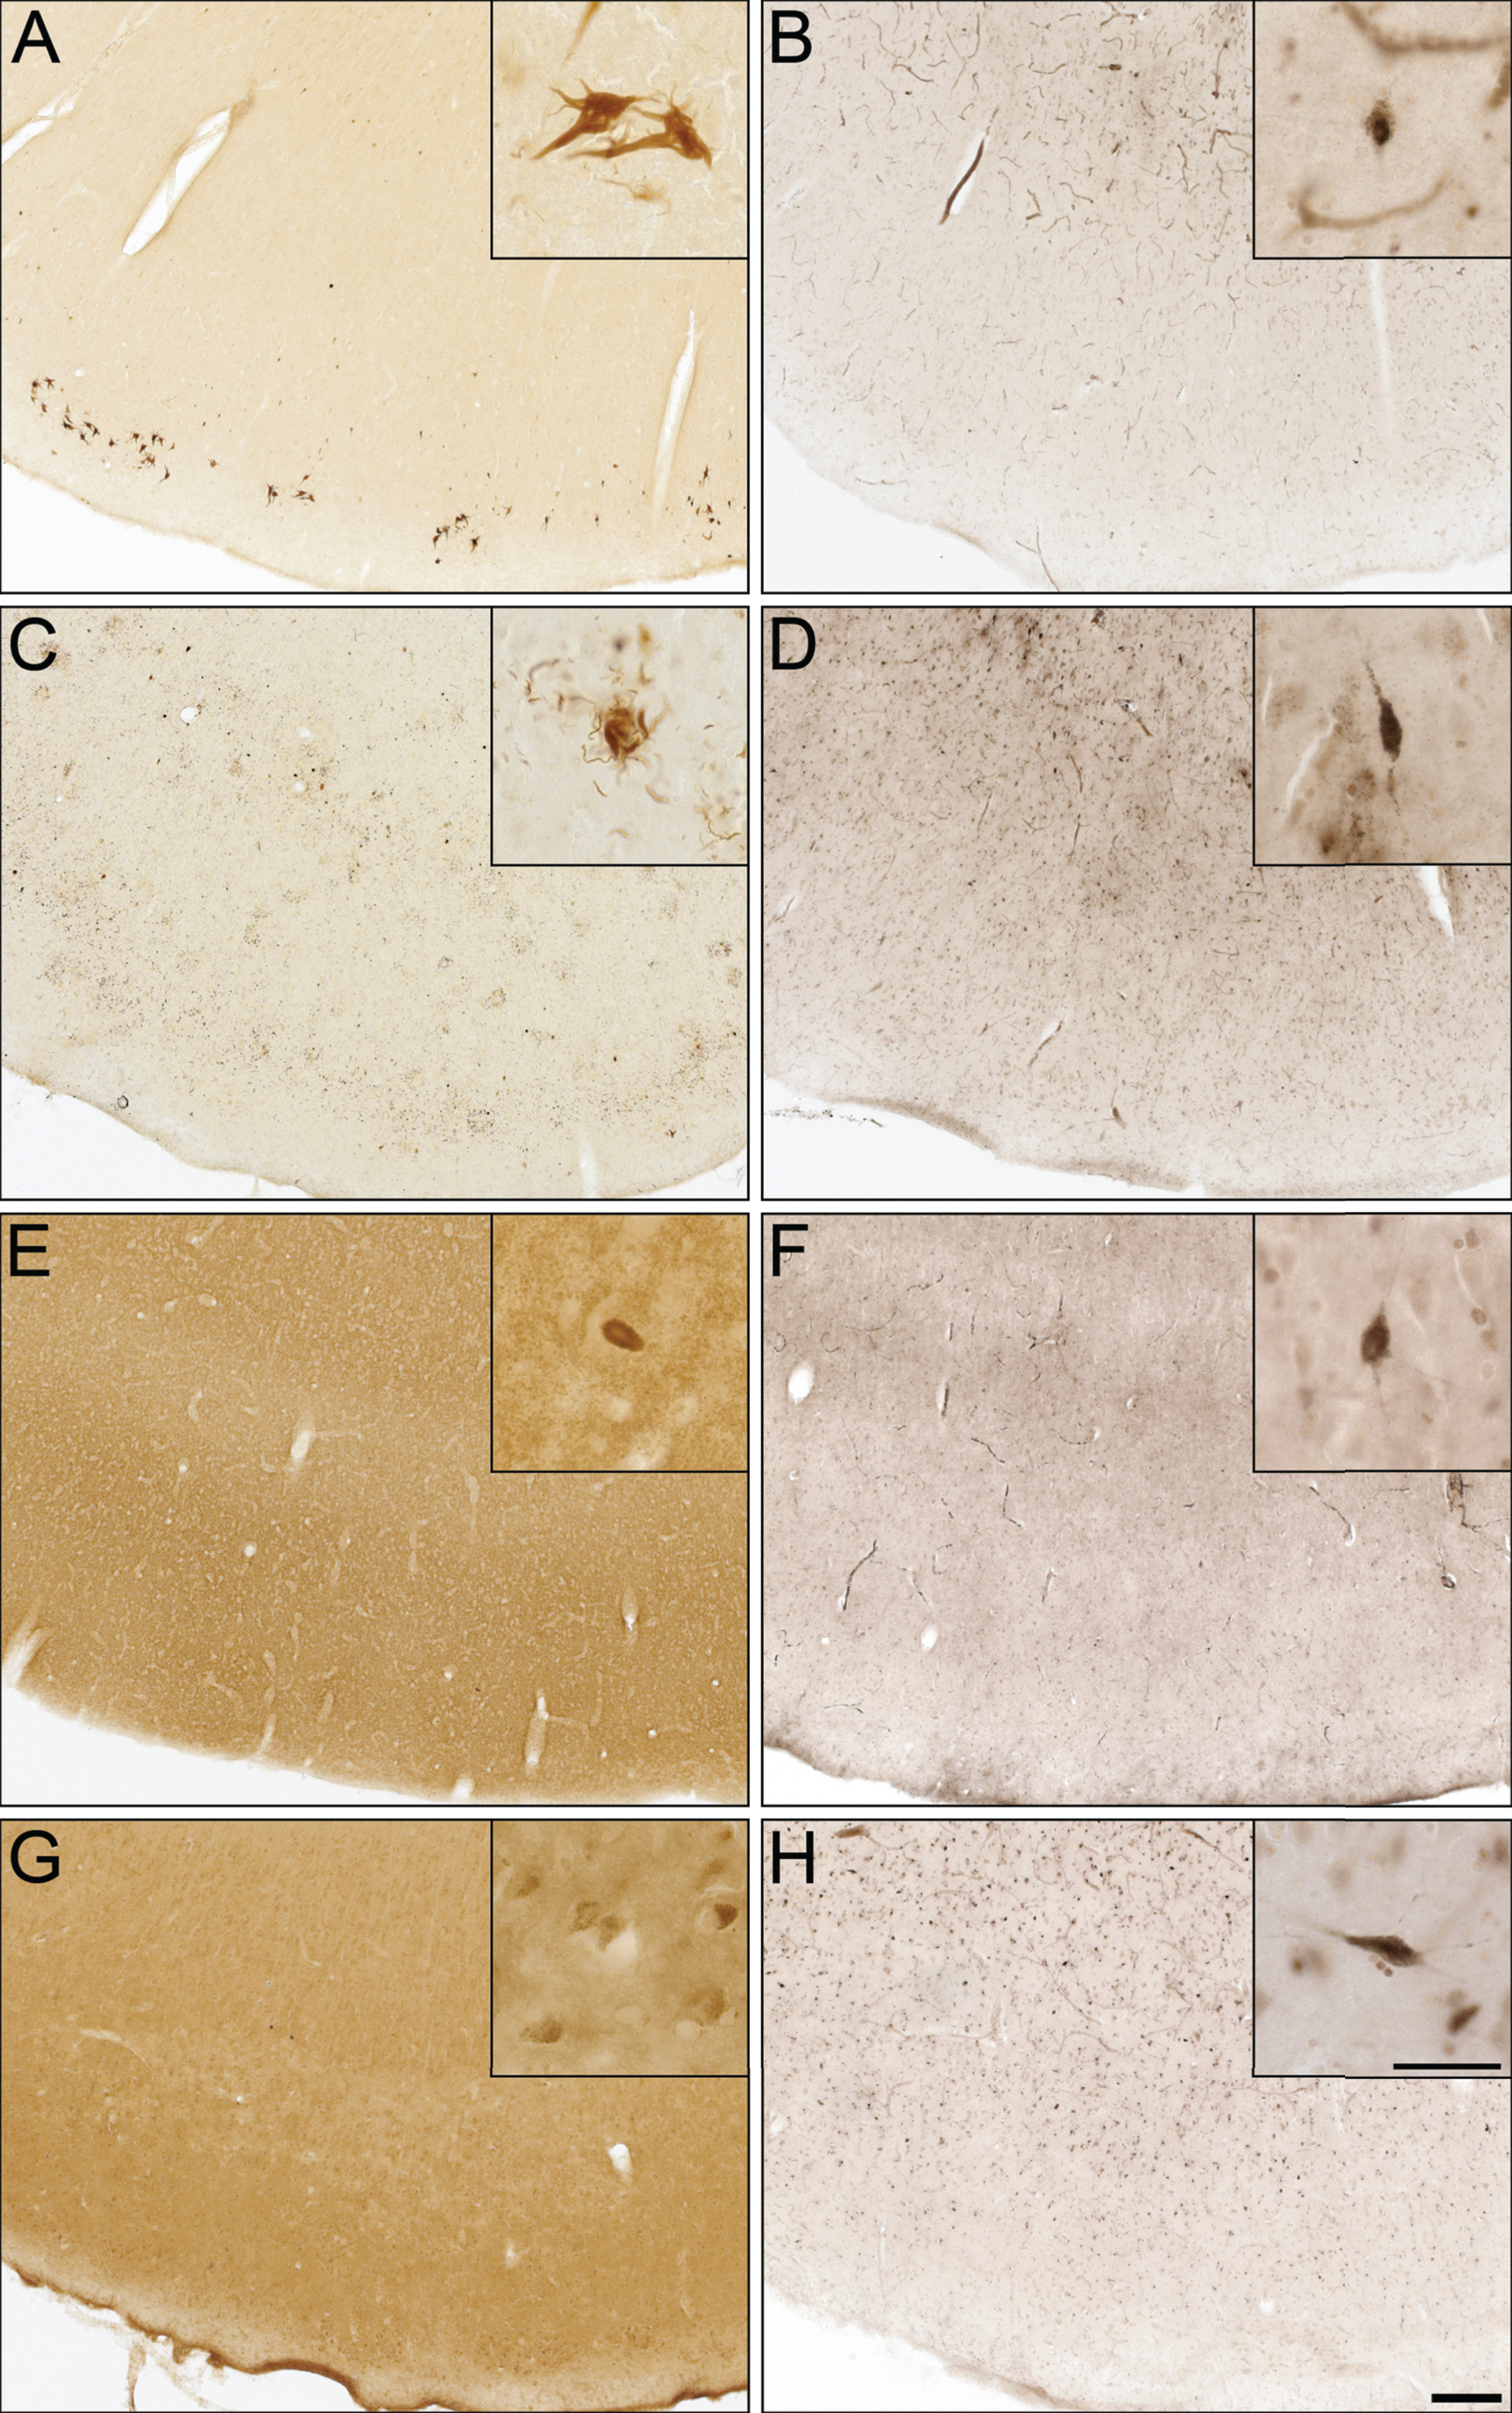
In the present study, three staining approaches involving Aβ, Th-S, and BChE were used to examine pathology abundance in normal, NwAβ, and AD brains (Fig. 1). Areas of the brain examined included the orbitofrontal cortex, entorhinal cortex, amygdala, and hippocampal formation, regions commonly affected in AD.
Fig.1
Photomicrographs of postmortem human orbitofrontal cortex from normal (A,D,G), cognitively normal with Aβ plaques (NwAβ, B,E,H), and AD (C,F,I) brains stained for amyloid-β (A,B,C), thioflavin-S (D,E,F), and butyrylcholinesterase (BChE, G,H,I). Note, no BChE staining in normal orbitofrontal cortex (G), paucity of BChE activity associated with NwAβ brain pathology (H), and significant BChE activity in AD (I). Scale bar for all frames (A-I) = 250 μm.
Amyloid-β immunohistochemistry
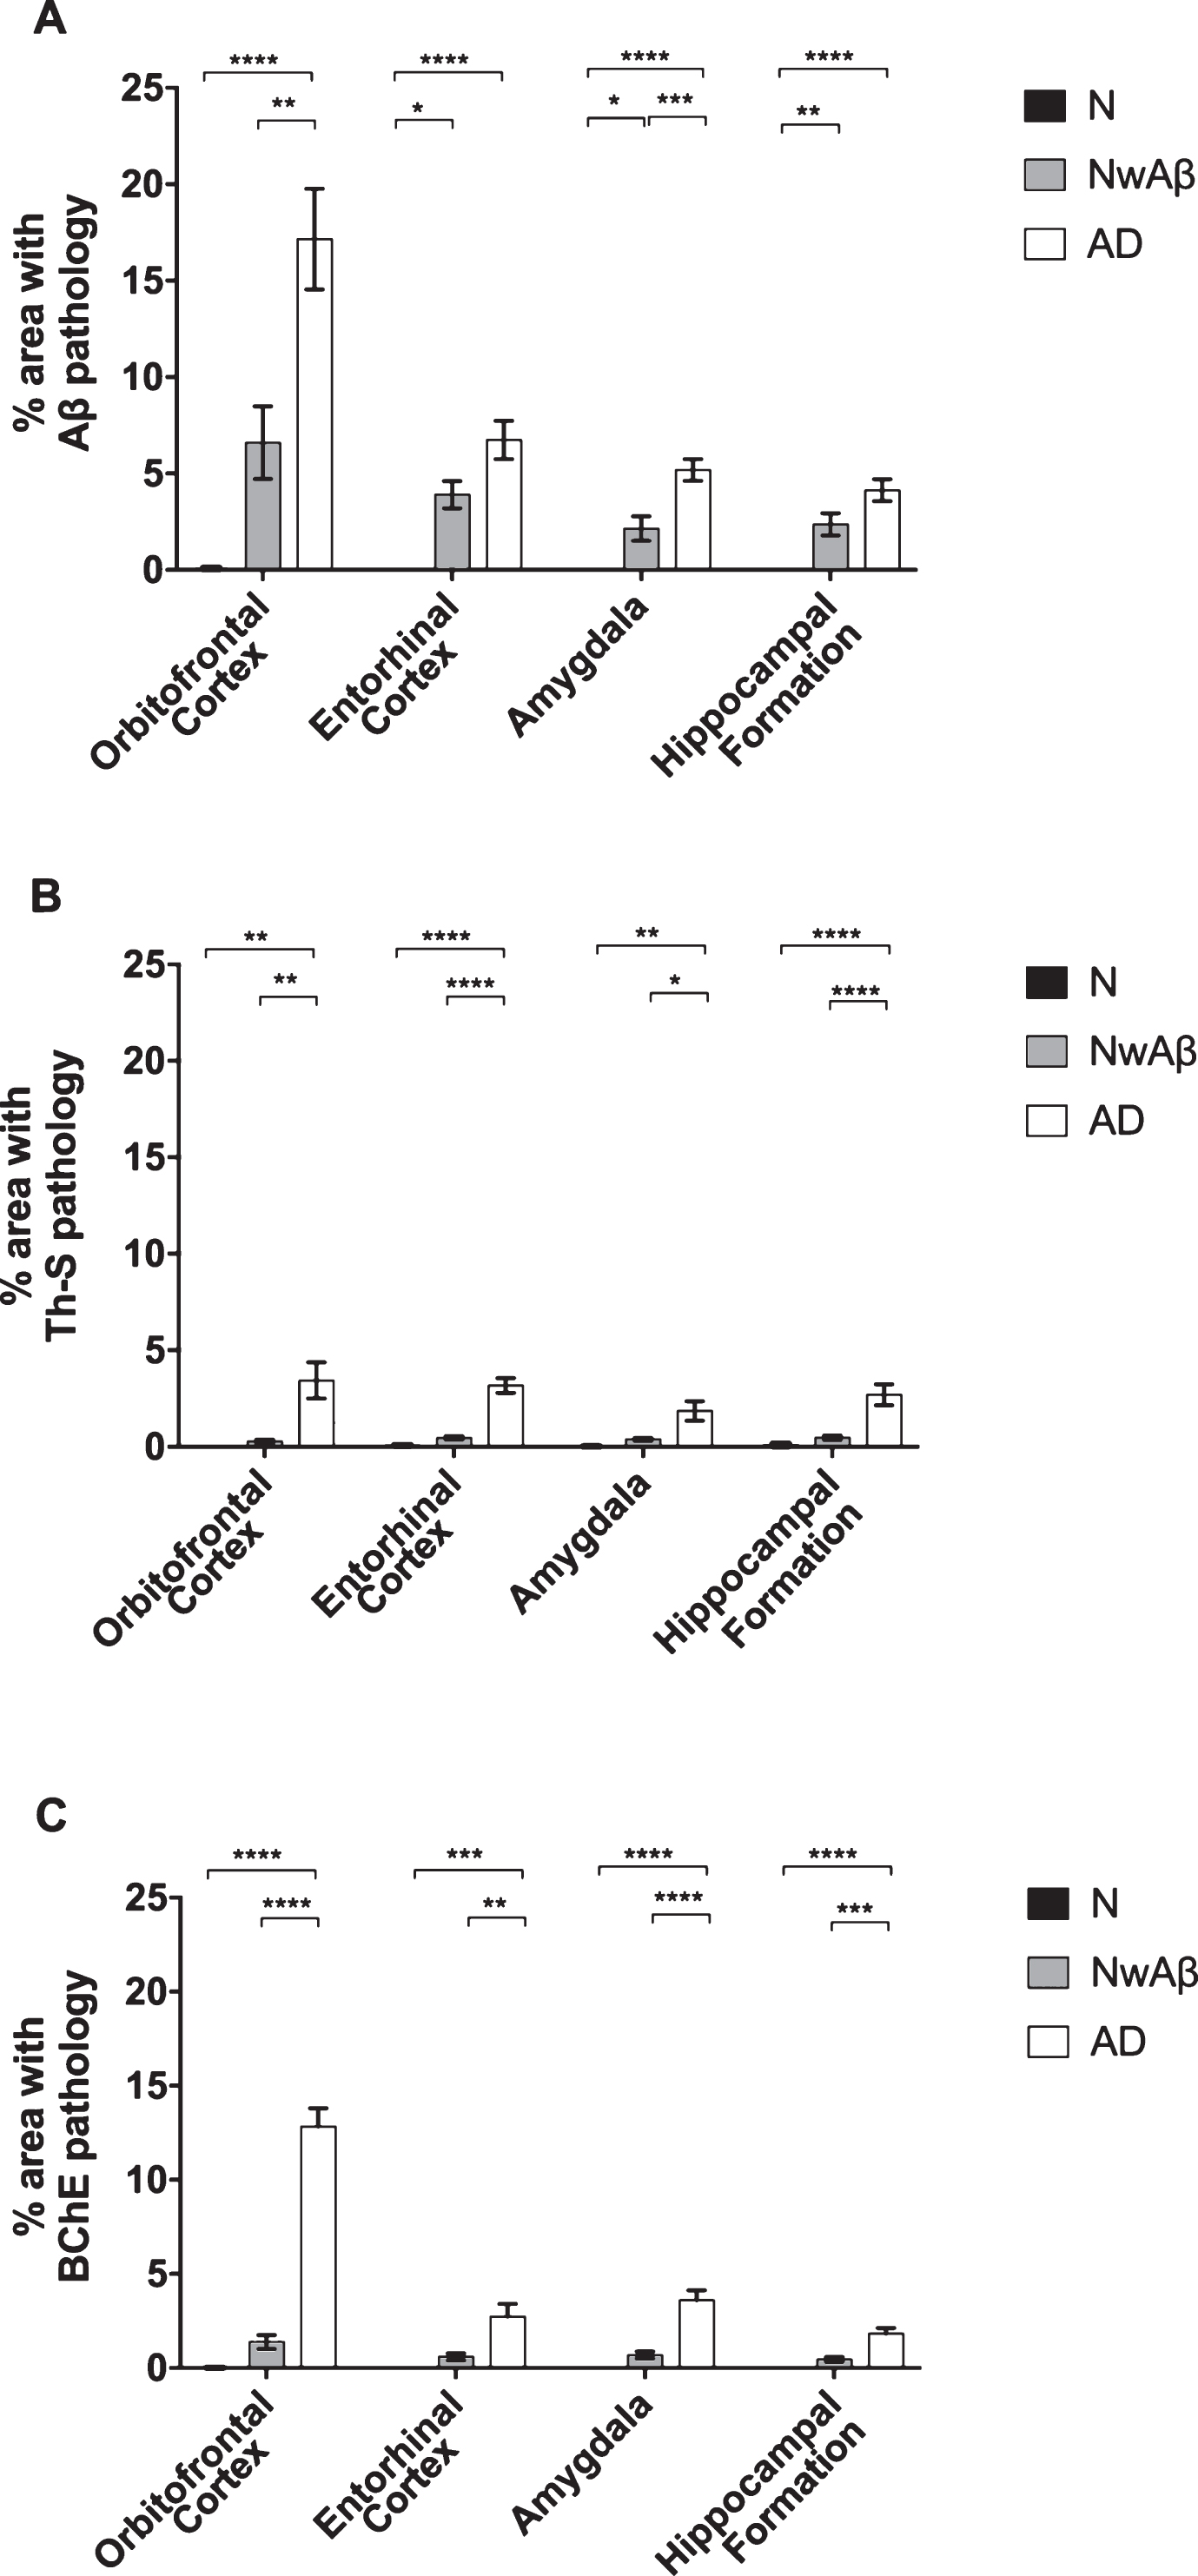
All AD and NwAβ brains stained with Aβ antibody showed plaques (Figs. 1 and 2). In the normal brains, the orbitofrontal cortex showed scant Aβ deposition (0.08%) that did not meet neuropathological criteria for AD while the entorhinal cortex, amygdala, and hippocampal formation demonstrated no plaque pathology (Fig. 2). In AD, significantly greater Aβ was present in the orbitofrontal cortex and amygdala compared to the NwAβ group (p < 0.0001) representing a 3.6- and 2.2-fold increase, respectively. However, no detectable differences in plaque burden were observed in the entorhinal cortex or hippocampal formation between the AD and NwAβ groups (Fig. 2). In NwAβ brains, all brain regions had significantly greater Aβ plaque load than normal brains (p < 0.0001), except for the orbitofrontal cortex in which a slight elevation of Aβ in normal brains (5 of 8 cases) rendered statistical comparisons not significant (Fig. 2). Importantly, within AD, the single greatest Aβ plaque burden level was in the orbitofrontal cortex (17.2%), whereas plaque loads in entorhinal cortex, amygdala, and hippocampal formation (range of 4.13–6.74%) were not significantly different from one another (separate ANOVA analysis, not shown).
Fig.2
Comparisons of percentage area covered by amyloid-β (Aβ; A), thioflavin-S (Th-S; B), or butyrylcholinesterase (BChE; C) pathology in the orbitofrontal cortex, entorhinal cortex, amygdala, and hippocampal formation of normal, cognitively normal with Aβ plaques (NwAβ), and Alzheimer’s disease (AD) brains. A) In AD, significantly greater Aβ was present in the orbitofrontal cortex and amygdala compared to NwAβ brains, whereas the entorhinal cortex and hippocampal formation were not significantly different between AD and NwAβ. B) Th-S pathology occupied considerably less percentage of area in each of the brain regions compared to those stained for Aβ or BChE. However, Th-S pathology burden in AD was significantly greater than NwAβ brains. C) In normal and NwAβ brains, the presence of BChE was negligible. In AD, BChE-associated pathology burden was significantly greater in all regions analyzed when compared to NwAβ, especially in the orbitofrontal cortex with a nearly 9.3-fold increase observed. Significant differences (Bonferroni correction after multiple comparisons) are denoted as follows: *p < 0.0167; **p < 0.01; ***p < 0.001; ****p < 0.0001.
Thioflavin-S histochemistry
All AD and NwAβ brains demonstrated Th-S-positive pathology (Figs. 1 and 2). Overall, the area covered by Th-S stained plaques was considerably lower compared to Aβ and BChE staining in all cases examined. Sections from the normal brains showed no observable plaque pathology. In AD, significantly greater Th-S plaque burden was present in the orbitofrontal cortex, entorhinal cortex, amygdala, and hippocampal formation compared to their NwAβ counterparts (p < 0.01, p < 0.0001, p < 0.0167, p < 0.01, respectively; Fig. 2). In comparison to normal, NwAβ brains in all four brain regions investigated were not significantly different (Fig. 2).
Butyrylcholinesterase histochemistry
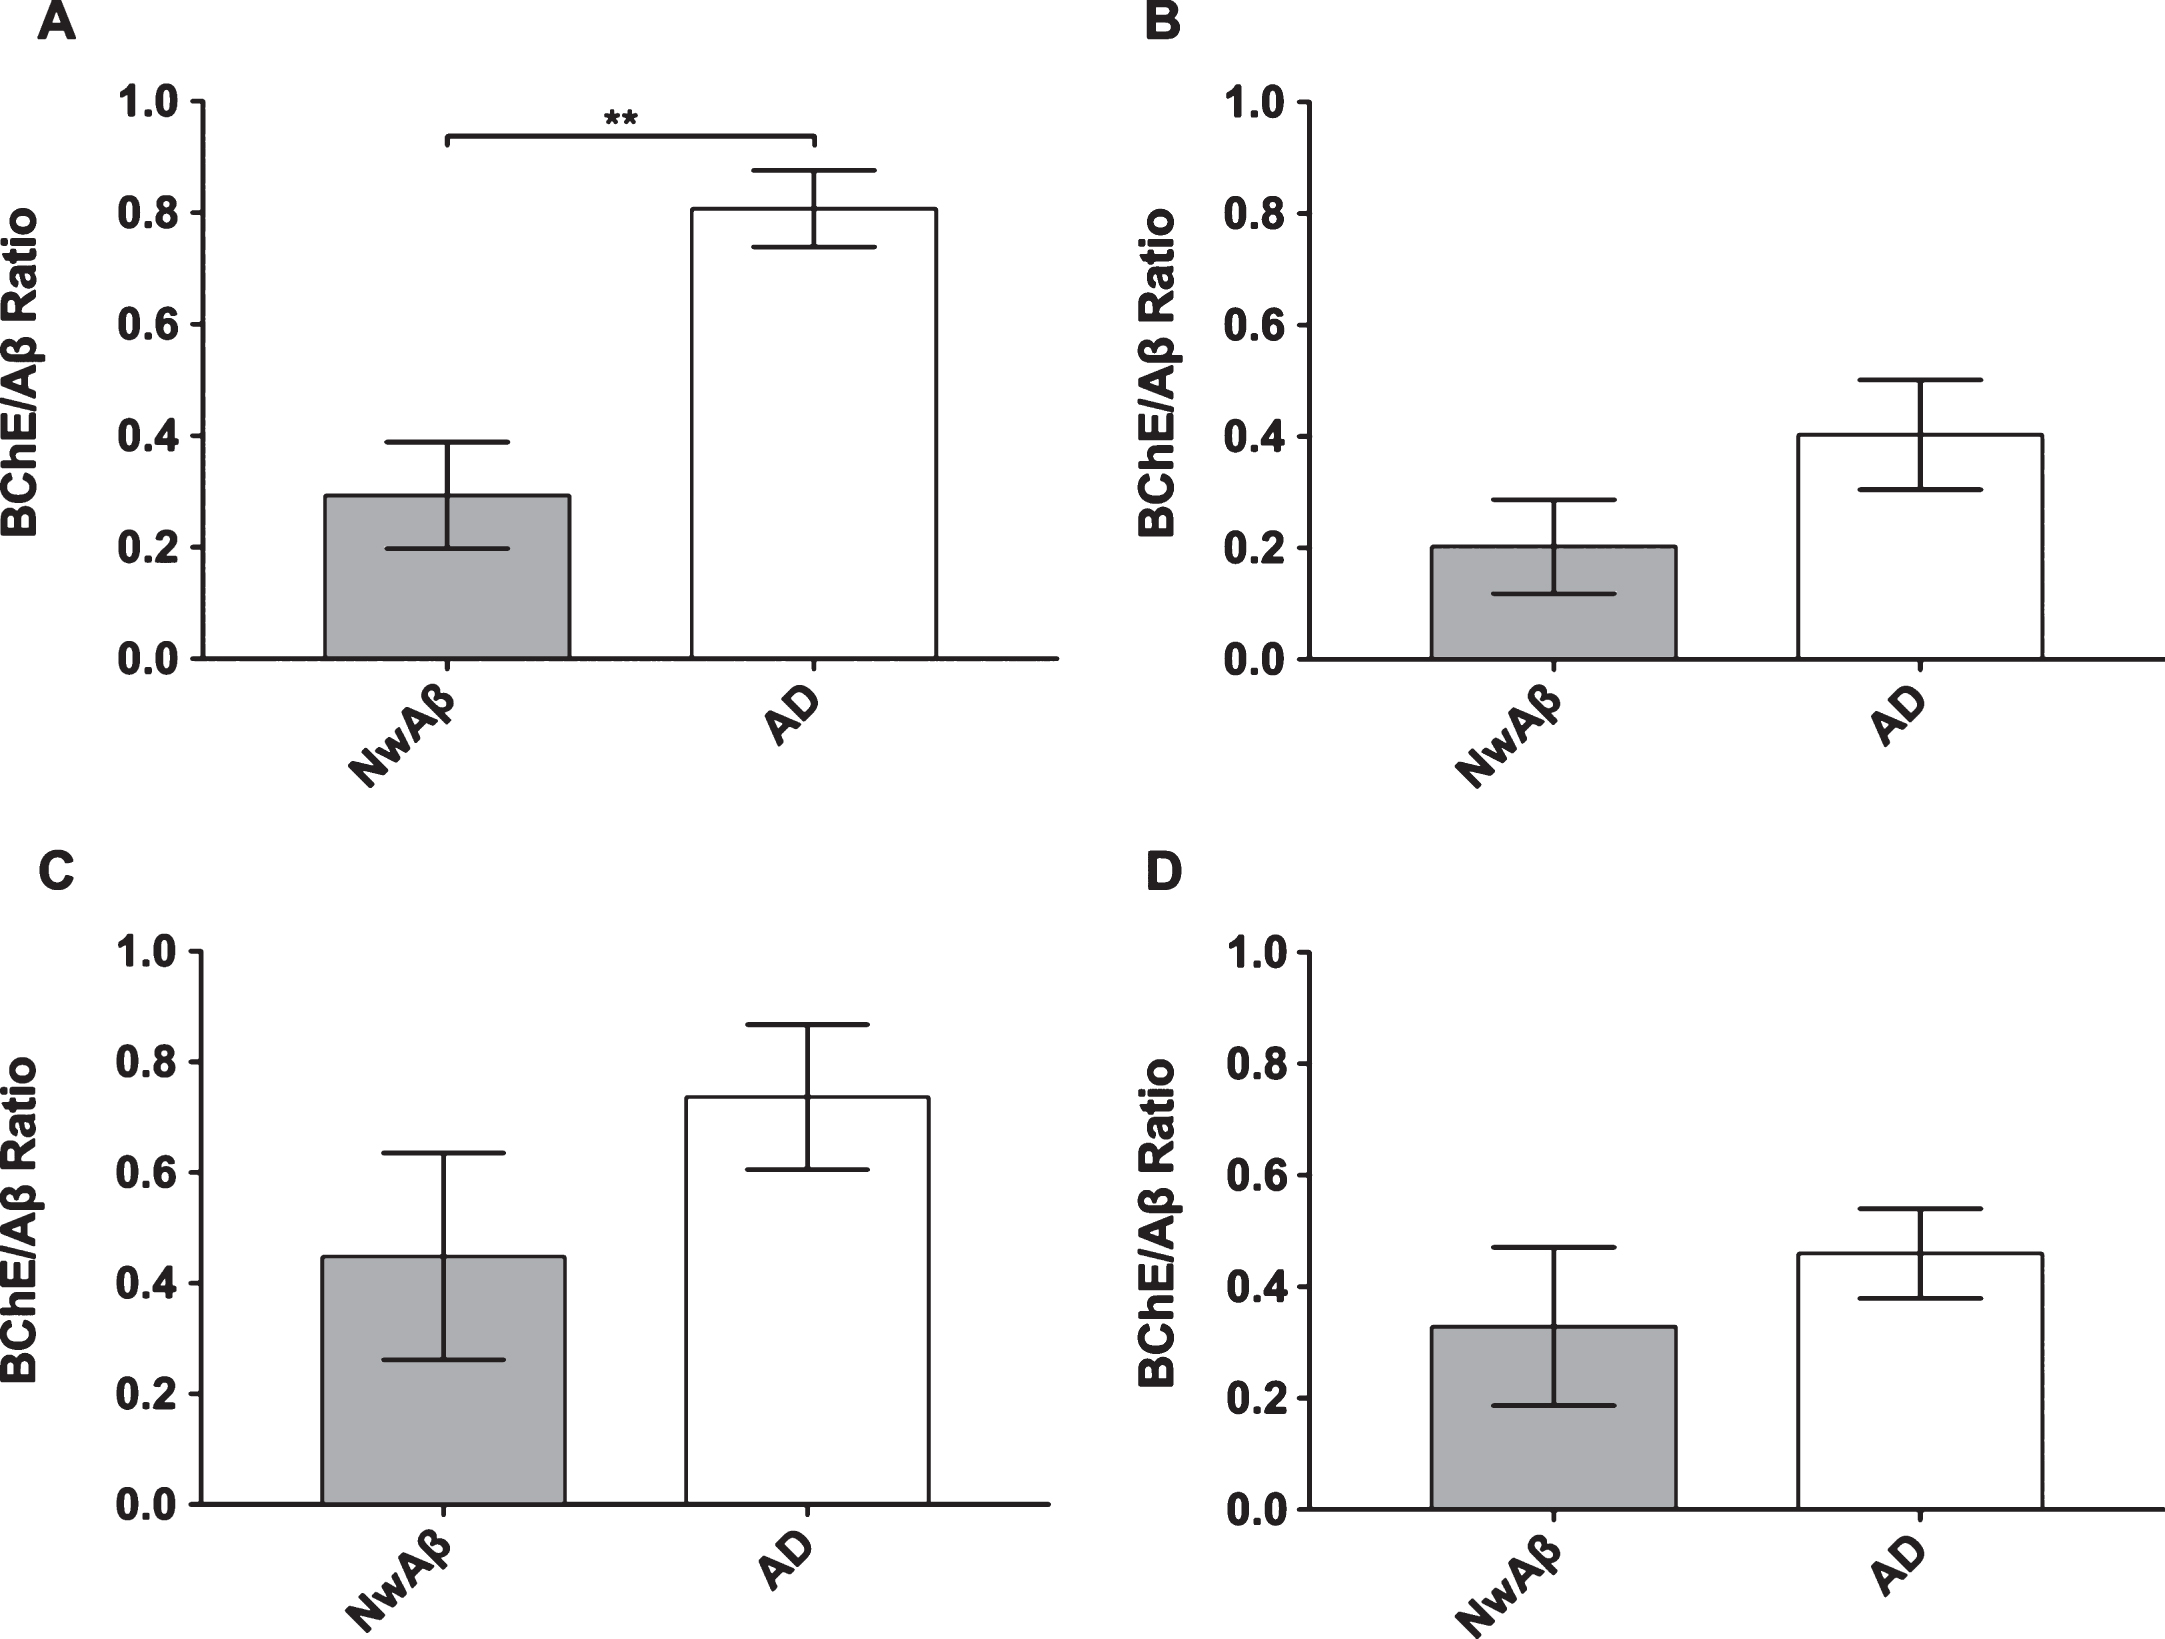
BChE histochemistry demonstrated minimal staining in the orbitofrontal cortex and no staining of plaques in the entorhinal cortex, hippocampal formation, and amygdala in the normal brains. Scant BChE-associated plaques were also observed in NwAβ brains and no statistically significant differences were observed between NwAβ and normal brains (Fig. 2). In AD, significantly greater BChE-associated pathology was present in the orbitofrontal cortex, entorhinal cortex, amygdala, and hippocampal formation compared to the NwAβ group (p < 0.01), representing a 9.3-fold increase in the orbitofrontal cortex and a range of 4.0–5.3-fold difference in the other structures investigated (Fig. 2). Though concomitant increases in BChE and Aβ plaque loads were observed in the orbitofrontal cortex in AD compared to NwAβ, the relative proportion of BChE to Aβ pathology was markedly increased in the AD brain (Fig. 3). In the orbitofrontal cortex, the ratio of BChE to Aβ increased from 0.29 to 0.81, representing a 2.8-fold increase in AD compared to NwAβ brains (p < 0.01) (Fig. 3A). The relative proportion of BChE to Aβ remained relatively constant in the entorhinal cortex, amygdala, and hippocampal formation of NwAβ and AD brains and no statistically significant differences were observed in these structures (Fig. 3B-D). This demonstrates that BChE activity is greatly increased in the AD brain compared to NwAβ.
Fig.3
Ratio of percentage of area covered by butyrylcholinesterase (BChE) to amyloid-β (Aβ) stained pathology in the orbitofrontal cortex (A), entorhinal cortex (B), amygdala (C), and hippocampal formation (D) of cognitively normal with Aβ (NwAβ) and Alzheimer’s disease (AD) brains. Note, AD brains had a much greater ratio compared to NwAβ demonstrating that BChE activity is greatly increased in the AD brain compared to NwAβ. **Denotes statistically significant difference (p < 0.01).
Receiver-operating characteristic plots
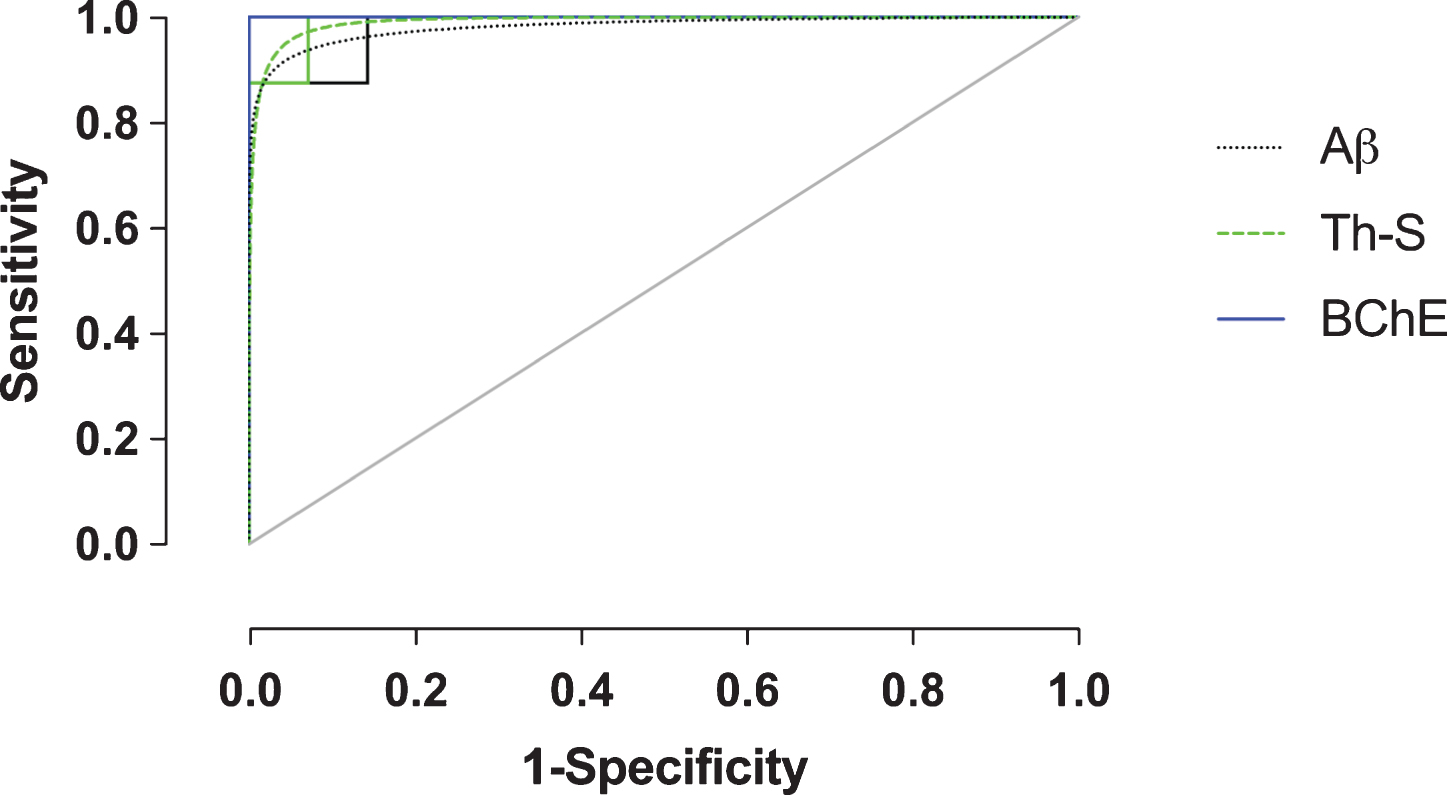
In order to evaluate Aβ, Th-S, and BChE quantification methods as predictive metrics for the correct classification of AD, ROC analysis was performed on the orbitofrontal cortex, the region shown to provide the greatest pathological changes when comparing NwAβ to AD brains. True- and false-positive/negative classifications were assigned in an iterative fashion to the range of values for each stain metric and were compared in ROC space (Fig. 4). ROC-AUC values reflect the diagnostic performance of each of these stains and while all values are greater than 0.90, BChE-stained plaque burden provides an accuracy with an AUC of 1.0 (Table 2). Positive/negative cutoffs (percentage of area with pathology) were determined for each stain from the ROC curve which optimized values of sensitivity (true positive fraction— the percent of cases correctly classified as AD) and specificity (true negative fraction— the percent of cases correctly classified as not AD). The cut-offs for percent area with pathology were identified as 10.5%, 0.5%, and 5.8% for Aβ, Th-S, and BChE, respectively, and with corresponding sensitivity/specificity values of 100% /85.7% (Aβ), 100% /92.9% (Th-S), and 100% /100% (BChE) (Table 2). BChE burden was the quantification metric that provided the best diagnostic performance in this study.
Fig.4
Receiver-operating characteristic (ROC) plot (sensitivity versus 1-specificity) of amyloid-β (Aβ), thioflavin-S (Th-S), and butyrylcholinesterase (BChE) quantification metrics of the orbitofrontal cortex. Empirical data shown as solid lines and fitted curves as dashed lines of the same color. Chance association shown as diagonal line indicates no discriminative capability of a diagnostic test. The area under the curve (AUC) serves as a summary measure of the diagnostic performance of each metric. BChE showed high diagnostic accuracy. See Table 2 for a complete list of ROC summary measures.
Butyrylcholinesterase histochemistry in other neurodegenerative disorders
To determine whether BChE associates with pathologies in other neurodegenerative disorders, cases from CBD, FTD-tau, DLB, and VaD were examined (Fig. 5), because of potential clinical overlap with AD [50]. CBD and FTD-tau cases were stained for specific tau isoforms (3R and 4R, respectively) and demonstrated the presence of NFTs (Fig. 5A), neuropil threads, and degenerating neurites (Fig. 5C). The DLB case was stained for α-synuclein and demonstrated the presence of Lewy bodies (Fig. 5E). The VaD case was devoid of Aβ and Th-S plaques. However, intraneuronal deposits were noted in Aβ staining (Fig. 5G), as previously described [51]. None of these cases demonstrated BChE staining associated with their respective pathologies (Fig. 5B, D, F, and H).
Fig.5
Photomicrographs of postmortem human entorhinal cortex from corticobasal degeneration (A,B), frontotemporal dementia with tau (C,D), dementia with Lewy bodies (E,F), and vascular dementia (G,H) stained for tau 3R (A), tau 4R (C), α-synuclein (E), Aβ (G), and butyrylcholinesterase (BChE) activity (B,D,F,H). Note, insets are higher magnification photomicrographs demonstrating examples of the pathology observed in each of the neurodegenerative diseases including neurofibrillary tangles (A), neuropil threads and degenerating neurites (C), Lewy bodies (E), and intraneuronal inclusions (G). Note, BChE staining was limited to a few scattered cortical neurons (insets B,D,F,H) and did not label pathological structures in these neurodegenerative diseases. Scale bars = 250 μm, insets 50 μm.
DISCUSSION
In AD, BChE has been shown to associate with Aβ plaques and NFTs, the neuropathological hallmarks of this condition [6–8]. It has been suggested that BChE may be involved in the transformation of diffuse “benign” plaques into mature “malignant” plaques [35]. Other observations have suggested that BChE may attenuate plaque deposition [40]. However, in a mouse model of AD, in which the BCHE gene has been knocked out, the absence of BChE protein resulted in decreased fibrillar Aβ plaque deposition [38, 39]. These studies suggest that BChE has a role in the modulation of Aβ plaque formation. Regardless of the mechanism, the association of BChE with neuritic plaques, as demonstrated and quantified in the current study (Figs. 1–3), suggests that this enzyme is a sensitive marker for AD detection (Fig. 4). In particular, BChE can distinguish plaques associated with AD from those found in the NwAβ brain (Fig. 3), as has been suggested previously [36, 42]. The present study confirms previous observations [36] and extends this concept by demonstrating, quantitatively, that BChE is found at higher levels in AD brains compared to NwAβ, particularly in cerebral cortical regions. In comparing Aβ, Th-S, or BChE to distinguish AD, BChE plaque burden was observed to provide the highest predictive value and diagnostic accuracy, as derived from AUC analysis of the ROC curve of the orbitofrontal cortex (Fig. 4; Table 2). These results support the notion that BChE may represent an AD biomarker that has enhanced specificity compared to Aβ and could provide superior predictive value for AD diagnosis if used as a diagnostic target for neuroimaging. Additionally, BChE is not associated with pathology of other common dementias examined such as CBD, FTD-tau, DLB, and VaD, suggesting specificity of this protein for AD. Only one brain from each of these other diseases was available for analysis and further confirmation with a greater sample size is required. Nonetheless, these observations further support the notion that BChE may represent a specific diagnostic and therapeutic target for AD.
Determination of Aβ plaque load with quantification programs such as ImageJ, as employed in this and other studies [37–39, 46], offers an efficient method that allows a large sample of brain tissues to be processed and analyzed. This approach provides an estimate of plaque burden in each brain, minimizing the need for extensive extrapolation or brain section selection bias. However, one of the limitations of this methodology is that the threshold of detection is manually set to exclude background or artifact in the analysis. Although the current study used a blinded and independent assessment, this approach retains an element of subjectivity as well as the potential to exclude lightly stained AD pathological structures.
These results demonstrate marked sensitivity (100%) and specificity (100%) of BChE for AD diagnosis, representing greater diagnostic performance of all three metrics investigated. The optimized pathology burden cut-off for BChE was 5.8% versus 10.5% for Aβ. This may underscore the close coupling of BChE plaques to AD, where the increased presence of BChE more likely reflects an AD phenotype. Despite these current findings, there are several points that require further elucidation. In particular, the current study did not address the BCHE or apolipoprotein E (APOE) genotypes. In a genome-wide association study of in vivo Aβ activity, BCHE has been shown to be one of few genes associated with AD [52]. Individuals with BCHE genetic polymorphisms are known to have reduced levels of BChE activity [53]; how this affects the association of BChE with AD pathology remains unknown. With respect to APOE-ɛ4, this variant is strongly associated with sporadic AD [54, 55] and influences Aβ deposition in the brain [56, 57]. The full relevance of these genotypes and their potential additive influences on BChE-associated plaque deposition remains to be further elucidated. In addition, the current study also did not address the clinical staging along the AD spectrum starting from mild cognitive impairment to mild, moderate, and severe AD. A broader study, with a much larger sample size encompassing this spectrum, would be required to determine the involvement of BChE-associated pathology throughout these clinical stages. In order to address this issue, brain samples and clinical data from different global institutions and brain banks will need to be engaged.
At present, there are at least three hypotheses for AD pathogenesis: amyloid, tau, and cholinergic dysfunction. The amyloid hypothesis posits that the imbalance between production and clearance of Aβ42 leads to accumulation of this peptide early and this may be the initiating factor for development of AD [58]. In turn, Aβ has been a diagnostic and therapeutic target. Recently, three amyloid PET imaging agents, namely, 18F-florbetapir, 18F-florbetaben, and 18F-flutemetamol have been used for Aβ imaging [59–64]. Although cognitively normal individuals with PET amyloid positivity may represent pre-clinical stages of AD, conversion to AD has not yet been shown [65, 66]. The tau hypothesis postulates that hyperphosphorylation of this protein leads to its dissociation from microtubules and deposition of intracellular NFTs initiates cell death [67]. Consequently, tau PET imaging agents are also being pursued [12, 68]. However, the presence of Aβ and tau pathology in cognitively normal individuals [69] and tau NFTs in non-AD tauopathies [70], poses a problem [61, 71–73] for AD diagnosis [69, 74] using these markers. Therefore, the need is great for additional biomarkers to improve or supplement existing methods for AD diagnosis.
The cholinergic hypothesis was derived from the observation that in AD there was loss of cholinergic neurons leading to cognitive and behavioral dysfunction characteristic of the disease [27–29]. In addition, there is a decrease in AChE expression and an increase [75] or no change [34] in BChE expression, and these enzymes, BChE in particular, associate with plaques and NFTs in the brain [36]. Minimal BChE activity is observed in the normal cerebral cortex, but accumulates in this region in association with AD pathology, suggesting that BChE is an appropriate target for AD diagnosis [76]. PET imaging agents targeting cholinesterases in AD pathology have been developed and evaluated for the presence of AChE [77–82] and BChE [83–85] in the brain. N-[11C] methylpiperidin-4-yl acetate has been successfully shown to image AChE activity in the AD brain [86]. However, BChE imaging has met less success using the butyrate ester of N-[11C]methylpiperidinol, which was retained in the brain [83, 84, 87], but without increased radioligand uptake in regions typically affected by AD pathology [83]. Additionally, decreased uptake of this radioligand in the AD brain compared to the normal brain was observed, contradicting histochemical and isolation studies of BChE [30, 31, 34–36]. Recently, more promising progress has been observed with a cholinesterase radioligand, phenyl 4-[123I]iodophenylcarbamate, that was able to distinguish cortical AD Aβ plaques from those found in NwAβ in autoradiographic studies [42]. In addition, a specific BChE radiotracer has been shown to distinguish the 5XFAD mouse model [88] from its wild-type counterpart using single-photon emission computed tomography imaging studies [89, 90].
The current study further solidifies the importance of the association of BChE with the neuropathological hallmarks of AD. We have demonstrated that this enzyme is potentially more definitive in distinguishing between AD and NwAβ plaques compared to Aβ visualization. Furthermore, we have shown that BChE is specific for AD pathology as it does not associate with pathology of other common dementias. In conclusion, the sensitivity and specificity of BChE for AD is promising as a diagnostic target. In addition, given a number of lines of evidence that point to BChE inhibition as being important in AD treatment [91, 92], this enzyme also indicates promise as a therapeutic target for timely intervention and management of AD.
ACKNOWLEDGMENTS
We would like to thank Professor Earl Martin for critically reviewing this manuscript and Sajedeh Uzbak for her excellent technical support. This research was supported in part by the Canadian Institutes of Health Research (MOP-119343, CSE-133358), Capital Health Research Fund, Nova Scotia Health Research Foundation, Faculty and Department of Medicine of Dalhousie University, Innovacorp, Dalhousie Medical Research Foundation, Nova Scotia Co-op Education Incentive, Gunn Family Research Prize, DeWolfe Graduate Studentship, the Dalhousie Medical Research Foundation Irene MacDonald Sobey Endowed Chair in Curative Approaches to Alzheimer’s Disease, and the Brain Repair Centre.
Authors’ disclosures available online (http://j-alz.com/manuscript-disclosures/17-0164r1).
REFERENCES
[1] | World Health Organization and Alzheimer’s Disease International ((2012) ), p, 112. |
[2] | World Health Organization, Fact Sheet on Dementia, http://www.who.int/mediacentre/factsheets/fs362/en/ |
[3] | Alzheimer’s Disease International, World Alzheimer Report 2015: The Global Impact of Dementia, https://www.alz.co.uk/research/world-report-2015 |
[4] | Cummings J , Aisen PS , DuBois B , Frolich L , Jack CR Jr. , Jones RW , Morris JC , Raskin J , Dowsett SA , Scheltens P ((2016) ) Drug development in Alzheimer’s disease: The path to 2025. Alzheimers Res Ther 8: , 39. |
[5] | McKhann GM , Knopman DS , Chertkow H , Hyman BT , Jack CR Jr , Kawas CH , Klunk WE , Koroshetz WJ , Manly JJ , Mayeux R , Mohs RC , Morris JC , Rossor MN , Scheltens P , Carrillo MC , Thies B , Weintraub S , Phelps CH ((2011) ) The diagnosis of dementia due to Alzheimer’s disease: Recommendations from the National Institute on Aging-Alzheimer’s Association workgroups on diagnostic guidelines for Alzheimer’s disease. Alzheimers Dement 7: , 263–269. |
[6] | Hyman BT , Trojanowski JQ ((1997) ) Consensus recommendations for the postmortem diagnosis of Alzheimer disease from the National Institute on Aging and the Reagan Institute Working Group on diagnostic criteria for the neuropathological assessment of Alzheimer disease. J Neuropathol Exp Neurol 56: , 1095–1097. |
[7] | Hyman BT , Phelps CH , Beach TG , Bigio EH , Cairns NJ , Carrillo MC , Dickson DW , Duyckaerts C , Frosch MP , Masliah E , Mirra SS , Nelson PT , Schneider JA , Thal DR , Thies B , Trojanowski JQ , Vinters HV , Montine TJ ((2012) ) National Institute on Aging-Alzheimer’s Association guidelines for the neuropathologic assessment of Alzheimer’s disease. Alzheimers Dement 8: , 1–13. |
[8] | Montine TJ , Phelps CH , Beach TG , Bigio EH , Cairns NJ , Dickson DW , Duyckaerts C , Frosch MP , Masliah E , Mirra SS , Nelson PT , Schneider JA , Thal DR , Trojanowski JQ , Vinters HV , Hyman BT , National nstitute on Aging, Alzheimer’s Association ((2012) ) National Institute on Aging-Alzheimer’s Association guidelines for the neuropathologic assessment of Alzheimer’s disease: A practical approach. Acta Neuropathol 123: , 1–11. |
[9] | Thal DR , Rub U , Orantes M , Braak H ((2002) ) Phases of A beta-deposition in the human brain and its relevance for the development of AD. Neurology 58: , 1791–1800. |
[10] | Braak H , Braak E ((1991) ) Neuropathological stageing of Alzheimer-related changes. Acta Neuropathol 82: , 239–259. |
[11] | Herholz K , Ebmeier K ((2011) ) Clinical amyloid imaging in Alzheimer’s disease. Lancet Neurol 10: , 667–670. |
[12] | Villemagne VL , Fodero-Tavoletti MT , Masters CL , Rowe CC ((2015) ) Tau imaging: Early progress and future directions. Lancet Neurol 14: , 114–124. |
[13] | Jansen WJ , Ossenkoppele R , Knol DL , Tijms BM , Scheltens P , Verhey FR , Visser PJ , Amyloid Biomarker Study Group, Aalten P , Aarsland D , Alcolea D , Alexander M , Almdahl IS , Arnold SE , Baldeiras I , Barthel H , van Berckel BN , Bibeau K , Blennow K , Brooks DJ , van Buchem MA , Camus V , Cavedo E , Chen K , Chetelat G , Cohen AD , Drzezga A , Engelborghs S , Fagan AM , Fladby T , Fleisher AS , van der Flier WM , Ford L , Forster S , Fortea J , Foskett N , Frederiksen KS , Freund-Levi Y , Frisoni GB , Froelich L , Gabryelewicz T , Gill KD , Gkatzima O , Gomez-Tortosa E , Gordon MF , Grimmer T , Hampel H , Hausner L , Hellwig S , Herukka SK , Hildebrandt H , Ishihara L , Ivanoiu A , Jagust WJ , Johannsen P , Kandimalla R , Kapaki E , Klimkowicz-Mrowiec A , Klunk WE , Kohler S , Koglin N , Kornhuber J , Kramberger MG , Van Laere K , Landau SM , Lee DY , de Leon M , Lisetti V , Lleo A , Madsen K , Maier W , Marcusson J , Mattsson N , de Mendonca A , Meulenbroek O , Meyer PT , Mintun MA , Mok V , Molinuevo JL , Mollergard HM , Morris JC , Mroczko B , Van der Mussele S , Na DL , Newberg A , Nordberg A , Nordlund A , Novak GP , Paraskevas GP , Parnetti L , Perera G , Peters O , Popp J , Prabhakar S , Rabinovici GD , Ramakers IH , Rami L , Resende de Oliveira C , Rinne JO , Rodrigue KM , Rodriguez-Rodriguez E , Roe CM , Rot U , Rowe CC , Ruther E , Sabri O , Sanchez-Juan P , Santana I , Sarazin M , Schroder J , Schutte C , Seo SW , Soetewey F , Soininen H , Spiru L , Struyfs H , Teunissen CE , Tsolaki M , Vandenberghe R , Verbeek MM , Villemagne VL , Vos SJ , van Waalwijk van Doorn LJ , Waldemar G , Wallin A , Wallin AK , Wiltfang J , Wolk DA , Zboch M , Zetterberg H ((2015) ) Prevalence of cerebral amyloid pathology in persons without dementia: A meta-analysis. JAMA 313: , 1924–1938. |
[14] | Bennett DA , Schneider JA , Arvanitakis Z , Kelly JF , Aggarwal NT , Shah RC , Wilson RS ((2006) ) Neuropathology of older persons without cognitive impairment from two community-based studies. Neurology 66: , 1837–1844. |
[15] | Aizenstein HJ , Nebes RD , Saxton JA , Price JC , Mathis CA , Tsopelas ND , Ziolko SK , James JA , Snitz BE , Houck PR , Bi W , Cohen AD , Lopresti BJ , DeKosky ST , Halligan EM , Klunk WE ((2008) ) Frequent amyloid deposition without significant cognitive impairment among the elderly. Arch Neurol 65: , 1509–1517. |
[16] | Drachman DA ((2014) ) The amyloid hypothesis, time to move on:Amyloid is the downstream result, not cause, of Alzheimer’sdisease. Alzheimers Dement 10: , 372–380. |
[17] | Darvesh S , Grantham DL , Hopkins DA ((1998) ) Distribution ofbutyrylcholinesterase in the human amygdala and hippocampalformation. J Comp Neurol 393: , 374–390. |
[18] | Darvesh S , Hopkins DA ((2003) ) Differential distribution of butyrylcholinesterase and acetylcholinesterase in the human thalamus. J Comp Neurol 463: , 25–43. |
[19] | Mesulam MM , Guillozet A , Shaw P , Levey A , Duysen EG , Lockridge O ((2002) ) Acetylcholinesterase knockouts establish central cholinergic pathways and can use butyrylcholinesterase to hydrolyze acetylcholine. Neuroscience 110: , 627–639. |
[20] | Darvesh S , Hopkins DA , Geula C ((2003) ) Neurobiology of butyrylcholinesterase. Nat Rev Neurosci 4: , 131–138. |
[21] | Lockridge O ((2015) ) Review of human butyrylcholinesterase structure, function, genetic variants, history of use in the clinic, and potential therapeutic uses. Pharmacol Ther 148: , 34–46. |
[22] | Chen VP , Gao Y , Geng L , Stout MB , Jensen MD , Brimijoin S ((2016) ) Butyrylcholinesterase deficiency promotes adipose tissue growth and hepatic lipid accumulation in male mice on high-fat diet. Endocrinology 157: , 3086–3095. |
[23] | Layer PG ((1983) ) Comparative localization of acetylcholinesterase and pseudocholinesterase during morphogenesis of the chicken brain. Proc Natl Acad Sci U S A 80: , 6413–6417. |
[24] | Zivkovic AR , Schmidt K , Sigl A , Decker SO , Brenner T , Hofer S ((2015) ) Reduced serum butyrylcholinesterase activity indicates severe systemic inflammation in critically ill patients. Mediators Inflamm 2015: , 274607. |
[25] | Kamal MA , Priyamvada S , Anbazhagan AN , Jabir NR , Tabrez S , Greig NH ((2014) ) Linking Alzheimer’s disease and type 2 diabetes mellitus via aberrant insulin signaling and inflammation. CNS Neurol Disord Drug Targets 13: , 338–346. |
[26] | Mack A , Robitzki A ((2000) ) The key role of butyrylcholinesterase during neurogenesis and neural disorders: An antisense-5’butyrylcholinesterase-DNA study. Prog Neurobiol 60: , 607–628. |
[27] | Coyle JT , Price DL , DeLong MR ((1983) ) Alzheimer’s disease: A disorder of cortical cholinergic innervation. Science 219: , 1184–1190. |
[28] | Bartus RT , Dean RL 3rd , Beer B , Lippa AS ((1982) ) The cholinergic hypothesis of geriatric memory dysfunction. Science 217: , 408–414. |
[29] | Davies P , Maloney AJ ((1976) ) Selective loss of central cholinergic neurons in Alzheimer’s disease. Lancet 2: , 1403. |
[30] | Geula C , Mesulam M ((1989) ) Special properties of cholinesterases in the cerebral cortex of Alzheimer’s disease. Brain Res 498: , 185–189. |
[31] | Geula C , Mesulam MM ((1995) ) Cholinesterases and the pathology of Alzheimer disease. Alzheimer Dis Assoc Disord 9: (Suppl 2), 23–28. |
[32] | Gomez-Ramos P , Bouras C , Moran MA ((1994) ) Ultrastructural localization of butyrylcholinesterase on neurofibrillary degeneration sites in the brains of aged and Alzheimer’s disease patients. Brain Res 640: , 17–24. |
[33] | Moran MA , Mufson EJ , Gomez-Ramos P ((1993) ) Colocalization of cholinesterases with beta amyloid protein in aged and Alzheimer’s brains. Acta Neuropathol 85: , 362–369. |
[34] | Darvesh S , Reid AG , Martin E ((2010) ) Biochemical and histochemical comparison of cholinesterases in normal and alzheimer braintissues. Curr Alzheimer Res 7: , 386–400. |
[35] | Guillozet AL , Smiley JF , Mash DC , Mesulam MM ((1997) ) Butyrylcholinesterase in the life cycle of amyloid plaques. Ann Neurol 42: , 909–918. |
[36] | Mesulam MM , Geula C ((1994) ) Butyrylcholinesterase reactivity differentiates the amyloid plaques of aging from those of dementia. Ann Neurol 36: , 722–727. |
[37] | Darvesh S , Cash MK , Reid GA , Martin E , Mitnitski A , Geula C ((2012) ) Butyrylcholinesterase is associated with beta-amyloid plaques inthe transgenic APPSWE/PSEN1dE9 mouse model of Alzheimerdisease. J Neuropathol Exp Neurol 71: , 2–14. |
[38] | Darvesh S , Reid GA ((2016) ) Reduced fibrillar beta-amyloid in subcortical structures in a butyrylcholinesterase-knockout Alzheimer disease mouse model. Chem Biol Interact 259: (Pt B), 307–312. |
[39] | Reid GA , Darvesh S ((2015) ) Butyrylcholinesterase-knockout reduces brain deposition of fibrillar beta-amyloid in an Alzheimer mouse model. Neuroscience 298: , 424–435. |
[40] | Diamant S , Podoly E , Friedler A , Ligumsky H , Livnah O , Soreq H ((2006) ) Butyrylcholinesterase attenuates amyloid fibril formationin vitro. Proc Natl Acad Sci U S A 103: , 8628–8633. |
[41] | Darvesh S ((2013) ) Butyrylcholinesterase radioligands to image Alzheimer’s disease brain. Chem Biol Interact 203: , 354–357. |
[42] | Macdonald IR , Reid GA , Pottie IR , Martin E , Darvesh S ((2016) ) Synthesis and preliminary evaluation of phenyl 4-123I-iodophenylcarbamate for visualization of cholinesterases associated with Alzheimer disease pathology. J Nucl Med 57: , 297–302. |
[43] | McKeith IG , Dickson DW , Lowe J , Emre M , O’Brien JT , Feldman H , Cummings J , Duda JE , Lippa C , Perry EK , Aarsland D , Arai H , Ballard CG , Boeve B , Burn DJ , Costa D , Del Ser T , Dubois B , Galasko D , Gauthier S , Goetz CG , Gomez-Tortosa E , Halliday G , Hansen LA , Hardy J , Iwatsubo T , Kalaria RN , Kaufer D , Kenny RA , Korczyn A , Kosaka K , Lee VM , Lees A , Litvan I , Londos E , Lopez OL , Minoshima S , Mizuno Y , Molina JA , Mukaetova-Ladinska EB , Pasquier F , Perry RH , Schulz JB , Trojanowski JQ , Yamada M , Consortium on DLB ((2005) ) Diagnosis and management of dementia with Lewy bodies: Third report of the DLB Consortium. Neurology 65: , 1863–1872. |
[44] | Jankowsky JL , Younkin LH , Gonzales V , Fadale DJ , Slunt HH , Lester HA , Younkin SG , Borchelt DR ((2007) ) Rodent A beta modulates the solubility and distribution of amyloid deposits in transgenic mice. J Biol Chem 282: , 22707–22720. |
[45] | Karnovsky MJ , Roots L ((1964) ) A “direct-coloring” thiocholine method for cholinesterases. J Histochem Cytochem 12: , 219–221. |
[46] | Shi Q , Prior M , He W , Tang X , Hu X , Yan R ((2009) ) Reduced amyloiddeposition in mice overexpressing RTN3 is adversely affected bypreformed dystrophic neurites. J Neurosci 29: , 9163–9173. |
[47] | Zweig MH , Campbell G ((1993) ) Receiver-operating characteristic (ROC) plots: A fundamental evaluation tool in clinical medicine. Clin Chem 39: , 561–577. |
[48] | Metz CE ((1978) ) Basic principles of ROC analysis. Semin Nucl Med 8: , 283–298. |
[49] | Metz CE, ROC-Kit, http://metz-roc.uchicago.edu |
[50] | Beach TG , Monsell SE , Phillips LE , Kukull W ((2012) ) Accuracy of the clinical diagnosis of Alzheimer disease at National Institute on Aging Alzheimer Disease Centers, 2005-2010. J Neuropathol Exp Neurol 71: , 266–273. |
[51] | Gouras GK , Tampellini D , Takahashi RH , Capetillo-Zarate E ((2010) ) Intraneuronal beta-amyloid accumulation and synapse pathology in Alzheimer’s disease. Acta Neuropathol 119: , 523–541. |
[52] | Ramanan VK , Risacher SL , Nho K , Kim S , Swaminathan S , Shen L , Foroud TM , Hakonarson H , Huentelman MJ , Aisen PS , Petersen RC , Green RC , Jack CR , Koeppe RA , Jagust WJ , Weiner MW , Saykin AJ , Alzheimer’s Disease Neuroimaging Initiative ((2014) ) APOE and BCHE as modulators of cerebral amyloid deposition: A florbetapir PET genome-wide association study. Mol Psychiatry 19: , 351–357. |
[53] | La Du BN , Bartels CF , Nogueira CP , Arpagaus M , Lockridge O ((1991) ) Proposed nomenclature for human butyrylcholinesterase genetic variants identified by DNA sequencing. Cell Mol Neurobiol 11: , 79–89. |
[54] | Strittmatter WJ , Saunders AM , Schmechel D , Pericak-Vance M , Enghild J , Salvesen GS , Roses AD ((1993) ) Apolipoprotein E: High-avidity binding to beta-amyloid and increased frequency of type 4 allele in late-onset familial Alzheimer disease. Proc Natl Acad Sci U S A 90: , 1977–1981. |
[55] | Poirier J , Davignon J , Bouthillier D , Kogan S , Bertrand P , Gauthier S ((1993) ) Apolipoprotein E polymorphism and Alzheimer’s disease. Lancet 342: , 697–699. |
[56] | Hyman BT , West HL , Rebeck GW , Buldyrev SV , Mantegna RN , Ukleja M , Havlin S , Stanley HE ((1995) ) Quantitative analysis of senileplaques in Alzheimer disease: Observation of log-normal sizedistribution and molecular epidemiology of differences associatedwith apolipoprotein E genotype and trisomy 21 (Down syndrome). Proc Natl Acad Sci U S A 92: , 3586–3590. |
[57] | Gomez-Isla T , West HL , Rebeck GW , Harr SD , Growdon JH , Locascio JJ , Perls TT , Lipsitz LA , Hyman BT ((1996) ) Clinical andpathological correlates of apolipoprotein E epsilon 4 inAlzheimer’s disease. Ann Neurol 39: , 62–70. |
[58] | Selkoe DJ , Hardy J ((2016) ) The amyloid hypothesis of Alzheimer’s disease at 25 years. EMBO Mol Med 8: , 595–608. |
[59] | Beach TG , Schneider JA , Sue LI , Serrano G , Dugger BN , Monsell SE , Kukull W ((2014) ) Theoretical impact of Florbetapir (18F) amyloidimaging on diagnosis of alzheimer dementia and detection ofpreclinical cortical amyloid. J Neuropathol ExpNeurol 73: , 948–953. |
[60] | Ong KT , Villemagne VL , Bahar-Fuchs A , Lamb F , Langdon N , Catafau AM , Stephens AW , Seibyl J , Dinkelborg LM , Reininger CB , Putz B , Rohde B , Masters CL , Rowe CC ((2015) ) Abeta imaging with 18F-florbetaben in prodromal Alzheimer’s disease: A prospective outcome study. J Neurol Neurosurg Psychiatry 86: , 431–436. |
[61] | Curtis C , Gamez JE , Singh U , Sadowsky CH , Villena T , Sabbagh MN , Beach TG , Duara R , Fleisher AS , Frey KA , Walker Z , Hunjan A , Holmes C , Escovar YM , Vera CX , Agronin ME , Ross J , Bozoki A , Akinola M , Shi J , Vandenberghe R , Ikonomovic MD , Sherwin PF , Grachev ID , Farrar G , Smith AP , Buckley CJ , McLain R , Salloway S ((2015) ) Phase 3 trial of flutemetamol labeled with radioactive fluorine 18 imaging and neuritic plaque density. JAMA Neurol 72: , 287–294. |
[62] | European Medicines Agency, Amyvid: Florbetapir (18F).Authorisation details. http://www.ema.europa.eu/ema/index.jsp?curl=pages/medicines/human/medicines/002422/human_med_001611.jsp&mid=WC0b01ac058001d124. |
[63] | European Medicines Agency, Neuraceq: Florbetaben (18F).Authorisation details., http://www.ema.europa.eu/ema/index.jsp?curl=pages/medicines/human/medicines/002553/human_med_001716.jsp&mid=WC0b01ac058001d124. |
[64] | European Medicines Agency, Vizamyl: Flutemetamol (18F).Authorisation details., http://www.ema.europa.eu/ema/index.jsp?curl=pages/medicines/human/medicines/002557/human_med_001794.jsp&mid=WC0b01ac058001d124. |
[65] | Grimmer T , Wutz C , Alexopoulos P , Drzezga A , Forster S , Forstl H , Goldhardt O , Ortner M , Sorg C , Kurz A ((2016) ) Visual versus fully automated analyses of 18F-FDG and amyloid PET for prediction of dementia due to Alzheimer disease in mild cognitive impairment. J Nucl Med 57: , 204–207. |
[66] | Dubois B , Hampel H , Feldman HH , Scheltens P , Aisen P , Andrieu S , Bakardjian H , Benali H , Bertram L , Blennow K , Broich K , Cavedo E , Crutch S , Dartigues JF , Duyckaerts C , Epelbaum S , Frisoni GB , Gauthier S , Genthon R , Gouw AA , Habert MO , Holtzman DM , Kivipelto M , Lista S , Molinuevo JL , O’Bryant SE , Rabinovici GD , Rowe C , Salloway S , Schneider LS , Sperling R , Teichmann M , Carrillo MC , Cummings J , Jack CR Jr , Proceedings of the Meeting of the International Working Group (IWG) and the American Alzheimer’s Association on “The Preclinical State of AD”, July 23, 2015, Washington DC, USA ((2016) ) Preclinical Alzheimer’s disease: Definition, natural history, and diagnostic criteria. Alzheimers Dement 12: , 292–323. |
[67] | Iqbal K , Liu F , Gong CX ((2016) ) Tau and neurodegenerative disease: The story so far. Nat Rev Neurol 12: , 15–27. |
[68] | Cho H , Choi JY , Hwang MS , Lee JH , Kim YJ , Lee HM , Lyoo CH , Ryu YH , Lee MS ((2016) ) Tau PET in Alzheimer disease and mild cognitive impairment. Neurology 87: , 375–383. |
[69] | Johnson KA , Minoshima S , Bohnen NI , Donohoe KJ , Foster NL , Herscovitch P , Karlawish JH , Rowe CC , Carrillo MC , Hartley DM , Hedrick S , Pappas V , Thies WH ((2013) ) Appropriate use criteria foramyloid PET: A report of the Amyloid Imaging Task Force, theSociety of Nuclear Medicine and Molecular Imaging, and theAlzheimer’s Association. J Nucl Med 54: , 476–490. |
[70] | Hou CE , Carlin D , Miller BL ((2004) ) Non-Alzheimer’s disease dementias: Anatomic, clinical, and molecular correlates. Can J Psychiatry 49: , 164–171. |
[71] | Clark CM , Pontecorvo MJ , Beach TG , Bedell BJ , Coleman RE , Doraiswamy PM , Fleisher AS , Reiman EM , Sabbagh MN , Sadowsky CH , Schneider JA , Arora A , Carpenter AP , Flitter ML , Joshi AD , Krautkramer MJ , Lu M , Mintun MA , Skovronsky DM , Group A-AS ((2012) ) Cerebral PET with florbetapir compared with neuropathology at autopsy for detection of neuritic amyloid-beta plaques: A prospective cohort study. Lancet Neurol 11: , 669–678. |
[72] | Sabri O , Sabbagh MN , Seibyl J , Barthel H , Akatsu H , Ouchi Y , Senda K , Murayama S , Ishii K , Takao M , Beach TG , Rowe CC , Leverenz JB , Ghetti B , Ironside JW , Catafau AM , Stephens AW , Mueller A , Koglin N , Hoffmann A , Roth K , Reininger C , Schulz-Schaeffer WJ , Florbetaben Phase 3 Study Group ((2015) ) Florbetaben PET imaging to detect amyloid beta plaques in Alzheimer’s disease: Phase 3 study. Alzheimers Dement 11: , 964–974. |
[73] | Wang L , Benzinger TL , Su Y , Christensen J , Friedrichsen K , Aldea P , McConathy J , Cairns NJ , Fagan AM , Morris JC , Ances BM ((2016) ) Evaluation of tau imaging in staging Alzheimer disease and revealing interactions between beta-amyloid and tauopathy. JAMA Neurol 73: , 1070–1077. |
[74] | Noble JM , Scarmeas N ((2009) ) Application of pet imaging to diagnosis of Alzheimer’s disease and mild cognitive impairment. Int Rev Neurobiol 84: , 133–149. |
[75] | Perry EK , Perry RH , Blessed G , Tomlinson BE ((1978) ) Changes in brain cholinesterases in senile dementia of Alzheimer type. Neuropathol Appl Neurobiol 4: , 273–277. |
[76] | Darvesh S ((2016) ) Butyrylcholinesterase as a diagnostic and therapeutic target for Alzheimer’s disease. Curr Alzheimer Res 13: , 1173–1177. |
[77] | Sato K , Fukushi K , Shinotoh H , Nagatsuka S , Tanaka N , Aotsuka A , Ota T , Shiraishi T , Tanada S , Iyo M , Irie T ((2004) ) Evaluation of simplified kinetic analyses for measurement of brain acetylcholinesterase activity using N-[11C]Methylpiperidin-4-yl propionate and positron emission tomography. J Cereb Blood Flow Metab 24: , 600–611. |
[78] | Kilbourn MR , Snyder SE , Sherman PS , Kuhl DE ((1996) ) In vivo studies of acetylcholinesterase activity using a labeled substrate, N-[11C]methylpiperdin-4-yl propionate ([11C]PMP). Synapse 22: , 123–131. |
[79] | Irie T , Fukushi K , Namba H , Iyo M , Tamagami H , Nagatsuka S , Ikota N ((1996) ) Brain acetylcholinesterase activity: Validation of a PET tracer in a rat model of Alzheimer’s disease. J Nucl Med 37: , 649–655. |
[80] | Pappata S , Tavitian B , Traykov L , Jobert A , Dalger A , Mangin JF , Crouzel C , DiGiamberardino L ((1996) ) In vivo imaging of human cerebral acetylcholinesterase. J Neurochem 67: , 876–879. |
[81] | Snyder SE , Tluczek L , Jewett DM , Nguyen TB , Kuhl DE , Kilbourn MR ((1998) ) Synthesis of 1-[11C]methylpiperidin-4-yl propionate ([11C]PMP) for in vivo measurements of acetylcholinesterase activity. Nucl Med Biol 25: , 751–754. |
[82] | Namba H , Fukushi K , Nagatsuka S , Iyo M , Shinotoh H , Tanada S , Irie T ((2002) ) Positron emission tomography: Quantitative measurement of brain acetylcholinesterase activity using radiolabeled substrates. Methods 27: , 242–250. |
[83] | Kuhl DE , Koeppe RA , Snyder SE , Minoshima S , Frey KA , Kilbourn MR ((2006) ) In vivo butyrylcholinesterase activity is not increased in Alzheimer’s disease synapses. Ann Neurol 59: , 13–20. |
[84] | Kikuchi T , Zhang MR , Ikota N , Fukushi K , Okamura T , Suzuki K , Arano Y , Irie T ((2004) ) N-[18F]fluoroethylpiperidin-4-ylmethyl butyrate: A novelradiotracer for quantifying brain butyrylcholinesterase activityby positron emission tomography. Bioorg Med Chem Lett 14: , 1927–1930. |
[85] | Snyder SE , Gunupudi N , Sherman PS , Butch ER , Skaddan MB , Kilbourn MR , Koeppe RA , Kuhl DE ((2001) ) Radiolabeled cholinesterasesubstrates: In vitro methods for determining structure-activityrelationships and identification of a positron emission tomographyradiopharmaceutical for in vivo measurement ofbutyrylcholinesterase activity. J Cereb Blood Flow Metab 21: , 132–143. |
[86] | Ota T , Shinotoh H , Fukushi K , Kikuchi T , Sato K , Tanaka N , Shimada H , Hirano S , Miyoshi M , Arai H , Suhara T , Irie T ((2010) ) Estimation of plasma IC50 of donepezil for cerebral acetylcholinesterase inhibition in patients with Alzheimer disease using positron emission tomography. Clin Neuropharmacol 33: , 74–78. |
[87] | Roivainen A , Rinne J , Virta J , Jarvenpaa T , Salomaki S , Yu M , Nagren K ((2004) ) Biodistribution and blood metabolism of 1-11C-methyl-4-piperidinyl n-butyrate in humans: An imaging agent for in vivo assessment of butyrylcholinesterase activity with PET. J Nucl Med 45: , 2032–2039. |
[88] | Oakley H , Cole SL , Logan S , Maus E , Shao P , Craft J , Guillozet-Bongaarts A , Ohno M , Disterhoft J , Van Eldik L , Berry R , Vassar R ((2006) ) Intraneuronal beta-amyloid aggregates, neurodegeneration, and neuron loss in transgenic mice with five familial Alzheimer’s disease mutations: Potential factors in amyloid plaque formation. J Neurosci 26: , 10129–10140. |
[89] | Debay DR , Reid AG , Pottie I , Martin E , Bowen CV , Darvesh S ((2016) ) Synthesis and in vivo SPECT evaluation of a novelbutyrylcholinesterase diagnostic radioligand for Alzheimer’sdisease. Alzheimers Dement 12: , 120. |
[90] | DeBay DR , Reid AG , Pottie I , Martin E , Bowen CV , Darvesh S ((2017) ) Targeting butyrylcholinesterase for preclinical single photon emission computed tomogrpahy (SPECT) imaging of Alzheimer’s disease. Alzheimers Dement (N Y) 3: , 166–176. |
[91] | Greig NH , Utsuki T , Ingram DK , Wang Y , Pepeu G , Scali C , Yu QS , Mamczarz J , Holloway HW , Giordano T , Chen D , Furukawa K , Sambamurti K , Brossi A , Lahiri DK ((2005) ) Selective butyrylcholinesterase inhibition elevates brain acetylcholine, augments learning and lowers Alzheimer beta-amyloid peptide in rodent. Proc Natl Acad Sci U S A 102: , 17213–17218. |
[92] | Macdonald IR , Rockwood K , Martin E , Darvesh S ((2014) ) Cholinesterase inhibition in Alzheimer’s disease: Is specificity the answer? J Alzheimers Dis 42: , 379–384. |

