
Assessment of Driving Safety in Older Adults with Mild Cognitive Impairment
Abstract
Background: With population aging, drivers with mild cognitive impairment (MCI) are increasing; however, there is little evidence available regarding their safety.
Objective: We aimed to evaluate risk of unsafe on-road driving performance among older adults with MCI.
Method: The study was a cross-sectional observational study, set in Canberra, Australia. Participants were non-demented, current drivers (n = 302) aged 65 to 96 years (M = 75.7, SD = 6.18, 40% female) recruited through the community and primary and tertiary care clinics. Measures included a standardized on-road driving test (ORT), a battery of screening measures designed to evaluate older driver safety (UFOV®, DriveSafe, Multi-D), a neurocognitive test battery, and questionnaires on driving history and behavior.
Results: Using Winblad criteria, 57 participants were classified as having MCI and 245 as cognitively normal (CN). While the MCI group had a significantly lower overall safety rating on the ORT (5.61 versus 6.05, p = 0.03), there was a wide range of driving safety scores in the CN and MCI groups. The MCI group performed worse than the CN group on the off-road screening tests. The best fitting model of predictors of ORT performance across the combined sample included age, the Multi-D, and DriveSafe, classifying 90.4% of the sample correctly.
Conclusion: Adults with MCI exhibit a similar range of driving ability to CN adults, although on average they scored lower on off-road and on-road assessments. Driving specific tests were more strongly associated with safety ratings than traditional neuropsychological tests.
INTRODUCTION
Cognitive impairment that is not severe enough to warrant a diagnosis of dementia is more prevalent than dementia, affecting approximately 20% of the United States population aged 70 and older [1]. Around 60% of women with mild cognitive impairment (MCI) are current drivers, in contrast to 40% of women with dementia [2]. There is a paucity of data on the road safety of individuals with MCI, as noted in a recent systematic review that only identified one relevant study [3]. To date, one small study found that MCI drivers made more errors and performed less well on the road [4] and another found similar results on a driving simulator [5]. Importantly neither study found that performance was impaired to a degree that would render the drivers unsafe. It remains unclear whether older adults with MCI should be particularly targeted for assessment of driving safety.
To address the gap in knowledge regarding the effect of MCI on driving safety, the present study evaluated the driving safety of older adults with MCI compared to adults with normal cognition. The outcome measures included an on-road driving test (ORT) that generates a safety rating, and off-road screening tests that have been specifically developed for older drivers. A second aim was to evaluate off-road older driver screening tests and neuropsychological tests as predictors of driving safety in the full sample.
METHODS
Study population
The sample was drawn from community dwelling adults in the city of Canberra and surrounding regional New South Wales, Australia, who responded to advertisements in newspapers, community groups, primary and tertiary care clinics, geriatricians, and older driver assessment services between 2013 and 2015, inviting them to participate in the Driving Ageing Safety and Health (DASH) project.
Recruitment targeted individuals with mild memory concerns, as well the general community of older drivers, with the aim of obtaining an MCI enriched sample. We excluded participants who reported a prior diagnosis of dementia (n = 8). Of 327 respondents, 302 participated in the ORT and met the criteria for this study. The age-range was 65–96 (mean = 75.67, SD = 6.18, SD, 40.4% female).
Standard protocol approvals and consents
The protocol was approved by the Human Research Ethics Committees (HREC) of Australian National University (2012/643), and of the ACT Government Health Directorate (ETH.2.13.028). Informed, written consent was obtained from all participants.
Procedure and measures
Participants attended the Centre for Research on Ageing, Health and Wellbeing at the Australian National University for a comprehensive neuropsychological, sensorimotor, and driver skill assessment. Participants completed questionnaires on driving habits, medical conditions, falls, and instrumental activities of daily living (IADLs) [6]. An ORT was administered by a Driver trained Occupational Therapist (OT) and state-accredited driving instructor (DI). Both were masked to the results of the off-roadassessment.
Cognitive assessment
The neurocognitive test battery assessed domains required for diagnosis of MCI using the Winblad Criteria [7]. Performance within each cognitive domain was calculated as the mean standardized score (z-score) of the component tests and standardized relative to age, education, and gender based normative data obtained from published sources [8–12] and expressed in z-scores. The domain of Complex Attention comprised performance on the Stroop Color Word Test – dots and non-color words (Victoria Version [8]). Executive Function comprised a test of working memory (Digit Span Backwards [13]), a test of cognitive flexibility (Trail Making Test B from the Halstead-Reitan Battery [14]), color-word response inhibition task of the Stroop Color Word Test [8], and decision making under explicit risk in the Game of Dice Test [10]. The Game of Dice Test assesses propensity for risky decision-making by having participants predict the outcome of a dice roll. Learning and Memory comprised immediate and delayed recall from the California Verbal Learning Test [15]. Visuospatial function was assessed with the copying task from the Benton Visual Retention Test [16] (Administration C). Language was assessed with Letter Fluency from the Halstead-Reitan Battery [14] and Boston Naming Test-15item [17].
Subjective memory complaints
Subjective memory complaints were assessed using the Memory Complaints Questionnaire (MAC-Q) [18]. A cut-off score of 25 or greater represents clinically significant subjective concerns [18].
Classification of MCI
Diagnosis of MCI was conducted by a clinical neuropsychologist using the Winblad Criteria [7]. These criteria were operationalized such that participants had to be a) not demented defined as MMSE > 22; b) subjectively report cognitive decline defined as MAC-Q score >24 [18]; c) have objective cognitive impairment defined as more than 1 standard deviation below the age and education stratified published norms (i.e., z-score< – 1.0) in any of the cognitive domains assessed (Complex Attention, Learning and Memory, Language, Visuospatial skills, and Executive Function); and d) have minimal IADL impairments operationalized as no HRS IADL difficulties [6] attributed to cognition which have published internal reliabilities of 0.69 to 0.86 [19]. The same criteria using identical measures were evaluated against clinically diagnosed MCI in a large cohort study of older adults drawn from the same geographical region [20, 21]. Results showed the criteria had 0.72 sensitivity and 0.86 specificity, with Area under the Curve of 0.802 (95% CI: 0.76–0.85) in the cohort (n = 1,644).
On-road driving test
Participants completed a 50- min ORT in an automatic vehicle with dual brake controls fitted, which followed a standard, validated protocol and scoring procedure that has been described previously [22, 23]. Briefly, the route was pre-determined and incorporated situations that drivers typically encounter during suburban driving. The driving instructor provided turn by turn navigation instructions for 80% of the driving route. The remaining 20% of the drive was completed through self-navigation by the participants who were instructed to drive to a pre-determined destination. Seated in the rear passenger seat, the occupational therapist (OT) scored the participants’ driving performance in the areas of general observation (scanning and attention), blind spot checks, lane positioning, braking/acceleration (appropriate speed and braking), gap selection (gap selected when entering traffic or the gap between the driver and other vehicles), and approach (appropriate planning and preparation) [23]. Indication/signaling (appropriate use of directional indicator) were also assessed where appropriate. Drivers’ safety was also rated independently by both the OT and DI using an error based scale of 1 to 10 [22], with lower scores indicating lower driving safety. A driver’s safety rating was based on three factors: the severity of the driving errors made, the frequency of the driving errors, and the need for intervention from the DI. The higher the involvement from the driving instructor (e.g., emergency breaking or steering to prevent a collision), and the higher the repeated driving errors, the lower the safety rating. Drivers with scores ranging from 1 to 3 demonstrated multiple serious driving errors which reflected loss of the skill level required to complete the driving task safely in simple and complex traffic. Typically in these cases, the DI was required to intervene on multiple occasions to prevent an accident or dangerous situation, and if undertaking a local licensing test, the driver’s performance would likely result in a fail and possible loss oflicense.
This is similar to the classification used in the Washington University Road Test [24] (see [3] for a review) and is the methodology we have reported previously [22, 25, 26]. Drivers deemed as unsafe were counselled regarding their performance on the day and advised to follow up with their general practitioner. Inter-rater reliability of test scores between the DI and OT (using the same scale) was high (intra-class correlation = 0.94 (95% CI: 0.93–0.95), n = 295).
Off-road screening tests for driving safety
The Useful field of view (UFOV®) (Subtest 2) is a PC-based test of visual processing speed and divided attention, with high reliability and validity demonstrated in other large studies for predicting crash risk [27, 28]. Participants attended to two target stimuli presented simultaneously on screen: a central schematic image of a car or truck with a second car figure presented randomly at one of eight peripheral locations at an eccentricity of 10° [29]. The stimulus presentation time was reduced based on an adaptive protocol to arrive at a threshold presentation time (in milliseconds) that produced a 75% correct responserate.
DriveSafe/DriveAware® [30] is a validated clinical screening tool for driving safety [31]. The DriveSafe component was used. This test consists of 15 images of the same rotary, or roundabout (an alternative to a four-way stop), on a screen to simulate the view through a windshield, in which the number and position of pedestrians and vehicles vary. Participants observe each image for 3 seconds and, when the image has been removed from the screen, verbally report details about the position and direction of travel of each pedestrian and vehicle in the image. The number of correctly recalled details of the vehicles and pedestrians in each scene were scored. A score of > 95/128 is reported in the literature as a cut-point to classify safe from unsafe drivers [30]. An additional multiple choice questionnaire (DriveSafe Intersections) assessed knowledge of road law. The 14-item Road Rules and Road Craft test (Road Law) comprises 14 questions about road safety and has been shown to correlate with ORT performance in a clinical sample and researchsamples [32].
The Multi-D test battery
Our previously described battery [25, 33] was used. Briefly, a Color Choice Reaction Time test (CARS-RT) was administered on a computer requiring response to a car that appeared in a quadrant of the screen. Participants responded with their left or right hand when the car appeared in the top left or right quadrants respectively, and left and right foot (by pressing a pedal) when the car appeared in the left or right lower quadrants, respectively. The test also required inhibiting responses. The Dot motion test is a computer-based measure of central motion sensitivity (Dmin) using random dot stimuli presented at a working distance of 3.2 m [34]. Within the total field of dots, a smaller central panel of dots that subtended 2.9° at the working distance of 3.2 m moved coherently in one of four directions. Thresholds were given as the minimum displacement of motion of the dots that participants were able to detect. Postural sway (displacement of the body at the level of the waist) was measured with a Swaymeter [35] with the participant standing on a foam rubber mat (40 cm×40 cm×15 cm thick) of medium density with their eyes closed. A composite score for the Multi-D was calculated yielding the probability of failing an ORT, that also included their answer to a question about how many kilometers they drive each week [36]. The score was based on the algorithm developed from a population-basedstudy [25].
Statistical analysis
Sample size was powered to detect a difference between safe and unsafe drivers using a test battery that classified safe and unsafe drivers in the community at alpha = 0.0112 using an estimated effect size of Cohens f2 = 0.13. Means for each group on cognitive and driver screening measures were estimated using generalized linear models that adjusted for age and gender. A series of hierarchical logistic models were used to estimate odds of being classified as an unsafe driver (score of 1–3 compared with 4+) on the ORT. Model 1 evaluated the neuropsychological tests after adjusting for age and sex; Model 2 added the off-road driver screening measures. A further model used forward selection to identify the predictors in the best fitting model. Missing data on predictor variables was less than 3% for all except UFOV® (5.3%), CARS-RT (7%), and DriveSafe (5.7%) and were imputed using the Expectation Maximum Likelihood algorithm in SPSS.
RESULTS
Sample characteristics
Fifty-seven participants were classified as MCI and 245 were classified as cognitively normal (CN). Table 1 shows the characteristics of these two groups. Both groups were aged in their mid-seventies, had driven for over 50 years, and had high levels of education. They did not differ in age, sex distribution, MMSE score, years of education, marital status, self-rated health, years driving, or the number of days per week participants reported driving. The MCI sample reported more subjective memory concerns and drove slightly less per week. The MCI group performed more poorly on all cognitive measures, reflecting their clinical diagnosis (Supplementary Table 1).
Table 1
Characteristics of the cognitively normal and the MCI groups who completed on-road assessments
| Variable | Cognitively Normal | MCI | p-value |
| (n = 245) | (n = 57) | ||
| Age | 75.68 (6.12) | 75.42 (6.31) | 0.71 |
| Education | 15.76 (3.95) | 15.15 (4.11) | 0.25 |
| MMSE | 28.86 (1.37) | 28.89 (1.25) | 0.70 |
| Female | 98 (40.8%) | 23 (40.4%) | 0.94 |
| Marital status | 0.40 | ||
| Married | 152 (63.6%) | 35 (62.5%) | |
| Widowed | 49 (20.4%) | 9 (16.1%) | |
| Never married | 14 (5.8%) | 2 (3.6%) | |
| Separated/divorced | 25 (10.4%) | 10 (17.9%) | |
| SF12 Physical health | 41.39 (9.44) | 43.58 (9.11) | 0.15 |
| SF12 Mental health | 55.91 (7.96) | 55.46 (8.24) | 0.52 |
| MAC-Q (subjective memory concerns) | 24.80 (4.27) | 27.54 (2.52) | <0.001 |
| Driving experience (y) | 56.28 (7.01) | 54.70 (8.11) | 0.16 |
| Days driven per week | 5.66 (1.51) | 5.33 (1.95) | 0.021 |
| Distance driven per week (km) | 196.74 (218.34) | 162.38 (186.63) | 0.31 |
MMSE, Mini-Mental State Examination; SF12, 12-Item Short Form Survey; MAC-Q, Assessment of Memory Complaints Questionnaire; MCI, mild cognitive impairment.
On-road test and off-road driving safety tests
Performance of each group on the ORT and the off road screening measures, adjusted for age and gender is shown in Table 2. The MCI group had a lower average safety rating on the ORT but the difference was less than one point. The mean rating scores were not high and the range of the scores for both groups was wide (2–9 for the CN and 1–8 for the MCI groups). Figure 1 illustrates the distribution of scores on the ORT ratings for the MCI and the CN groups.
Table 2
Estimated marginal means for on-road test and driver screening tests unadjusted Mean (standard deviation)
| Variable | Cognitively Normal | MCI | p-value |
| (n = 245) | (n = 57) | ||
| Driver safety rating | 6.05 (1.51) | 5.61 (1.77) | 0.021 |
| UFOV® Score (ms) | 136.13 (130.00) | 157.54 (126.76) | 0.177 |
| Dot Motion (log deg. arc) | –1.78 (0.21) | –1.70 (0.23) | 0.006 |
| CARS-RT (ms) | 928.42 (154.64) | 964.88 (159.01) | 0.060 |
| Postural sway (mm) | 364.11 (178.91) | 377.18 (178.13) | 0.645 |
| Multi-D Risk score (%) | 19.93 (27.66) | 28.60 (29.34) | 0.021 |
| DriveSafe Score | 89.43 (0.84) | 82.29 (1.75) | <0.001 |
| DriveSafe Intersections | 6.42 (0.09) | 5.85 (0.18) | 0.004 |
| 14-Item Road Law | 31.58 (0.27) | 30.90 (0.55) | 0.262 |
| Maze Test Time (s) | 31.16 (20.09) | 27.60 (15.22) | 0.11 |
Adjusted for age and gender. The Multi-D risk score is a weighted composite of Dot Motion, CARS-RT, Postural sway, and km driven per week that reflects the probability of failing the ORT using data from a population-based study [25]. UFOV®, Useful Field of View; CARS-RT, Color Choice Reaction Time test.
Fig.1
Overlapping distributions of on-road safety ratings. Left panel shows spline smoothed stacked area histogram of frequency as a function of on-road test safety rating and cognitive impairment category (black: Mild Cognitive Impairment; grey: Cognitively Normal). Right panel shows line graph of percentage of cognitively impaired (black line) and cognitively normal (grey line) participants as a function of on-road test safety rating.
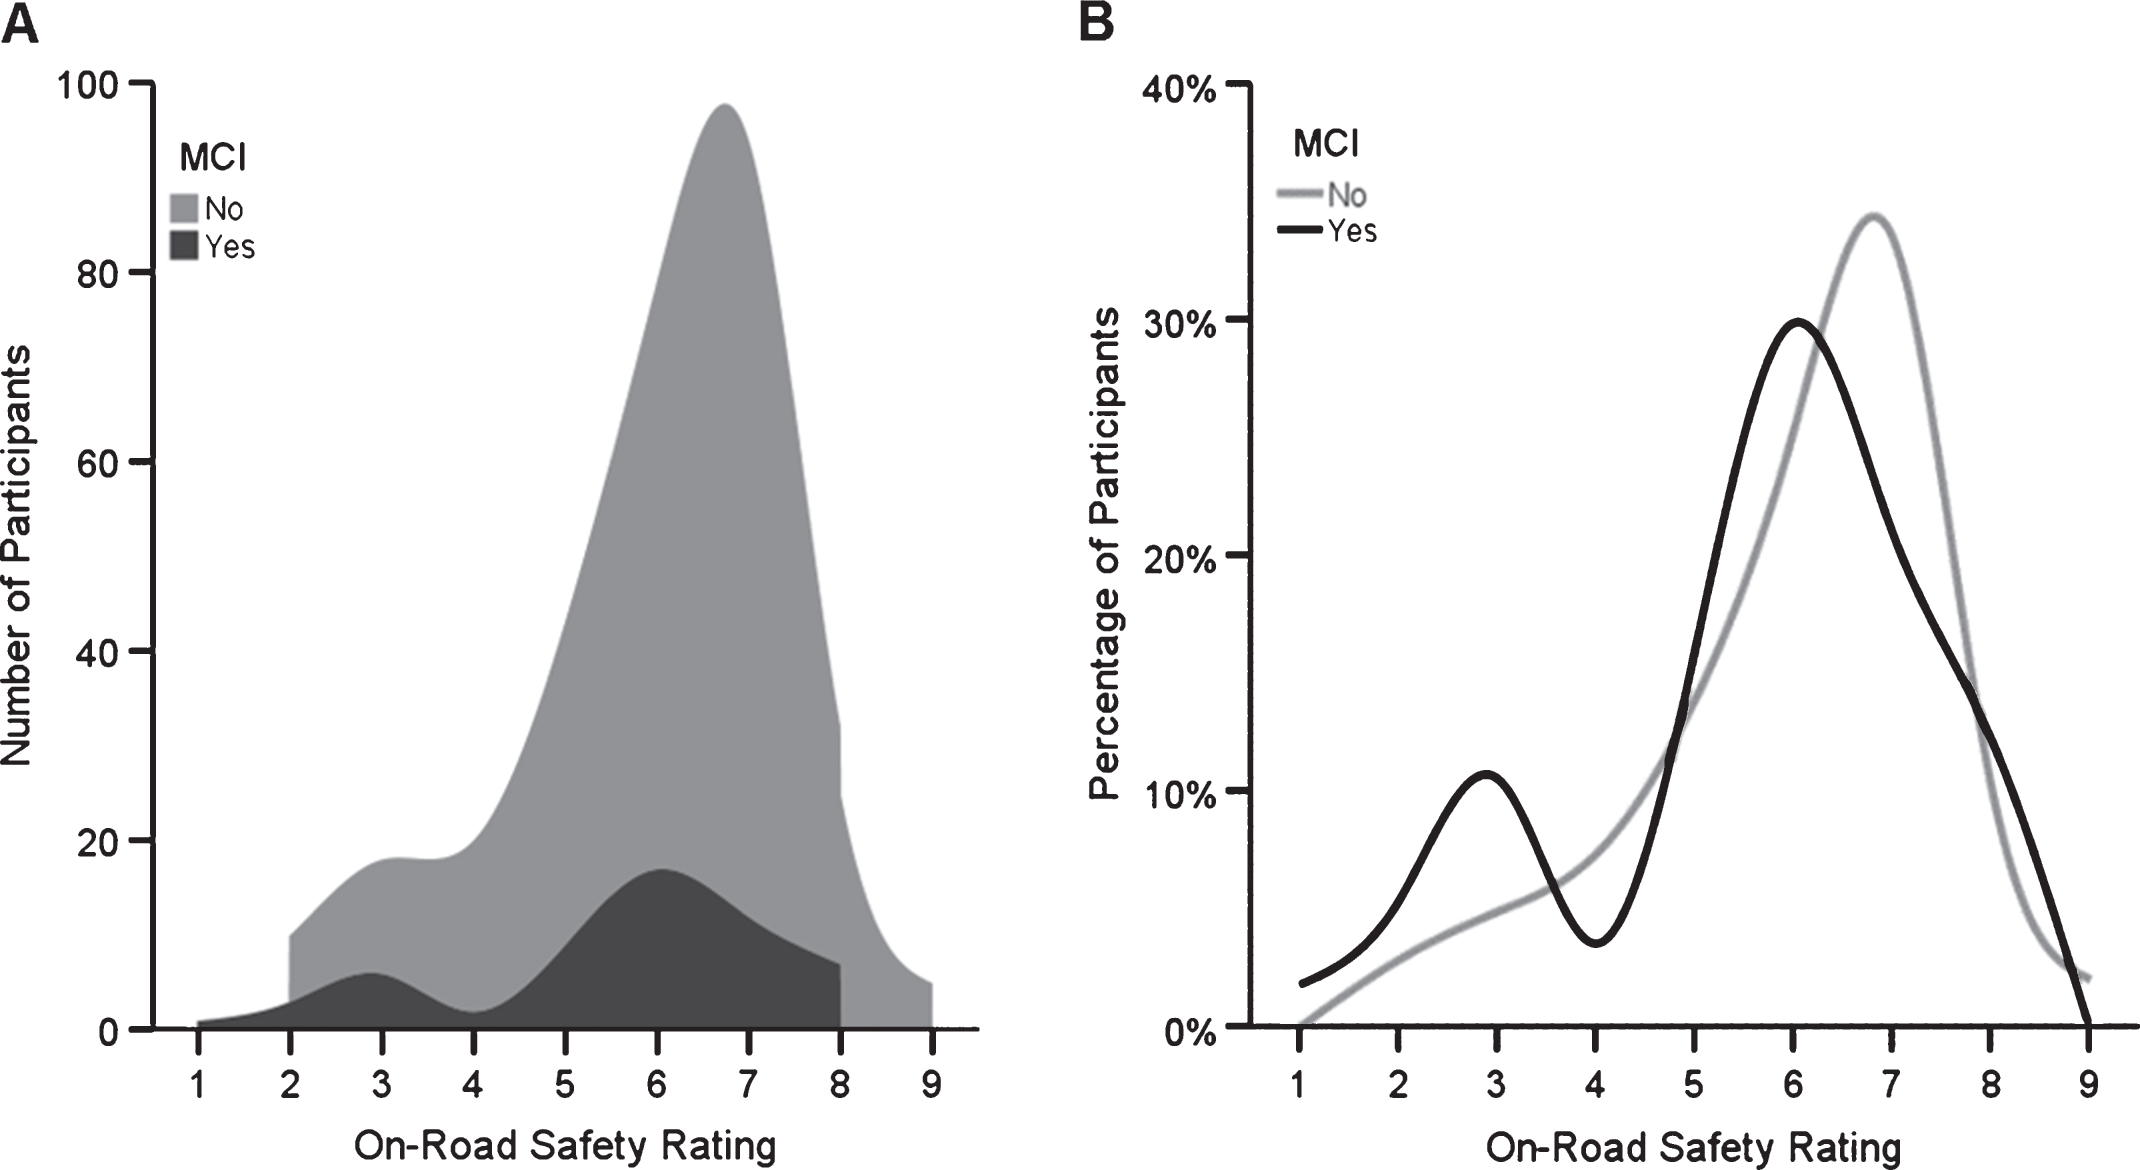
In age- and sex-adjusted models, the MCI group performed worse on Dot Motion, Multi-D risk score, and the DriveSafe tests. The standard deviations for the DriveSafe Score were large for both groups. On average, both groups scored below the cut-point for safe driving on the DriveSafe test.
Off road predictors of driving safety across the entire sample
To identify whether specific neuropsychological deficits or driver screening tests were associated with unsafe driving (safety rating < 4 on the ORT) in the entire sample (including MCI), we conducted hierarchical logistic regression (Table 3). No neuropsychological variables predicted unsafe driving in Model 1, and in Model 2 only the Multi-D score (a weighted composite of CARS-RT, Dot Motion and Sway) [25] was significant. A model using Forward selection resulted in age, DriveSafe, and Multi-D being the best predictors of driver safety and classified 90.4% of the sample correctly.
Table 3
Logistic regression models of neuropsychological tests and driver screening tests as predictors of OT On-Road Test Safety Rating in the full sample
| Models including all variables | ||||
| Measure | Model 1 | Model 2 | ||
| Beta | p-value | Beta | p-value | |
| CVLT Delayed Recall | –0.06 (0.09) | 0.51 | 0.04 (0.09) | 0.65 |
| Boston naming | –0.05 (0.09) | 0.56 | –0.08 (0.09) | 0.40 |
| Digits Backwards | –0.00 (0.00) | 0.11 | –0.00 (0.00) | 0.10 |
| BVRT (Copy) | –0.10 (0.15) | 0.52 | –0.16 (0.16) | 0.32 |
| COWAT | –0.03 (0.02) | 0.11 | –0.01 (0.02) | 0.65 |
| Trail Making Test B (s) | 0.00 (0.00) | 0.68 | 0.00 (0.00) | 0.95 |
| Stroop Color Word Test (s) | 0.01 (0.01) | 0.30 | 0.00 (0.01) | 0.68 |
| UFOV® Score (ms) | 0.00 (0.00) | 0.27 | ||
| Multi-D | 2.35 (0.81) | <0.01** | ||
| DriveSafe Score | –0.03 (0.02) | 0.12 | ||
| DriveSafe Intersections | –0.22 (0.17) | 0.20 | ||
| 14-Item Road Law | 0.01 (0.06) | 0.82 | ||
| Maze Test Time (s) | –1.09 (1.88) | 0.56 | ||
| Forward selection of best fitting model | ||||
| Age | –0.13 (0.05) | <0.01** | ||
| DriveSafe Score | –0.04 (0.02) | 0.02* | ||
| Multi-D | 1.78 (0.78) | 0.02* | ||
*p < 0.05, **p < 0.01. Model 1 and 2 Results adjusted for age and gender. Note cut-off on ORT was 1–3/4–10 for unsafe/safe. CVLT, California Verbal Learning Test Immediate Recall; BVRT, Benton Visual Retention Test; COWAT, Controlled Oral Word Association Test; UFOV®, Useful Field of View. Bold indicates are p-values.
Predictors of the full ORT score were also evaluated using linear regression with the ORT as a continuous measure. Delayed recall, Digits backwards and Boston Naming, Stroop, DriveSafe Intersection, and the Multi-D were significant predictors in a combined model which accounted for 30% of the variance in the ORT score (Supplementary Table 2). A regression model using stepwise selection to identify the best predictors of the continuous ORT score selected age, DriveSafe and Intersections and accounted for 24% of variance. Intercorrelations among all measures are reported in Supplementary Table 3.
Self-reported driving habits, confidence, and crashes
The CN and MCI groups did not differ in their rates of self-reported crashes, self-reports of how fast they drive, or their rating of their driving quality. The MCI group was more likely to report driving more slowly than others (Table 4).
Table 4
Self-reports of driving referral, self-ratings and crashes for CN and MCI participants
| CN | MCI | Statistic, p-value | |
| Crashes in last 5 years | |||
| Yes | 62 | 18 | 0.39 |
| No | 169 | 38 | |
| How would you rate the quality of your driving | |||
| Excellent | 26 (10.9%) | 5 (9.0%) | 0.80 |
| Good | 140 (58.6%) | 33 (55.9%) | |
| Average | 68 (28.4%) | 15 (25.4%) | |
| Fair | 5 (2.1%) | 2 (3.4%) | |
| Self-rated driving speed compared to others | |||
| Much faster | 0 | 1 (1.8%) | χ2 (3) = 11.65, p < 0.01 |
| Somewhat faster | 18 (7.6%) | 3 (5.5%) | |
| About the same | 201 (83.4%) | 40 (72.7%) | |
| Somewhat slower | 19 (8.0%) | 11 (20.0%) | |
CN, cognitively normal; MCI, mild cognitive impairment.
DISCUSSION
To our knowledge, this is the largest study of driving safety in current drivers with a diagnosis of MCI including an ORT. Participants classified as MCI are typical of patients referred to physicians and clinical neuropsychologists for expert opinion on their fitness to drive and are a rapidly growing segment of the driving population. Results from this study demonstrate the difficulty of generalizing about driving safety in this group based only on a diagnosis of MCI. The average safety rating for those with MCI was lower than the CN group by less than one point (6.05 (SE = 1.51) versus 5.61 (SE = 1.77)) on a 10-point scale, and the distribution of scores did not differ between groups. In clinical terms, safety ratings of 5 and 6 indicate skill deficiencies that pose little threat to other drivers, but may cause failure on a local licensing test, and show a capacity for improvement through intervention. A safety rating of 6 primarily indicates lack of defensive driving skills, requiring minimal instructor intervention, while the rating of 5 indicates a greater degree of faults and instructor prompting. Both CN and MCI groups included individuals who scored poorly on the ORT (i.e., safety rating < 4) and off road screening measures. Previous work has shown only marginally reduced fitness to drive in older adults with MCI [4, 5].
Consistent with our previous work showing that driving errors increase with chronological age [37], age was the most consistent predictor of ORT performance. Regression models accounted for about 24% of the variation in ORT. This is a substantial component of variance but also indicates that our measures did not capture all predictors. Performance on tests of skills that have been shown to be relevant to driving were better predictors of driving safety than MCI status. These results emphasize the need for evidence-based assessment of drivers using tests developed to address the specific deficits that have been scientifically linked to unsafe driving. General tests of cognitive or visual function fail to provide the degree of accuracy that is provided by these driving specific tests.
In the model combining neuropsychological tests with off-road driving specific screening tools, none of the neuropsychological measures remained a significant predictor of the ORT. This again emphasizes that driving specific screening tools, many of which incorporate cognitive skills such as visual selective attention, pattern recognition, traffic related reasoning, and reaction time, are more informative than general neuropsychological tests. These have greater ecological validity, assess skills that are clearly relevant to the driving task, and have been validated against ORTs. Some previously validated tests were not significant predictors in our study such as the UFOV®. It is possible that this reflects differences between samples or a lack of statistical power. However, the MCI group performed worse on the DriveSafe tests and the Multi-D battery score which have all been linked to ORT safety scores or crash risk.
Our findings suggest that MCI is associated with a slightly increased risk of unsafe driving but that a diagnosis of MCI should not be used independently in fitness to drive evaluations because of the wide variation in skills of drivers with MCI. Moreover, MCI is difficult to diagnose accurately within a primary care setting which is the first stage in the majority of fitness to drive evaluations [38]. We recommend that on-road driving performance and validated tests of driving skills be the key focus of driving assessments. In addition, the stability of MCI diagnosis over time is well known to be low, with around 24% of MCI reverting to normal at follow-up [39]. Thus, diagnoses of mild cognitive disorders are unsuitable for guiding major decisions regarding license cancellation that have lasting impacts on patient independence.
Driver self-ratings of the normal and MCI groups show few differences. Groups did not differ in their driving frequency or distances driven per week but reported driving slightly fewer days, consistent with previous reports that cognitive impairment is associated with driving self-regulation [24]. Previous research has shown that self-assessment of driving safety is not reliable in older adults [40] and that as older adults, abilities decline they will not necessarily make appropriate adaptations.
Study limitations included lack of informant assessment of cognitive decline, and lack of long term follow-up for crashes and the use of self-reported data to obtain information on distance driven. However, a two-year follow-up of the sample is ongoing. Despite the sample being large compared with previously published studies, it was still small for the purpose of generating robust risk estimates.
Conclusion
We conclude that adults with MCI are not at an obvious increased risk of unsafe driving despite poorer performance on selected off-road screening measures. Specialized assessments of abilities relevant for driving are more useful than neuropsychological tests for predicting driving safety in adults with normal cognition and MCI.
ACKNOWLEDGMENTS
We thank Ally Gunn, Stephanie Sabadas, Emily Wilford, Lily O’Donoughue-Jenkins and Elizabeth Parkes who assisted with data collection. We are grateful to the ACT Health Driver Assessment and Rehabilitation Service who assisted with recruitment.
This study was funded by the National Health and Medical Research Council of Australia (NHMRC grant #1045024). Kaarin Anstey is funded by NHMRC Research Fellowship #1102694.
Authors’ disclosures available online (http://j-alz.com/manuscript-disclosures/16-1209r1).
Appendices
The supplementary material is available in the electronic version of this article: http://dx.doi.org/10.3233/JAD-161209.
REFERENCES
[1] | Plassman BL , Langa KM , Fisher GG , Heeringa SG , Weir DR , Ofstedal MB , Burke JR , Hurd MD , Potter GG , Rodgers WL , Steffens DC , McArdle JJ , Willis RJ , Wallace RB ((2008) ) Prevalence of cognitive impairment without dementia in the United States. Ann Intern Med 148: , 427–434. |
[2] | Vaughan L , Hogan PE , Rapp SR , Dugan E , Marottoli RA , Snively BM , Shumaker SA , Sink KM ((2015) ) Driving with mild cognitive impairment or dementia: Cognitive test performance and proxy report of daily life function in older women. J Am Geriatr Soc 63: , 1774–1782. |
[3] | Hird MA , Egeto P , Fischer CE , Naglie G , Schweizer TA ((2016) ) A systematic review and meta-analysis of on-road simulator and cognitive driving assessment in Alzheimer’s disease and mild cognitive impairment. J Alzheimers Dis 53: , 713–729. |
[4] | Wadley VG , Okonkwo O , Crowe M , Vance DE , Elgin JM , Ball KK , Owsley C ((2009) ) Mild cognitive impairment and everyday function: An investigation of driving performance. J Geriatr Psychiatry Neurol 22: , 87–94. |
[5] | Devlin A , McGillivray J , Charlton J , Lowndes G , Etienne V ((2012) ) Investigating driving behaviour of older drivers with mild cognitive impairment using a portable driving simulator. Accid Anal Prev 49: , 300–307. |
[6] | Juster FT , Suzman R ((1995) ) An overview of the Health and Retirement Study. J Hum Resour 30: , S7–S56. |
[7] | Winblad B , Palmer K , Kivipelto M , Jelic V , Fratiglioni L , Wahlund LO , Nordberg A , Backman L , Albert M , Almkvist O , Arai H , Basun H , Blennow K , de Leon M , DeCarli C , Erkinjuntti T , Giacobini E , Graff C , Hardy J , Jack C , Jorm A , Ritchie K , van Duijn C , Visser P , Petersen RC ((2004) ) Mild cognitive impairment–beyond controversies, towards a consensus: Report of the International Working Group on Mild Cognitive Impairment. J Intern Med 256: , 240–246. |
[8] | Spreen O , Strauss E ((1998) ) A Compendium of neuropsychological tests: Administration, norms and commentary, Oxford University Press, New York. |
[9] | Edwards JD , Ross LA , Wadley VG , Clay OJ , Crowe M , Roenker DL , Ball KK ((2006) ) The useful field of view test: Normative data for older adults. Arch Clin Neuropsychol 21: , 275–286. |
[10] | Brand M , Fujiwara E , Borsutzky S , Kalbe E , Kessler J ((2005) ) Decision-making deficits of Korsakoff patients in a new gambling task with explicit rules: Associations with executive functions. Neuropsychology 19: , 267–277. |
[11] | Kent PS , Luszcz MA ((2002) ) A review of the Boston Naming Test and multiple-occasion normative data for older adults on 15-item versions. Clin Neuropsychol 16: , 555–574. |
[12] | Baron-Cohen S , Wheelwright S , Hill J ((2001) ) The ‘Reading the Mind in the Eyes’ Test revised version: A study with normal adults, and adults with Asperger syndrome or high-functioning autism. J Child Psychol Psychiatry 42: , 241–251. |
[13] | Wechsler D ((1997) ) Wechsler Memory Scale (WMS-III), Psychological Corporation, Chicago. |
[14] | Reitan R ((1985) ) Reitan Neuropsychology, Tucson, Arizona. |
[15] | Delis DC , Massman PJ , Kaplan E , McKee R , Kramer JH , Gettman D ((1991) ) Alternate form of the California Verbal Learning Test: Development and reliability. Clin Neuropsychol 5: , 154–162. |
[16] | Benton AL ((1974) ) Revised Visual Retention Test: Clinical and experimental applications, 4th ed, Psychological Corporation, New York. |
[17] | Mack WJ , Freed DM , Willians BW , Henderson VW ((1992) ) Boston Naming Test: Shortened versions for use in Alzheimer’s disease. J Gerontol B Psychol Sci Soc Sci 47: , P154–P158. |
[18] | Crook TH , Feher EP , Larrabee GJ ((1992) ) Assessment of memory complaint in age-associated memory impairment: The MAC-Q. Int Psychogeriatr 4: , 165–176. |
[19] | Fonda S , Herzog R , HRS/AHEAD Documentation Report, Accessed 11/10-2016. |
[20] | Anstey KJ , Cherbuin N , Eramudugolla R , Sargent-Cox K , Easteal S , Kumar R , Sachdev P ((2013) ) Characterizing mild cognitive disorders in the young-old over 8 years: Prevalence, estimated incidence, stability of diagnosis, and impact on IADLs. Alzheimers Dement 9: , 640–648. |
[21] | Anstey KJ , Christensen H , Butterworth P , Easteal S , Mackinnon A , Jacomb T , Maxwell K , Rodgers B , Windsor T , Cherbuin N , Jorm AF ((2012) ) Cohort profile: The PATH through life project. Int J Epidemiol 41: , 951–960. |
[22] | Mallon K , Wood JM ((2004) ) Occupational therapy assessment of open-road driving performance: Validity of directed and self-directed navigational instructional components. Am J Occup Ther 58: , 279–286. |
[23] | Wood JM , Anstey KJ , Lacherez PF , Kerr GK , Mallon K , Lord SR ((2009) ) The on-road difficulties of older drivers and their relationship with self-reported motor vehicle crashes. J Am Geriatr Soc 57: , 2062–2069. |
[24] | Fitten LJ , Perryman KM , Wilkinson CJ , Little RJ , Burns MM , Pachana N , Mervis JR , Malmgren R , Siembieda DW , Ganzell S ((1995) ) Alzheimer and vascular dementias and driving. A prospective road and laboratory study. JAMA 273: , 1360–1365. |
[25] | Wood JM , Anstey KJ , Kerr GK , Lacherez PF , Lord S ((2008) ) A multidomain approach for predicting older driver safety under in-traffic road conditions. J Am Geriatr Soc 56: , 986–993. |
[26] | Anstey KJ , Wood J , Caldwell H , Kerr G , Lord SR ((2009) ) Comparison of self-reported crashes, state crash records and an on-road driving assessment in a population-based sample of drivers aged 69-95 years. Traffic Inj Prev 10: , 84–90. |
[27] | Owsley C , Ball K , McGwin G , Sloane ME , Roenker DL , White MF , Overley ET ((1998) ) Visual processing impairment and risk of motor vehicle crash among older adults. J Am Med Assoc 279: , 1083–1088. |
[28] | Ball KK , Roenker DL , Wadley VG , Edwards JD , Roth DL , McGwin G Jr , Raleigh R , Joyce JJ , Cissell GM , Dube T ((2006) ) Can high-risk older drivers be identified through performance-based measures in a Department of Motor Vehicles setting? J Am Geriatr Soc 54: , 77–84. |
[29] | Ball K , Owsley C ((1993) ) The useful field of view test: A new technique for evaluating age-related declines in visual function. J Am Optom Assoc 64: , 71–79. |
[30] | Kay LG , Bundy AC , Clemson LM ((2008) ) Predicting fitness to drive using the visual recognition slide test (USyd). Am J Occup Ther 62: , 187–197. |
[31] | Kay LG , Bundy AC , Clemson LM ((2009) ) Predicting fitness to drive in people with cognitive impairments by using DriveSafe and DriveAware. Arch Phys Med Rehabil 90: , 1514–1522. |
[32] | Unsworth CA , Baker A , Taitz C , Chan SP , Pallant JF , Russell KJ , Odell M ((2012) ) Development of a standardised Occupational Therapy - Driver Off-Road Assessment Battery to assess older and/or functionally impaired drivers. Aust Occup Ther J 59: , 23–36. |
[33] | Anstey KJ , Horswill MS , Wood JM , Hatherly C ((2012) ) The role of cognitive and visual abilities as predictors in the Multifactorial Model of Driving Safety. Accid Anal Prev 45: , 766–774. |
[34] | Bullimore MA , Wood JM , Swenson KH ((1993) ) Motion perception in glaucoma. Invest Ophthalmol Vis Sci 34: , 3526–3533. |
[35] | Lord S , Menz HB , Tiedemann A ((2003) ) A physiological profile approach to falls risk assessment and prevention. Invest Ophthalmol Vis Sci 83: , 237–252. |
[36] | Eramudugolla R , Anstey KJ ((2014) ) Translation of a validated driver screening tool for clinical assessment and research use. NRMA - ACT Road Safety Trust Reports, http://roadsafetytrust.org.au/c/rtt?a=da&did=1004593 |
[37] | Anstey KJ , Wood J ((2011) ) Chronological age and age-related cognitive deficits are associated with an increase in multiple types of driving errors in late life. Neuropsychology 25: , 613–621. |
[38] | Anstey KJ , Eramudugolla R , Ross LA , Lautenschlager NT , Wood J ((2016) ) Road safety in an aging population: Risk factors, assessment, interventions, and future directions. Int Psychogeriatr 28: , 349–356. |
[39] | Malek-Ahmadi M ((2016) ) Reversion from mild cognitive impairment to normal cognition: A meta-analysis. Alzheimer Dis Assoc Disord 30: , 324–330. |
[40] | Wood JM , Lacherez PF , Anstey KJ ((2013) ) Not all older adults have insight into their driving abilities: Evidence from an on-road assessment and implications for policy. J Gerontol A Biol Sci Med Sci 68: , 559–566. |

