
Reduction of RPT6/S8 (a Proteasome Component) and Proteasome Activity in the Cortex is Associated with Cognitive Impairment in Lewy Body Dementia
Abstract
Lewy body dementia is the second most common neurodegenerative dementia and is pathologically characterized by α-synuclein positive cytoplasmic inclusions, with varying amounts of amyloid-β (Aβ) and hyperphosphorylated tau (tau) aggregates in addition to synaptic loss. A dysfunctional ubiquitin proteasome system (UPS), the major proteolytic pathway responsible for the clearance of short lived proteins, may be a mediating factor of disease progression and of the development of α-synuclein aggregates. In the present study, protein expression of a key component of the UPS, the RPT6 subunit of the 19S regulatory complex was determined. Furthermore, the main proteolytic-like (chymotrypsin- and PGPH-) activities have also been analyzed. The middle frontal (Brodmann, BA9), inferior parietal (BA40), and anterior cingulate (BA24) gyrus’ cortex were selected as regions of interest from Parkinson’s disease dementia (PDD, n = 31), dementia with Lewy bodies (DLB, n = 44), Alzheimer’s disease (AD, n = 16), and control (n = 24) brains. Clinical and pathological data available included the MMSE score. DLB, PDD, and AD were characterized by significant reductions of RPT6 (one-way ANOVA, p < 0.001; Bonferroni post hoc test) in prefrontal cortex and parietal cortex compared with controls. Strong associations were observed between RPT6 levels in prefrontal, parietal cortex, and anterior cingulate gyrus and cognitive impairment (p = 0.001, p = 0.001, and p = 0.008, respectively). These findings highlight the involvement of the UPS in Lewy body dementia and indicate that targeting the UPS may have the potential to slow down or reduce the progression of cognitive impairment in DLB and PDD.
INTRODUCTION
Lewy body diseases (LBD) include dementia with Lewy bodies (DLB), Parkinson’s disease (PD), and PD dementia (PDD). DLB and PDD account for 10–20% of dementias [1]. Clinically, both conditions are characterized by progressive cognitive decline, visual hallucinations, fluctuating cognition, and parkinsonism. The neuropathological hallmark lesions include α-synuclein aggregates which present as intracytoplasmic Lewy bodies and Lewy neurites in axons and dendrites in cortical and limbic areas (DLB and PDD) as well as in the substantia nigra (PDD and PD). In addition, ubiquitin-containing inclusions [2, 3] and amyloid-β (Aβ) plaques are frequently seen. The neurochemical features of DLB and PDD include severe loss of cholinergic neurons within the nucleus basalis magnocellularis [4] and extensive cortical and thalamic cholinergic deficits [5–7]. Similar to Alzheimer’s disease (AD), no disease modifying treatments have been discovered for LBDs. Cholinesterase inhibitors [8, 9] and memantine [10] offer symptomatic benefit, but the development of therapies targeting the mechanisms of α-synuclein accumulation and aggregation in the cortex are at a preliminary stage.
The ubiquitin-proteasome system (UPS), the major proteolytic pathway responsible for the clearance of short lived proteins and the major non-lysosomal pathway for α-synuclein degradation [11], has in particular been a focus of research interest. Structurally, the 26S proteasome consists of a 20S proteolytic core and a 19S regulatory complex, composed of α and β subunits organized in four rings of seven subunits, three of the β-subunits in each ring containing the active sites at which proteolysis of substrate proteins occurs [12]. Each of these three subunits has distinct proteolytic activities, described as chymotrypsin-like, trypsin-like, and peptidyl glutamyl-peptide hydrolytic (PGPH) activities [13]. Together, these activities represent the best characterized peptidase activities although activities associated with cleavage of branched-chain, aromatic and small neutral amino acids have been reported [14]. The α subunits are involved in tethering of the 19S regulatory complex to the 20S proteasome and serve to maintain the structural stability of the 20S proteasome [15].
ATPase sub-units (RPT1-6) are essential for cellular survival; furthermore, the ATPase sub-units are hypothesized to recognize the polyubiquitin degradation signal and to unfold the protein substrates for their degradation by the 20S core, thereby controlling the access of substrates to the proteolytic core [16, 17]. The 20S catalytic core alone has a closed gate and requires an activator to regulate its protease activity.
Dysfunction of the 26S proteasome has been increasingly recognized as playing a fundamental role in the pathogenesis of many neurodegenerative disorders [18, 19]. Neurodegenerative disorders share a common feature which is the accumulation of misfolded proteins in the form of insoluble protein aggregates or inclusion bodies. Each of these aggregates has a specific protein component depending on the disease, such as α-synuclein in Lewy bodies or hyperphosphorylated tau in neurofibrillary tangles in AD. However, irrespective of the characteristic protein aggregate, ubiquitin has been identified as an additional component of inclusion bodies in many neurodegenerative diseases [20], suggesting that polyubiquitination and impairment of the UPS is generally involved in inclusion body formation. In particular in LBDs, several lines of evidence support the involvement of the UPS and postmortem studies using PD cohorts have shown a reduction in proteasomal activity in the substantia nigra [21]. Preliminary studies have also identified proteasomal abnormalities in cortical regions of DLB subjects [22]. Moreover, inhibition of proteasome activity in neuronal cell lines resulted in accumulation of ubiquitinated proteins [23] and α-synuclein aggregation [24, 25]. Finally, aggregated α-synuclein binds strongly to the 19S component and inhibits the UPS [26].
Studying the UPS is essential to have a better understanding of these specific pathways to enable the development of targeted therapies. We therefore investigated the protein expression of a key component of the UPS, the RPT6 subunit of the 19S regulatory complex and relevant proteasome activities (chymotrypsin-like and PGPH-like) in individuals with DLB, PDD, and AD in comparison to controls. The relationship between these changes and cognitive impairment was also explored. RPT6 is the best characterized of the ATPase proteasome subunits and has been linked by several studies to neurodegeneration, hence its use in our study as the representative proteasome subunit.
METHODS AND MATERIALS
Participants, diagnosis, and assessment
Postmortem brain tissue was obtained from: University Hospital Stavanger (Norway), the MRC London Neurodegenerative Diseases Brain Bank, the Thomas Willis Oxford Brain Collection, and the Newcastle Brain Tissue Resource. The UK brain banks are part of the Brains for Dementia Research Network. All participants gave informed consent for their tissue to be used in research and the study had ethics approval from the National Research Ethics Service (08/H1010/4). Table 1 shows the demographic details of the patients and controls. Biochemical and histopathological analysis was undertaken on prefrontal cortex (BA9), anterior cingulate gyrus (BA24), and parietal cortex (BA40). BA9 was selected due to its proposed role in executive function and cognition [27], decline of which is characteristic of DLB and PDD. BA24 was selected since α-synuclein pathology in BA24 develops early in DLB and PDD [28], while BA40 was selected because it shows severe AD and comparatively low LBD pathology, respectively [29].
Neuropathological assessment was performed according to standardized neuropathological scoring/grading systems, including phases of amyloid-β (Aβ) deposition (Aβ-phases), neurofibrillary tangle Braak stages, Consortium to Establish a Registry for Alzheimer’s Disease (CERAD) scores, Newcastle/McKeith Criteria for Lewy body disease, and National Institute on Aging - Alzheimer’s Association (NIA-AA) guidelines [1, 30–33]. Controls were neurologically normal, with only mild age associated neuropathological changes (e.g., neurofibrillary tangle Braak stage≤II) and no history of neurological or psychiatric disease.
Cognitive impairment data consisted of the last Mini-Mental State Examination (MMSE) scores a maximum of two years prior to death [34]. Patients and controls were categorized according to cognitive impairment in the following manner: ‘unimpaired cognition’ for individuals classified by the brain bank(s) as being clinical controls; ‘neurodegenerative disease without dementia’ for individuals with MMSE scores of 25 to 30 and no antemortem diagnosis of dementia; ‘mild dementia’ for individuals with MMSE scores from 17 to 24; ‘moderate dementia’ for individuals with MMSE scores of 10 to 16; and ‘severe dementia’ for individuals with MMSE scores of 9 or less [35]. Table 2 shows how the clinical diagnoses were divided between these categories. Final diagnoses for patients are clinico-pathological consensus diagnoses incorporating the one-year rule to differentiate DLB and PDD [1].
Preparation of tissue samples for western blotting
Preparation of tissue for western blotting was performed as previously described [35]. Briefly, cortical grey matter was dissected free of the meninges and white matter at 0–4°C. Approximately 200 mg tissue was homogenized in 4 ml ice-cold buffer containing 50 mM tris-HCL, 5 mM EGTA, 10 mM EDTA, ‘complete protease inhibitor cocktail tablets’ (Roche, 1 tablet per 50 ml of buffer), and 2μg/ml pepstatin A dissolved in ethanol:DMSO 2:1 (Sigma). An IKA Ultra-Turrax mechanical probe (IKA Werke,Germany) was used for homogenization. Aliquots were immediately frozen on dry ice and stored at –70°C. Protein concentration was assessed in triplicate using the Coomassie (Bradford) Protein Assay Kit (Thermo Scientific, USA); briefly 10μl of crude homogenate was diluted 1:50 and read in triplicate at 595 nm using a FlexStation 3 (Molecular Devices).
Western blotting
Western blotting was undertaken as previously described [35]. Briefly, crude brain homogenate was diluted 4:5 with 5x sample buffer (Genscript MB01015, USA), boiled for 5 min then stored at –20°C. Samples were loaded at 20μg/ml total protein on 10% SDS-polyacrylamide gel for protein separation, transferred to nitrocellulose membrane (Hydrobond C, Amersham Biosciences, Amersham, UK), and probed with Proteasome 19S ATPase subunit RPT6 (p45-110, Enzo Life Sciences, Exeter, UK, 1:2000), Proteasome 20S α3 subunit (MCP257, Enzo Life Sciences, Exeter, UK, 1:2000) Proteasome 20S α6 subunit, (MCP20, Enzo Life Sciences, Exeter, UK, 1:2000). Bands were detected using an Odyssey infrared fluorescent scanner, the integral of intensity quantified using Odyssey infrared imaging systems application software version 3.0.16 and expressed as ratios to rat cortex run on the same gel in arbitrary units. All samples were run in duplicate.
Proteasome enzyme activity assay
Proteasome activity was assessed in postmortem brain tissue using fluorogenic synthetic peptide substrates (for chymotrypsin-like activity, Suc-Leu-Leu-Val-Tyr-AMC; for PGPH-like activity, Z-Leu-Leu-Glu-AMC) as described previously [36]. In brief, frozen grey matter from patient and control subjects were immediately homogenized by ultra turrax in ice-cold buffer (50 mM Tris-HCl, 1 mM EDTA, 10% glycerol, 2 mM ATP, 0.5 mM DTT, pH 7.5). Protein concentration was determined by the Bradford method. Brain lysates (100μl per well) containing 1 mg/ml of protein were incubated with 1μl (5 mM substrate III, Suc-Leu-Leu-Val-Tyr-AMC) or 10μl (1 mM substrate II, Z-Leu-Leu-Glu-AMC)1 mM PGPH substrates for 60 min at 37°C. Measurements were performed in 96-well plates (total volume 100μl per well) and all samples were assayed in triplicate for both activities. In a separate well, lysates were also pre-incubated with 5 mM carbobenzoxyl-leucinyl-leucinyl-leucinal(MG-132; a final concentration of 50μM for chymotrypsin-like activity) and 150μM for PGPH-like activity, or 100% DMSO for 30 min at room temperature. The background fluorescence values obtained by incubating the lysates with the proteasome inhibitors were subtracted from activity values. Proteasomal activity rates are expressed as fluorescence units (FU)/mg protein/h. The substrate hydrolysis was determined by measuring the fluorescence intensity of the AMC released using a FlexStation 3 (Molecular Devices LTD, UK) at an emission wavelength of 355 nm and an excitation wavelength of 460 nm. The specificity of the proteasomal assay was confirmed by the ability of the proteasome inhibitor to inhibit chymotrypsin-like and PGPH-like activities.
Statistical preparation and analysis
Statistical analysis of the biochemical data was undertaken as described previously [35, 37]. The normality of the data for each protein was determined using the Shapiro-Wilk test and normalized where necessary. In each case, the protein values were subsequently expressed as residuals (unstandardized) created from the multivariable regression analysis, to eliminate the confounding effect of the demographic variables (gender, postmortem delay (PMD), age at death, length of brain storage) on the protein values. RPT6 values were significantly predicted by age at death (in BA9 and 40) and PMD (in BA24 and 40), PGPH-like activity values were significantly predicted by PMD in BA40, and so a residual variable was created for this protein and this activity to statistically remove this effect. This variable was then normalized using a log10 transformation. We tested for differences in protein levels between groups using one-way ANOVA and Bonferroni post-hoc test. Intercorrelations of neurochemical variable and correlations with demographic and clinical features were examined using Pearson product moment (r) and regression analysis. Statistical analyses were conducted using SPSS version 20.
RESULTS
Patient demographic data
Demographic variables for the study cohort are summarized in Table 1. There were no significant differences in PMD, tissue pH, or gender between diagnostic groups. AD patients were significantly older at death (one-way ANOVA F(3;126) = 6.044, p = 0.001) than controls (p = 0.001), patients with DLB (p = 0.008), or PDD (p = 0.001). Therefore, residuals were calculated.
Differences in the levels of 19S ATPase RPT6 proteasome sub-unit between diagnostic groups
Significant reductions in RPT6 proteasome sub-unit were detected in the prefrontal cortex (BA9) in DLB (–17%, p = 0.001), PDD (–21%, p = 0.001), and AD (–22%, p = 0.001) compared with controls (one-way ANOVA, F = 24.303, d.f. = 3, 119; p = 0.001; Bonferroni post hoc test) (Fig. 1). In BA 40, there was a significant reduction in RPT6 proteasome sub-unit in DLB (–14%, p = 0.001) and AD (–23%, p = 0.001) compared with controls (one-way ANOVA, F = 16.33, d.f. = 3 and 121, p = 0.001; Bonferroni post hoc test). There was no significant alteration in the level of RPT6 protein in patients with PDD compared with the control groups (Fig. 1). Furthermore, significant reductions in RPT6 sub-unit levels were seen in DLB (–13%, p = 0.001) and AD (–13%, p = 0.001) compared with the PDD. In BA24 mean RPT6 levels were significantly elevated in patients with PDD by 15%, p = 0.001 compared with AD and DLB groups (one-way ANOVA F = 13.5, d.f. = 3 and 113, p = 0.001; Bonferroni post hoc test). The post hoc test revealed that there was no significant difference between the control and PDD groups (p > 0.05) (Fig. 1).
Assessment of PGPH-like proteasome activity
In BA9, a significant reduction in PGPH-like activity was seen in AD patients compared with controls (–23%, p = 0.012) (one-way ANOVA, F = 3.816, d.f. = 3 and 34, p = 0.019; Bonferroni post hoc test). There was no significant difference between DLB (–13%, p > 0.05) and PDD (–14%, p > 0.05) groups compared to controls (Fig. 2).
In BA40, there was a significant reduction in PGPH-like activity in the AD (–45%, p = 0.001), DLB (–39%, p = 0.001), and PDD (–29%, p = 0.02) groups compared with controls (Fig. 2). The differences between the patient groups and the control were statistically different (one-way ANOVA, F = 10.263, d.f. = 3 and 42, p = 0.001; Bonferroni post hoc test).
In BA24, there was a significant reduction in PGPH-like activity in DLB (–28%, p = 0.013), PDD (–64%, p = 0.001), and AD (–62%, p = 0.001) groups compared with control subjects (one-way ANOVA, F = 23.087, d.f. = 3 and 39, p = 0.001; Bonferroni post hoc test). The reduction in PGPH-like activity in PDD (–51%, p = 0.002) and AD (–47%, p = 0.004) was also significant different compared with DLB (Fig. 2).
Assessment of chymotrypsin-like proteasome activity
In BA9, chymotrypsin-like activity was significantly reduced in PDD (–27%, p = 0.004), DLB (–24% p = 0.013), and AD (–38%, p = 0.001), compared with control values (one-way ANOVA, F = 7.897, d.f = 3 and 34, p = 0.001; Bonferroni post hoc test) (Fig. 3). Chymotrypsin-like activity was lowest in the AD group compared with DLB and PDD; however, there were no significant differences among the three groups, PDD, DLB, or AD. In BA40, analysis of data indicated a significant reduction in chymotrypsin-like activity in the AD, DLB, and PDD (1415.85±9.9, n = 12, 1453.09±11.77, n = 9 and 1436.88±20.61, n = 10) groups compared with the control groups (1568.53±10.2, n = 13) (one-way ANOVA, F = 30.033, d.f. = 3 and 40, p = 0.001; Bonferroni post hoc test).
In BA24, chymotrypsin-like activity was found to be significantly lower in PDD (878±62, n = 9) and AD (906±72, n = 9) samples compared with both control (1100±39, n = 13) and DLB (1027±23, n = 12) subjects (one-way ANOVA, F = 4.663, d.f. = 3 and 39, p = 0.007; Bonferroni post hoc test).
Correlations between proteasome activity and expression level of RPT6 subunit
To test whether or not proteasome activity was associated with the protein levels of the proteasome subunits, Spearman’s rank correlation was determined between PGPH- and chymotrypsin-like activities, and the semi-quantitative protein values of RPT6. In BA9, significant positive correlations were found between RPT6 and both chymotrypsin-like activity (Rs 0.418, p = 0.009, n = 38) and PGPH-like activity (Rs 0.363, p = 0.025, n = 38), while in BA40, there was a significant positive correlation with only chymotrypsin-like activity (Rs 0.409, p = 0.006, n = 44).
Reduction in RPT6 were associated with cognitive impairment
The reduced levels of RPT6 detected in BA9 were found to be associated with cognitive impairment (Fig. 4A, R2 = 0.297, beta = –0.545, degree of freedom [df] = 1, 102, t = –6.571, p = 0.001), and this analysis included all control, DLB, PDD, and AD subjects. In addition, in pairwise comparisons, patients with mild dementia had mean RPT6 levels that were significantly lower than individuals with unimpaired cognition (41%, p = 0.001), and RPT6 levels were significantly lower in people with moderate dementia (both 20%, p = 0.001) and with severe dementia (both 23%, p = 0.001) in BA9 compared with controls. Reduced levels of RPT6 in BA40 were also associated with cognitive impairment (Fig. 4C, R2 = 0.180, beta = –0.425, df = 1, 105, t = –4.807, p = 0.001) according to regression analysis of all controls and dementia patients. In BA40, RPT6 levels were significantly lower in people with moderate cognitive impairment (both 10%, p = 0.033) and with severe cognitive impairment (both 19%, p = 0.001) compared with controls. The association between reduced levels of RPT6 and cognitive impairment in BA24 was weaker (Fig. 4B, R2 = 0.04, beta = –0.206, df = 1, 99, t = –2.09, p = 0.039) and not significantly different between people with different severities of cognitive impairment (one-way ANOVA p > 0.05).
Reduced proteasome activity is associated with cognitive impairment
Chymotrypsin-like and PGPH proteasome activities had a significant inverse association with cognitive impairment in BA9 (according to regression analysis of all dementia patients and controls) (Fig. 5A and D, R2 = 0.337, beta = –0.581, [df] = 1, 29, t = –3.84, p = 0.001, R2 = 0.275, beta = –0.524, [df] = 1, 29, t = –3.315, p = 0.002), in BA24 (Fig. 5B and E, R2 = 0.151, beta = –0.388, [df] = 1, 38, t = –2.599, p = 0.013, R2 = 0.371, beta = –0.609, [df] = 1, 38, t = –4.733, p = 0.001), and in BA40 (Fig. 5C and F, R2 = 0.531, beta = –0.728, [df] = 1, 40, t = –6.72, p = 0.001, R2 = 0.217, beta = –0.466, [df] = 1, 38, t = –3.244, p = 0.002). Pairwise comparisons in BA9 indicated high chymotrypsin-like activity in the control compared with moderate (p = 0.014) and severe scores (p = 0.01) (one-way ANOVA F = 5.009, d.f. = 4 and 26, p = 0.004; Bonferroni post hoc test). The difference in PGPH-like activity between cognitive impairment groups was significant between individuals with unimpaired and moderately impaired cognition (one-way ANOVA F = 3.616, d.f. = 4 and 26, p = 0.004; Bonferroni post hoc test). In BA24, there was no significant difference in chymotrypsin-like activity in unimpaired cognition group compared with all other groups. The difference in PGPH-like activity between cognitive impairment groups was significantly different between unimpaired cognition groups and MCI (p = 0.03), mild (p = 0.024), moderate (p = 0.001), and severe scores (p = 0.001) (one-way ANOVA F = 9.839, d.f. = 4 and 35, p = 0.001; Bonferroni post hoc test). In BA40, the level of chymotrypsin-like activity was significantly higher in the unimpaired cognition group compared with MCI (p = 0.001), mild (p = 0.001), moderate (p = 0.001), and severe scores (p = 0.001) (one-way ANOVA F = 21.845, d.f. = 4 and 37, p = 0.001; Bonferroni post hoc test). PGPH-like activity was significantly higher between unimpaired cognition group compared with MCI (p = 0.02), mild (p = 0.001), moderate (p = 0.001), and severe scores (p = 0.034) (one-way ANOVA F = 8.851, d.f. = 4 and 35, p = 0.001; Bonferroni post hoc test).
We assessed the levels of alpha3 and alpha6, essential subunits of the 20S catalytic unit (Supplementary Figures 1 and 2, respectively). We also expressed the measurement of both chymotrypsin-like and PGPH-like activity as a ratio to both subunits to determine if the changes we saw represented a change in rate of activity per catalytic unit or of the number of catalytic units (Supplementary Figures 3–6). It can be seen that there was no overall pattern with high variation according to brain region.
DISCUSSION
The main finding of the present study was the reductions of the RPT6 ATPase 19S regulatory subunit in DLB and AD in the frontal lobe neocortical area BA9, anterior cingulate gyrus BA24, and parietal cortex BA40. Furthermore, the reduction in RPT6 levels was associated with changes in two proteasome proteolytic activities. Finally, both measurements were associated with cognitive scores prior to death. In this study, for the first time, an association between cognitive decline and both the reduction of RPT6 and the proteolytic activity of the proteasome has been demonstrated.
RPT6 is one of the six ATPase subunits (RPT 1–6) of the 19S regulatory complex; it is a 45kDa subunit. Degradation of ubiquitinated substrate proteins by the 26S proteasome is dependent upon ATP [13], which binds to the six ATPase subunits of the 19S regulatory complex. All six of the ATPase subunits contain the same substantial main functional domains: an N-terminus coiled-coil domain important for formation of the 19S base, and a C-terminus ATPase domain that is involved in ATP-dependent substrate unfolding and 20S CP opening [38]. These ATPases provide the energy necessary for the degradation of multi-ubiquitin conjugated proteins by the 26S proteasome, and it is also believed that ATPase subunits participate in the substrate-unfolding step of the degradation pathway [39].
It has been shown previously that the 19S RPT6 expression level decreased when α-synuclein was increased in mouse PD models [40] and a study of 9 PD, 7 PDD, and 9 controls revealed a decrease in the 19S RPT3/S6 subunit in the inferior frontal gyri of PDD although the expression was similar in control and PD [41]. Inactivation of the 19S regulatory particle (RPT2) subunit prevented the formation of the 26S proteasome, leaving the 20S proteasome subunit, which is ubiquitin-independent, unaffected [42]. Therefore, the reduction in RPT6 subunit expression identified in DLB, PDD, and AD patients in three brain regions and the associated reduction in proteasome activity confirms and extends previous studies by demonstrating this phenomenon in the human brain and suggests that reduced subunit expression may directly lead to proteasome impairment. The reason for the reduction in RPT6 ATPase subunit expression remains unexplained. It is possible that the reduction could be related to oxidative stress; indeed, proteasome subunits were demonstrated to be sensitive to oxidative stress [43, 44]. Furthermore, Sun et al. reported that proteasome subunits (RPT5, Rpn10, and Rpn2) can be cleaved by caspase-3 following caspase activation during apoptosis; they found decreased proteasome activity to be associated with the cleavage of these subunits [45].
RPT6 phosphorylation enhances proteolysis by promoting the assembly of the 26S proteasome, and RPT6 dephosphorylation promoted the dissociation of 26S into 19S and 20S components [46]. It is proposed that the reduction of proteasome activity is due to the decrease in the RPT6 level as there was a correlation between lower RPT6 protein levels and proteasome activity in BA9 and BA40. It could also be due to the important role of RPT6 in promoting the activity of proteasomes. The reduction of the proteolytic activity could also arise from the blockading of the entry pore to the 20S proteasome by protein aggregates, such as α-synuclein, which may in turn impede degradation of this and other proteins [47–49]. Inhibition of the 26 S proteasome with soluble oligomeric species of mutant and wild-type α-synuclein in PC12 cells has been emonstrated [47]. It is clear that these oligomers are degraded by the proteasomes, as they accumulate when proteasome function is inhibited. Proteasome inhibitors have been reported to induce α-synuclein aggregation and Lewy body-like inclusions, leading to neuronal loss among in vitro and in vivo models [42]. However, it is not clear whether the aggregation results from the impairment of the proteasomes or vice versa [50]. Results from experimental studies have indicated that inhibition of the proteasomes causes the formation of aggregates [42, 51] and protein aggregation inhibits the proteasome activity [47].
In this study, we found a reduction in RPT6 and the proteasome activity in relation to cognitive decline. It is not clear how proteasome impairment, specifically reduction in RPT6, could result in cognitive impairment. A possible mechanistic explanation for this is that the proteasome activity is regulated by protein such as Calcium/calmodulin-dependent protein kinase II (CaMKII), which plays an essential role in long-term synaptic plasticity and cognitive function [52, 53]. Consistent with this, Jarome et al. showed that phosphorylation of RPT6 by CaMKII increased proteasome activity in vivo and proteasome activity was necessary for long-term memory function [54, 55]. Reductions in CaMKII affect signaling pathways, including phosphorylation of RPT6, and thus the proteasome activity [54, 55], which could in turn impair synaptic plasticity and contribute to cognitive dysfunction. CaMKII has been shownto mediate proteasome activity and act as a scaffold to recruit proteasomes to dendritic spines and regulate its activity by phosphorylation of the RPT6 subunits [56]. Activation of NMDA receptors has been shown to induce this movement of the proteasome to the dendritic spine compartment [57].
In view of the above, our data strongly suggest that proteasome activation may be a target for disease modification of both DLB and PDD. In support of this view, compounds which enhance proteasome activity have been suggested to be neuroprotective. For example, pre-treatment with trans-retinoic acid protected against cell death induced by epoxomicin (a proteasome inhibitor) in SH-SY5Y cells [58]. Furthermore, altered insulin and insulin-like growth factor (IGF-1) signaling have been reported to influence the proteasome activity [59, 60], and both insulin and IGF-1 receptor expression was reduced in DLB [61]. Supporting this, treatment with IGF-1 prevented the apoptotic effects of epoxomicin on SH-SY5Y cells [62]. Therefore, compounds that are able to ameliorate insulin signaling may have disease-modifying activity in PDD and DLB. Of these, the glucagon-like pepide-1 (GLP-1) analogues are the most clinically advanced. These synthetic GLP-1 analogues such as exendin-4, liraglutide, albiglutide, and lixisenatide are resistant to degradation by dipeptidyl peptidase, pass the blood-brain barrier similar to GLP-1, (except for albiglutide), and bind to the GLP-1 receptor, bringing about an increase in insulin biosynthesis and release [63]. Both exenatide (exendin-4) and liraglutide are currently in phase II clinical trials for the treatment of AD (NCT01255163 and NCT01843075, respectively [64]. Furthermore, exenatide is currently in a phase II trial for the treatment of PD (NCT01971242). These studies suggest that compounds acting on GLP-1 receptors may translate well for the treatment of people with DLB or PDD. It is noteworthy that both retinoic acid and GLP-1 analogues have previously been suggested from drug repositioning studies for AD [65]. Many of these compounds have additional mechanisms of action, including lowering plasma glucose concentrations for GLP-1 analogues. However, key candidate therapies are likely to involve more than one mechanism of action.
The strengths of this study are the large number of LBD cases, our access to all the clinical data and the number of projects undertaken on the same cohort, which provide chemical information on synaptic functions in addition to pathological and clinical data [35, 37, 66–69]. Furthermore, this study examined three brain regions and compared the results from each of the regions separately to determine whether the biochemical changes are specific to a particular brain area or if all of the regions have the same alteration. However, despite these advantages, there are also a number of limitations regarding the use of postmortem tissues which need to be taken into consideration. These include antemortem factors such as medication history, meaning we could not identify whether or not the medication had any effect on our observations. Postmortem factors, including PMD, and the handling and storage of tissue are further problems that also should be addressed when performing studies with postmortem tissue reviewed in [70]. Furthermore, alteration of brain tissue pH, as a consequence of agonal state can affect sample quality for genetic and biochemical measurements. These factors were taken into consideration when planning the studies in this study. Post/antemortem factors for controls, DLB, PDD, and AD were matched as closely as possible for PMD and pH, and any relationships found between protein measurements and demographics/post-mortem factors were controlled for via the creation of unstandardized residuals.
In conclusion, the present study has demonstrated that, in PDD, DLB, and AD, the activity of the RPT6 ATPase 19S regulatory subunit of the proteasome is decreased and associated with cognitive decline. The present study provides support for enhancement of the proteasome activity as a therapeutic target and current leading candidate are GLP-1 analogues.
ACKNOWLEDGMENTS
The main funding was provided by a PhD studentship from King Saud University College of Science (A.A.), with additional support from the Alzheimer’s Society UK and the BUPA Foundation. Dr Broadstock was an Edmond and Lily Safra Senior Research Fellow. The research in Newcastle was supported in part by the Dunhill Medical Trust (R173/1110). Tissue for this study was provided by (i) the Newcastle Brain Tissue Resource; (ii) the London Neurodegenerative Brain Bank; and (iii) the Thomas Willis Oxford Brain Collection. All three resources are funded in part by grants from the UK Medical Research Council and by Brains for Dementia Research, a joint venture between Alzheimer’s Society and Alzheimer’s Research UK. Professor Margaret Esiri and Drs. Olaf Ansorge, Safa Al-Sarraj, Istvan Bodi, and Andrew King are thanked for neuropathological diagnosis of cases.Dr. Claire Troakes at the MRC London Neurodegenerative Diseases Brain Bank is thanked for supplying tissue sections. The authors express their thanks to all the donors and brain banks for the tissue used in this study. This Newcastle Brain Tissue Resource is supported by the National Institute for Health Research (NIHR) Newcastle Biomedical Research Unit based at Newcastle upon Tyne Hospitals NHS Foundation Trust and Newcastle University and the Medical Research Council and Brains for Dementia Research. The MRC London Neurodegenerative Diseases Brain Bank is funded by the Medical Research Council and Brains for Dementia Research. TH has received salary support from the Hungarian Brain Research Programme Grant No. KTIA_13_NAP-A-II/7. CB would like to thank the National Institute for Health Research (NIHR) Mental Health Biomedical Research Centre and Dementia Unit at South London and Maudsley NHS Foundation Trust and [Institute of psychiatry] King’s College London. This article presents independent research supported/funded by the National Institute for Health Research (NIHR). The views expressed are those of the authors and not necessarily those of the NHS, the NIHR or the Department of Health.
Authors’ disclosures available online (http://j-alz.com/manuscript-disclosures/16-0946r2).
Appendices
The supplementary material is available in the electronic version of this article: http://dx.doi.org/10.3233/JAD-160946.
REFERENCES
[1] | McKeith IG , Dickson DW , Lowe J , Emre M , O’Brien JT , Feldman H , Cummings J , Duda JE , Lippa C , Perry EK , Aarsland D , Arai H , Ballard CG , Boeve B , Burn DJ , Costa D , Del Ser T , Dubois B , Galasko D , Gauthier S , Goetz CG , Gomez-Tortosa E , Halliday G , Hansen LA , Hardy J , Iwatsubo T , Kalaria RN , Kaufer D , Kenny RA , Korczyn A , Kosaka K , Lee VMY , Lees A , Litvan I , Londos E , Lopez OL , Minoshima S , Mizuno Y , Molina JA , Mukaetova-Ladinska EB , Pasquier F , Perry RH , Schulz JB , Trojanowski JQ , Yamada M , Consortium on DLB ((2005) ) Diagnosis and management of dementia with Lewy bodies - Third report of the DLB consortium. Neurology 65: , 1863–1872. |
[2] | McKeith I , Mintzer J , Aarsland D , Burn D , Chiu H , Cohen-Mansfield J , Dickson D , Dubois B , Duda JE , Feldman H , Gauthier S , Halliday G , Lawlor B , Lippa C , Lopez OL , Machado JC , O’Brien J , Playfer J , Reid W , International Psychogeriatric Association Expert Meeting on DLB ((2004) ) Dementia with Lewy bodies. Lancet Neurol 3: , 19–28. |
[3] | Tsuboi Y , Dickson DW ((2005) ) Dementia with Lewy bodies and Parkinson’s disease with dementia: Are they different? Parkinsonism Relat Disord 11 Suppl 1: , S47–S51. |
[4] | Lippa CF , Ozawa K , Mann DM , Ishii K , Smith TW , Arawaka S , Mori H ((1999) ) Deposition of beta-amyloid subtypes 40 and 42 differentiates dementia with Lewy bodies from Alzheimer disease. Arch Neurol 56: , 1111–1118. |
[5] | Ballard C , Piggott M , Johnson M , Cairns N , Perry R , McKeith I , Jaros E , O’Brien J , Holmes C , Perry E ((2000) ) Delusions associated with elevated muscarinic binding in dementia with Lewy bodies. Ann Neurol 48: , 868–876. |
[6] | Perry EK , Marshall E , Thompson P , McKeith IG , Collerton D , Fairbairn AF , Ferrier IN , Irving D , Perry RH ((1993) ) Monoaminergic activities in Lewy body dementia: Relation to hallucinosis and extrapyramidal features. J Neural Transm Park Dis Dement Sect 6: , 167–177. |
[7] | Ziabreva I , Ballard CG , Aarsland D , Larsen JP , McKeith IG , Perry RH , Perry EK ((2006) ) Lewy body disease: Thalamic cholinergic activity related to dementia and parkinsonism. Neurobiol Aging 27: , 433–438. |
[8] | Emre M , Aarsland D , Albanese A , Byrne EJ , Deuschl G , De Deyn PP , Durif F , Kulisevsky J , van Laar T , Lees A , Poewe W , Robillard A , Rosa MM , Wolters E , Quarg P , Tekin S , Lane R ((2004) ) Rivastigmine for dementia associated with Parkinson’s disease. N Engl J Med 351: , 2509–2518. |
[9] | McKeith IG , Grace JB , Walker Z , Byrne EJ , Wilkinson D , Stevens T , Perry EK ((2000) ) Rivastigmine in the treatment of dementia with Lewy bodies: Preliminary findings from an open trial. Int J Geriatr Psychiatry 15: , 387–392. |
[10] | Aarsland D , Ballard C , Walker Z , Bostrom F , Alves G , Kossakowski K , Leroi I , Pozo-Rodriguez F , Minthon L , Londos E ((2009) ) Memantine in patients with Parkinson’s disease dementia or dementia with Lewy bodies: A double-blind, placebo-controlled, multicentre trial. Lancet Neurol 8: , 613–618. |
[11] | Bennett MC , Bishop JF , Leng Y , Chock PB , Chase TN , Mouradian MM ((1999) ) Degradation of alpha-synuclein by proteasome. J Biol Chem 274: , 33855–33858. |
[12] | Baumeister W , Walz J , Zühl F , Seemüller E ((1998) ) The proteasome: Paradigm of a self-compartmentalizing protease. Cell 92: , 367–380. |
[13] | Rivett AJ ((1989) ) The multicatalytic proteinase. Multiple proteolytic activities. J Biol Chem 264: , 12215–12219. |
[14] | Orlowski M , Cardozo C , Michaud C ((1993) ) Evidence for the presence of five distinct proteolytic components in the pituitary multicatalytic proteinase complex. Properties of two components cleaving bonds on the carboxyl side of branched chain and small neutral amino acids. Biochemistry 32: , 1563–1572. |
[15] | Tai HC , Schuman EM ((2008) ) Ubiquitin, the proteasome and protein degradation in neuronal function and dysfunction. Nat Rev Neurosci 9: , 826–838. |
[16] | Braun BC , Glickman M , Kraft R , Dahlmann B , Kloetzel PM , Finley D , Schmidt M ((1999) ) The base of the proteasome regulatory particle exhibits chaperone-like activity. Nat Cell Biol 1: , 221–226. |
[17] | Lam YA , Lawson TG , Velayutham M , Zweier JL , Pickart CM ((2002) ) A proteasomal ATPase subunit recognizes the polyubiquitin degradation signal. Nature 416: , 763–767. |
[18] | Dennissen FJ , Kholod N , van Leeuwen FW ((2012) ) The ubiquitin proteasome system in neurodegenerative diseases: Culprit, accomplice or victim? Prog Neurobiol 96: , 190–207. |
[19] | Paul S ((2008) ) Dysfunction of the ubiquitin-proteasome system in multiple disease conditions: Therapeutic approaches. Bioessays 30: , 1172–1184. |
[20] | Alves-Rodrigues A , Gregori L , Figueiredo-Pereira ME ((1998) ) Ubiquitin, cellular inclusions and their role in neurodegeneration. Trends Neurosci 21: , 516–520. |
[21] | McNaught KS , Belizaire R , Isacson O , Jenner P , Olanow CW ((2003) ) Altered proteasomal function in sporadic Parkinson’s disease. Exp Neurol 179: , 38–46. |
[22] | MacInnes N , Iravani MM , Perry E , Piggott M , Perry R , Jenner P , Ballard C ((2008) ) Proteasomal abnormalities in cortical Lewy body disease and the impact of proteasomal inhibition within cortical and cholinergic systems. J Neural Transm 115: , 869–878. |
[23] | Figueiredo-Pereira ME , Berg KA , Wilk S ((1994) ) A new inhibitor of the chymotrypsin-like activity of the multicatalytic proteinase complex (20S proteasome) induces accumulation of ubiquitin-protein conjugates in a neuronal cell. J Neurochem 63: , 1578–1581. |
[24] | Dyllick-Brenzinger M , D’Souza CA , Dahlmann B , Kloetzel PM , Tandon A ((2010) ) Reciprocal effects of alpha-synuclein overexpression and proteasome inhibition in neuronal cells and tissue. Neurotox Res 17: , 215–227. |
[25] | Paxinou E , Chen Q , Weisse M , Giasson BI , Norris EH , Rueter SM , Trojanowski JQ , Lee VM , Ischiropoulos H ((2001) ) Induction of alpha-synuclein aggregation by intracellular nitrative insult. J Neurosci 21: , 8053–8061. |
[26] | Snyder H , Mensah K , Theisler C , Lee J , Matouschek A , Wolozin B ((2003) ) Aggregated and monomeric alpha-synuclein bind to the S6’ proteasomal protein and inhibit proteasomal function. J Biol Chem 278: , 11753–11759. |
[27] | Fuster JM ((2001) ) The prefrontal cortex–an update: Time is of the essence. Neuron 30: , 319–333. |
[28] | Alafuzoff I , Ince PG , Arzberger T , Al-Sarraj S , Bell J , Bodi I , Bogdanovic N , Bugiani O , Ferrer I , Gelpi E , Gentleman S , Giaccone G , Ironside JW , Kavantzas N , King A , Korkolopoulou P , Kovacs GG , Meyronet D , Monoranu C , Parchi P , Parkkinen L , Patsouris E , Roggendorf W , Rozemuller A , Stadelmann-Nessler C , Streichenberger N , Thal DR , Kretzschmar H ((2009) ) Staging/typing of Lewy body related alpha-synuclein pathology: A study of the BrainNet Europe Consortium. Acta Neuropathol 117: , 635–652. |
[29] | Alafuzoff I , Arzberger T , Al-Sarraj S , Bodi I , Bogdanovic N , Braak H , Bugiani O , Del-Tredici K , Ferrer I , Gelpi E , Giaccone G , Graeber MB , Ince P , Kamphorst W , King A , Korkolopoulou P , Kovacs GG , Larionov S , Meyronet D , Monoranu C , Parchi P , Patsouris E , Roggendorf W , Seilhean D , Tagliavini F , Stadelmann C , Streichenberger N , Thal DR , Wharton SB , Kretzschmar H ((2008) ) Staging of neurofibrillary pathology in Alzheimer’s disease: A study of the BrainNet Europe Consortium. Brain Pathol 18: , 484–496. |
[30] | Braak H , Alafuzoff I , Arzberger T , Kretzschmar H , Del Tredici K ((2006) ) Staging of Alzheimer disease-associated neurofibrillary pathology using paraffinsections and immunocytochemistry. Acta Neuropathol 112: , 389–404. |
[31] | Mirra SS , Heyman A , McKeel D , Sumi SM , Crain BJ , Brownlee LM , Vogel FS , Hughes JP , Vanbelle G , Berg L ((1991) ) The Consortium to Establish a Registry for Alzheimer’s Disease (CERAD). Part II. Standardization of the neuropathologic assessment of Alzheimer’s disease. Neurology 41: , 479–486. |
[32] | Montine TJ , Phelps CH , Beach TG , Bigio EH , Cairns NJ , Dickson DW , Duyckaerts C , Frosch MP , Masliah E , Mirra SS , Nelson PT , Schneider JA , Thal DR , Trojanowski JQ , Vinters HV , Hyman BT ((2012) ) National Institute on Aging-Alzheimer’s Association guidelines for the neuropathologic assessment of Alzheimer’s disease: A practical approach. Acta Neuropathol 123: , 1–11. |
[33] | Thal DR , Rub U , Orantes M , Braak H ((2002) ) Phases of A beta-deposition in the human brain and its relevance for the development of AD. Neurology 58: , 1791–1800. |
[34] | Folstein MF , Folstein SE , McHugh PR ((1975) ) Mini-mental state. A practical method for grading the cognitive state of patients for the clinician. J Psychiatr Res 12: , 189–198. |
[35] | Whitfield DR , Vallortigara J , Alghamdi A , Howlett D , Hortobagyi T , Johnson M , Attems J , Newhouse S , Ballard C , Thomas AJ , O’Brien JT , Aarsland D , Francis PT ((2014) ) Assessment of ZnT3 and PSD95 protein levels in Lewy body dementias and Alzheimer’s disease: Association with cognitive impairment. Neurobiol Aging 35: , 2836–2844. |
[36] | Zeng BY , Medhurst AD , Jackson M , Rose S , Jenner P ((2005) ) Proteasomal activity in brain differs between species, and brain regions and changes with age. Mech Ageing Dev 126: , 760–766. |
[37] | Whitfield DR , Vallortigara J , Alghamdi A , Hortobagyi T , Ballard C , Thomas AJ , O’Brien JT , Aarsland D , Francis PT ((2015) ) Depression and synaptic zinc regulation in Alzheimer disease, dementia with Lewy bodies, and Parkinson disease dementia. Am J Geriatr Psychiatry 23: , 141–148. |
[38] | Marques AJ , Palanimurugan R , Matias AC , Ramos PC , Dohmen RJ ((2009) ) Catalytic mechanism and assembly of the proteasome. Chem Rev 109: , 1509–1536. |
[39] | Strickland E , Hakala K , Thomas PJ , DeMartino GN ((2000) ) Recognition of misfolding proteins by PA700, the regulatory subcomplex of the 26 S proteasome. J Biol Chem 275: , 5565–5572. |
[40] | Liu B , Shi QQ , Ma SP , Feng N , Li J , Wang L , Wang XL ((2008) ) Striatal 19S Rpt6 deficit is related to alpha-synuclein accumulation in MPTP-treated mice. Biochem Biophys Res Commun 376: , 277–282. |
[41] | Wills J , Jones J , Haggerty T , Duka V , Joyce JN , Sidhu A ((2010) ) Elevated tauopathy and alpha-synuclein pathology in postmortem Parkinson’s disease brains with and without dementia. Exp Neurol 225: , 210–218. |
[42] | Bedford L , Hay D , Devoy A , Paine S , Powe DG , Seth R , Gray T , Topham I , Fone K , Rezvani N , Mee M , Soane T , Layfield R , Sheppard PW , Ebendal T , Usoskin D , Lowe J , Mayer RJ ((2008) ) Depletion of 26S proteasomes in mouse brain neurons causes neurodegeneration and Lewy-like inclusions resembling human pale bodies. J Neurosci 28: , 8189–8198. |
[43] | Yang W , Chen LN , Ding YM , Zhuang XX , Kang UJ ((2007) ) Paraquat induces dopaminergic dysfunction and proteasome impairment in DJ-1-deficient mice. Hum Mol Genet 16: , 2900–2910. |
[44] | Zeng BY , Iravani MM , Lin ST , Irifune M , Kuoppamaki M , Al-Barghouthy G , Smith L , Jackson MJ , Rose S , Medhurst AD , Jenner P ((2006) ) MPTP treatment of commonmarmosets impairs proteasomal enzyme activity and decreases expression of structural and regulatory elements of the 26S proteasome. Eur J Neurosci 23: , 1766–1774. |
[45] | Sun XM , Butterworth M , MacFarlane M , Dubiel W , Ciechanover A , Cohen GM ((2004) ) Caspase activation inhibits proteasome, function during apoptosis. Mol Cell 14: , 81–93. |
[46] | Satoh K , Sasajima H , Nyoumura K , Yokosawa K , Sawada H ((2001) ) Assembly of the 26S proteasome is regulated by phosphorylation of the p45/Rpt6 ATPase subunit. Biochemistry 40: , 314–319. |
[47] | Emmanouilidou E , Stefanis L , Vekrellis K ((2010) ) Cell-produced alpha-synuclein oligomers are targeted to, and impair, the 26S proteasome. Neurobiol Aging 31: , 953–968. |
[48] | Liu CW , Giasson BI , Lewis KA , Lee VM , Demartino GN , Thomas PJ ((2005) ) A precipitating role for truncated alpha-synuclein and the proteasome in alpha-synuclein aggregation: Implications for pathogenesis of Parkinson disease. J Biol Chem 280: , 22670–22678. |
[49] | Zhang NY , Tang Z , Liu CW ((2008) ) alpha-Synuclein protofibrils inhibit 26 S proteasome-mediated protein degradation: Understanding the cytotoxicity of protein protofibrils in neurodegenerative disease pathogenesis. J Biol Chem 283: , 20288–20298. |
[50] | Lansbury PT , Lashuel HA ((2006) ) A century-old debate on protein aggregation and neurodegeneration enters the clinic. Nature 443: , 774–779. |
[51] | McNaught KS , Mytilineou C , JnoBaptiste R , Yabut J , Shashidharan P , Jenner P , Olanow CW ((2002) ) Impairment of the ubiquitin-proteasome system causes dopaminergic cell death and inclusion body formation in ventral mesencephalic cultures. J Neurochem 81: , 301–306. |
[52] | Giese KP , Fedorov NB , Filipkowski RK , Silva AJ ((1998) ) Autophosphorylation at Thr286 of the alpha calcium-calmodulin kinase II in LTP and learning. Science 279: , 870–873. |
[53] | Miyamoto E ((2006) ) Molecular mechanism of neuronal plasticity: Induction and maintenance of long-term potentiation in the hippocampus. J Pharmacol Sci 100: , 433–442. |
[54] | Jarome TJ , Helmstetter FJ ((2013) ) The ubiquitin-proteasome system as a critical regulator of synaptic plasticity and long-term memory formation. Neurobiol Learn Mem 105: , 107–116. |
[55] | Jarome TJ , Kwapis JL , Ruenzel WL , Helmstetter FJ ((2013) ) CaMKII, but not protein kinase A, regulates Rpt6 phosphorylation and proteasome activity during the formation of long-term memories. Front Behav Neurosci 7: , 115. |
[56] | Bingol B , Wang CF , Arnott D , Cheng D , Peng J , Sheng M ((2010) ) Autophosphorylated CaMKIIalpha acts as a scaffold to recruit proteasomes to dendritic spines. Cell 140: , 567–578. |
[57] | Bingol B , Schuman EM ((2006) ) Activity-dependent dynamics and sequestration of proteasomes in dendritic spines. Nature 441: , 1144–1148. |
[58] | Cheng BX , Martinez AA , Morado J , Scofield V , Roberts JL , Maffi SK ((2013) ) Retinoic acid protects against proteasome inhibition associated cell death in SH-SY5Y cells via the AKT pathway. Neurochem Int 62: , 31–42. |
[59] | Matilainen O , Arpalahti L , Rantanen V , Hautaniemi S , Holmberg CI ((2013) ) Insulin/IGF-1 signaling regulates proteasome activity through the deubiquitinating enzyme UBH-4. Cell Rep 3: , 1980–1995. |
[60] | Saez I , Vilchez D ((2014) ) The mechanistic links between proteasome activity, aging and agerelated diseases. Curr Genomics 15: , 38–51. |
[61] | Tong M , Dong M , de la Monte SM ((2009) ) Brain insulin-like growth factor and neurotrophin resistance in Parkinson’sdisease and dementia with Lewy bodies: Potential role of manganese neurotoxicity. J Alzheimers Dis 16: , 585–599. |
[62] | Cheng BX , Maffi SK , Martinez AA , Acosta YPV , Morales LD , Roberts JL ((2011) ) Insulin-like growth factor-I mediates neuroprotection in proteasome inhibition-induced cytotoxicity in SH-SY5Y cells. Mol Cell Neurosci 47: , 181–190. |
[63] | Bassil F , Fernagut PO , Bezard E , Meissner WG ((2014) ) Insulin, IGF-1 and GLP-1 signaling in neurodegenerative disorders: Targets for disease modification? Prog Neurobiol 118: , 1–18. |
[64] | Broadstock M , Ballard C , Corbett A ((2014) ) Latest treatment options for Alzheimer’s disease, Parkinson’s disease dementia and dementia with Lewy bodies. Expert Opin Pharmacother 15: , 1797–1810. |
[65] | Corbett A , Pickett J , Burns A , Corcoran J , Dunnett SB , Edison P , Hagan JJ , Holmes C , Jones E , Katona C , Kearns I , Kehoe P , Mudher A , Passmore A , Shepherd N , Walsh F , Ballard C ((2012) ) Drug repositioning for Alzheimer’s disease. Nat Rev Drug Discov 11: , 833–846. |
[66] | Howlett DR , Whitfield D , Johnson M , Attems J , O’Brien JT , Aarsland D , Lai MK , Lee JH , Chen C , Ballard C , Hortobágyi T , Francis PT ((2015) ) Regional multiple pathology scores are associated with cognitive decline in Lewy body dementias. Brain Pathol 25: , 401–408. |
[67] | Vallortigara J , Rangarajan S , Whitfield D , Alghamdi A , Howlett D , Hortobágyi T , Johnson M , Attems J , Ballard C , Thomas A , O’Brien J , Aarsland D , Francis P ((2014) ) Dynamin1 concentration in the prefrontal cortex is associated with cognitive impairment in Lewy body dementia. F1000Res 3: , 108. |
[68] | Baek JH , Whitfield D , Howlett D , Francis P , Bereczki E , Ballard C , Hortobágyi T , Attems J , Aarsland D ((2016) ) Unfolded protein response is activated in Lewy body dementias. Neuropathol Appl Neurobiol 42: , 352–365. |
[69] | Vallortigara J , Whitfield D , Quelch W , Alghamdi A , Howlett D , Hortobágyi T , Johnson M , Attems J , O’Brien JT , Thomas A , Ballard CG , Aarsland D , Francis PT ((2016) ) Decreased levels of VAMP2 and monomeric alpha-synuclein correlate with duration of dementia. J Alzheimers Dis 50: , 101–110. |
[70] | Hynd MR , Lewohl JM , Scott HL , Dodd PR ((2003) ) Biochemical and molecular studies using human autopsy brain tissue. J Neurochem 85: , 543–562. |
Figures and Tables
Fig.1
19S ATPase RPT6, proteasome sub-unit values, from semi-quantitative western blotting in PDD, DLB, AD, and control in BA9, BA24, and BA40. The image is a representative western blot showing an example of the diagnosis-specific reductions of the 19S ATPase RPT6 in BA9 (A), BA24 (B), and BA40 (C). Statistical analysis was performed using one-way analysis of variance (ANOVA) and Bonferronipost hoc test. BA9 (D): Mean RPT6 values from controls (n = 24) were significantly higher than Parkinson’s disease dementia (PDD) (p = 0.001, n = 33), dementia with Lewy bodies (DLB) (p = 0.001, n = 50), and AD (p = 0.001, n = 16) groups, one-way ANOVA (F = 24.303, d.f. = 3, 119, p = 0.001 followed by Bonferroni post hoc test). BA24 (E): Mean RPT6 values for the control (n = 24) and PDD (n = 33) groups were significantly higher than DLB (p < 0.05, n = 52) and AD (p < 0.05, n = 16) groups. There was no difference between the control and PDD groups, one-way ANOVA (F = 13.56, d.f. = 3 and 113, p = 0.001; Bonferroni post hoc test). BA40 (F): There was no significant difference in RPT6 levels between controls and PDD, but RPT6 levels for the control group (n = 24) and PDD (n = 33) groups were significantly higher than DLB (p < 0.05, n = 52) and AD (p = 0.001, n = 16) groups, one-way ANOVA (F = 16.333, d.f. = 3 and 121, p = 0.001; Bonferroni post hoc test). The horizontal bars within the data points in the graphs represent the mean values. (**p < 0.01).
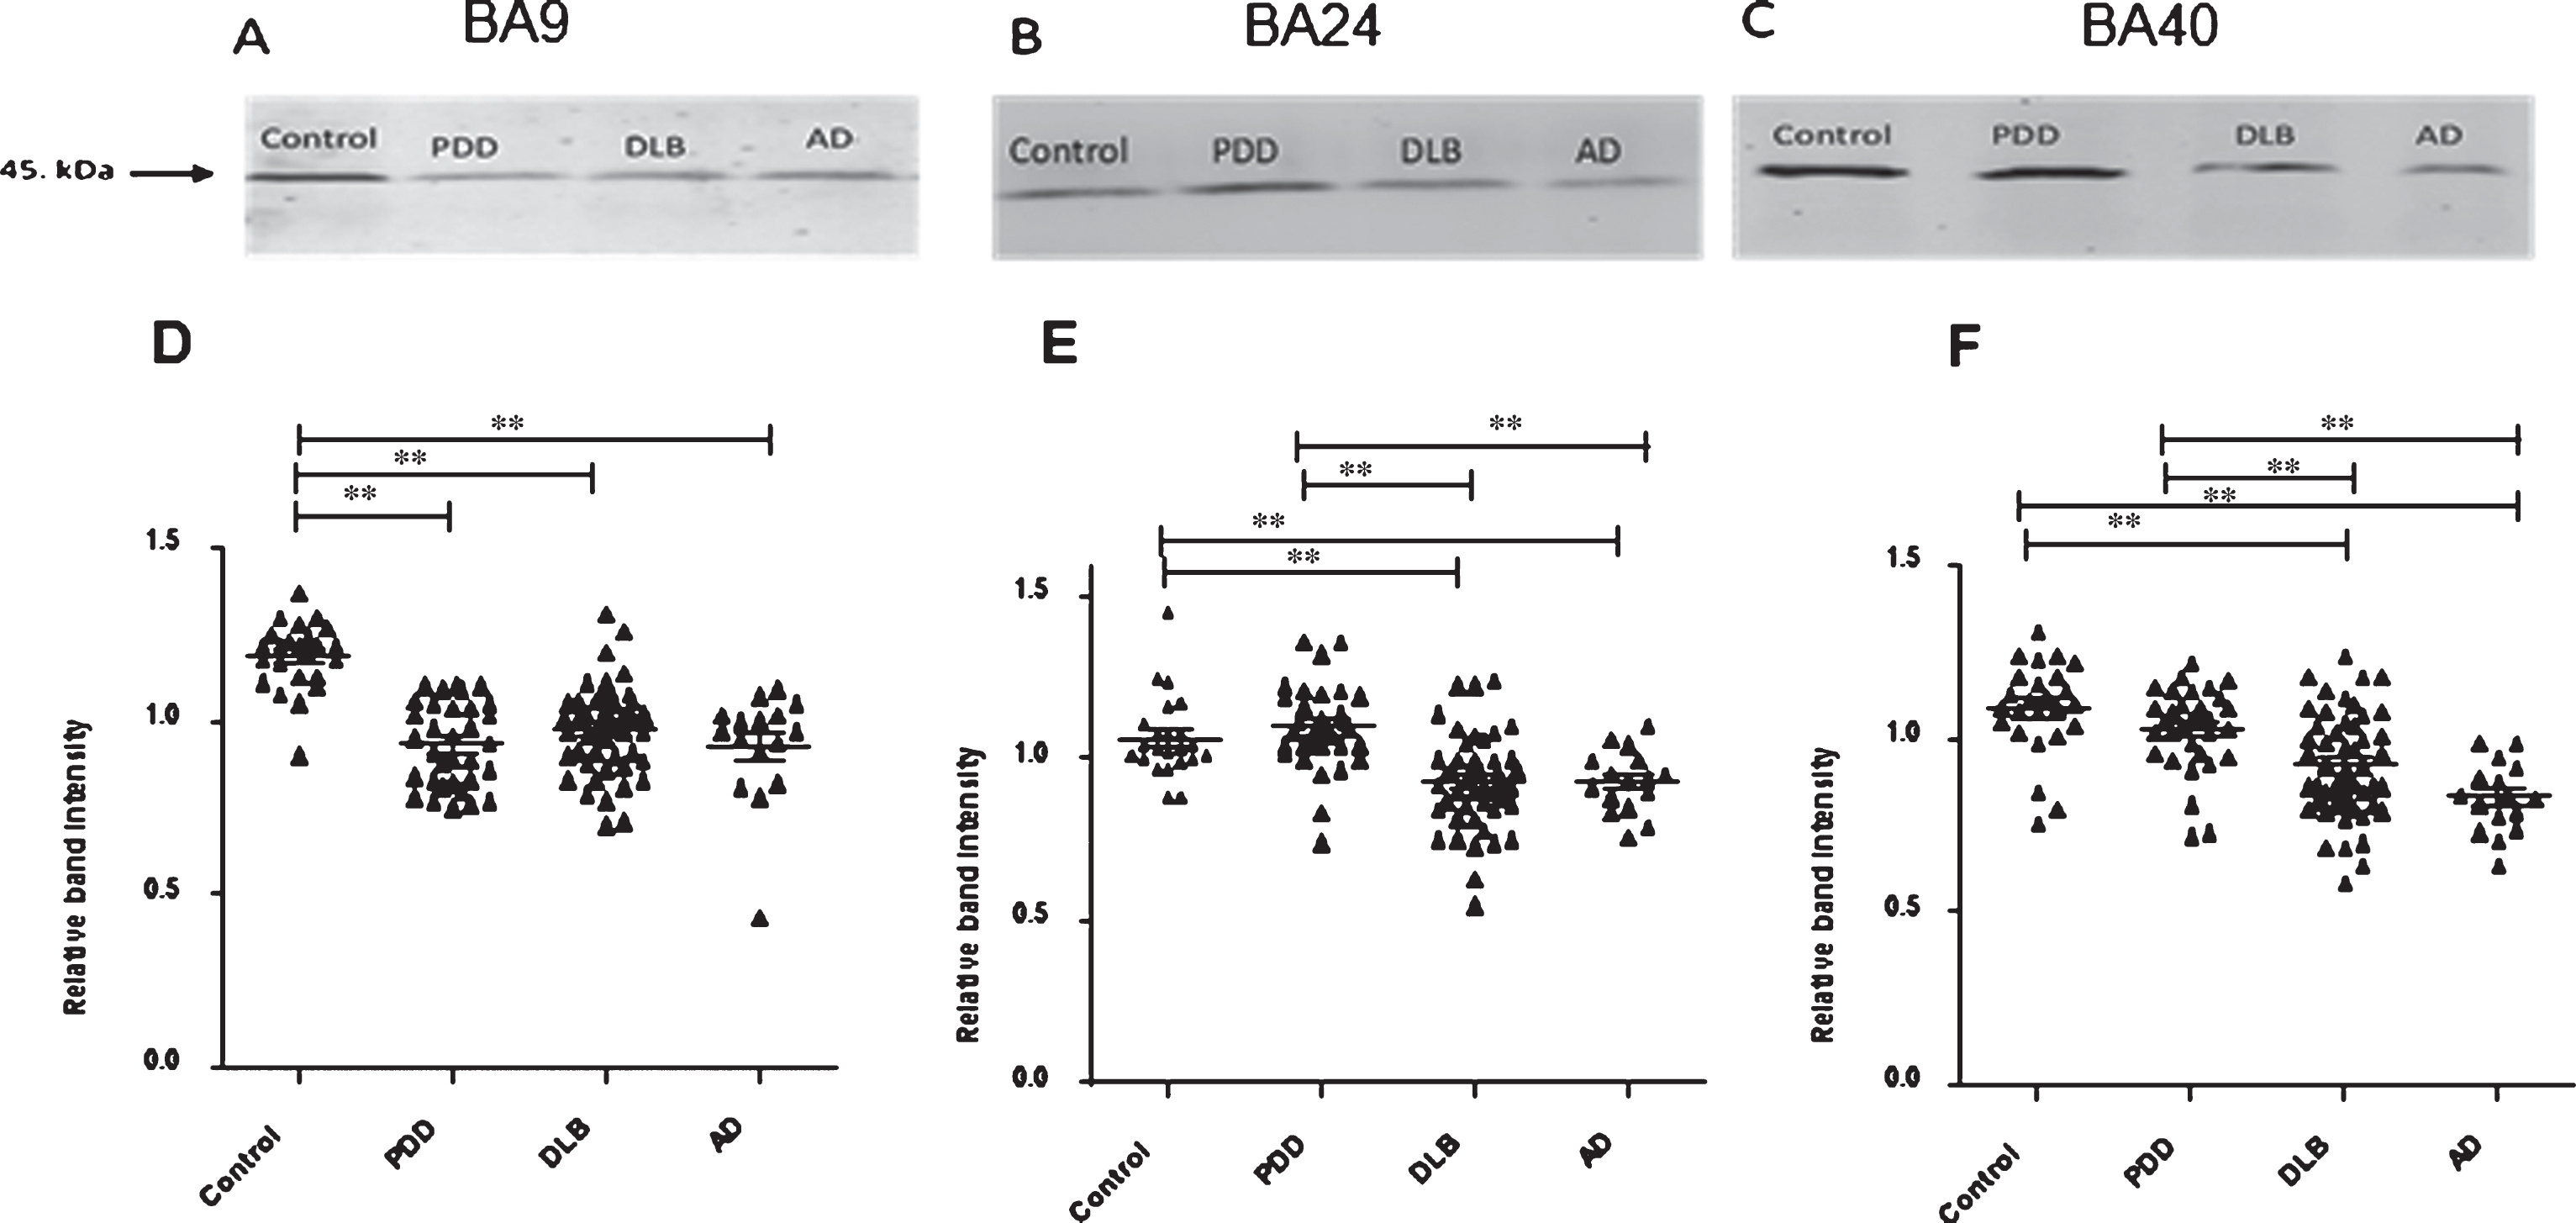
Fig.2
Analysis of PGPH-like activities in brain homogenates from BA9, BA40, and BA24 of DLB, PDD, AD, and controls. Scatter plots are shown of PGPH-like activity measurement in BA9, BA40, and BA24 homogenates from DLB, PDD, AD, and normal control samples using the fluorogenic substrate assay. Activities are expressed as fluorescence units (FU)/mg protein/hour. BA9: PGPH-like activity was significantly decreased only in AD patients (p = 0.012, n = 6) compared with the control (n = 9); DLB and PDD groups were lower compared with the control subjects, but there was no statistically significant difference between them. The values for the ANOVA for PGPH-like activity measurement in BA9 were: F = 7.897, d.f. = 3, 34, p = 0.001). BA40; the differences between the patients’ groups (PDD, DLB, and AD) and the control were statistically different (one-way ANOVA, F = 10.263, d.f. = 3 and 42, p = 0.001;). The reduction in PGPH-like activity was higher in the AD group with a mean±SEM value of 3741.8±587.5, n = 11, compared with 1.28±0.028, n = 24 for the controls. The reduction in both DLB and PDD were also significant with a mean±SEM value of 4133.7±640, n = 10 and 4809±240, n = 9 compared with control (Bonferroni post hoc test). In BA24, there was a significant difference between DLB (p = 0.013, n = 12), PDD (P = 0.001, n = 9) and AD (P = 0.001, n = 9) compared with the control (n = 13) (one-way ANOVA, F = 23.087, d.f. = 3 and 39, p = 0.001; Bonferroni post hoc test). PGPH-like activity measurements were significant lower in both AD (p = 0.004, n = 9) and PDD (p = 0.002, n = 9) compared with DLB subjects. The horizontal bars within the data points in the graphs represent the mean values. (**p < 0.01).
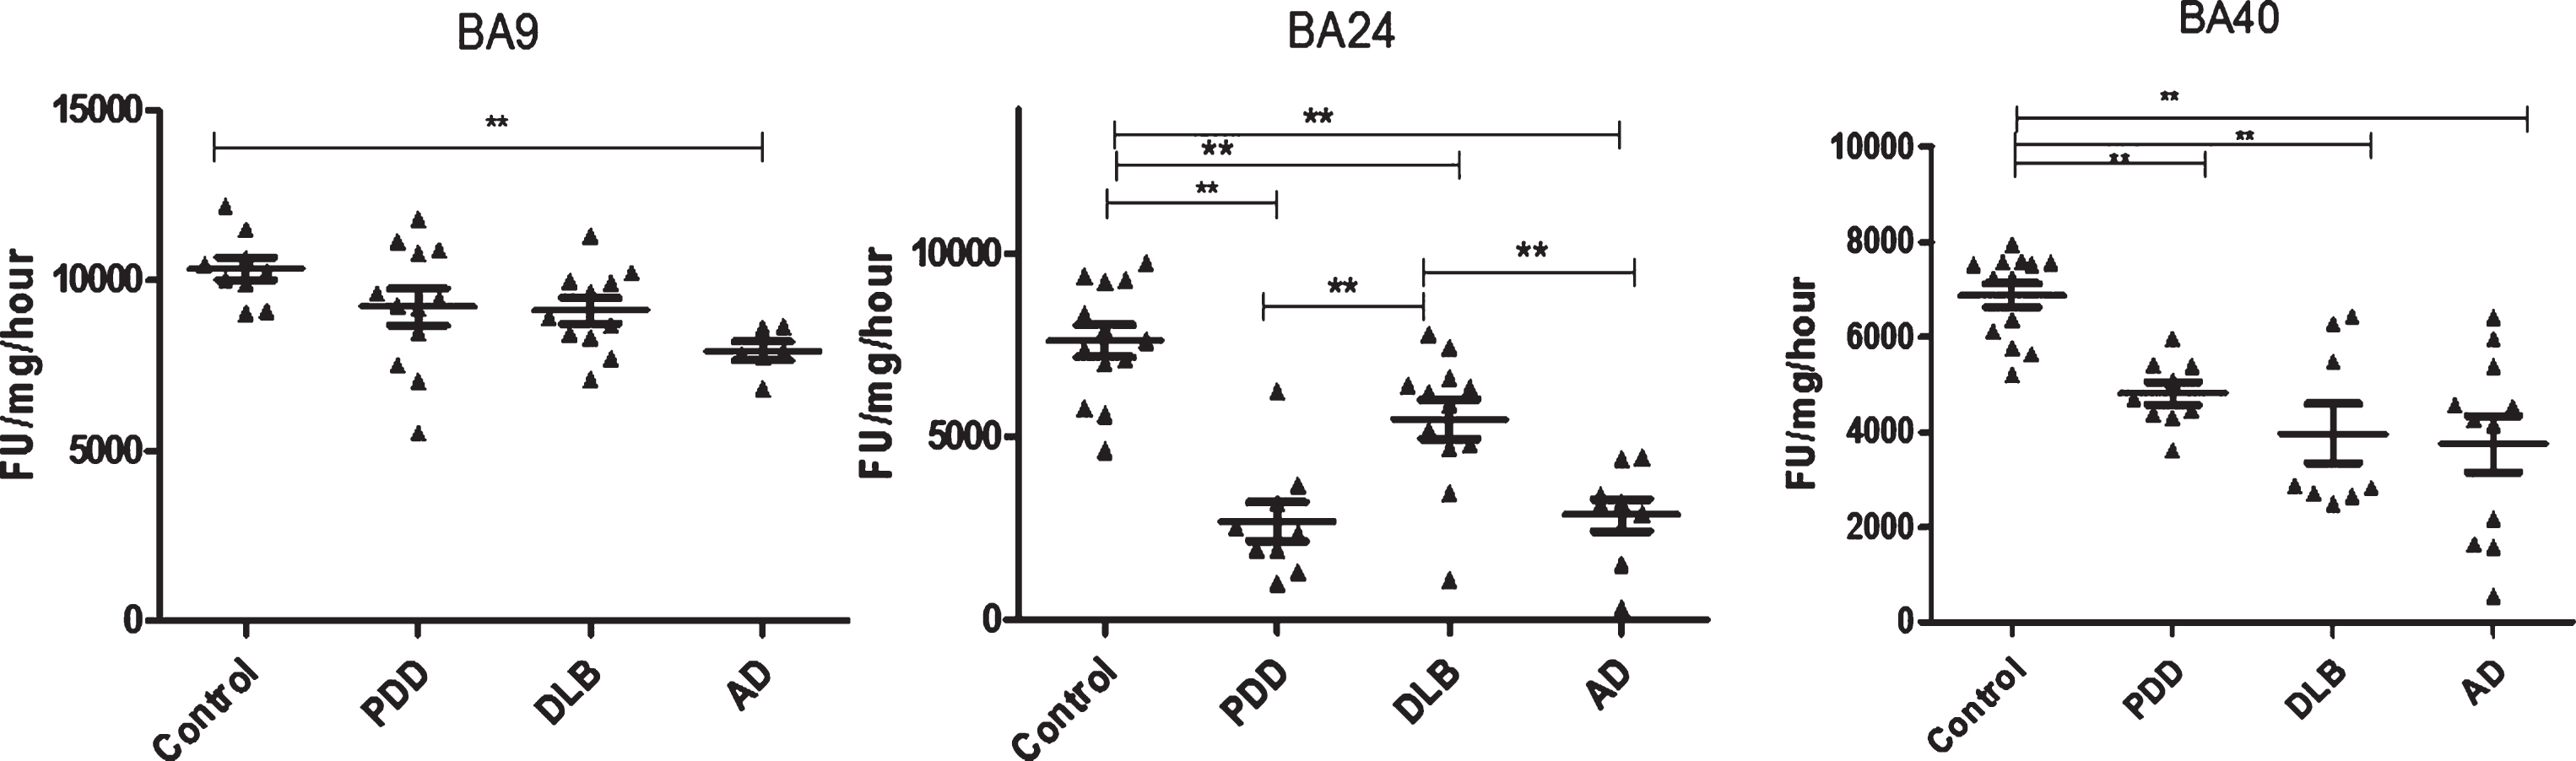
Fig.3
Analysis of chymotrypsin-like activities in brain homogenates from BA9, BA40, and BA24 of DLB, PDD, AD, and controls. Scatter plots are shown of chymotrypsin-like activity measurement in BA9, BA40, and BA24 homogenates from DLB, PDD, AD, and normal control samples using the fluorogenic substrate assay. Activities are expressed as fluorescence units (FU)/mg protein/hour. BA9; the activities’ values for the control group were significantly higher than the PDD (p = 0.004, n = 12), DLB (p = 0.013, n = 11) and AD (p = 0.001, n = 6) groups. The ANOVA values for chymotrypsin-like activity measurement in BA9 are: F = 7.897, d.f. = 3 and 34, p = 0.001) BA40; the activities’ values for the control group (n = 13) were significantly higher than the PDD (p = 0.001, n = 10), DLB (p = 0.001, n = 9), and AD (p = 0.001, n = 12) groups. The ANOVA for chymotrypsin-like activity measurement in BA40 (one-way ANOVA, F = 30.033, d.f. = 3 and 40, p = 0.001; Bonferroni post hoc test) BA24; there was a significant difference between the PDD (p = 0.015, n = 9) and AD (p = 0.044, n = 9) groups compared with the control (n = 13) (one-way ANOVA, F = 4.664, d.f. = 3 and 39, p = 0.007; Bonferroni post hoc test). (**p < 0.01).
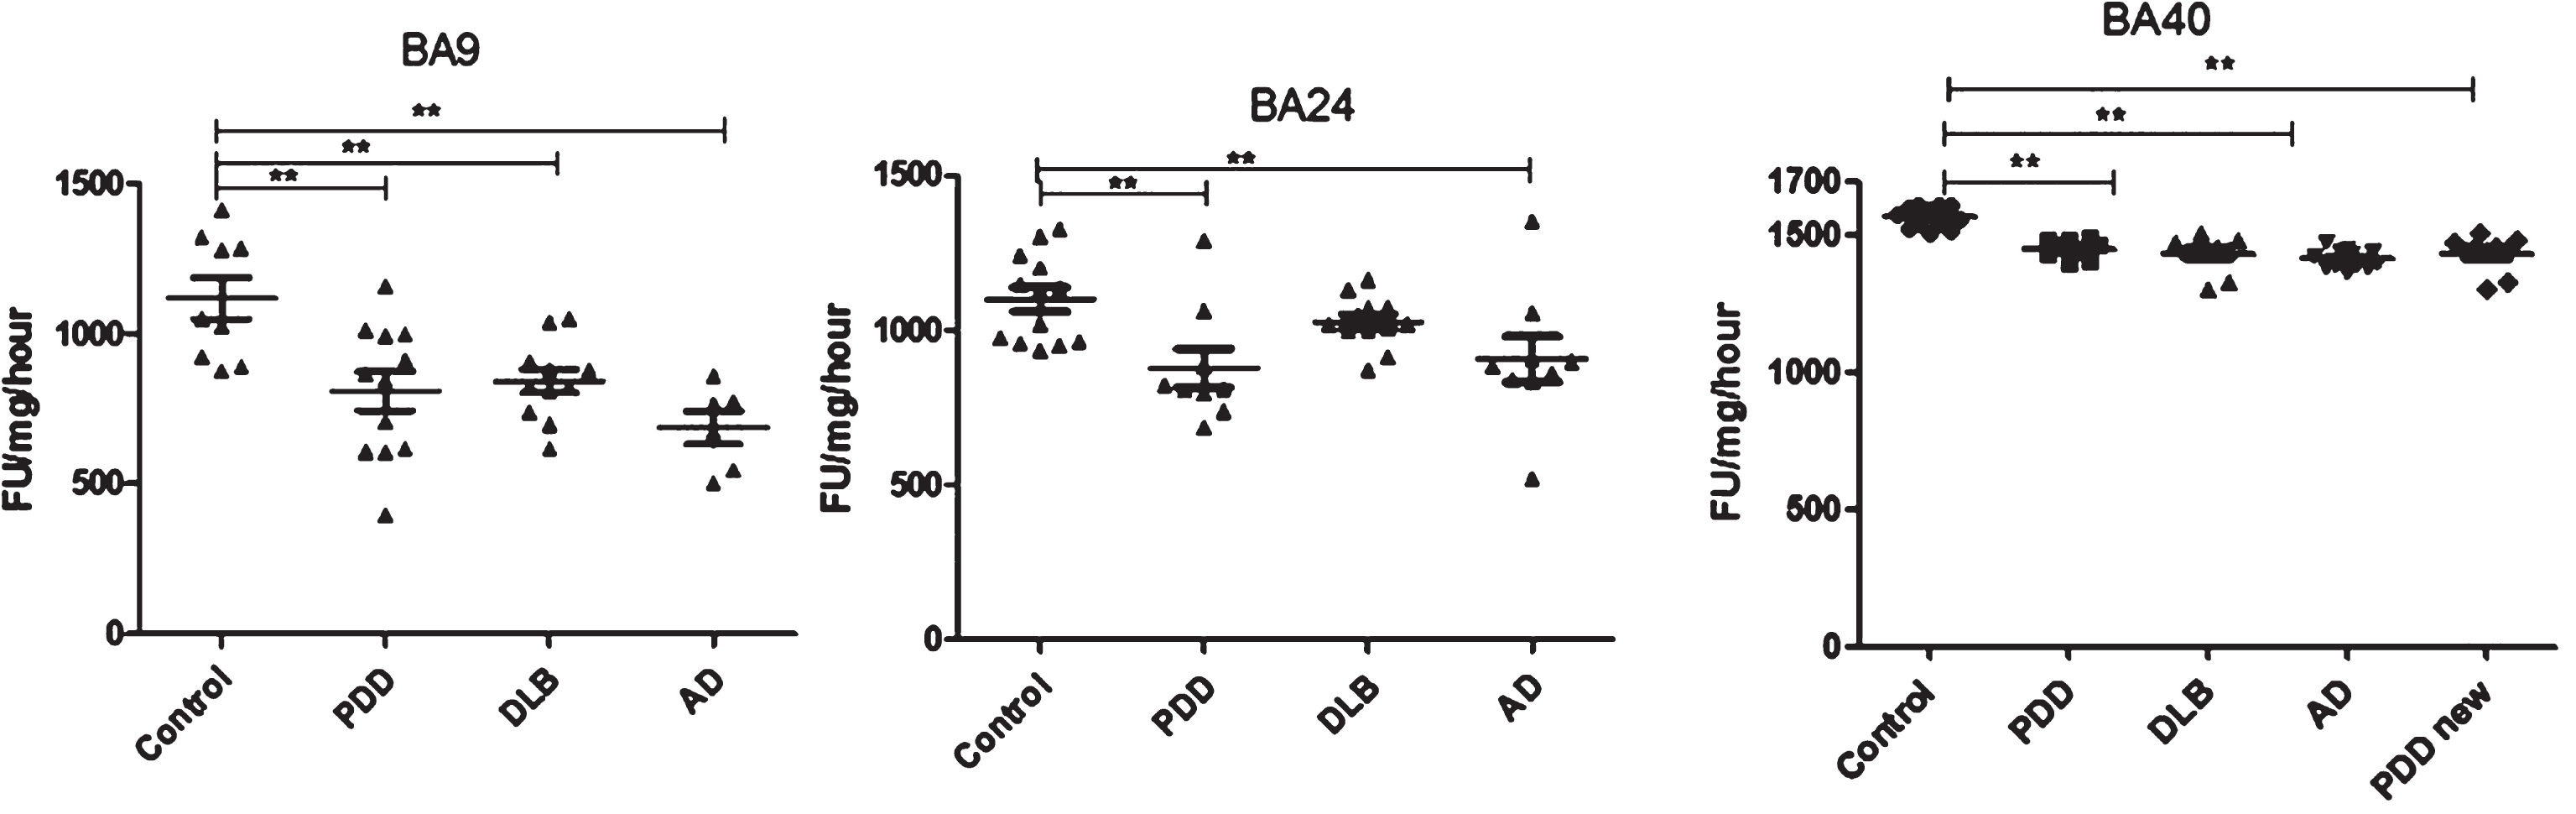
Fig.4
Relationship between RPT6 expression levels and cognitive impairment based upon MMSE classification. 19S ATPase RPT6, proteasome sub-unit values protein levels in BA9, BA24, and BA40 predicted cognitive impairment. Regression analysis showed RPT6 levels in BA9, BA24, and BA40 of control, DLB, PDD, and AD to be significant predictors of the cognitive impairment category ([BA9] R2 = 0.297, beta = –0.545, degree of freedom [df] = 1, 102, t = –6.571, p = 0.001, [BA24] R2 = 0.04, beta = –0.206, df = 1, 99, t = –2.09, p = 0.039, [BA40] R2 = 0.180, beta = –0.425, df = 1, 105, t = –4.807, p = 0.001]. The analysis of variance (ANOVA) for the model was significant (p = 0.0001). The difference in mean RPT6 levels between cognitive impairment groups was analyzed by one-way ANOVA and the Bonferroni post hoc test, which revealed RPT6 levels in BA9 to be significantly higher in controls compared with the other groups (one-way ANOVA F = 17.82, d.f. = 4 and 99, p = 0.001; Bonferroni post hoc test). In BA40, RPT6 levels were significantly lower in people with moderate dementia (10%, p = 0.033) and with severe dementia (19%, p = 0.001) compared with controls. The difference in mean RPT6 levels between cognitive impairment groups in BA24 was not found to be significant (one-way ANOVA p > 0.05). (**p < 0.01).
![Relationship between RPT6 expression levels and cognitive impairment based upon MMSE classification. 19S ATPase RPT6, proteasome sub-unit values protein levels in BA9, BA24, and BA40 predicted cognitive impairment. Regression analysis showed RPT6 levels in BA9, BA24, and BA40 of control, DLB, PDD, and AD to be significant predictors of the cognitive impairment category ([BA9] R2 = 0.297, beta = –0.545, degree of freedom [df] = 1, 102, t = –6.571, p = 0.001, [BA24] R2 = 0.04, beta = –0.206, df = 1, 99, t = –2.09, p = 0.039, [BA40] R2 = 0.180, beta = –0.425, df = 1, 105, t = –4.807, p = 0.001]. The analysis of variance (ANOVA) for the model was significant (p = 0.0001). The difference in mean RPT6 levels between cognitive impairment groups was analyzed by one-way ANOVA and the Bonferroni post hoc test, which revealed RPT6 levels in BA9 to be significantly higher in controls compared with the other groups (one-way ANOVA F = 17.82, d.f. = 4 and 99, p = 0.001; Bonferroni post hoc test). In BA40, RPT6 levels were significantly lower in people with moderate dementia (10%, p = 0.033) and with severe dementia (19%, p = 0.001) compared with controls. The difference in mean RPT6 levels between cognitive impairment groups in BA24 was not found to be significant (one-way ANOVA p > 0.05). (**p < 0.01).](https://content.iospress.com:443/media/jad/2017/57-2/jad-57-2-jad160946/jad-57-jad160946-g004.jpg)
Fig.5
The relationship between Chymotrypsin- and PGPH-like proteasome activity measurement levels and cognitive impairment based upon MMSE classification. Chymotrypsin- and PGPH-like proteasome activity measurement levels, using fluorogenic substrate assay, predicted cognitive impairment in BA9, BA24, and BA40. Regression analysis showed Chymotrypsin-like and PGPH proteasome activity to be a significant predictor of cognitive impairment in BA9 (A and D, R2 = 0.337, beta = –0.581, [df] = 1, 29, t = –3.84, p = 0.001, R2 = 0.275, beta = –0.524, [df] = 1, 29, t = –3.315, p = 0.002), in BA24 (B and E, R2 = 0.151, beta = –0.388, [df] = 1, 38, t = –2.599, p = 0.013, R2 = 0.371, beta = –0.609, [df] = 1, 38, t = –4.733, p = 0.001), and in BA40 (C and F, R2 = 0.531, beta = –0.728, [df] = 1, 40, t = –6.72, p = 0.001, R2 = 0.217, beta = –0.466, [df] = 1, 38, t = –3.244, p = 0.002). The difference in mean Chymotrypsin-like and PGPH proteasome activity measurement levels between different cognitive impairment groups was analyzed by one-way ANOVA and the Bonferroni post hoc test, which revealed high chymotrypsin-like activity in the controls compared with moderate (p = 0.014) and severe scores (p = 0.01) (one-way ANOVA F = 5.009, d.f. = 4 and 26, p = 0.004; Bonferroni post hoc test). There was a high PGPH-like activity in unimpaired cognition compared with the moderate groups (one-way ANOVA F = 3.616, d.f. = 4 and 26, p = 0.004; Bonferroni post hoc test). In BA24, there was higher PGPH-like activity in unimpaired cognition group compared with MCI (p = 0.03), mild (p = 0.024), moderate (p = 0.001) and severe scores (p = 0.001) (one-way ANOVA F = 9.839, d.f. = 4 and 35, p = 0.001; Bonferroni post hoc test). In BA40 the level of chymotrypsin-like activity was significantly higher in the controls compared with MCI (p = 0.001), mild (p = 0.001), moderate (p = 0.001) and severe scores (p = 0.001) (one-way ANOVA F = 21.845, d.f. = 4 and 37, p = 0.001; Bonferroni post hoc test). There was a higher level of PGPH-like activity in unimpaired cognition group compared with MCI (p = 0.02), mild (p = 0.001), moderate (p = 0.001) and severe scores (p = 0.034) (one-way ANOVA F = 8.851, d.f. = 4 and 35, p = 0.001; Bonferroni post hoc test). (**p < 0.01).
![The relationship between Chymotrypsin- and PGPH-like proteasome activity measurement levels and cognitive impairment based upon MMSE classification. Chymotrypsin- and PGPH-like proteasome activity measurement levels, using fluorogenic substrate assay, predicted cognitive impairment in BA9, BA24, and BA40. Regression analysis showed Chymotrypsin-like and PGPH proteasome activity to be a significant predictor of cognitive impairment in BA9 (A and D, R2 = 0.337, beta = –0.581, [df] = 1, 29, t = –3.84, p = 0.001, R2 = 0.275, beta = –0.524, [df] = 1, 29, t = –3.315, p = 0.002), in BA24 (B and E, R2 = 0.151, beta = –0.388, [df] = 1, 38, t = –2.599, p = 0.013, R2 = 0.371, beta = –0.609, [df] = 1, 38, t = –4.733, p = 0.001), and in BA40 (C and F, R2 = 0.531, beta = –0.728, [df] = 1, 40, t = –6.72, p = 0.001, R2 = 0.217, beta = –0.466, [df] = 1, 38, t = –3.244, p = 0.002). The difference in mean Chymotrypsin-like and PGPH proteasome activity measurement levels between different cognitive impairment groups was analyzed by one-way ANOVA and the Bonferroni post hoc test, which revealed high chymotrypsin-like activity in the controls compared with moderate (p = 0.014) and severe scores (p = 0.01) (one-way ANOVA F = 5.009, d.f. = 4 and 26, p = 0.004; Bonferroni post hoc test). There was a high PGPH-like activity in unimpaired cognition compared with the moderate groups (one-way ANOVA F = 3.616, d.f. = 4 and 26, p = 0.004; Bonferroni post hoc test). In BA24, there was higher PGPH-like activity in unimpaired cognition group compared with MCI (p = 0.03), mild (p = 0.024), moderate (p = 0.001) and severe scores (p = 0.001) (one-way ANOVA F = 9.839, d.f. = 4 and 35, p = 0.001; Bonferroni post hoc test). In BA40 the level of chymotrypsin-like activity was significantly higher in the controls compared with MCI (p = 0.001), mild (p = 0.001), moderate (p = 0.001) and severe scores (p = 0.001) (one-way ANOVA F = 21.845, d.f. = 4 and 37, p = 0.001; Bonferroni post hoc test). There was a higher level of PGPH-like activity in unimpaired cognition group compared with MCI (p = 0.02), mild (p = 0.001), moderate (p = 0.001) and severe scores (p = 0.034) (one-way ANOVA F = 8.851, d.f. = 4 and 35, p = 0.001; Bonferroni post hoc test). (**p < 0.01).](https://content.iospress.com:443/media/jad/2017/57-2/jad-57-2-jad160946/jad-57-jad160946-g005.jpg)
Table 1
Patient demographic data
| Diagnosis | Gender (M/F) % | Age at death (mean) | PMD (mean hours) | pH (mean) | MMSE (last assessment) |
| Control (25) | 60/40 | 79.7±7.6 | 39.1±22.9 | 6.47±0.28 | n/a |
| PDD (34) | 53/47 | 79.9±6.0 | 33.5±15.6 | 6.44±0.34 | 13 (0–27) |
| DLB (55) | 58/42 | 81.7±6.5 | 41.3±28.0 | 6.37±0.41 | 13 (0–30) |
| AD (16) | 31/69 | 88.0±7.8 | 34.9±23.9 | 6.30±0.33 | 10.5 (0–19) |
Data are means±SD age in years; PMD, postmortem delay; DLB, dementia with Lewy bodies; PDD, Parkinson’s disease dementia; AD, Alzheimer’s disease. PMD and pH were not significantly different between the groups in the one-way analysis of variance (ANOVA) (p < 0.05).
Table 2
Demographic data for cognitive impairment categories
| MMSE Category | Diagnosis | Gender | Age at death |
| Control (1) | Control n = 25, PDD n = 1 | M = 61.5% | 79.2±1.6 |
| MCI (2) | DLB n = 5, PDD n = 4 | M = 55.6% | 80.3±1.7 |
| Mild (3) | DLB n = 7, PDD n = 5, AD n = 3 | M = 73.3% | 79.9±1.8 |
| Moderate (4) | DLB n = 14, PDD n = 11, AD n = 4 | M = 55.2% | 81.8±1.5 |
| Severe (5) | DLB n = 10, PDD n = 12, AD n = 8 | M = 50% | 81.6±1.1 |
Age at death is mean±SEM.

