
Tau Pathology Promotes the Reorganization of the Extracellular Matrix and Inhibits the Formation of Perineuronal Nets by Regulating the Expression and the Distribution of Hyaluronic Acid Synthases
Abstract
Hyaluronic acid (HA) is the backbone of the extracellular matrix (ECM) and provides biochemical and physical support to aggrecan-based perineuronal nets (PNNs), which are associated with the selective vulnerability of neurons in Alzheimer’s disease (AD). Here, we showed that HA synthases (HASs), including Has1, Has2, and Has3, were widely expressed in murine central nervous system. All types of HASs were localized to cell bodies of neurons; only Has1 existed in the membranes of neural axons. By using TauP301S transgenic (Tg) mouse model, we found that the axonal-localization of Has1 was abolished in TauP301S overexpressed mouse brain, and the redistribution of Has1 was also observed in human AD brains, suggesting that the localization of Has1 is dependent on intact microtubules which are regulated partially by the phosphorylation and dephosphorylation cycles of tau proteins. Furthermore, Has1 was reduced and Has3 was increased in TauP301S Tg mouse brain, resulting in the upregulation of shorter-chain HA in the ECM. These findings suggest that by abolishing the axonal-localization of Has1 and promoting the expression of Has3 and the synthesis of shorter-chain HA, the tau pathology breaks the balance of ECM components, promotes the reorganization of the ECM, and inhibits the formation of PNNs in the hippocampus, and then regulates neuronal plasticity during the progression of AD.
INTRODUCTION
Alzheimer’s disease (AD) is one of the most common neurodegenerative diseases, characterized by progressive mental deterioration associated with the accumulations of amyloid-β (Aβ) plaques and neurofibrillary tangles and synaptic and neuronal loss [1]. More than 35 million people around the world suffer from this disease. Accumulating evidence suggests that deficiency of neuronal connectivity causes the cognitive decline in the early stages of AD, whereas neuronal loss and Aβ deposition become more relevant in the later stages of the disease [2].
The extracellular deposition of Aβ and the neurofibrillary tangles are thought to be the two major pathologic hallmarks of AD. Insoluble Aβ fibrils in the brain trigger AD-related neuropathologic events that lead to progressive neuronal loss and dysfunction [3–5]. Recently, extracellular matrix (ECM) and its major structural phenotypes, aggrecan-based perineuronal nets (PNNs) and brevican-based perisynaptic axonal coats, are assumed to modulate neuronal activity, synaptic plasticity, and Aβ aggregation in AD [6–9]. As one of the most abundant components of the PNNs [10], hyaluronic acid (HA) is a nonsulfated glycosaminoglycan (GAGs) that is negatively charged [11, 12], and plays a critical role in inflammation in sterile conditions. Recent work demonstrated sulfated GAGs are associated with amyloidogenesis [13–16]. In contrast to sulfated GAGs [17–19], no Aβ fibrils are observed in the presence of HA [20, 21]. Therefore, the distribution and expression of HA would be an essential regulator of AD progression.
The molecular weight (MW) of the HA polymer ranges from 5 to 10,000 kDa, which is determined by the number of HA disaccharide repetitions. High MW HA polymers are space-occupying and have regulatory and structural functions in the body; in contrast, the small HA polymers play angiogenic [22–24], inflammatory [25–27], and immunostimulatory roles [28] and are thought to be “danger signals” in the body [29]. In mammals, HA is synthesized by three different isoenzymes (i.e., Has1, Has2, and Has3) [30, 31]. Different isoenzymes (HASs) possess different biochemical properties [32]. Has3 is the most active HAS and produces HA polymers with shorter chains (∼2×10⁵ Da) [33], whereas Has1 and Has2 synthesize HA polymers with high MW chains (∼2×10⁶ Da) [33].
Tau pathology is another risk factor of AD. As a microtubule-binding protein, tau hyperphosphorylation disrupts the stability of the microtubule-based cytoskeleton, and leads to the loss of neurons and synapses in AD and frontotemporal dementia [34–37]. Accumulating evidences indicate that tau pathology, including hyperphosphorylation [38–43], acetylation [44–46], and overexpression [47–49], are closely associated with the cognitive deficits in patients with AD. Although the changes of ECM and PNNs are reported in the initial stages of AD, the relationship between the changes of ECM components and the hyperphosphorylation of tau is still unclear. Therefore, in this study, we analyzed HASs expression in TauP301S transgenic and control mice. Our results demonstrate that the HASs are strongly expressed in the murine hippocampus and cerebral cortex. Although Has1 is not the most abundant HAS in the brain, it predominantly exists in the membrane of neuronal axon and may function in the maintenance of PNNs. Our results also revealed that, by regulating HASs expression and Has1 axonal localization, the overexpression of TauP301S may break the balance of ECM components and the structure of the PNNs, and subsequently promote AD progression by regulating neuronal plasticity.
MATERIALS AND METHODS
Reagents
See the Supplementary Material for the primary antibodies information. Alexa Fluor 488- and Alexa Fluor 594-conjugated secondary antibodies were purchased from Jackson Immuno Research Laboratories Inc., West Grove, PA, USA. HRP-labeled secondary antibodies were obtained from GE Healthcare Life Science, Beijing, China. All reagents for the quantitative RT-PCR were purchased from Promega.
Transgenic mice
The male wild-type (WT) mice or TauP301S transgenic (Tg) mice (Stock number: 008169, expressing P301S mutant human microtubule-binding protein tau on a C3HC57BL/6 hybrid genetic background) were purchased from the Jackson Laboratory. All animal experimental procedures were approved by the Laboratory of Animal Ethical Committee of China Medical University. Ten-month-old mice and 3-week-old mice were used in the study. Mouse brains in different groups were collected with the animals under anesthesia, as previously described [50]. The brains were rapidly removed and kept on an ice cooled board. The hippocampus and cerebral cortex were dissected and stored at –80°C for western blot and quantitative real-time PCR analysis.
Quantitative real-time PCR (qPCR)
Total RNAs of 10-mo-old TauP301S (Tg mice and control WT mouse brains (n = 7) were extracted using E.Z.N.A.® Total RNA Kits (OMEGA) and reverse transcribed with the GoScript™ Reverse Transcription System (Promega). Quantitative real-time PCR was performed in technical duplicates using GoTaq® qPCR Master Mix (Promega) on the MiniOpticon Real-Time PCR detection system (Bio-Rad). The relative mRNA concentrations were determined using the 2-ΔΔCt method. The GenBank accessionnumbers and primers were listed in Table 1. At least three biological replicates were used in all qPCR assays.
Western blot analysis
The mouse brain tissues of 10-month-old (n = 7) and 3-week-old (n = 3) TauP301S Tg mice and control WT mice were lysed with RIPA lysis buffer [50 mM Tris-HCl (pH = 7.5), 150 mM NaCl, 1% NP-40, 1% sodium deoxycholate, 0.1% SDS, 5 mM EDTA, 25 mM NaF, and 2 mM Na3VO4] containing 1:100 diluted protease inhibitor cocktail (Sigma). The protein concentrations of the tissue lysates were determined with a bicinchoninic acid (BCA) protein assay reagent (Thermo Scientific-Pierce). Approximately 40μg of tissue protein was loaded into SDS-PAGE, transferred to a PVDF membrane, and probed with a panel of specific antibodies. Each experiment was repeated three times.
Immunohistochemistry
Ten-month-old TauP301S Tg mice and control WT mice (n = 3) were anesthetized and perfused intracardially with 4% paraformaldehyde (PFA). Mouse brains were collected and immobilized with 4% paraformaldehyde at 4°C for 24 h. After dehydrated with 30% sucrose for 48 h, serial sections (10μm thick) were cut using a Leica CM1850 cryostat (Leica Microsystems, Wetzlar, Germany). Frozen sections were then heated in citrate sodium buffer (pH = 6.0) 3 times for 5 min each. After being submerged in 3% hydrogen peroxide to eliminate endogenous peroxidase activity, the sections were subjected to a routine avidin-biotinylated complex (ABC) immunohistochemical staining. Frozen sections were then treated with 5% goat serum/PBS for 30 min and subsequently incubated with Has1 (1:100, Sigma, SAB1302705), Has2 (1:100, Boster Biotechnology, BA3397-1), and Has3 (1:100; Santa Cruz, sc-66917)antibodies overnight at 4°C. After rinsing, the sections were incubated with biotinylated goat anti-rabbit IgG (1:200) for 1 h followed by streptavidin peroxidase incubation for 1 h at room temperature. After rinsing with PBS three times, the sections were stained with 0.025% DAB for 3 to 5 min. The stained sections were then dehydrated, cleared, and mounted with neutral balsam. All images were taken using a light microscope equipped with a digital camera (Nikon, Japan with×20 and×4 objectives). For all IHC staining, IgG from rabbit serum (Sigma, I5006) was used as negative control.
Immunofluorescence staining
Frozen sections were heated in citrate sodium buffer (pH = 6.0) 3 times for 5 min each, and then treated with 5% goat serum/PBS for 30 min and subsequently incubated with primary antibodies overnight at 4°C and with secondary antibodies (Supplementary Table 1) for 1.5 h. A negative control using an appropriate IgG antibody was performed in each experiment. Slices were mounted with Antifade Reagent (Beyotime Biotechnology). Images were taken using the Leica TCS SP8 laser scanning confocal microscope with 60×or 40×objectives.
Human brain samples
Human brain samples were obtained from the New York Brain Bank (Columbia University, New York, NY, USA), serial numbers P535-00 (normal), T4263 (a 73-year-old man with mild AD), and T4339 (an 88-year-old woman with severe AD).
Statistical analysis
All data are represented as means±standard error (S.E.). The statistical significance of the differences between the means was determined appropriately with One-way ANOVA, unpaired t-tests or unpaired t-tests with Welch’s correction.
RESULTS
Has2 and Has3 are the predominant HASs expressed in the murine CNS
HA is synthesized by three different isoenzymes (i.e., Has1, Has2, and Has3). Has1 and Has2 synthesize high MW HAs, whereas Has3 produces low MW HA. Therefore, we first detected the mRNA expression of HASs in the central nervous system (CNS) of WT mice. The data (Table 2) demonstrated that Has2 and Has3 enriched in the cerebral cortex, hippocampus, cerebellum, and spinal cord, whereas Has1 gene expression occurred at a very low level in the CNS. These results indicated that high MW HA was mainly synthesized by Has2 in murine CNS and low MW HA was synthesized by Has3.
Immunohistochemical and immunofluorescence staining demonstrates the distributions of Has1, Has2, and Has3 in WT mice
To further confirm the distributions of HASs in the WT mice, we performed immunohistochemical and immunofluorescence staining of the brains of WT mice. We found that HASs were widely expressed in the cerebral cortex and the hippocampus (Fig. 1). In the hippocampus, Has1 was not only localized to the membranes of the cell bodies but also localized to the membranes of the neural axons in the pyramidal cell layer (Fig. 1Aa). Interestingly, we did not observe any localization of Has2 (Fig. 1Bb) and Has3 (Fig. 1Cc) in the neural axon of the hippocampus. In the cerebral cortex, Has1 was also predominantly expressed in the cell membranes of the neural cells (Fig. 1Aa’). By co-staining with neuronal marker, the data clearly showed that Has1 was the only HAS that located in the neural axon (Fig. 1D), whereas, Has2 (Fig. 1Bb’,D) and Has3 were primarily localized to the cytoplasm of cells (Fig. 1Cc’,D). In addition to the distribution in the neuronal cells, Has3 was also distributed in the endothelial cells of thecerebrovascular.
TauP301S overexpression promotes the production of low MW HA via regulating the ratio of Has1 and Has3 in hippocampus
To uncover the relationship between HASs expression and tau pathology, we used 10-month-old TauP301S Tg mice to detect the expression of HASs. Firstly, we determined the expression of tau in control and TauP301S Tg mice by western blot (Fig. 2A-D) and immunofluorescence staining (Fig. 2E). The data revealed that the protein level of tau was seven-fold higher than the control mice (Fig. 2A, B) in the cerebral cortex, and twenty-eight-fold higher than the control mice in the hippocampus (Fig. 2C, D). As showed in Fig. 2E, the expression of tau was significantly higher in CA3 of TauP301S Tg mice than that in control WT mice. Then, we performed quantitative real-time PCR (qPCR) on TauP301S Tg mice and control mice (7 mice each group). As illustrated in Fig. 3A, the mRNA expression of Has1 and Has3 were not substantially altered in the hippocampus of the TauP301S Tg mice compared with the WT mice (Has1: p = 0.0899; unpaired t-tests with Welch’s correction; Has3: p = 0.1593; unpaired t-tests), whereas, Has2 was upregulated (p < 0.05; unpaired t-tests). The western blot data (Fig. 3B-D) revealed that Has1 was significantly downregulated compared with the WT mice (p < 0.001; unpaired t-tests), and Has3 was upregulated in the TauP301S Tg mice (p < 0.05; unpaired t-tests with Welch’s correction). Unexpectedly, the western blot data revealed that the protein level of Has2 (Fig. 3C) did not change in the hippocampus of the TauP301S Tg mice compared with the WT mice (p > 0.05; unpaired t-tests). To confirm the upregulation of Has3 did affect the ratio of low/high MW of HA, we performed western blot to observe the MW of HA. As showed in Fig. 3E, the short chain of HA (< 200 kDa) was increased in TauP301S Tg mice as compared to the WT mice (p < 0.05). To make sure that the variation of HASs expression in TauP301S Tg mice is associated with tau pathology, the expression of Has1 and Has3 were detected in 3-week-old control and TauP301S Tg mice (without tau pathology). In line with our expectations, there were no significant differences between 3-week-old control and TauP301S Tg mice (Supplementary Figure 1) on the expression of Has1 and Has3, suggesting that the variations of HASs expression are not the early changes that induced by tau pathology.
TauP301S overexpression induces the redistribution of Has1 in hippocampus
It is reported that plasma membrane residence of HASs is associated with its enzymatic activity [51], therefore we performed immunohistochemical staining and immunofluorescence staining to show whether tau pathology is coupled to the distribution of HASs. The results showed that the expression of Has1 was reduced in TauP301S Tg mice and the axonal localization of Has1 was significantly inhibited by tau overexpression in hippocampus (Fig. 4A, B). In the Z-section pictures of Fig. 4B, we could see that, in most cases, axonal NEFH was adjacent (Fig. 4B, the Z section of upper panel and the enlarged consequent Z section picture of box 1) or co-localized (the enlarged consequent Z section picture of box 2) with Has1 in WT mice, but in TauP301S Tg mice, Has1 was only located in the cell body of neurons. These results were further confirmed in 3-week-old tau Tg mice (Fig. 5), indicating that the redistribution of Has1 in neuron occurred in the early stages of tau pathology. As for Has2 and Has3, no other significant difference was observed between control and TauP301S Tg mice except for the reducing of Has2 expression in neurons in stratum oriens of the hippocampus (Fig. 4C).
The axonal-localization of Has1 in the cerebral cortex depended on complete microtubules
We also detected the mRNA and protein expressions of the HASs in the cerebral cortex of the TauP301S Tg mice and control mice (7 mice for each group). The qPCR data in Fig. 6 demonstrated that, HASs mRNA expressions were not altered in the TauP301S Tg mice (Has1: p = 0.0698, Has2: p = 0.3119, Has3: p = 0.6737; unpaired t-tests). Consistent with the qPCR data, similar results were observed in the western blot assay. The overexpression of TauP301S has no effect on HASs production in the cerebral cortex of the mouse model (Fig. 7A-C, Has1: p = 0.9951; unpaired t-tests with Welch’s correction, Has2: p = 0.0538; unpaired t-tests, Has3: p = 0.6504; unpaired t-tests with Welch’s correction), but low MW HA was induced in 10-month-old TauP310S Tg mice (Supplementary Figure 2B, C), suggesting that the regulation of HASs expression is not the only way to regulate the synthesis of low-MW HA. Thus, we detected the distribution of HASs by immunohistochemical and immunofluorescence staining. The results showed that tau pathology promoted the cell body and inhibited the axonal localization of Has1 (Fig. 7D, E), but have no significant effect on the distribution of Has2 and Has3 in the cerebral cortex (Supplementary Figure 2A). To actually demonstrated the relationship between tau pathology and HASs expression, the expression of Has3 in younger (3-week-old) TauP310S Tg mice were detected (Supplementary Figure 1C). No significant changes of Has3 was observed in 3-week-old TauP310S Tg mice, therefore we speculated that the redistribution of HASs, especially Has1, might be the most obvious change occurring in the early stages of tau pathology. Consistent with our expectation, an increasing expression of Has1 (125%) was observed in the cell body region of the cerebral cortex in 3-week-old TauP310S Tg mice (Figure 7G). By co-staining of Has1 and NeuN in AD brain samples, we found that in normal human brain, Has1 distributed as a uniform mesh, and only small amount of Has1 localized in the cell body of neurons, whereas in AD brains, Has1 redistributed, and formed aggregates in neurons (Fig. 8), suggesting that the redistribution of Has1 might be a universal change in neurodegenerative diseases, and the ratio of cell body and axonal localization of Has1 is dependent on the intact microtubules that supported by the phosphorylation and dephosphorylation cycles of tau proteins.
DISCUSSION
In the present study, TauP301S Tg mice, expressing insoluble mutant of human microtubule-associated protein tau in the brain, were used to determine the relationship between tau pathology and HASs expression. We demonstrate that HASs are widely expressed in the cortex and hippocampus of mice, and Has2 and Has3 are the predominant HASs that are expressed in the murine CNS. Either in the hippocampus or in the cerebral cortex, three types of HASs were all expressed in the cell body of neurons, whereas only Has1 was expressed in neuronal axons. These results indicated that although Has1 is not the most abundant HAS in the CNS, it may play an important role in the maintenance of the synaptic plasticity.
It has been established for a long time that the brainglucose metabolism disorder contributes to the pathogenesis of AD [52, 53]. The expression and the activation of Has1 are correlated with the concentration of UDP-N-acetylglucosamine (UDP-GlcNAC) which is produced by hexosamine biosynthesis pathway (HBP), but interestingly, the Has2 is less affected by the concentration of UDP-GlcNAC, and Has3 is not affected at all [54]. Gong et al. reported an inverse relationship between O-GlcNAcylation and phosphorylation of tau [55]. All of these studies show an indirect relationship between HASs and tau pathology, therefore we postulated that the hyperphosphorylation of tau can be directly associated with the expression of HASs and then regulated the ratio of high/low MW HA. Our results showed that TauP301S inhibited the expression and the axonal-localization of Has1 and promoted the expression of Has3 and low MW HA in the brain. HASs are integral membrane proteins, but they do not have a signal peptide at their N terminus, and do not include any post-translational modifications that often take place in the Golgi complex, so the trafficking of HASs from endoplasmic reticulum to plasma membrane is still a controversial topic. As show in Fig. 1D and Fig. 4, the distribution patterns of Has2 and Has3 are different from the distribution patterns of Has1. In neurons, Has2 and Has3 mainly located at the dot like structures, which probably are vesicles shedding form Golgi, whereas Has1 dispersed in the cytoplasm, indicating that different from Has2 and Has3, the membrane-localization of Has1 is not depending on the vesicular trafficking.
Accumulating evidence demonstrates that HA-based ECM is functionally important for the maturation and plasticity of synapses in the CNS. Dityatev and Fellin [56] found that the lack of components of the ECM impairs synaptic plasticity in the adult mouse brain. For example, it has been demonstrated that a deficiency of the glycoprotein tenascin-R, which is one of a major extracellular matrix glycoproteins of the CNS, impairs long-term potentiation (LTP) but has no effect on normal long-term depression [57]. Evidence indicates that the absences of the chondroitin sulfate proteoglycans, brevican [58] or neurocan [59], in mice also result in significant deficits in the maintenance of hippocampal LTP. Interestingly, a recent study suggested that similar to the other structural elements of PNNs, HA also has a direct influence on synaptic plasticity [60]. These authors demonstrated that HA directly binds and modulates L-type voltage-dependent Ca2+ channels (L-VDCC; Cav1.2). After the degradation of HA by hyaluronidase, LTP at the CA3–CA1 Schaffer collateral synapses in the hippocampus is abolished. Furthermore, all of these deficits caused by the application of hyaluronidase were completely rescued by bath perfusion or local delivery of exogenous HA. Our results are consistent with these reports in that although the changes in Has1 and Has3 mRNAs were not significant, the protein level of Has1 was reduced by 3- to 4-fold in the hippocampus of the TauP301S Tg mice compared with the WT mice. In contrast, Has3 was increased by approximately 2.5-fold. All of the modulations of HASs expression caused by tau pathology will alter the balance between the high and the low MW chains of HA (Fig. 3E and Supplementary Figure 2B) in PNNs and subsequently influence neural plasticity.
PNNs are specialized ECM that envelop mature neurons, restrict the formation of synapses [61], contribute to the neuroprotection in the cerebral cortex, and may also contribute to very long-term memories. Although HA is the most abundant matrix polysaccharide in the PNNs, only a few studies have addressed the neurophysiological roles of HA in adult brain. Yamaguchi and colleagues [62] found that the expression of HA caused by Has3 is associated with the extracellular space volume in the brain. Has3-deficient mice exhibit an increased cell packing in the CA1 stratum pyramidale and exhibit abnormal epileptiform activity in CA1. In contrast, Has1 and Has2 knock-out mice do not exhibit the same phenotype [62]. In the present study, we found that tau pathology is positively related to the expression of Has3 and the production of low MW HA in the hippocampus of the TauP301S transgenic mice, and thus may increase the extracellular space volume in CA1. Unlike the results of the hippocampus, TauP301S expression did not affect mRNA or protein levels of any of the three types of HASs in the cerebral cortex, but immunohistochemical and immunofluorescent images did reveal an intriguing result, that TauP301S expression affected the distributions of Has1 in both cerebral cortex and hippocampus in the very early stages of tau pathology. Consistent with the mice data, Has1 redistribution was also observed in human AD samples. These findings indicate that the axonal localization of Has1 depends on intact microtubules, which are regulated by the phosphorylation and dephosphorylation of tau. Another interesting result was that Has3 is the predominant HAS that expressed in blood vessels. When combined with prior studies of the level of HA in cerebrospinal fluid of AD [63–66], these observations suggest that the increasing Has3 is a possible reason for the increased HA in cerebrospinal fluid of AD patients.
Taken together, our data show that HASs are widely expressed in the brain, by regulating the expression and distribution of HASs, tau pathology is involved in ECM reorganization in the progression of AD.
ACKNOWLEDGMENTS
The authors thank Dr. Jia-Yi Li for kindly providing brain samples from human donors with AD, and thank Dr. Wei Zhang and members in the Zhao lab for discussion and critical reading of the manuscript. This work was supported in part or in whole by National Undergraduate Innovative Test Program (151167), the National Natural Sciences Foundation of China (31301108) and (31401215), the Fundamental Research Funds for Central Public Welfare Research Institutes of China (N130520002, N141008001/7, N130320001).
Authors’ disclosures available online (http://j-alz.com/manuscript-disclosures/16-0804r2).
Appendices
The supplementary material is available in the electronic version of this article: http://dx.doi.org/10.3233/JAD-160804..
REFERENCES
[1] | Gimenez-Xavier P , Francisco R , Platini F , Perez R , Ambrosio S ((2008) ) LC3-I conversion to LC3-II does not necessarily result in complete autophagy. Int J Mol Med 22: , 781–785. |
[2] | Kanaan NM , Pigino GF , Brady ST , Lazarov O , Binder LI , Morfini GA ((2013) ) Axonal degeneration in Alzheimer’s disease: When signaling abnormalities meet the al transport system. Exp Neurol 246: , 44–53. |
[3] | Huang Y , Mucke L ((2012) ) Alzheimer mechanisms and therapeutic strategies. Cell 148: , 1204–1222. |
[4] | Hardy J ((2009) ) The amyloid hypothesis for Alzheimer’s disease: A critical reappraisal. J Neurochem 110: , 1129–1134. |
[5] | Karran E , Mercken M , De Strooper B ((2011) ) The amyloid cascade hypothesis for Alzheimer’s disease: An appraisal for the development of therapeutics. Nat Rev Drug Discov 10: , 698–712. |
[6] | Geissler M , Gottschling C , Aguado A , Rauch U , Wetzel CH , Hatt H , Faissner A ((2013) ) Primary hippocampal neurons, which lack four crucial extracellular matrix molecules, display abnormalities of synaptic structure and function and severe deficits in perineuronal net formation. J Neurosci 33: , 7742–7755. |
[7] | Carulli D , Laabs T , Geller HM , Fawcett JW ((2005) ) Chondroitin sulfate proteoglycans in neural development and regeneration. Curr Opin Neurobiol 15: , 116–120. |
[8] | Lepelletier FX , Mann DM , Robinson AC , Pinteaux E , Boutin H ((2015) ) Early changes in extracellular matrix in Alzheimer’s disease. Neuropathol Appl Neurobiol, https://www.ncbi.nlm.nih.gov/pubmed/26544797 |
[9] | Morawski M , Bruckner G , Jager C , Seeger G , Matthews RT , Arendt T ((2012) ) Involvement of perineuronal and perisynaptic extracellular matrix in Alzheimer’s disease neuropathology. Brain Pathol 22: , 547–561. |
[10] | Morawski M , Bruckner G , Jager C , Seeger G , Arendt T ((2010) ) Neurons associated with aggrecan-based perineuronal nets are protected against tau pathology in subcortical regions in Alzheimer’s disease. Neuroscience 169: , 1347–1363. |
[11] | Stern R , Asari AA , Sugahara KN ((2006) ) Hyaluronan fragments: An information-rich system. Eur J Cell Biol 85: , 699–715. |
[12] | Dosio F , Arpicco S , Stella B , Fattal E ((2016) ) Hyaluronic acid for anticancer drug and nucleic acid delivery. Adv Drug Deliv Rev 97: , 204–236. |
[13] | McLaughlin RW , De Stigter JK , Sikkink LA , Baden EM , Ramirez-Alvarado M ((2006) ) The effects of sodium sulfate, glycosaminoglycans, and Congo red on the structure, stability, and amyloid formation of an immunoglobulin light-chain protein. Protein Sci 15: , 1710–1722. |
[14] | Motamedi-Shad N , Monsellier E , Torrassa S , Relini A , Chiti F ((2009) ) Kinetic analysis of amyloid formation in the presence of heparan sulfate: Faster unfolding and change of pathway. J Biol Chem 284: , 29921–29934. |
[15] | Bravo R , Arimon M , Valle-Delgado JJ , Garcia R , Durany N , Castel S , Cruz M , Ventura S , Fernandez-Busquets X ((2008) ) Sulfated polysaccharides promote the assembly of amyloid beta(1-42) peptide into stable fibrils of reduced cytotoxicity. J Biol Chem 283: , 32471–32483. |
[16] | Kisilevsky R , Ancsin JB , Szarek WA , Petanceska S ((2007) ) Heparan sulfate as a therapeutic target in amyloidogenesis: Prospects and possible complications. Amyloid 14: , 21–32. |
[17] | Sipe JD , Cohen AS ((2000) ) Review: History of the amyloid fibril. J Struct Biol 130: , 88–98. |
[18] | Cohlberg JA , Li J , Uversky VN , Fink AL ((2002) ) Heparin and other glycosaminoglycans stimulate the formation of amyloid fibrils from alpha-synuclein in vitro. Biochemistry 41: , 1502–1511. |
[19] | Bruinsma IB , te Riet L , Gevers T , ten Dam GB , van Kuppevelt TH , David G , Kusters B , de Waal RM , Verbeek MM ((2010) ) Sulfation of heparan sulfate associated with amyloid-beta plaques in patients with Alzheimer’s disease. Acta Neuropathol 119: , 211–220. |
[20] | Ariga T , Miyatake T , Yu RK ((2010) ) Role of proteoglycans and glycosaminoglycans in the pathogenesis of Alzheimer’s disease and related disorders: Amyloidogenesis and therapeutic strategies–a review. J Neurosci Res 88: , 2303–2315. |
[21] | Borysik AJ , Morten IJ , Radford SE , Hewitt EW ((2007) ) Specific glycosaminoglycans promote unseeded amyloid formation from beta2-microglobulin under physiological conditions. Kidney Int 72: , 174–181. |
[22] | Lim DK , Wylie RG , Langer R , Kohane DS ((2016) ) Selective binding of C-6 OH sulfated hyaluronic acid to the angiogenic isoform of VEGF(165). Biomaterials 77: , 130–138. |
[23] | Sawa M , Kuroyanagi Y ((2013) ) Potential of a cryopreserved cultured dermal substitute composed of hyaluronic acid and collagen to release angiogenic cytokine. J Biomater Sci Polym Ed 24: , 224–238. |
[24] | Tempel C , Gilead A , Neeman M ((2000) ) Hyaluronic acid as an anti-angiogenic shield in the preovulatory rat follicle. Biol Reprod 63: , 134–140. |
[25] | Rooney P , Srivastava A , Watson L , Quinlan LR , Pandit A ((2015) ) Hyaluronic acid decreases IL-6 and IL-8 secretion and permeability in an inflammatory model of interstitial cystitis. Acta Biomater 19: , 66–75. |
[26] | Isa IL , Srivastava A , Tiernan D , Owens P , Rooney P , Dockery P , Pandit A ((2015) ) Hyaluronic acid based hydrogels attenuate inflammatory receptors and neurotrophins in interleukin-1beta induced inflammation model of nucleus pulposus cells. Biomacromolecules 16: , 1714–1725. |
[27] | Shao Y , Lu GL , Shen ZJ , He HC ((2013) ) Reduction of intercellular adhesion molecule 1 may play a role in anti-inflammatory effect of hyaluronic acid in a rat model of severe non-bacterial cystitis. World J Urol 31: , 535–540. |
[28] | Ke C , Wang D , Sun Y , Qiao D , Ye H , Zeng X ((2013) ) Immunostimulatory and antiangiogenic activities of low molecular weight hyaluronic acid. Food Chem Toxicol 58: , 401–407. |
[29] | Powell JD , Horton MR ((2005) ) Threat matrix: Low-molecular-weight hyaluronan (HA) as a danger signal. Immunol Res 31: , 207–218. |
[30] | Weigel PH ((2015) ) Hyaluronan synthase: The mechanism of initiation at the reducing end and a pendulum model for polysaccharide translocation to the cell exterior. Int J Cell Biol 2015: , 367579. |
[31] | Tien JY , Spicer AP ((2005) ) Three vertebrate hyaluronan synthases are expressed during mouse development in distinct spatial and temporal patterns. Dev Dyn 233: , 130–141. |
[32] | Itano N , Kimata K ((2002) ) Mammalian hyaluronan synthases. IUBMB Life 54: , 195–199. |
[33] | Itano N , Sawai T , Yoshida M , Lenas P , Yamada Y , Imagawa M , Shinomura T , Hamaguchi M , Yoshida Y , Ohnuki Y , Miyauchi S , Spicer AP , McDonald JA , Kimata K ((1999) ) Three isoforms of mammalian hyaluronan synthases have distinct enzymatic properties. J Biol Chem 274: , 25085–25092. |
[34] | Honson NS , Kuret J ((2008) ) Tau aggregation and toxicity in tauopathic neurodegenerative diseases. J Alzheimers Dis 14: , 417–422. |
[35] | Ballatore C , Lee VM , Trojanowski JQ ((2007) ) Tau-mediated neurodegeneration in Alzheimer’s disease and related disorders. Nat Rev Neurosci 8: , 663–672. |
[36] | Hanger DP , Lau DH , Phillips EC , Bondulich MK , Guo T , Woodward BW , Pooler AM , Noble W ((2014) ) Intracellular and extracellular roles for tau in neurodegenerative disease. J Alzheimers Dis 40: (Suppl 1), S37–S45. |
[37] | Alonso AD , Beharry C , Corbo CP , Cohen LS ((2016) ) Molecular mechanism of prion-like tau-induced neurodegeneration. Alzheimers Dement 12: , 1090–1097. |
[38] | Onishi T , Matsumoto Y , Hattori M , Obayashi Y , Nakamura K , Yano T , Horiguchi T , Iwashita H ((2014) ) Early-onset cognitive deficits and axonal transport dysfunction in P301S mutant tau transgenic mice. Neurosci Res 80: , 76–85. |
[39] | Di J , Cohen LS , Corbo CP , Phillips GR , El Idrissi A , Alonso AD ((2016) ) Abnormal tau induces cognitive impairment through two different mechanisms: Synaptic dysfunction and neuronal loss. Sci Rep 6: , 20833. |
[40] | Sotiropoulos I , Sousa N ((2016) ) Tau as the converging protein between chronic stress and Alzheimer’s disease synaptic pathology. Neurodegener Dis 16: , 22–25. |
[41] | Thal DR , Fandrich M ((2015) ) Protein aggregation in Alzheimer’s disease: Abeta and tau and their potential roles in the pathogenesis of AD. Acta Neuropathol 129: , 163–165. |
[42] | Stratmann K , Heinsen H , Korf HW , Del Turco D , Ghebremedhin E , Seidel K , Bouzrou M , Grinberg LT , Bohl J , Wharton SB , den Dunnen W , Rub U ((2016) ) Precortical phase of Alzheimer’s disease (AD)-related tau cytoskeletal pathology. Brain Pathol 26: , 371–386. |
[43] | Ueberham U , Rohn S , Ueberham E , Wodischeck S , Hilbrich I , Holzer M , Bruckner MK , Gruschka H , Arendt T ((2014) ) Pin1 promotes degradation of Smad proteins and their interaction with phosphorylated tau in Alzheimer’s disease. Neuropathol Appl Neurobiol 40: , 815–832. |
[44] | Min SW , Chen X , Tracy TE , Li Y , Zhou Y , Wang C , Shirakawa K , Minami SS , Defensor E , Mok SA , Sohn PD , Schilling B , Cong X , Ellerby L , Gibson BW , Johnson J , Krogan N , Shamloo M , Gestwicki J , Masliah E , Verdin E , Gan L ((2015) ) Critical role of acetylation in tau-mediated neurodegeneration and cognitive deficits. Nat Med 21: , 1154–1162. |
[45] | Gorsky MK , Burnouf S , Dols J , Mandelkow E , Partridge L ((2016) ) Acetylation mimic of lysine 280 exacerbates human Tau neurotoxicity in vivo. Sci Rep 6: , 22685. |
[46] | Kingwell K ((2015) ) Neurodegenerative disease: Targeting tau acetylation attenuates neurodegeneration. Nat Rev Drug Discov 14: , 748. |
[47] | Wheeler JM , McMillan PJ , Hawk M , Iba M , Robinson L , Xu GJ , Dombroski BA , Jeong D , Dichter MA , Juul H , Loomis E , Raskind M , Leverenz JB , Trojanowski JQ , Lee VM , Schellenberg GD , Kraemer BC ((2015) ) High copy wildtype human 1N4R tau expression promotes early pathological tauopathy accompanied by cognitive deficits without progressive neurofibrillary degeneration. Acta Neuropathol Commun 3: , 33. |
[48] | Pooler AM , Noble W , Hanger DP ((2014) ) A role for tau at the synapse in Alzheimer’s disease pathogenesis. Neuropharmacology 76 Pt A: , 1–8. |
[49] | Causevic M , Farooq U , Lovestone S , Killick R ((2010) ) beta-Amyloid precursor protein and tau protein levels are differently regulated in human cerebellum compared to brain regions vulnerable to Alzheimer’s type neurodegeneration. Neurosci Lett 485: , 162–166. |
[50] | Wang X , Zheng W , Xie JW , Wang T , Wang SL , Teng WP , Wang ZY ((2010) ) Insulin deficiency exacerbates cerebral amyloidosis and behavioral deficits in an Alzheimer transgenic mouse model. Mol Neurodegener 5: , 46. |
[51] | Rilla K , Siiskonen H , Spicer AP , Hyttinen JM , Tammi MI , Tammi RH ((2005) ) Plasma membrane residence of hyaluronan synthase is coupled to its enzymatic activity. J Biol Chem 280: , 31890–31897. |
[52] | Perry G , Nunomura A , Hirai K , Takeda A , Aliev G , Smith MA ((2000) ) Oxidative damage in Alzheimer’s disease: The metabolic dimension. Int J Dev Neurosci 18: , 417–421. |
[53] | Iqbal K , Grundke-Iqbal I ((2005) ) Metabolic/signal transduction hypothesis of Alzheimer’s disease and other tauopathies. Acta Neuropathol 109: , 25–31. |
[54] | Rilla K , Oikari S , Jokela TA , Hyttinen JM , Karna R , Tammi RH , Tammi MI ((2013) ) Hyaluronan synthase 1 (HAS1) requires higher cellular UDP-GlcNAc concentration than HAS2 and HAS3. J Biol Chem 288: , 5973–5983. |
[55] | Liu F , Shi J , Tanimukai H , Gu J , Gu J , Grundke-Iqbal I , Iqbal K , Gong CX ((2009) ) Reduced O-GlcNAcylation links lower brain glucose metabolism and tau pathology in Alzheimer’s disease. Brain 132: , 1820–1832. |
[56] | Dityatev A , Fellin T ((2008) ) Extracellular matrix in plasticity and epileptogenesis. Neuron Glia Biol 4: , 235–247. |
[57] | Bukalo O , Schachner M , Dityatev A ((2007) ) Hippocampal metaplasticity induced by deficiency in the extracellular matrix glycoprotein tenascin-R. J Neurosci 27: , 6019–6028. |
[58] | Brakebusch C , Seidenbecher CI , Asztely F , Rauch U , Matthies H , Meyer H , Krug M , Bockers TM , Zhou X , Kreutz MR , Montag D , Gundelfinger ED , Fassler R ((2002) ) Brevican-deficient mice display impaired hippocampal CA1 long-term potentiation but show no obvious deficits in learning and memory. Mol Cell Biol 22: , 7417–7427. |
[59] | Zhou XH , Brakebusch C , Matthies H , Oohashi T , Hirsch E , Moser M , Krug M , Seidenbecher CI , Boeckers TM , Rauch U , Buettner R , Gundelfinger ED , Fassler R ((2001) ) Neurocan is dispensable for brain development. Mol Cell Biol 21: , 5970–5978. |
[60] | Kochlamazashvili G , Henneberger C , Bukalo O , Dvoretskova E , Senkov O , Lievens PM , Westenbroek R , Engel AK , Catterall WA , Rusakov DA , Schachner M , Dityatev A ((2010) ) The extracellular matrix molecule hyaluronic acid regulates hippocampal synaptic plasticity by modulating postsynaptic L-type Ca(2+) channels. Neuron 67: , 116–128. |
[61] | Tsien RY ((2013) ) Very long-term memories may be stored in the pattern of holes in the perineuronal net. Proc Natl Acad Sci U S A 110: , 12456–12461. |
[62] | Arranz AM , Perkins KL , Irie F , Lewis DP , Hrabe J , Xiao F , Itano N , Kimata K , Hrabetova S , Yamaguchi Y ((2014) ) Hyaluronan deficiency due to Has3 knock-out causes altered neuronal activity and seizures via reduction in brain extracellular space. J Neurosci 34: , 6164–6176. |
[63] | Ravaglia S , Bini P , Sinforiani E , Franciotta D , Zardini E , Tosca P , Moglia A , Costa A ((2008) ) Cerebrospinal fluid levels of tau phosphorylated at threonine 181 in patients with Alzheimer’s disease and vascular dementia. Neurol Sci 29: , 417–423. |
[64] | Leszek J , Malyszczak K , Janicka B , Kiejna A , Wiak A ((2003) ) Total tau in cerebrospinal fluid differentiates Alzheimer’s disease from vascular dementia. Med Sci Monit 9: , CR484–CR488. |
[65] | Nagga K , Hansson O , van Westen D , Minthon L , Wennstrom M ((2014) ) Increased levels of hyaluronic acid in cerebrospinal fluid in patients with vascular dementia. J Alzheimers Dis 42: , 1435–1441. |
[66] | Nielsen HM , Palmqvist S , Minthon L , Londos E , Wennstrom M ((2012) ) Gender-dependent levels of hyaluronic acid in cerebrospinal fluid of patients with neurodegenerative dementia. Curr Alzheimer Res 9: , 257–266. |
Figures and Tables
Fig.1
Immunohistochemical and immunofluorescence pictures demonstrate that HASs are widely expressed in the cortex and hippocampus of wild-type mice. A-C) In the hippocampus, Has1 not only localizes to the membrane of the cell body but also localizes to the membrane of the axon (Aa), Has2 is only present in the cytoplasm of the cells in the stratum pyramidale (Sp) and stratum oriens (So) of the hippocampus (Bb), and Has3 is only present in the cytoplasm of the cells in the stratum pyramidale (Sp) of the hippocampus (Cc). In the cortex, Has1 is also predominantly expressed in the cell membranes of the neurons (Aa’). Interestingly, however, we did not observe any localization of Has2 and Has3 in the axons in the cortex (Bb’ and Cc’). Has3 is the predominantly expressed HAS in blood vessels in the brain. Scale bar = 500μm. D) The distribution of HASs in the cortex were determined by immunofluorescence staining. NeuN is red. HASs are green. Scale bar = 10μm.
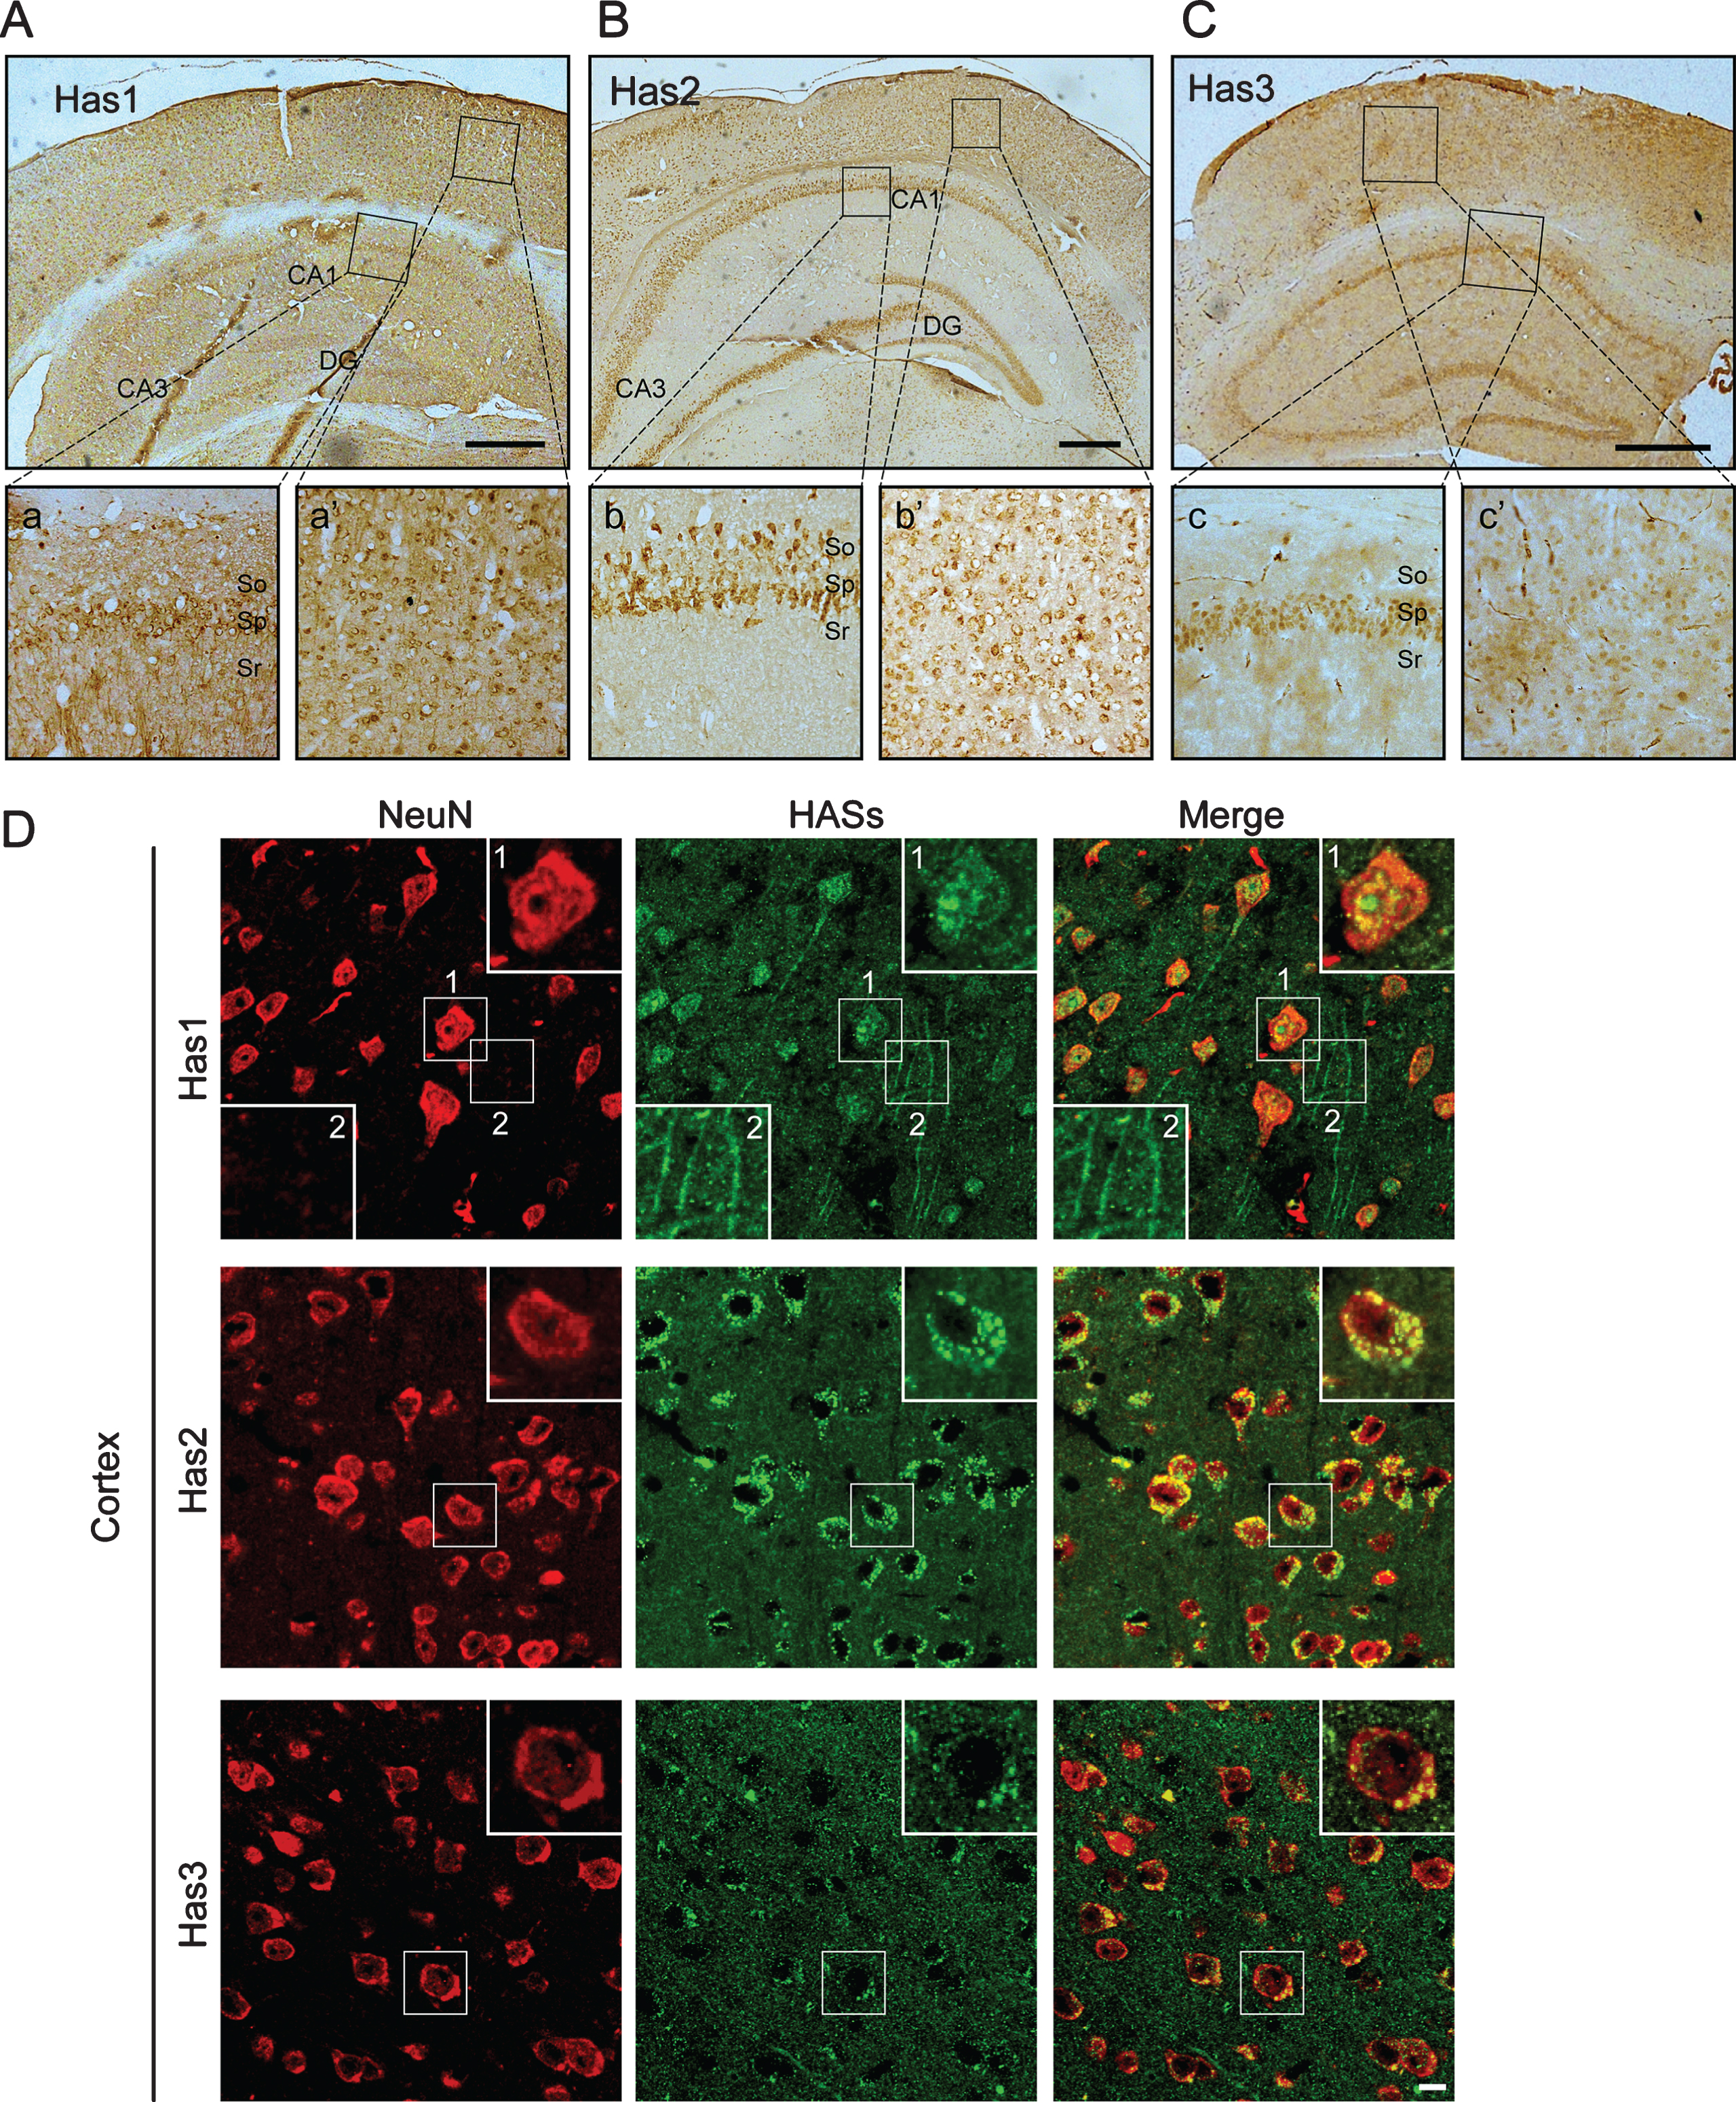
Fig.2
Immunoblot analysis and immunofluorescence staining indicate that the expression of tau is significant higher in TauP301S Tg mice (10-month-old). A-D) Immunoblot analysis showing tau expression in cortex (A, representative pictures; B, quantification) and hippocampus (C, representative pictures; D, quantification). Data are represented as means±se.; n = 7 mice per group. **p < 0.01; ***p < 0.001. The p values were calculated using unpaired t-tests with Welch’s corrections (B,D). E) immunofluorescence images showing the distribution and the expression of tau in CA3 of hippocampus. WT, wild type mice. Tau P301S, TauP301S Tg mice. Scale bar = 10μm.
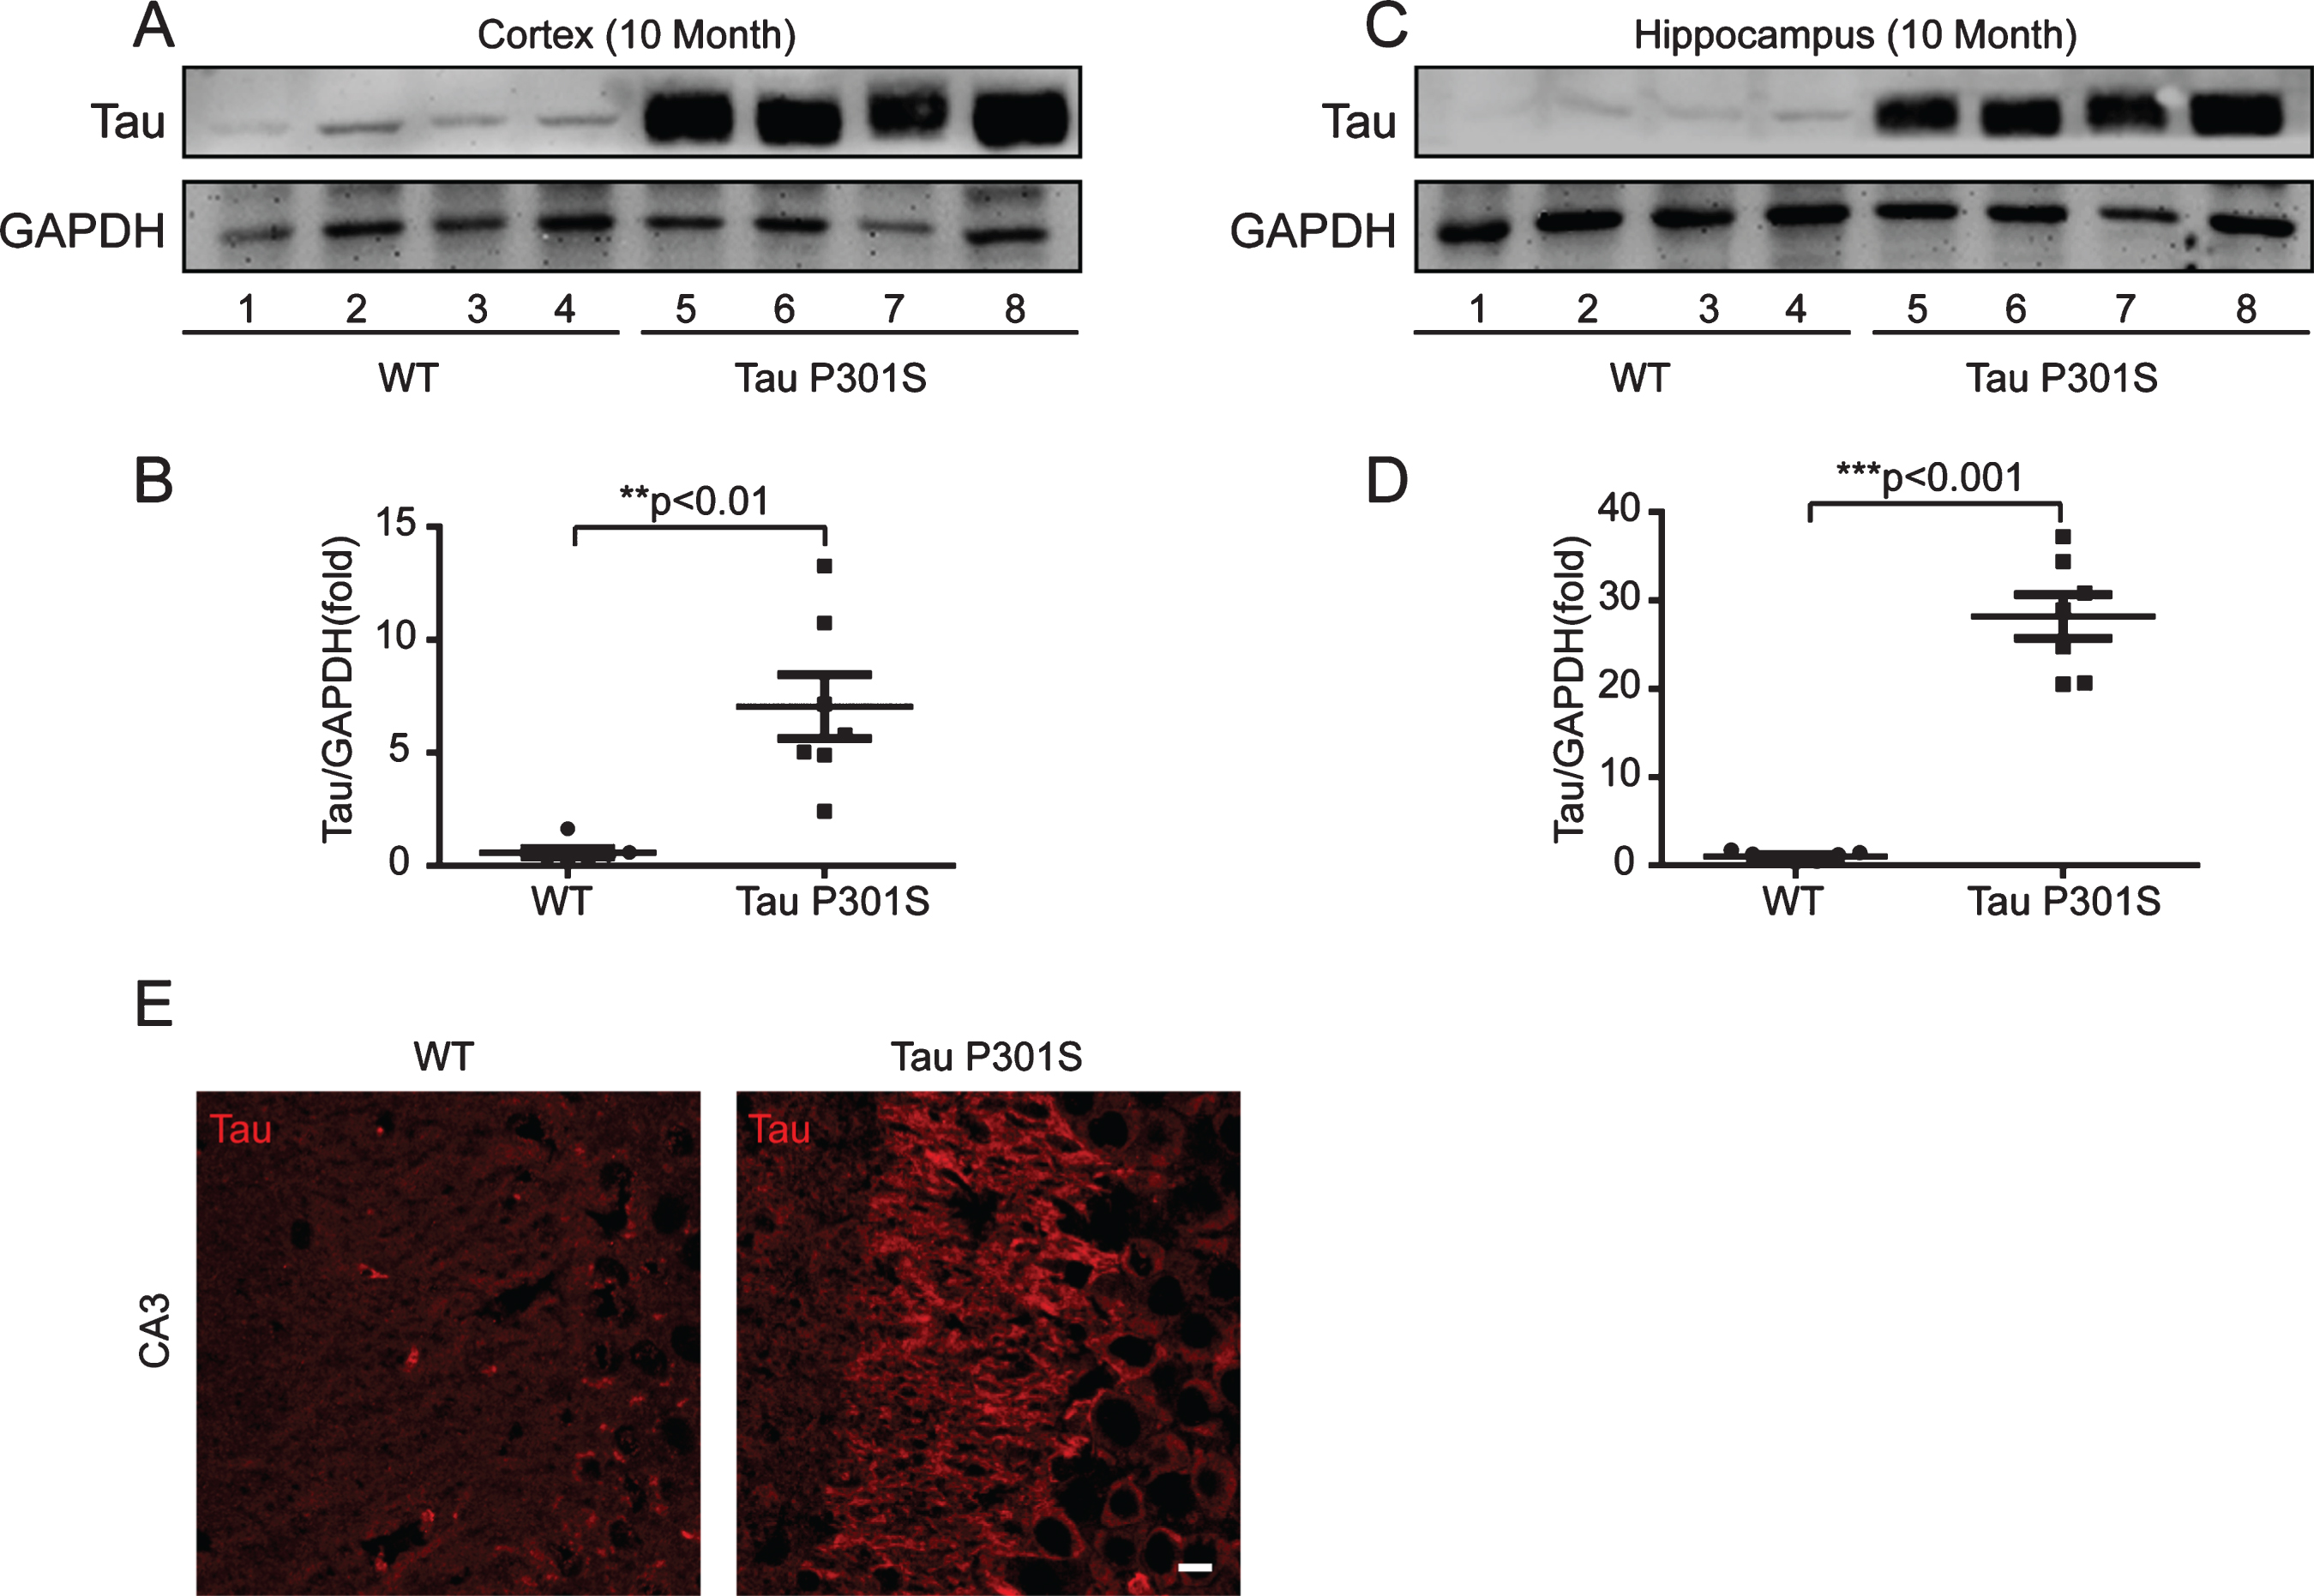
Fig.3
Tau pathology promotes the production of short chain HA (<200 kDa) through regulating of HASs expression in hippocampus. A) Quantitative real-time PCR data showing the mRNA expression levels of Has1, Has2, and Has3 in the hippocampus of the TauP301S Tg mice and control mice (10-month-old). B-D) TauP301S inhibits the expression of Has1 and promotes Has3 expression in the hippocampus of TauP301S Tg mice. B) Immunoblot images (upper panel) and quantifications (lower panel) demonstrating that Has1 is decreased in hippocampus of the TauP301S Tg mice. C) Immunoblot images (upper panel) and quantifications (lower panel) illustrating that Has2 is not altered in the hippocampus of the TauP301S Tg mice. In contrast, the protein level of Has3 (D, left and right panels) is increased in the hippocampus of the TauP301S Tg mice. E) Immunoblot images (left panel) and quantifications (right panel) demonstrating that short chain HA (< 200 kDa) is increased in the hippocampus of TauP301S Tg mice (Tau P301S). The data are presented as relative fold changes from the normal controls (WT). Data are represented as means±se.; n = 7 mice per group. *p < 0.05; ***p < 0.001. The p values were calculated using unpaired t-tests (A, middle and left panel; B, lower panel; C, lower panel; E, right panel) or unpaired t-tests with Welch’s corrections (A, left panel; D, right panel).
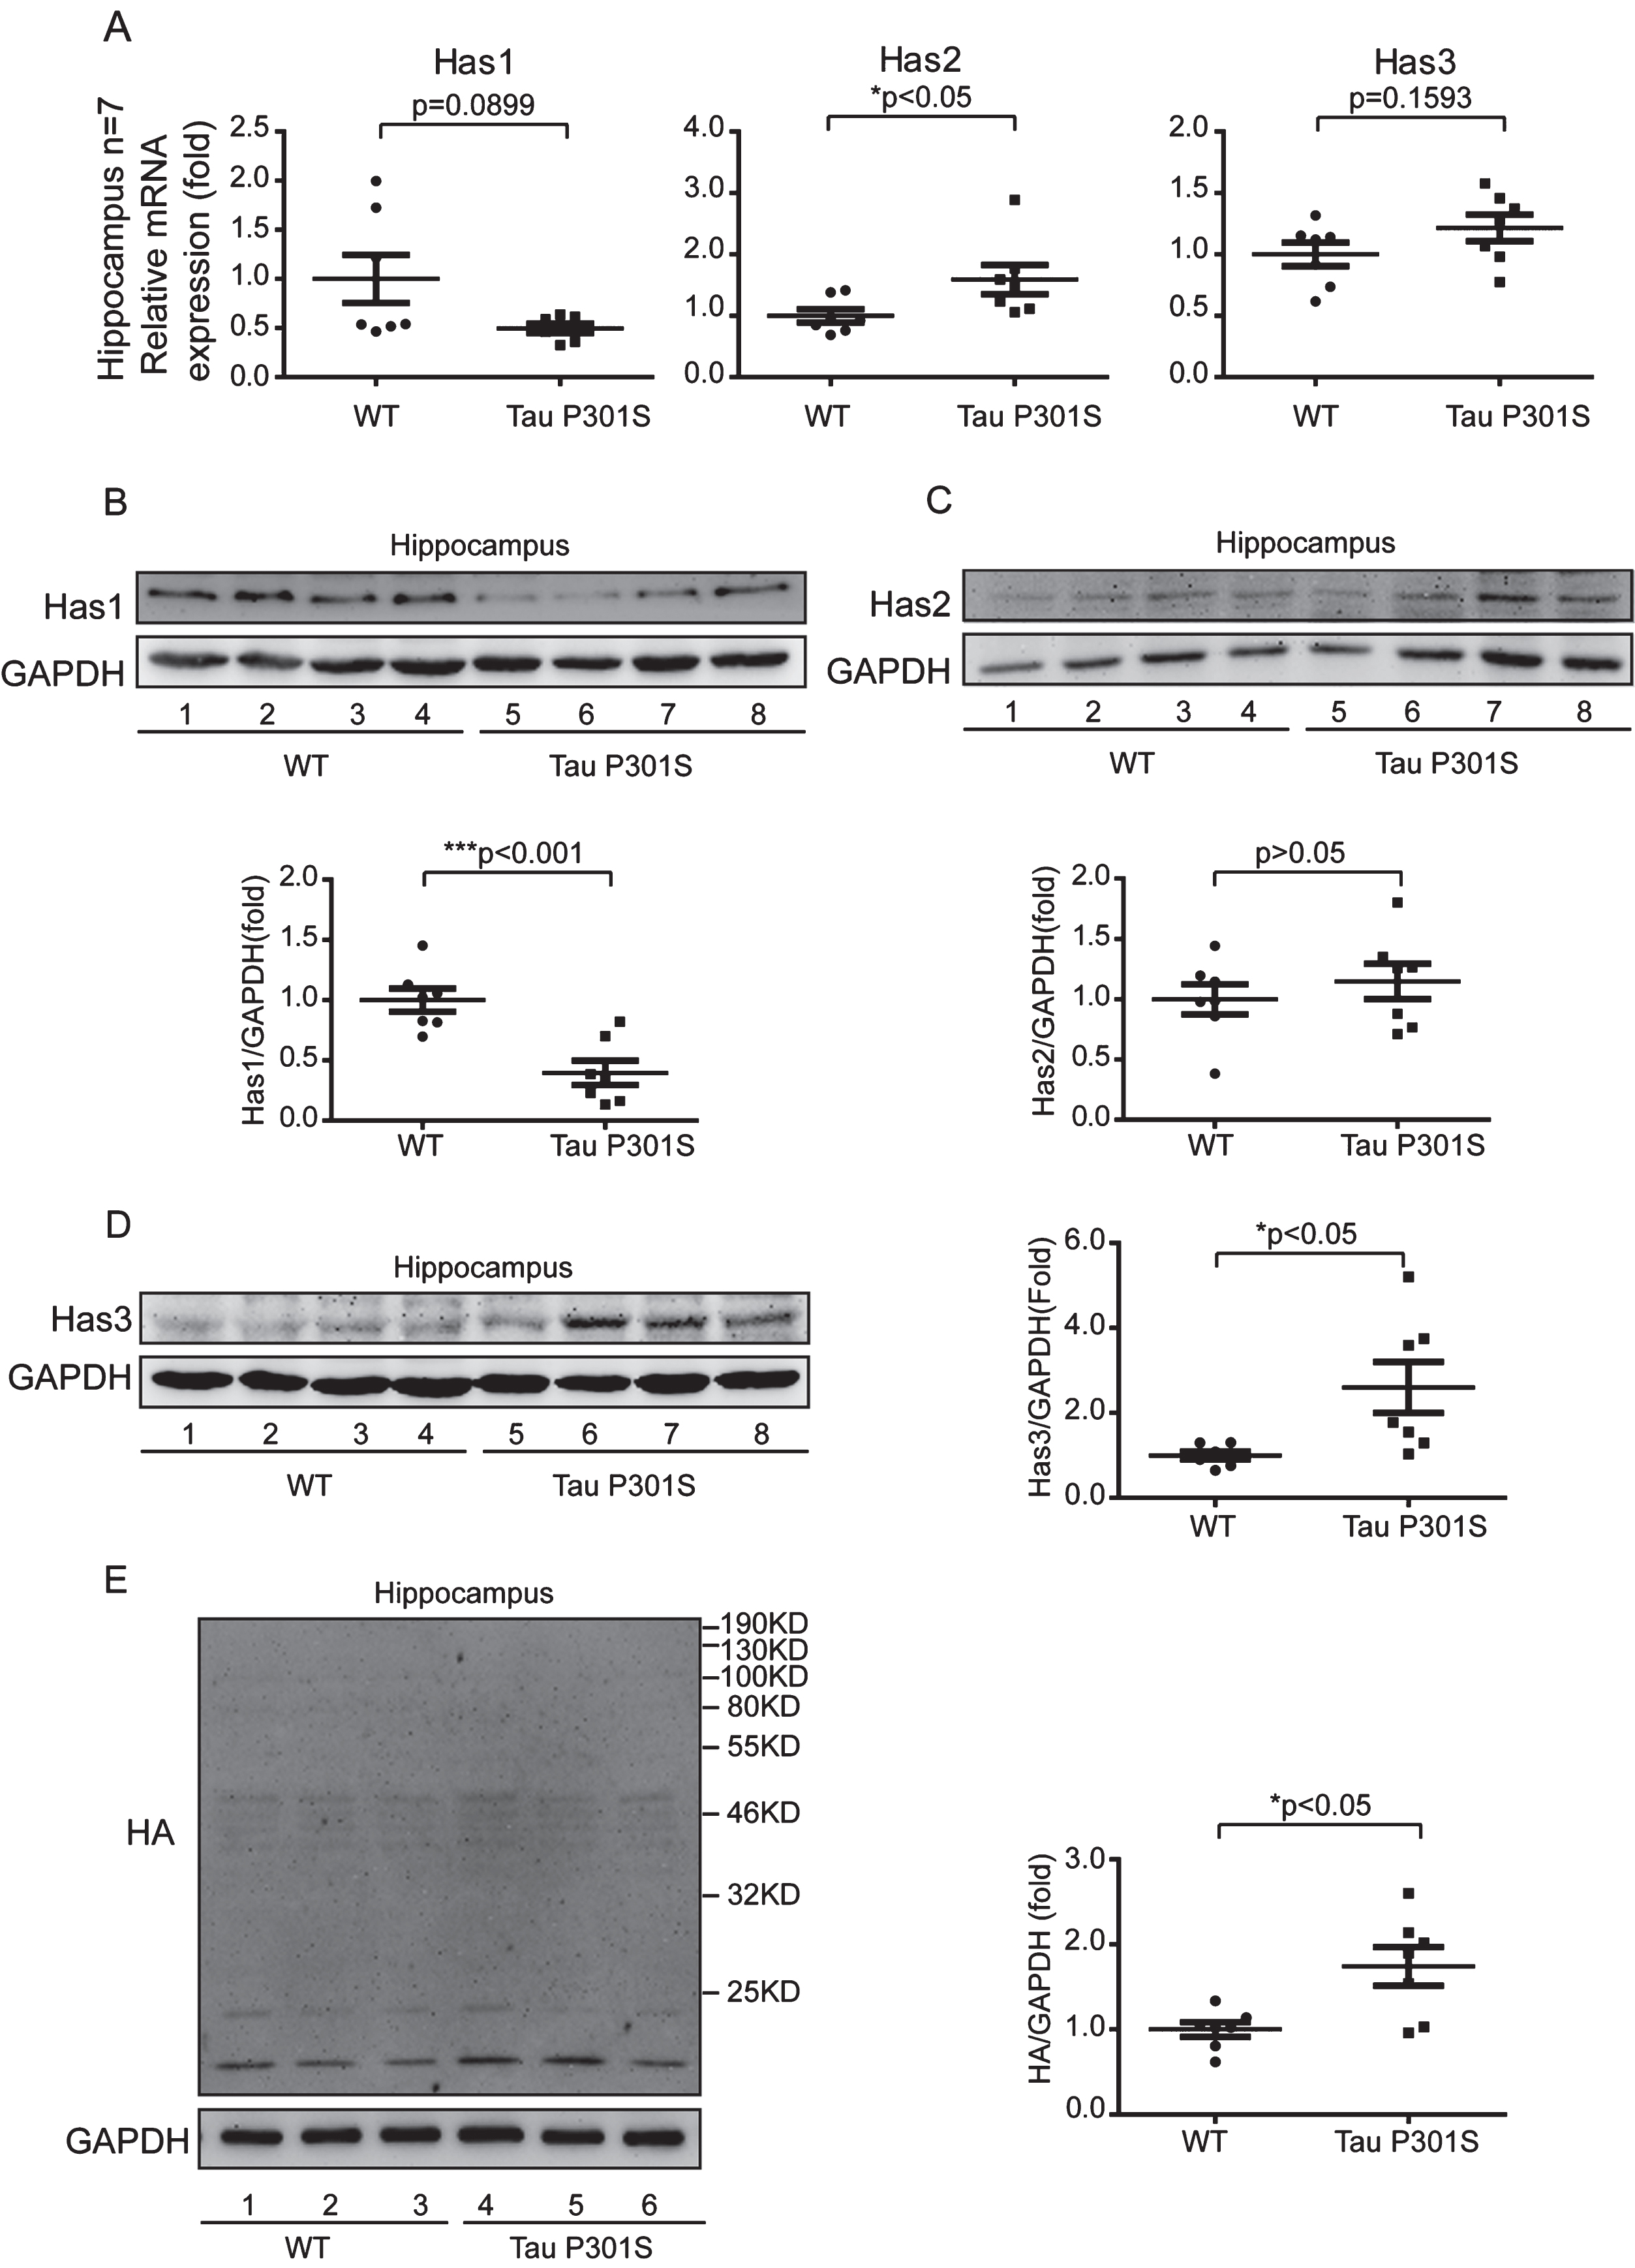
Fig.4
TauP301S expression inhibits the axonal-localization of Has1 in hippocampus. A, B) Immunohistochemical analyses (A) and immunofluorescence images (B) revealing the expressions and the distribution of Has1 in CA1 of the wild-type (WT) and TauP301S Tg (Tau P301S) mice (10-month-old). The enlarged regions of A showing the axonal-localization of Has1 in WT and TauP301S Tg mice. The lower panels of B are the enlarge Z section images of box 1 and 2 in the upper panel, showing the relative localization of Has1 (green) and NEFH (red) in the stratum radiatum of hippocampus. Scale bar = 50μm. C) Immunohistochemical analyses revealing the expressions of Has2 and Has3 in CA1 of WT and TauP301S Tg mice. Scale bar = 50μm.
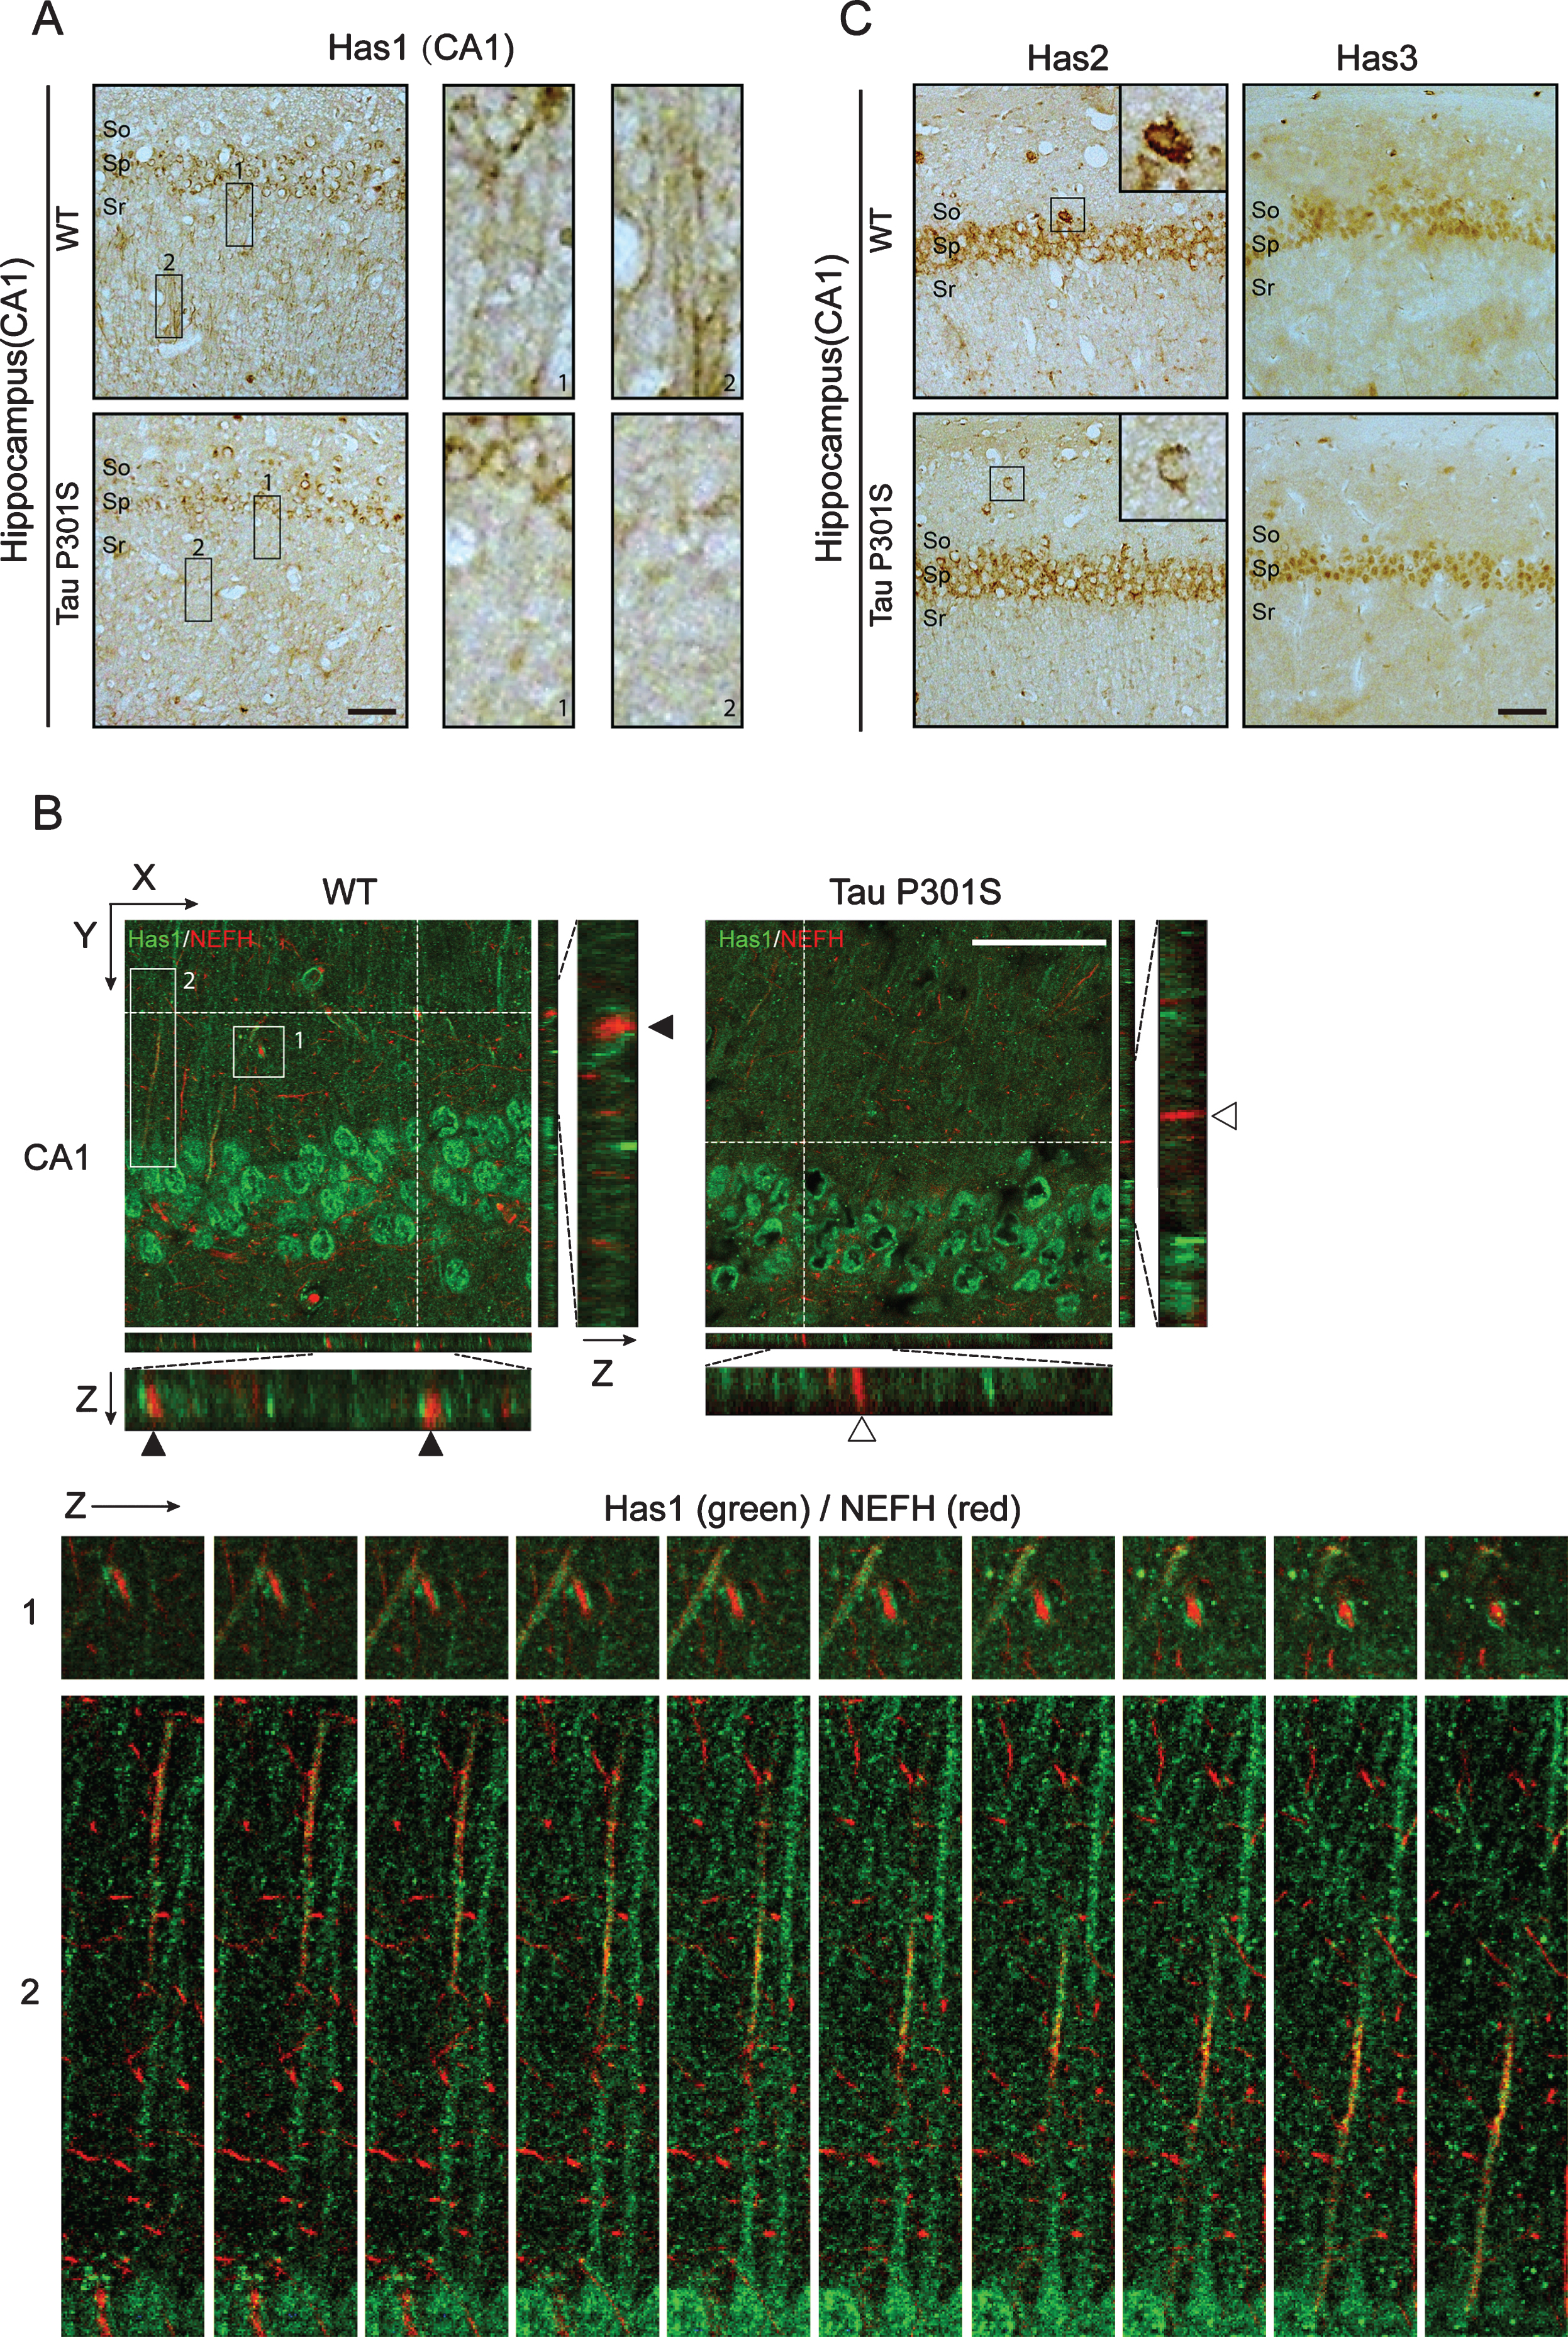
Fig.5
TauP301S promotes the accumulation of Has1 in cell body in 3-wks-old TauP301S Tg mice. Immunofluorescence images (A-B, left panels) and quantifications (A-B, right panels) showing the distribution of Has1 in CA1 (B) and CA3 (C) of 3-week-old TauP301S Tg mice (Tau P301S) and control wild-type mice (WT). Data are represented as means±se.; n = 10 cell bodies per group; the immunofluorescence intensity of Has1 in the cell body was normalized with the intensity of stratum radiatum regions (CA1) and mossy fibers regions (CA3). **p < 0.01; ***p < 0.001. The p values were calculated using unpaired t-tests. Scale bar = 50μm.
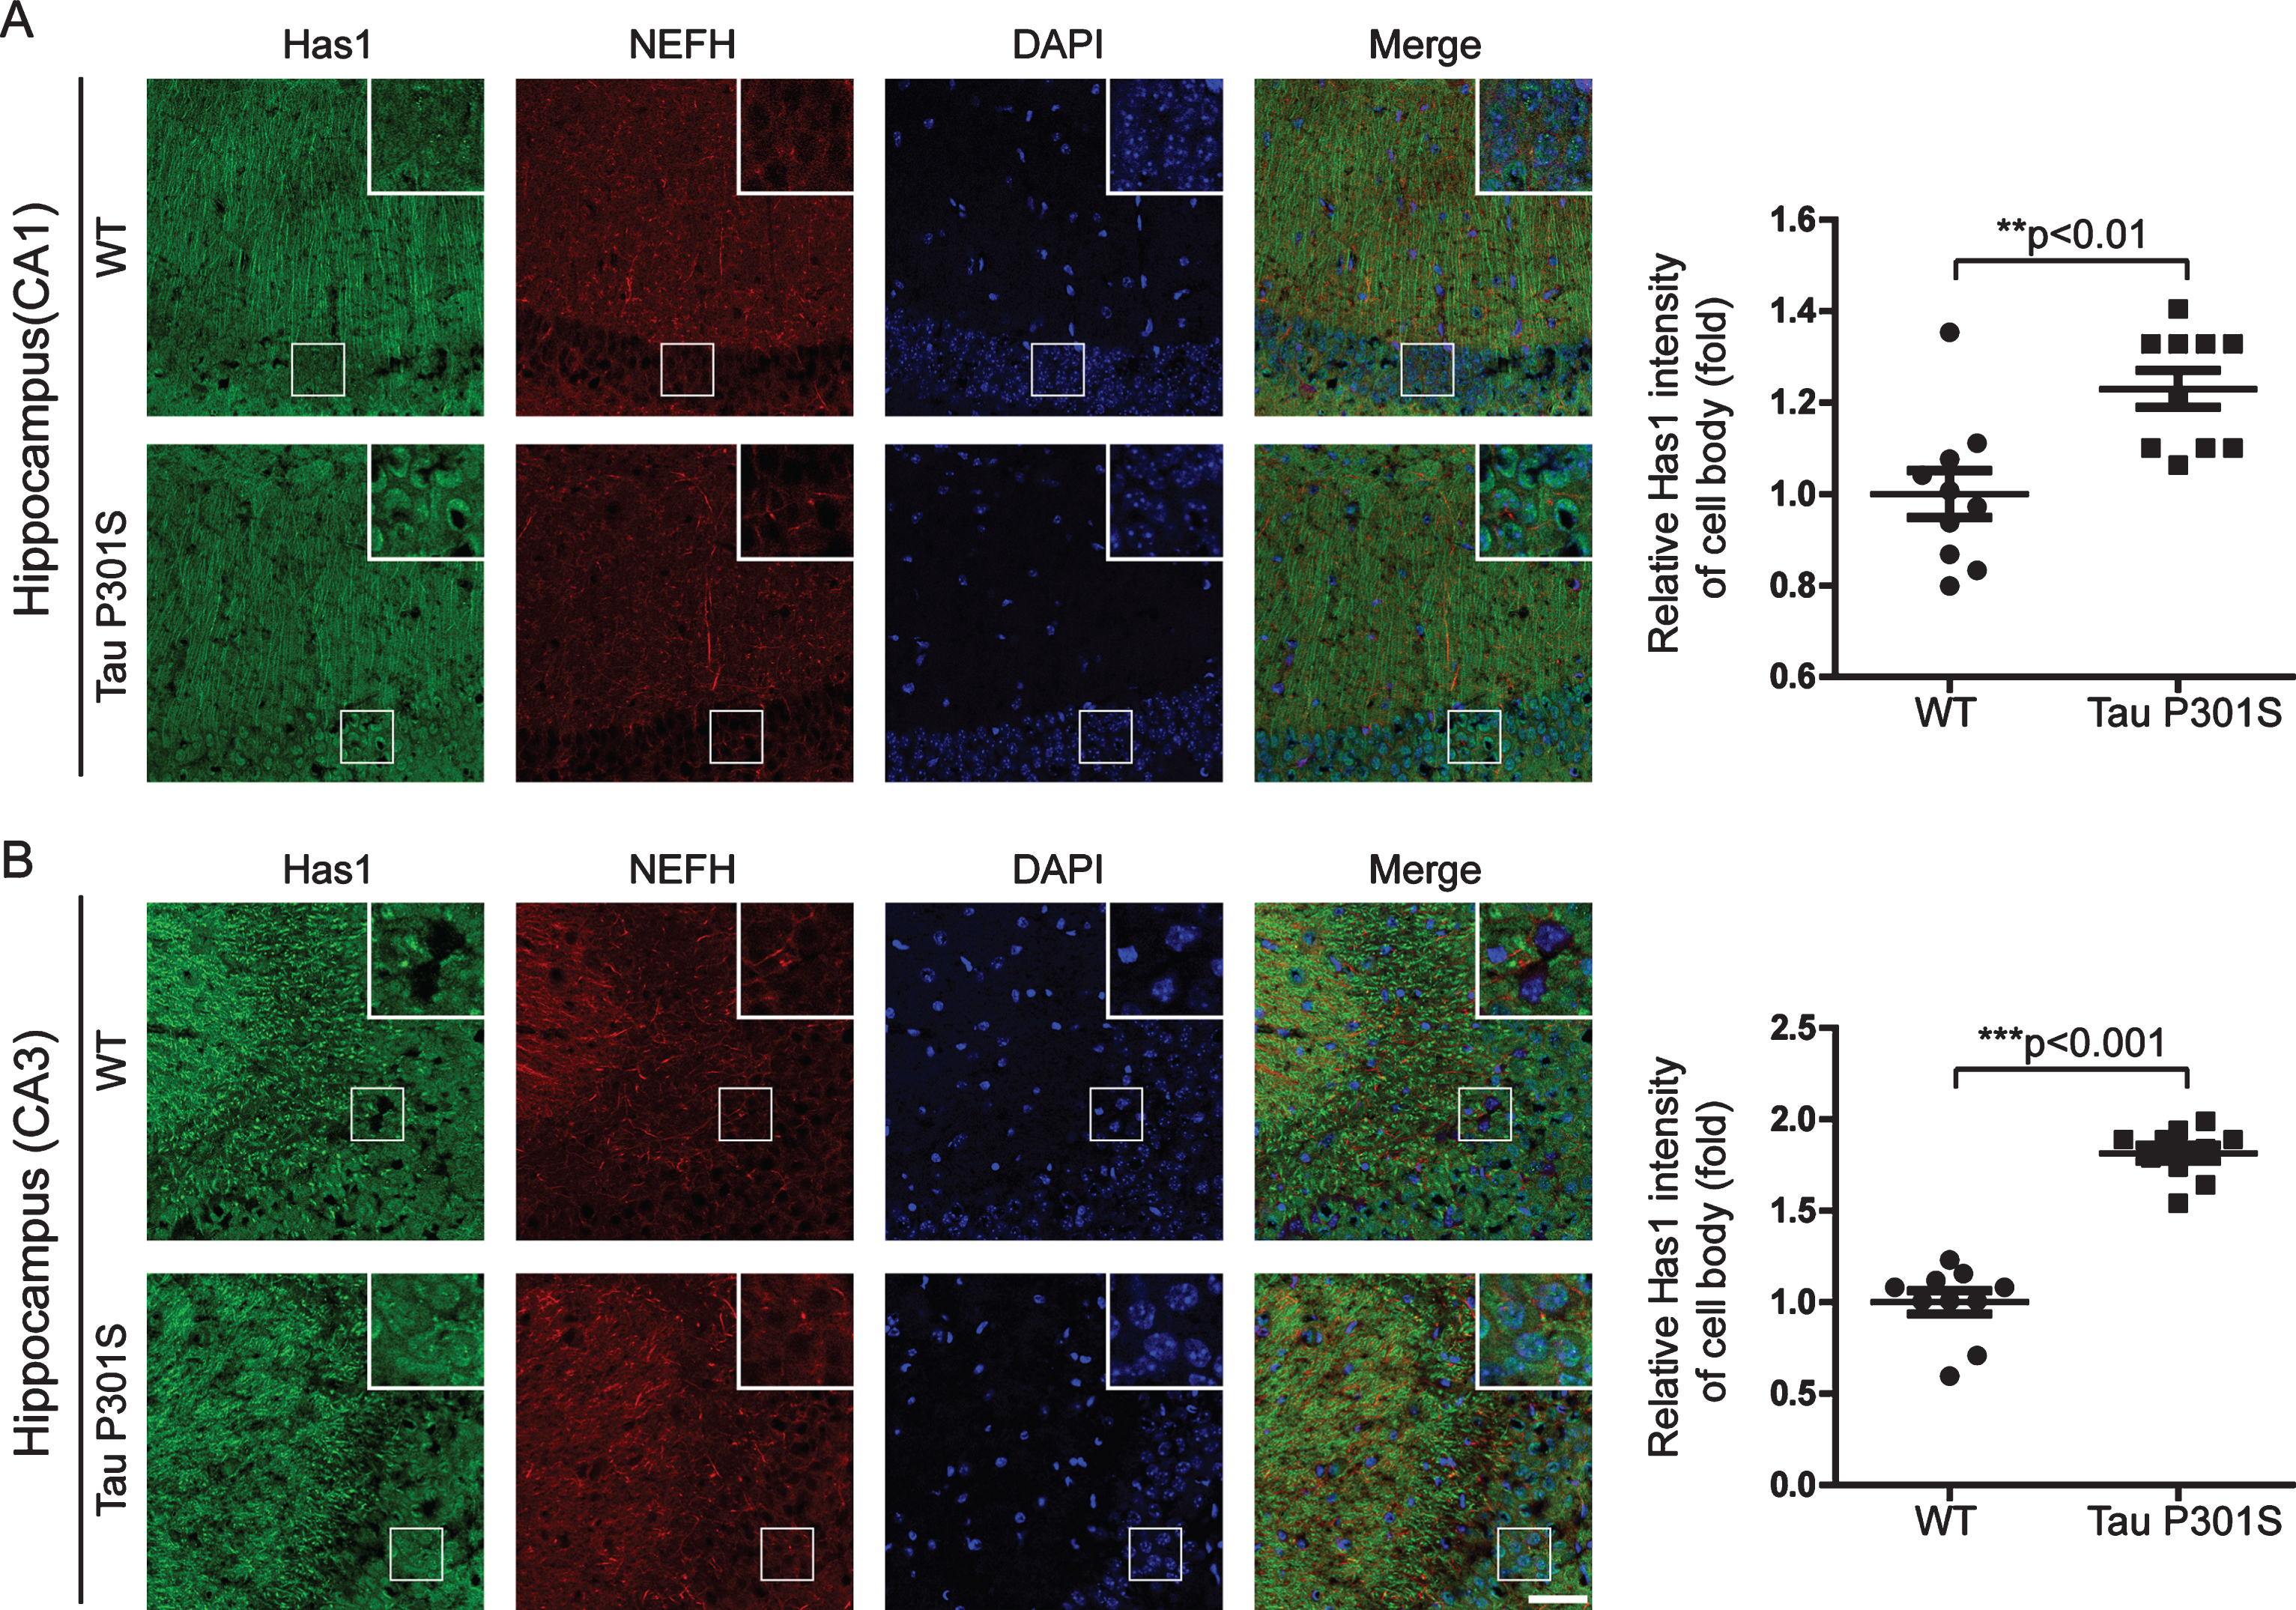
Fig.6
The expression of TauP301S did not affect the expressions of the HAS mRNAs in the cortex (10-month-old). Quantitative real-time PCR data showing the mRNA expression levels of Has1 (A), Has2 (B), and Has3 (C) in the cortex of the TauP301S Tg mice and control mice. The data are provided as the relative fold changes from the normal control. Data are represented as means±se.; n = 7 mice per group. The p values were calculated using unpaired t-tests (A-C).
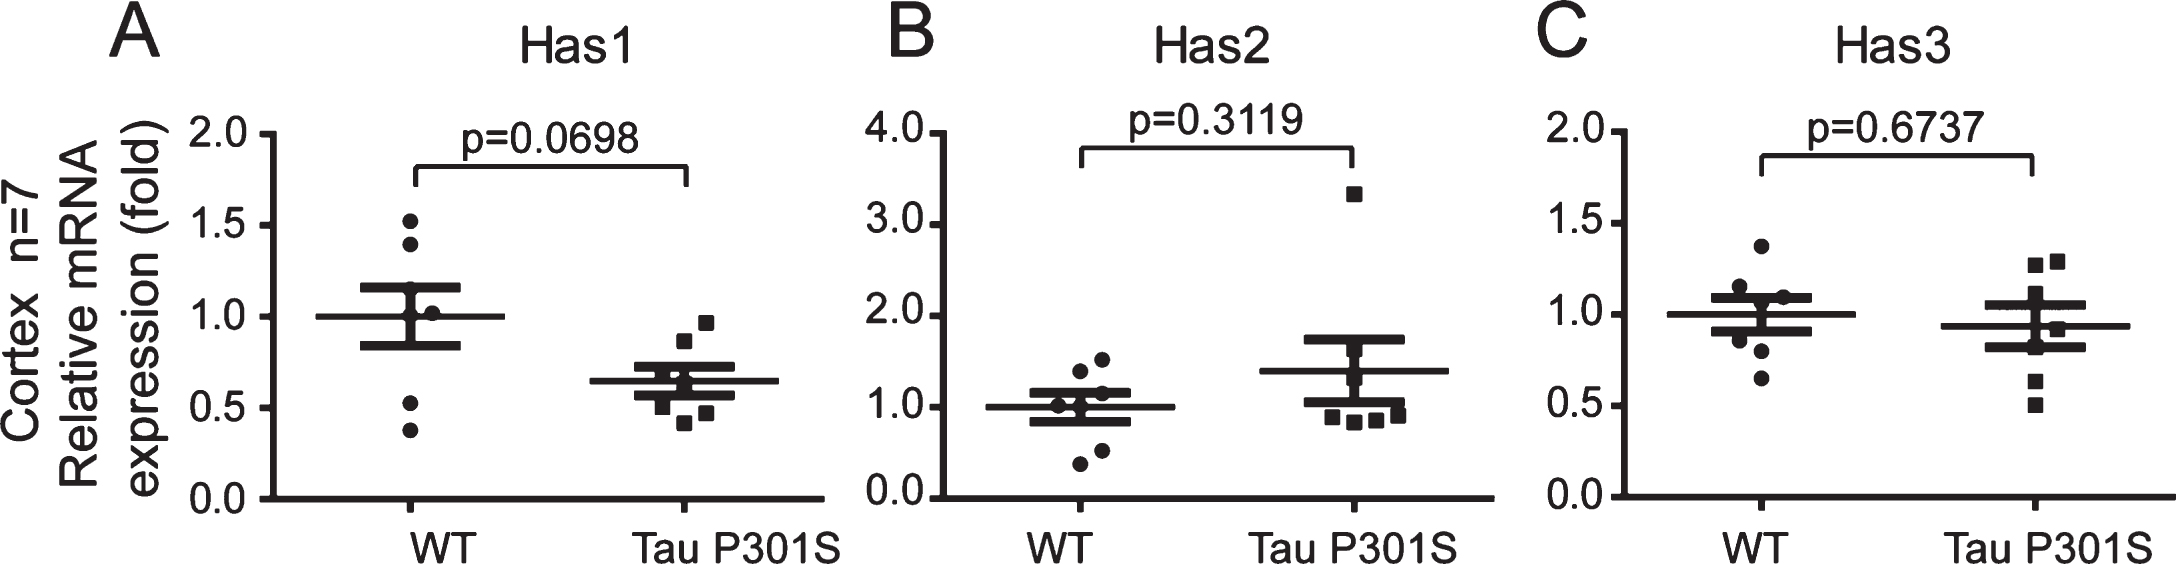
Fig.7
The axonal-localization of Has1 in the cerebral cortex is affected by TauP301S in the TauP301S Tg mice. Immunoblot images (A-C, upper panels) and quantifications (A-C, lower panels) showing the expressions of Has1, Has2, and Has3 in the cerebral cortex of 10-month-old TauP301S Tg mice (Tau P301S) and control wild-type mice (WT). Data are represented as means±se.; n = 7 mice per group. The p values were calculated using unpaired t-tests (A, B) and unpaired t-tests with Welch’s correction (C). D) Immunohistochemical images showing the distributions of Has 1 in 10-month-old WT and TauP301S Tg mice. The enlarged images (D, 1 and 2) show the axonal-localization of Has1 is inhibited by tau pathology. E-H) Immunofluorescence images (E, G) and quantifications (F, H) showing the Has1 is enriched in the cell body of neuronal cells in 10-month-old (E, F) and 3-week-old (G, H) TauP301S Tg mice. Data are represented as means±se.; n = 20 cell bodies per group; the immunofluorescence intensity of Has1 in the cell body was normalized with the intensity of the surrounding area. ***p < 0.001. The p values were calculated using unpaired t-tests. Scale bar = 50μm.
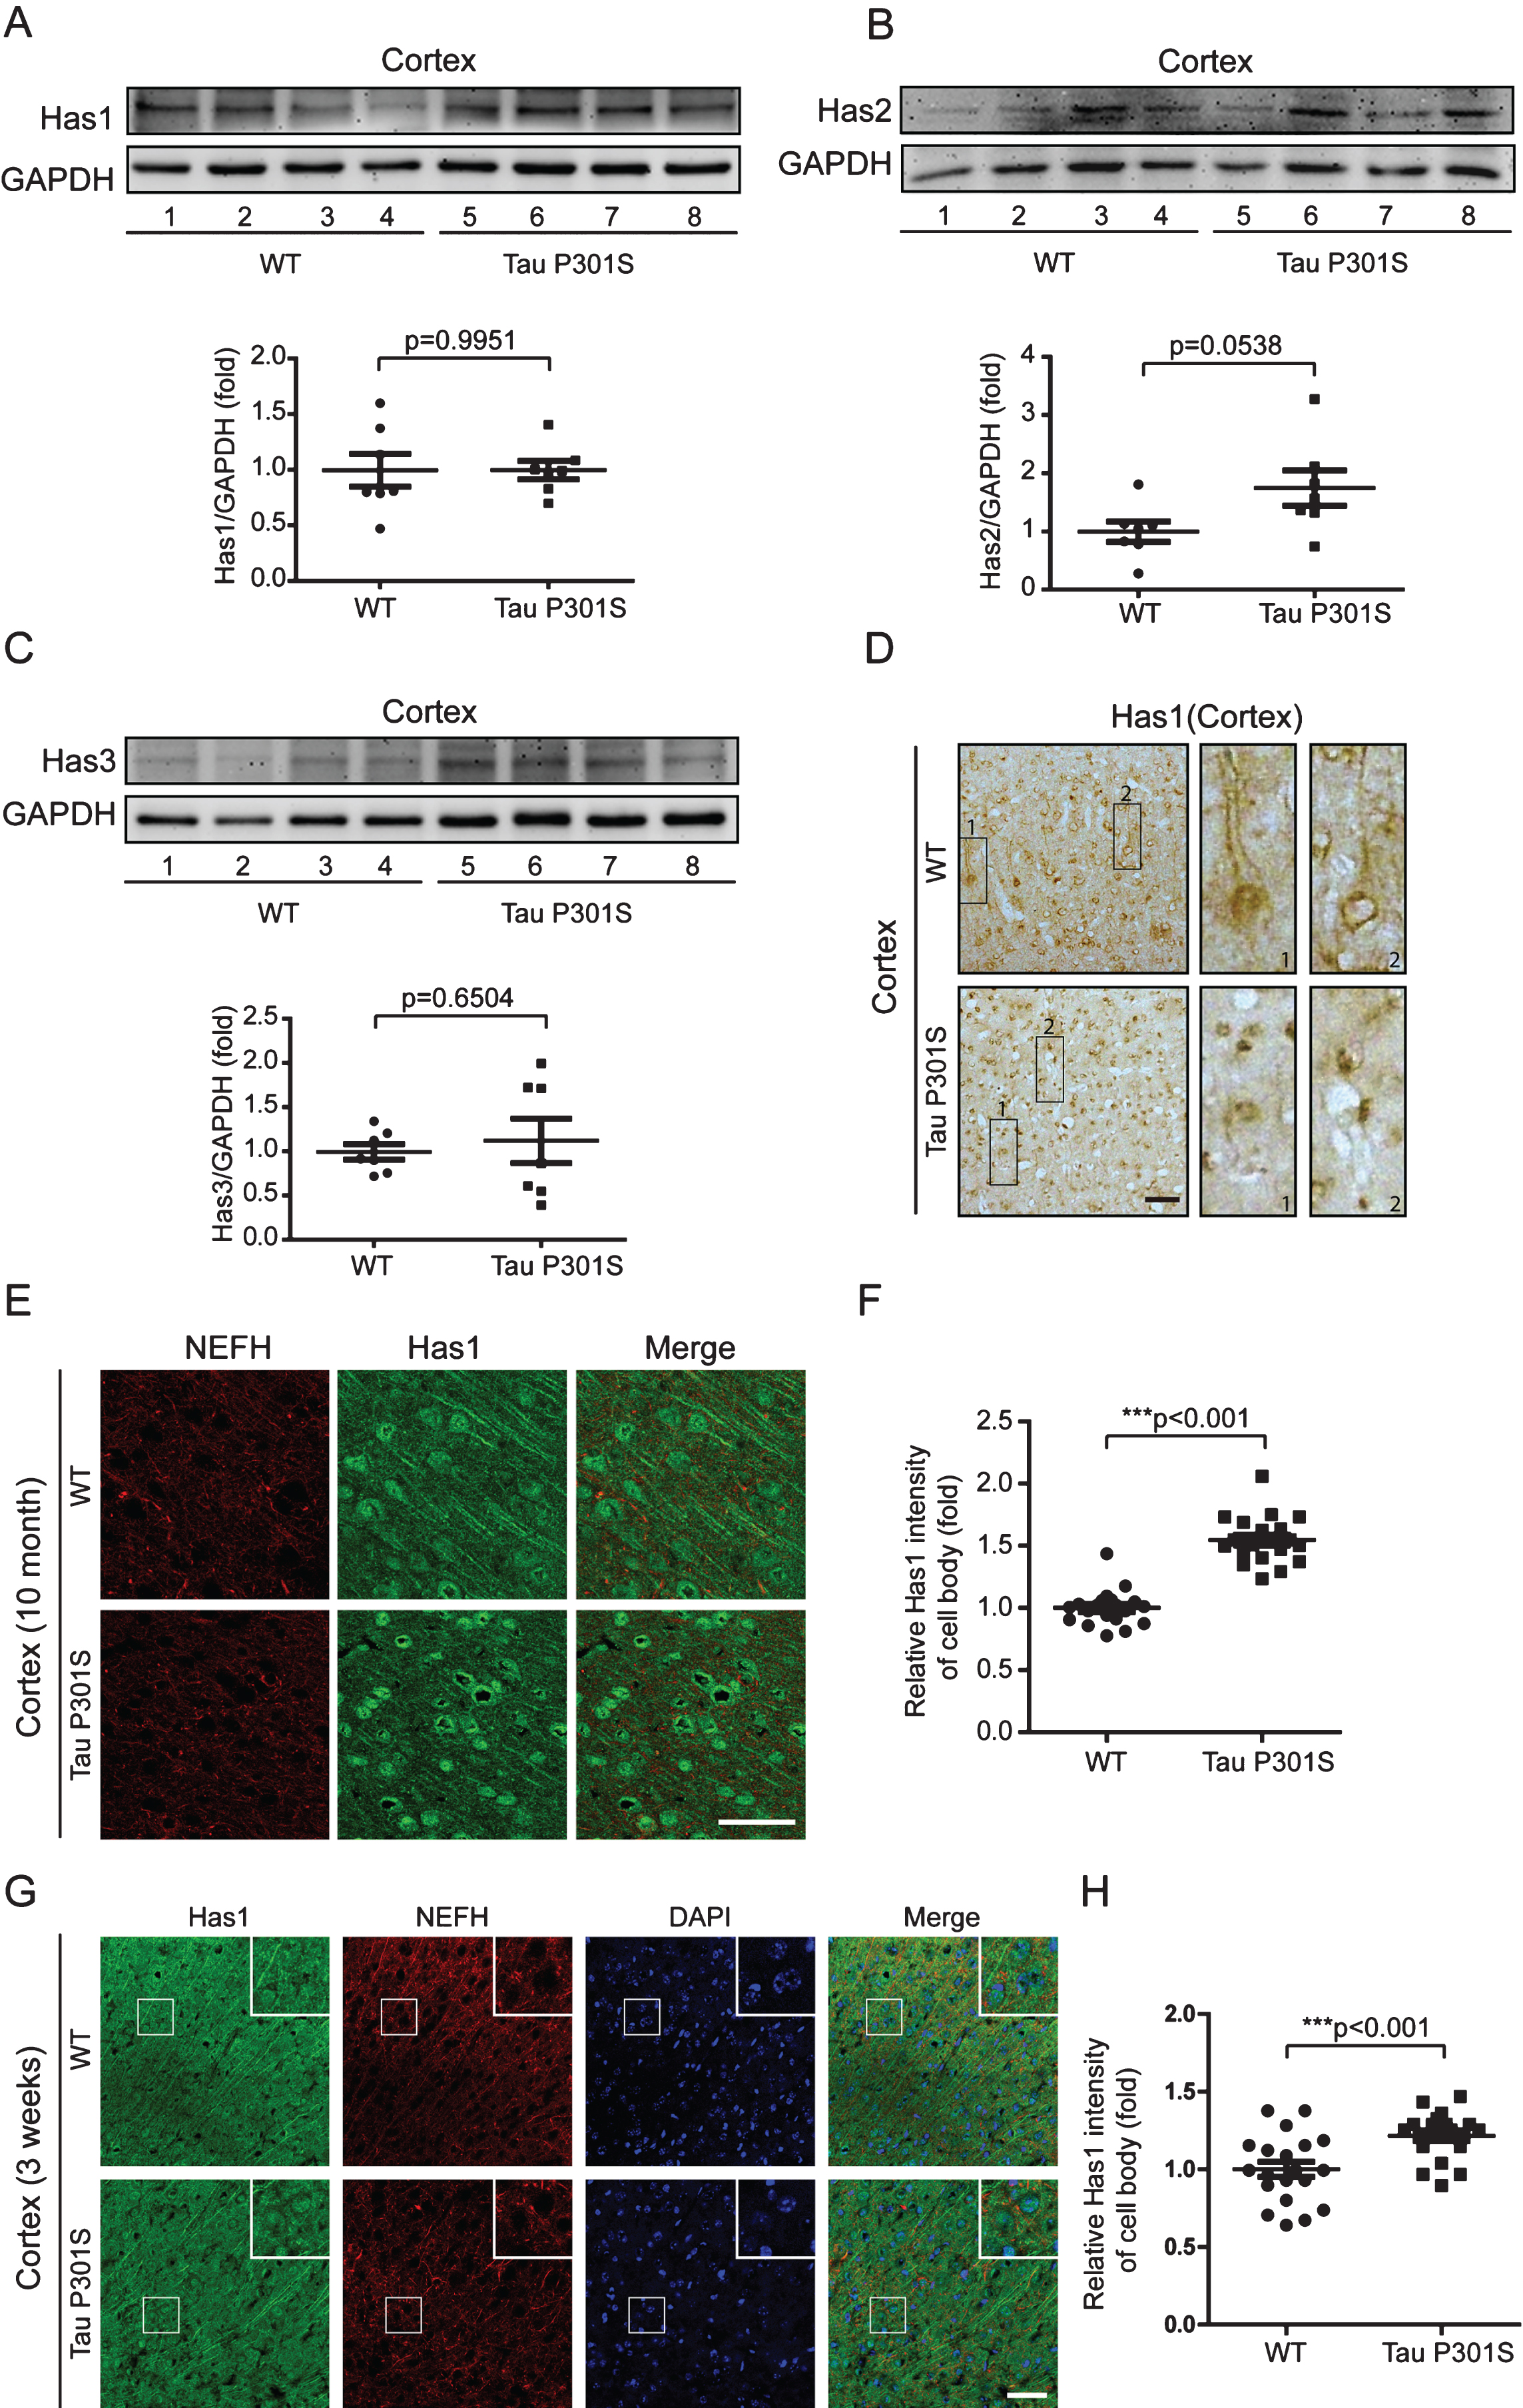
Fig.8
Has1 is enriched in the cell body of neuronal cells and forms plaques in patients with AD. A) Tissue blocks of human brains (normal brain, mild AD, and severe AD) were collected by the New York Brain Bank. Free-floating slices (40μm) were prepared by cryostat, and were stained with Has1 (green) and NeuN (red) antibodies. Scale bar = 50μm. B) Has1 plaques were counted with ImageJ. Data are represented as means±se.; n = 12 pictures per group. ***p < 0.001. The p values were calculated using one-way ANOVA.
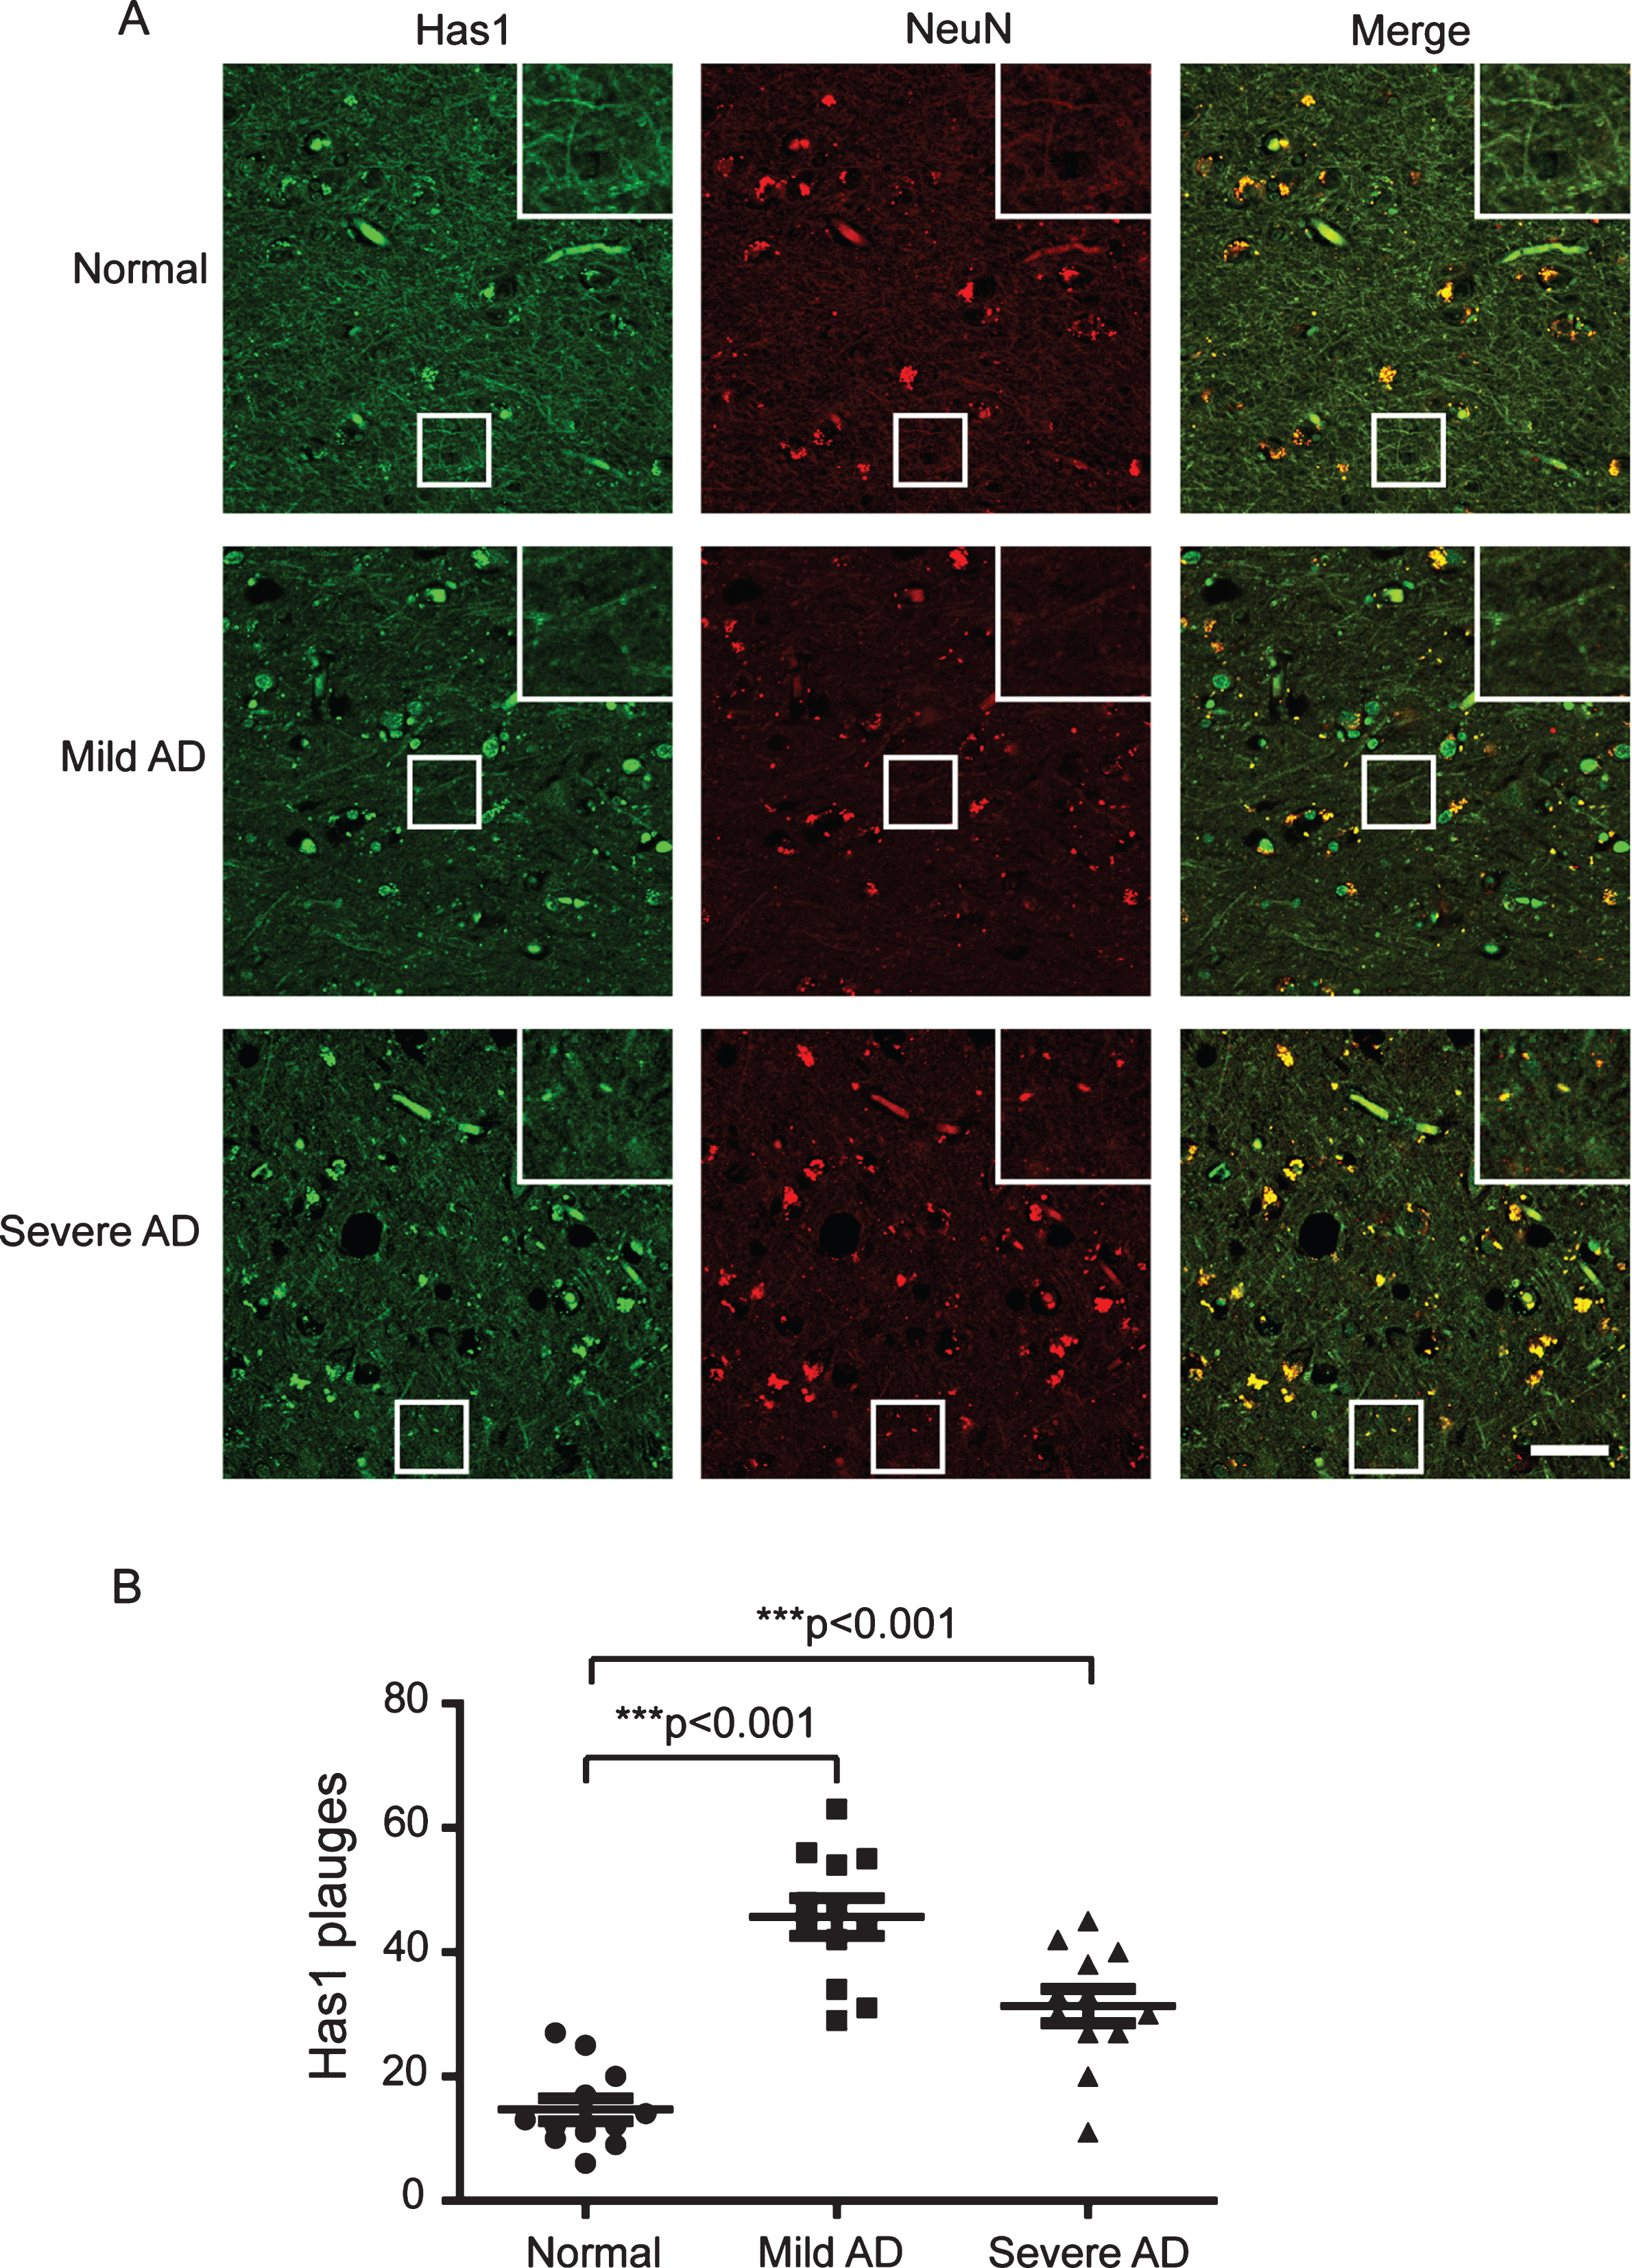
Table 1
Primers used for the quantitative real-time PCR
| Primers | GenBank No. | Sequence |
| TBP_for | NM_013684.3 | TGCACAGGAGCCAAGAGTGA |
| TBP_rev | AGCTGGGAAGCCCAACTTCT | |
| Has1_for | NM_008215.2 | CGACTCCGTGGACTACGTG |
| Has1_rev | GGGTCTTCATCCAACACTCG | |
| Has2_for | NM_008216.3 | ATGTACACAGCCTTCAGAGC |
| Has2_rev | ACCTTCACCATCTCCACAGAT | |
| Has3_for | NM_008217.4 | CACCATTGAGATGCTTCGAG |
| Has3_rev | CTGCTCAGGAAGGAGATCCA |
Table 2
The enrichment of Has1, Has2, and Has3 in the CNS of wild-type mice
| Tissue / Cell Type | Has1 | Has2 | Has3 |
| Cortex | 5.83±0.77 | 2.93±1.43 | 3.95±0.34 |
| Hippocampus | 6.17±0.84 | 4.20±0.48 | 4.11±0.37 |
| Cerebellum | 6.12±0.38 | 3.27±0.61 | 4.49±0.51 |
| Spinal cord | 4.12±0.63 | 2.58±0.92 | 2.47±0.37 |
The data are illustrated as ΔCt = (CtHASes - CtTBP); mean±std.

