
Early Evidence of Low Bone Density and Decreased Serotonergic Synthesis in the Dorsal Raphe of a Tauopathy Model of Alzheimer’s Disease
Abstract
Reduced bone mineral density (BMD) and its clinical sequelae, osteoporosis, occur at a much greater rate in patients with Alzheimer’s disease (AD), often emerging early in the disease before significant cognitive decline is seen. Reduced BMD translates to increased bone fracture risk, decreased quality of life, and increased mortality for AD patients. However, the mechanism responsible for this observation is unclear. We hypothesize that bone loss is an additional component of an AD prodrome-changes that emerge prior to dementia and are mediated by dysfunction of the central serotonergic pathways. We characterized the skeletal phenotype of htau mice that express human forms of the microtubule-associated protein tau that become pathologically hyperphosphorylated in AD. Using radiographic densitometry, we measured BMD in female and male htau mice from 2–6 months of age–time-points prior to the presence of significant tauopathy in the hippocampal/entorhinal regions characteristic of this model. We found a significantly reduced BMD phenotype in htau mice that was most pronounced in males. Using western blotting and immunofluorescence, we showed overall reduced tryptophan hydroxylase (TPH) protein in htau brainstem and a 70% reduction in TPH-positive cells in the dorsal raphe nucleus (DRN)–a pivotal structure in the regulation of the adult skeleton. Elevations of hyperphosphorylated tau (ptau) proteins were also measured in brainstem, and co-labeled immunofluorescence studies showed presence of ptau in TPH-positive cells of the DRN as early as 4 months of age in htau mice. Together, these findings demonstrate that reduced BMD occurs earlier than overt degeneration in a tau-based AD model and that pathological changes in tau phosphorylation occur in the serotonin-producing neurons of the brainstem raphe in these mice. This illuminates a need to define a mechanistic relationship between bone loss and serotonergic deficits in early AD.
INTRODUCTION
Alzheimer’s disease (AD) is characterized by neurocognitive deficits, but some of the earliest symptoms may result from disrupted homeostasis due to neurotransmitter dysregulation [1–3]. Depression, mood swings, agitation, sleep difficulties, appetite issues, and weight loss are recognized as prodromal symptoms of AD that occur several years before cognitive impairment is manifested, and all are linked to serotonergic dysfunction [4, 5]. Furthermore, low bone mineral density (BMD), osteoporosis (the extreme clinical sequelae of low BMD), and increased fracture risk are significant clinical comorbidities in AD that may also be linked to serotonin dysfunction [6–9]. Contrary to assumptions that skeletal problems result from the advanced disease state of AD, bone loss is reported very early in the progression of AD when cognitive decline is minimal and mobility has not yet been compromised [10–12]. In fact, comorbid bone deficits in AD have been shown to be independent of age, body mass index, physical activity [13, 14], and cognitive state [15]. Thus, it has been hypothesized that bone integrity may represent a component of a prodromal state of AD occurring years before evidence of dementia [14, 16]. Of added interest, an increasing number of studies are addressing the role of triggering receptor expressed on myeloid cells 2 (TREM2) in AD [17], which is expressed in bone cells as well as the central nervous system (CNS) [18], since mutations in this immune modulator have been linked to several conditions characterized by tauopathy and dementia (including AD [19]) and are the genetic basis for Nasu-Hakola disease which is characterized by severe dementia and increased bone fragility [20].
Numerous peripheral factors can influence the dynamic process of adult bone remodeling, but in the last decade, a major CNS circuit involving the dorsal raphe nucleus (DRN) of the brainstem has been shown to exert powerful regulation over skeletal homeostasis [21–24]. The DRN is a major source of all brain serotonin (5-hydroxytryptamine: 5-HT), and serotonergic signaling between the DRN and ventromedial hypothalamus (VMH) promotes bone formation in the adult skeleton [21, 22, 24, 25]. Despite common conceptions, bone is an active tissue with significant turnover. Optimal skeletal health is maintained by constant remodeling where bone formation and resorption processes are balanced–when that balance is skewed, excessive formation or loss can deleteriously affect the skeleton. Deficits in serotonergic signaling have been shown to cause significant bone loss in experimental animal models [21] as well as in human conditions [26]. Numerous studies have demonstrated pathological changes in the raphe nuclei early in AD [27, 28], and the emergence of these pathologies has been shown to precede the earliest changes in the entorhinal cortex–the area where AD staging systems classically indicate first appearance of neurofibrillary tangles [5, 28, 29]. Furthermore, transgenic mice that overexpress amyloid-β (Aβ) exhibit an osteoporotic phenotype early in life [30–33]. However, it is unclear how or where Aβ has its effect, as it has also been identified in bones of AD patients and has been shown to exert direct, deleterious effects on this tissue in the periphery [34]. Despite these initial findings on the association between AD, 5-HT, and reduced BMD, this topic remains largely uninvestigated.
As research in this field shifts focus toward identifying new risk-factors, biomarkers, and targets for intervention, evaluating the role of the DRN in AD may provide valuable information for all three of these subjects. Early dysfunction in serotonergic signaling arising from this structure could provide an etiological mechanism for bone loss in AD and potentially implicate low BMD as another symptom in the clinical prodrome of this disorder. One way to investigate this is by assessing the relationship between bone loss and the second major protein implicated in AD pathology: the microtubule associated protein tau (MAPT). MAPT is primarily expressed in the nervous system and has not been identified in bone tissue, therefore, low BMD in a tauopathy-specific mouse model that lacks Aβ pathology would provide evidence that central mechanisms of bone homeostasis are dysfunctional in AD, rather than only direct peripheral effects on bone tissue itself. Here, we present the first demonstration of an early, low BMD phenotype in a tauopathy-specific AD model, the htau mouse, and show evidence that this phenotype is associated with decreased markers of serotonin synthesis (i.e., the serotonin precursor enzyme tryptophan hydroxylase; TPH) and early evidence of ptau pathology in the DRN.
MATERIALS AND METHODS
Subjects
Sixteen htau mice (B6.Cg-Mapt tm1(GFP) Tg(MAPT)8cPdav/J strain (C57BL/6J background) obtained from Jackson Laboratories (stock #005491) were used in this study and were observed/measured from 2 to 6 months of age. htau mice have a targeted mutation of the endogenous mouse Mapt allele and insertion of a human Mapt transgene driven by tau promoter that results in the expression of all six isoforms of the mutant human microtubule associated protein tau (MAPT) in the absence of endogenous mouse MAPT [35]. htau mice show evidence of somatodendritic accumulation of hyperphosphorylated tau in the hippocampus and cortex by 3 months of age [35], with paired helical filament development and evidence of cognitive/behavioral deficits by 6–9 months [35, 36]. Sixteen age-matched C57BL/6J (C57) mice were used as the primary control groups; an additional group of 16 age-matched “tau null” (tau-/-) mice (littermates of the htau) that expressed no endogenous mouse MAPT nor the human MAPT transgene [36] were used for initial comparisons to determine the specificity of bone effects to our target model. Equal numbers of males and females (n = 8 per sex for each strain/genotype) were used to assess sex differences related to bone phenotype. To compare the developmental trajectory of BMD of these young mice with BMD of significantly aged mice, we also utilized a separate convenience sample of 12–14-month-old female and male C57 and htau (n = 5 per strain; 3 female, 2 male) for single (non-longitudinal) BMD measurements. An additional group of 4-5 month-old htau, tau-/- and C57 mice (n = 2 per strain per sex) were used for tissue harvesting to determine the presence of ptau pathology in bone regulatory brain regions at early ages. All strains of mice were obtained from Jackson Laboratories and were housed in the same room and conditions at the Northeast Ohio Medical University (NEOMED) Comparative Medicine Unit. All procedures using mice were approved in accordance with the NEOMED IACUC.
Dual X-ray absorptiometry (DEXA)
Mice received monthly BMD scans from 2–6 months of age using a Lunar PIXImus (GE Healthcare) DEXA scanner for in vivo use with small animals. DEXA is an accurate, high-throughput radiographic method for evaluating bone mineral density in live animals and can be employed in a longitudinal design taking multiple measurements of the same animal over time due to its low radiation exposure [37]. Before each DEXA scan, mice were weighed and anesthetized with 2.5% isoflurane via nose cone to provide immobilization for the duration of the 5-min scan. Mice were placed on the PIXImus scanner bed in the prone position, with the limbs and tail stretched away from the body, and scans were initiated using a cone beam X-ray source generating beams at 35 and 80 keV at 0.5 mA. After scans, animals were allowed to recover from anesthesia and were returned to their home cages. For the group of aged 12–14 month mice, scans were only performed once, but for all other mice in the study, one whole-body scan per animal was performed monthly for the duration of the study. PIXImus software (GE Healthcare/Lunar) was used to quantify whole body BMD (excluding the head; see explanation in Fig. 1 legend) and percent body fat. Targeted measurements of lumbar spine and femur were also conducted to determine whether different bone architectures (trabecular bone of the vertebrae versus cortical bone of the femur) reflected density differences as a function of experimental condition [16, 38]. Figure 1A displays an example of the DEXA output scan and measurements obtained with this procedure.
Western blotting for TPH and ptau
After mice completed the longitudinal bone density study (6 months of age), representative groups were euthanized by cervical dislocation under isoflurane anesthesia and fresh brain tissue samples were dissected and immediately frozen on dry ice and stored at –80°C until used. An additional cohort of 4-month-old htau, tau-/-, and C57 control mice (representing the age at which both female and male htau mice exhibited pronounced differences in skeletal phenotype) was also included for determination of ptau levels in the DRN. Tissue punches through the midbrain containing the dorsal raphe nucleus were placed on wet ice and 10 μl/ μg tissue of ice-cold 1x RIPA buffer containing complete protease inhibitor (Roche, Basel, Switzerland) and phosphatase inhibitors (Invitrogen, Carlsbad, CA) was added. Tissue was homogenized via sonification (20% amplitude for two, 2-s pulses) and centrifuged at 14,000 rpm for 20 min at 4°C. Total protein concentration was determined using BCA assay (Pierce, Rockford, IL).
Simple Western capillary-based analyses for TPH or ptau levels were performed using the Wes platform (ProteinSimple, Santa Clara, CA). Procedures were performed according to manufacturer protocol. Briefly, brain homogenate was diluted to 0.1 μg/ μl in 0.1x sample buffer and a fluorescent master mix (1 μl per 5 μl total volume) was added; the sample solutions and ladder were then placed in a thermocycler and heated to 95°C for 5 min and subsequently cooled to 4°C. The samples, blocking reagent, wash buffer, primary antibodies, secondary antibodies, and chemiluminescent substrate were dispensed into designated wells in the manufacturer provided microplate (ProteinSimple, PS-PP03). After plate loading, immunodetection steps were performed automatically with default instrument settings for a 25-cartridge, 12–230 kDa, size-based assay. Primary antibodies used were tryptophan hydroxylase (TPH2; rabbit, Millipore, AB1543P, 1:500), phosphorylated tau-202 (AT8- corresponding to phosphorylation at the serine 202 site; rabbit, Cell Signaling, #11834S, 1:75), and glyceraldehyde 3-phosphate dehydrogenase (GAPDH; rabbit, Sigma, G9545, 1:300) as the loading control. All antibodies were diluted with antibody diluent 2 (ProteinSimple, 042–195). Chemiluminescent signal obtained from each capillary, pertaining to a specific sample, was analyzed with Compass software (ProteinSimple v2.5). Chemiluminescent signal was normalized and reported as the ratio of the quantity of each protein of interest divided by GAPDH [39, 40].
Immunofluorescence
Separate cohorts of 4- and 6-month-old mice were euthanized with 120 mg/kg sodium pentobarbital (i.p.) and transcardially perfused with 4% paraformaldehyde/PBS. After post-fixation and cryoprotection, 50 μm coronal serial slices through the entire rostro-caudal extent of the DRN were taken using a freezing sliding microtome. Immunofluorescence assays were conducted as previously described [41] with modifications based on Xu et al. [42] that included performing the incubations at 37°C. Briefly, tissue was blocked in donkey serum for 30 min, incubated in primary antibodies for 1 h, received three 10-min washes in PBS, and was incubated in secondary antibody for 30 min followed by three 10-min washes in PBS. Tissue was mounted on slides and coverslipped with Fluoromount-G (Southern Biotech, Birmingham, AL). Primary antibodies were used against the following: TPH (sheep polyclonal; Millipore, #AB1541; 1:200) to label serotonergic neurons in the brainstem raphe nuclei, phospho-tau thr231 (AbFinity rabbit monoclonal; Life Technologies #701056; 1:400) with affinity for the 224–236 phosphorylation sites of human MAPT to label ptau in the raphe, and NeuN (Millipore, #MAB377; 1:500) as a general neuronal stain. Alexa Fluor-tagged secondary antibodies (Jackson Immunoresearch; West Grove, PA; 1:200) were used to visualize each marker. Brain sections were photographed on an Axio Imager M2 epifluorescence microscope with a digital high-resolution camera (AxioCam MRm), motorized stage, and an ApoTome-2 structured illumination module (Zeiss; Jena, Germany). Raphe nuclei were imaged under multiple channels to capture label from antibody staining. Multi-frame image montages were used to capture the entire dorsal-ventral extent of the region containing dorsal and median raphe nuclei with high resolution. Montaged tiles were stitched, z-stacked, flattened with the extended depth of focus module of the Zen microscope software, and converted to tiffs for analysis. Images from merged fluorescent channels were used to visually confirm co-label between ptau-231 and TPH-positive cells. Using Image-Pro Premier (Media Cybernetics; Rockville, MD), TPH-positive cells were auto-quantified in the DRN and median raphe nucleus (MRN) separately by thresholding sections and computing total cell counts for each region. The MRN was used for comparison because it contains serotonergic cell groups that do not project to bone regulatory brain regions such as the VMH and has not been implicated in central bone regulation. Co-label between ptau and TPH was assessed in the merged images of each fluorescent channel. DRN was also imaged on a Leica TCS SPE laser-scanning confocal microscope (Leica, Mannheim, Germany). Optical sections were reconstructed into 3-D volumes using the Leica Application Suite X software. Orthogonal representations were examined to confirm co-localization of ptau and TPH.
Statistical analysis
Statistical models were built and conducted separately for each sex as male mice are heavier and have larger skeletons ([16]; current data), and our target observations were between genotypes. We used multivariate analyses of variances (MANOVAs) to analyze differences between genotypes (htau, tau-/-, and C57) at 2, 3, 4, 5, and 6-month observation periods for each dependent variable measured (i.e., whole skeleton BMD, lumbar BMD, femur BMD, body weight). The MANOVA approach was selected as an alternative to a repeated measures design because these tests enabled us to directly contrast BMD measurements from htau mice with controls at each of the monthly measurement periods, while compensating for any sphericity violations in our data [43]. Significant main effects were followed up with univariate analyses and simple contrasts. Effect sizes were calculated and reported for each omnibus significant effect as partial eta2 (ηp2) which describes the percent of variance in group differences that can be accounted by the experimental manipulation [43]. In analyses that revealed significant weight differences between genotypes (i.e., male htau and C57), weight was entered as a covariate in a new MANCOVA (multivariate analysis of covariance) model to determine if body mass accounted for differences in BMD. Additional analyses examining percent body fat between genotypes were conducted with one-way ANOVAs and Bonferroni-adjustment post-hoc comparisons. Variables containing immunoblotting data and quantified immunohistochemical markers were analyzed for group differences with Student’s t-tests. For analyses where histological and protein variables did not differ between sexes, data were pooled across all mice within each genotype to increase statistical power.
RESULTS
Whole body skeletal BMD
Results for analyses on whole body skeletal BMD are illustrated in Fig. 1B and C. Our overall statistical model indicated that female htau and C57 mice differed in whole body skeletal BMD, F5,6 = 5.70, p = 0.03. This result had an extremely large effect size accounting for 83% of the variance between female htau and C57 BMD (ηp2 = 0.826). Simple contrasts indicated that female htau mice had significantly lower skeletal BMD than female C57 mice at 2 months (F1,10 = 6.69, p = 0.03), 3 months (F1,10 = 9.52, p = 0.01), 4 months (F1,10 = 7.67, p = 0.02), 5 months (F1,10 = 30.59, p < 0.01), and 6 months of age (F1,12 = 15.25, p < 0.01) (See Fig. 1B). The age of smallest significant difference in BMD (3-mo) to the age of largest difference (5-mo) represent ∼3–8% reductions in BMD relative to C57 controls. Female htau mice also had significantly lower skeletal densities than female tau-/- mice (F5,5 = 5.68, p = 0.04), specifically at 2 months (F1,9 = 12.48, p < 0.01), 3 months (F1,9 = 12.90, p < 0.01), and 5 months (F1,9 = 6.70, p < 0.05). Overall, these effects accounted for 85% of the variance between groups (ηp2 = 0.85).
Differences in skeletal BMD between genotype of male mice were also supported by our overall MANOVA model (F5,6 = 9.980, p < 0.01), accounting for over 89% of the variance in BMD between the two strains (ηp2 = 0.893), but presented a different pattern of results than was observed for female mice. Male htau skeletal BMD did not differ from C57 or tau-/- control BMD at the initial 2-month measurement (C57: p = 0.286, ns; tau-/-: p = 0.07, ns), but male htau mice exhibited significantly lower BMD than C57 mice at every subsequent measurement point from 3–6 months (htau versus C57:3 mo F1,10 = 9.73; 4 mo F = 27.22; 5-mo F = 27.61; 6-mo F = 34.80; all p values were < 0.01). Male htau mice had significantly lower skeletal densities than male tau-/- mice (F5,5 = 12.75, p < 0.01), and these differences were evident from 3–6 months with exception at the 5-month time point (Fig. 1C; 3 mo F1,9 = 47.44, p < 0.01; 4 mo F1,9 = 18.99, p < 0.01; 5-mo p = 0.464, ns; 6-mo F1,9 = 7.20, p < 0.05). In male htau mice, the age of smallest significant difference in BMD (4-mo) to the age of largest difference (5-mo) represent 5–9% reductions in BMD relative to C57 controls. Effect size determinations were extremely large, accounting for over 92% of the variance between htau and tau-/- BMD (ηp2 = 0.924).
Skeletal BMD of C57 mice and tau-/- control mice did not differ at any age for either sex, indicating that low bone mass phenotypes seen in htau mice are likely attributable to the expression of human tau isoforms, as tau-/- mice do not have either mouse or human MAPT. In light of this finding and the fact that tau-/- mice may exhibit unrelated deficits resulting from overall lack of MAPT [36], further analyses only report contrasts between htau and C57 data.
BMD projections in aged mice
Mean skeletal BMD of a separate (non-longitudinal) cohort of 12–14-month-old sex-matched htau and C57 mice were assessed and plotted in Fig. 1B and C. Statistical analyses on this data were not computed due to the small size of this convenience sample of aged mice, but we observed that mean skeletal BMD of all 12–14 month-old mice was decreased with respect to 6-month levels. This was anticipated as a natural function of aging; however, the extent of this bone loss was far greater in htau mice. Aged female and male C57 mice experienced 1.2–1.8% decreases (respectively) in skeletal BMD, whereas BMD losses of 2.8% were computed for female htau mice and 6.5% losses were shown in male htau. This finding is suggestive of greater severity of the skeletal phenotype in male htau mice.
Magnitude of low BMD phenotype in htau mice
Individual skeletal BMD measurements for htau and C57 mice are depicted in Fig. 2A at the representative ages of 2, 4, and 6 months. The distribution of individual measurements was examined to determine the magnitude of BMD reduction in htau mice to evaluate whether these effects were inconsequential phenotypic differences or whether they represented a clinically-significant deficit similar to osteoporosis. Criteria for categorizing BMD measurements as “osteoporotic” in the current study were based on the World Health Organization’s established definition of osteoporosis: BMD that is two standard deviations below the mean peak bone mass of healthy controls [44]. Age-related specificity was applied to these criteria in the current study in that values were computed independently for three benchmark ages: 2, 4, and 6 months by determining the mean and standard deviation of BMD scores from age and sex-matched C57 mice, and then subtracting two standard deviations from this value. The resulting difference was then used as the threshold value for an osteoporotic measurement. Thresholds and individual measurements are illustrated in Fig. 2A.
At 2 months of age, many female htau BMD measurements fell into the osteoporotic range, whereas only one male htau BMD measurement could be placed into this category. However, by 4 months of age, the majority of male htau BMD values fell within the osteoporotic range (along with the aggregated mean BMD of these animals). Only two female htau BMD measurements were categorized as osteoporotic at 4 months. By 6 months of age, all male htau BMD measurements and the majority of female htau BMDs could be categorized as osteoporotic. These findings indicate that while both female and male htau mice exhibited significantly lower BMD than controls, there were sex-based differences in how the magnitude of these deficits progressed, underscoring male htau vulnerability again.
BMD at individual bone compartments
BMD from two specific bone sites, femur and lumbar spine, were assessed for sensitivity in demonstrating group differences indicated by the whole skeletal BMD analyses. Femoral BMD did not differ between female htau and control mice (p > 0.05 in all cases, ns). Male htau mice had less dense femurs than C57 males at 4 (F2,21 = 10.11; p < 0.01) and 6 month measurements (F2,21 = 21.20, p < 0.01). Lumbar spine density reflected more consistent changes as a function of genotype. Among females, lumbar spine BMD was significantly lower in htau compared to C57 mice at 4 months of age (F2,12 = 6.26, p < 0.01), and although not statistically significant, this pattern of lower spine density in htau mice was exhibited at all other ages as well. Among males, lumbar spine density was significantly lower in htau mice compared to controls at 2 (F2,21 = 7.70), 3 (F2,21 = 16.12), and 6 (F2,21 = 27.79; p < 0.01 in all cases) months of age. Descriptive statistics for femur and lumbar spine densities are reported in Table 1.
Body weight
Female htau and C57 mice did not differ in body weight at any of the ages observed in the study (p = 0.115, ns), although C57 weights were observed to diverge from htau at 6 months of age (Fig. 2B). Male htau mice had significantly lower body mass than C57 males over the course of the study (F5,8 = 5.40, p < 0.05, ηp2 = 0.771). This difference was evident at 2 months of age (F1,12 = 6.57, p < 0.05)–before any significant differences in BMD were shown between htau and controls (refer back to Fig. 1B), as well as at 3 months (F1,12 = 24.69, p < 0.01), 4 months (F1,12 = 18.82, p < 0.01), and 5 months (F1,12 = 28.13, p < 0.01), but not at 6 months (p = 0.553, ns). To determine whether body mass was influencing differences in skeletal BMD between male htau and C57 mice, skeletal BMD analyses were re-run using body weight as a covariate. MANCOVA results indicated that weight was no significant covariate in this model, therefore, differences in body mass did not account for genotype-related differences in total skeletal BMD between male htau and C57 mice. Results for body mass are presented in Fig. 2B.
Body composition: Percent fat
All groups of mice began the study with similar body fat composition, and each group increased their percent body fat over the duration of the 4-month observation period (Fig. 2C). In females, percent body fat did not differ between htau and C57 mice at any observed age (p = 0.125, ns). However, male htau mice had significantly lower percent body fat than C57 males by the end of the study (F1,9 = 7.16, p < 0.05), suggesting a diminished rate of fat acquisition in this group of animals. Results are depicted in Fig. 2C.
Protein quantification of tryptophan hydroxylase and ptau in brainstem
Protein expression levels of TPH in brainstem samples of 6-month-old mice did not differ as a function of sex in either strain of mice (C57: t4 = 1.18, p = 0.87, ns; htau: t = 0.47, p = 0.66, ns), consistent with previous reports showing a lack of sex-based differences in rodent brainstem TPH expression [45]. When data were collapsed across sex for between genotype analyses, brainstem TPH levels were significantly lower in htau mice compared to C57 mice (t10 = 2.29, p < 0.05), representing a 23.8% reduction. These results are depicted in Fig. 3A.
To determine whether brain pathology was present in htau mice at the young ages that coincided with the emergence of a stable reduced BMD phenotype (4 months), we measured ptau-202 protein levels in brainstem raphe samples in all groups of mice (data are presented in Fig. 3B). Levels of ptau-202 were significantly higher in htau mouse samples compared to C57 (t6 = 3.753, p < 0.01) and tau-/- mice (t4 = 2.953, p < 0.05; readings were negligible in tau-/- as anticipated). Interestingly, when analyzing sex differences within genotype, ptau-202 levels were significantly higher in htau females compared to their males (t2 = 77.571, p < 0.001), while no sex differences were observed in C57 mice (t2 = 0.886, ns). Sex differences were not analyzed in the tau-/- strain because ptau values were already near the lowest limits of detection.
Immunohistochemistry
To analyze regional differences of serotonergic neurons in raphe nuclei, immunofluorescence was used to label TPH-positive cells in rostral serotonergic cell groups of the DRN and MRN (Fig. 3C) of 6-month-old mice. Sections containing both DRN and MRN were selected from where the decussation of the superior cerebellar peduncle was prominent and provided a landmark separating DRN from MRN [46]; Fig. 3C, bottom) and TPH-positive cell counts were compared by sex and genotype. While no significant sex differences in TPH-positive cell number were seen in either DRN (p = 0.318, ns) or MRN (p = 0.891, ns), both female C57 and htau mice appeared to trend towards slightly higher numbers (Fig. 3C, top). In data pooled across sex, htau mice had a 70.8% reduction in TPH-positive cells in the DRN compared to C57 mice (F1,10 = 23.13, p < 0.001; Fig. 3C, top). TPH-positive cell quantity did not differ in the MRN as function of genotype (p = 0.14, ns).
Confirming the protein results showing increased ptau levels in the DRN of 4-month-old htau mice, we demonstrated co-labeling of ptau-231 and TPH immunofluorescence in DRN cells of both female and male htau mice (Figs. 4, 5). As anticipated, staining for ptau was minimal in C57 and negligible in tau-/- controls despite robust TPH signal in both (Fig. 4, columns 1–3). When examining the MRN, there was weak ptau signal in htau mice but to a far lesser degree than was seen in the DRN, and ptau did not co-label with TPH cells consistently in the MRN (Fig. 4, column 4). Single confocal optical sections and orthogonal views of reconstructed 3-D volumes confirmed ptau localization in the somatodendritic compartment of TPH-positive cells (Fig. 5). Control optical sections from C57 and tau-/- DRN did not contain appreciable ptau immunoreactivity in TPH-positive or surrounding cells.
DISCUSSION
Low BMD and osteoporosis are clinical comorbidities of AD that are shown early in the progression of the disease and may even serve as predictive risk factors in some populations [16]. Here, we demonstrate evidence of an early low BMD phenotype in the htau mouse model of tauopathy that coincides with markers of incipient brain pathological changes–somatodendritic ptau–in bone regulatory brain regions. Our longitudinal bone density data show that BMD was reduced relative to age and sex-matched control mice early in the lifespan of htau mice (3 months of age), and was sustained through 6 months of age. Additionally, BMD assessed in a non-longitudinal cohort of 12–14-month-old mice showed that age-related bone loss was greater in htau mice–shown most severely in males of this strain. Similar studies have characterized skeletal phenotype in AD model mice with the Swedish APP gene mutation that produces Aβ-overexpression, and these reported that low BMD emerged in APPswe mice at 2 months [31] and in APP/PS1 mice at 9 months of age [30]. In the current study, htau BMD was reduced by approximately 3–9% of controls–comparable to estimated reductions in bone density/volume (5–11%) of APP/PS1 mice [30].
The majority of mice used in this study were young animals in the anabolic phases of skeletal growth as indicated by increasing linear trajectories in BMD from 2–6 months of age (illustrated in Fig. 1B, C), therefore, we did not observe absolute bone loss in these mice during this observation period, rather failures in their ability to accrue peak BMD levels. Failure to obtain peak bone density during growth can also be explained by a similar shift in the bone formation/resorption balance that contributes to the overt loss of bone experienced by aged animals when skeletal remodeling is dysregulated [47]. While the current study did not determine whether the htau skeleton was more fragile as a result of suboptimal BMD, an association between compromised bone health, microarchitectural defects, and low BMD was reported in young APP/PS1 mice [30]. Additionally, suboptimal BMD in young rodents has been associated with osteoporotic fragility in other non-AD model rodent strains [38, 44]. Furthermore, when analyzing mice at ages where natural loss of bone mineral occurs (12–14 months), we observed that htau mice appeared to experience continued compromise of their skeletal health, with greater bone loss than controls from 6 to 12 + months of age.
Our findings also illustrate the dichotomy between females and males in AD risk [48] but in a contrary way to what was anticipated. While both young female and male htau mice had low BMD relative to controls, this effect was exacerbated in males. Interestingly, male htau mice began the study with comparable BMD to controls, but failed to match the peak bone density levels of C57 mice as time progressed, demonstrating what would be considered uniformly osteoporotic BMD measurements by 6-months of age. In the 12–14 month-old follow-up cohort, aged male htau mice showed a greater percent of bone loss after 6-months of age compared to all other mice. Male htau mice also demonstrated suboptimal gains in body fat composition over the study, suggestive of metabolic or energetic differences [49].
Postmenopausal women are disproportionately affected by AD [48] and osteoporosis independent from AD [50], as reductions in circulating estrogens have been associated with increased vulnerability to these diseases [51]. Estrogen is neuroprotective against AD-related pathological changes [52–54] and promotes formation and homeostasis of bone [30]. Young female htau mice used in this study were at the peak age of reproductive activity, and it is possible that their skeletons may have been afforded some (but not total) protection by their high circulating estrogen levels. This is interesting in light of our findings of elevated brainstem ptau presence in female htau, yet universally decreased TPH levels in both sexes. This may suggest that estrogenic protection on bone may have occurred independent of the central bone regulatory mechanism. However, the role of reproductive steroids on pathological changes in htau mice remains to be investigated.
Since htau mice do not accumulate Aβ as do other AD transgenic models [35], and tau is an axonal cytoskeletal protein specific to the CNS, evidence of low BMD in this strain may be indicative of neural pathology in brain structures regulating adult bone homeostasis rather than pathology originating from the periphery in bone tissue itself, as has been reported in mouse models that overexpress Aβ [31, 32]. We showed increased presence of phosphorylated tau (at both serine 202 and threonine 231 sites) in the DRN of 4-month-old htau mice that was directly associated with serotonin-producing neurons in this brain area. Evidence of selective dysfunction in the central serotonergic system of htau mice was supported by decreased brainstem TPH protein levels and a very large reduction in the number of TPH-positive cells in DRN with no measurable changes in MRN. This is an important distinction because the MRN is a serotonergic region that does not project to the ventromedial hypothalamus or participate in the bone regulatory pathway [55, 56]. Additionally, the remaining TPH+ cells in the htau DRN often exhibited somatodendritic accumulations of ptau–a finding that was also not ubiquitous in the MRN.
Depletion of serotonin has been indicated as an early pathological change in both animal models of AD and within the disease itself [28, 57]. Serotonergic deficits induced by exposure to environmental stressors have been shown to facilitate the formation of AD pathology in rodent models by inducing APP cleavage [58], tau misfolding and aggregation [59], and tau hyperphosphorylation [60, 61]. Abnormal increases in activity of the serotonergic 2C (5-HT2C) receptor, a negative regulator of serotonin production, induce tau phosphorylation in both AD and non-disease mouse models [61], with additional studies showing that these effects can be ameliorated through pharmacological manipulation that restored serotonin function [62, 63]. 5-HT2C receptors play a critical role in the central bone regulatory pathway [21], and these findings linking 5-HTC2 receptor dysfunction to decreased serotonin and increased pathological markers of AD suggest that selective manipulation of this receptor may be an intriguing new tool for investigating the relationship between serotonin deficiency and ptau pathogenesis.
Early therapeutic intervention in AD has been posited as the best opportunity for slowing the neurodegenerative process, and this strategy necessitates finding early biomarkers of AD risk. In light of accumulating evidence on skeletal changes in AD, bone density screenings may provide a non-invasive, low-cost method for assessing bone health that, when considered along with classic risk factors and/or prodromal symptoms of AD, could better help identify patients at risk for developing dementia. Further studies are needed to assess the predictive utility of bone loss in neurodegenerative disease and to investigate mechanisms that define a specific, causal relationship between low BMD, serotonin, and central pathology in AD.
ACKNOWLEDGMENTS
The authors would like to thank Adam Schuller and Albert Manudane for help with immunohistochemical data collection and Samuel D. Crish and Jason R. Richardson for assistance in preparation of the manuscript. This research was supported by institutional funds provided to C.M.D.C.
Authors’ disclosures available online (http://j-alz.com/manuscript-disclosures/16-0658r1).
REFERENCES
[1] | Mann DMA ((1983) ) The locus coeruleus and its possible role in ageing and degenerative disease of the human central nervous system. Mech Ageing Dev 23: , 73–94. |
[2] | Bennett S , Thomas AJ ((2014) ) Depression and dementia: Cause, consequence or coincidence? Maturitas 79: , 184–190. |
[3] | Hertz L ((1989) ) Is Alzheimer’s disease an anterograde degeneration, originating in the brainstem, and disrupting metabolic and functional interactions between neurons and glial cells? Brain Res Rev 14: , 335–353. |
[4] | Aletrino MA , Vogels OJ , Van Domburg PH , Ten Donkelaar HJ ((1992) ) Cell loss in the nucleus raphes dorsalis in Alzheimer’s disease. Neurobiol Aging 13: , 461–468. |
[5] | Rüb U , Del Tredici K , Schultz C , Thal DR , Braak E , Braak H ((2000) ) The evolution of Alzheimer’s disease-related cytoskeletal pathology in the human raphe nuclei. Neuropathol Appl Neurobiol 26: , 553–567. |
[6] | Melton LJ , Beard CM , Kokmen E , Atkinson EJ , O’Fallon WM ((1994) ) Fracture risk in patients with Alzheimer’s disease. J Am Geriatr Soc 42: , 614–619. |
[7] | Sato Y , Kanoko T , Satoh K , Iwamoto J ((2004) ) Risk factors for hip fracture among elderly patients with Alzheimer’s disease. J Neurol Sci 223: , 107–112. |
[8] | Johansson C , Skoog I ((1996) ) A population-based study on the association between dementia and hip fractures in 85-year olds. Aging (Milano) 8: , 189–196. |
[9] | Looker AC , Borrud LG , Dawson-Hughes B , Shepherd JA , Wright NC ((2012) ) Osteoporosis or low bone mass at the femur neck or lumbar spine in older adults: United States, 2005-2008. NCHS Data Brief 1–8. |
[10] | Weller I , Schatzker J ((2004) ) Hip fractures and Alzheimer’s disease in elderly institutionalized Canadians. Ann Epidemiol 14: , 319–324. |
[11] | Loskutova N , Honea RA , Vidoni ED , Brooks WM , Burns JM ((2009) ) Bone density and brain atrophy in early Alzheimer’s disease. J Alzheimers Dis 18: , 777–785. |
[12] | Loskutova N , Honea RA , Brooks WM , Burns JM ((2010) ) Reduced limbic and hypothalamic volumes correlate with bone density in early Alzheimer’s disease. J Alzheimers Dis 20: , 313–322. |
[13] | Zhao Y , Shen L , Ji H-F ((2012) ) Alzheimer’s disease and risk of hip fracture: A meta-analysis study. ScientificWorldJournal 2012: , 872173. |
[14] | Zhou R , Deng J , Zhang M , Zhou H-D , Wang Y-J ((2011) ) Association between bone mineral density and the risk of Alzheimer’s disease. J Alzheimers Dis 24: , 101–108. |
[15] | Tamimi I , Ojea T , Sanchez-Siles JM , Rojas F , Martin I , Gormaz I , Perez A , Dawid-Milner MS , Mendez L , Tamimi F ((2012) ) Acetylcholinesterase inhibitors and the risk of hip fracture in alzheimer’s disease patients: A case-control study. J Bone Miner Res 27: , 1518–1527. |
[16] | Tan ZS , Seshadri S , Beiser A , Zhang Y , Felson D , Hannan MT , Au R , Wolf PA , Kiel DP ((2005) ) Bone mineral density and the risk of alzheimer disease. Arch Neurol 62: , 107–111. |
[17] | Jay TR , Miller CM , Cheng PJ , Graham LC , Bemiller S , Broihier ML , Xu G , Margevicius D , Karlo JC , Sousa GL , Cotleur AC , Butovsky O , Bekris L , Staugaitis SM , Leverenz JB , Pimplikar SW , Landreth GE , Howell GR , Ransohoff RM , Lamb BT ((2015) ) TREM2 deficiency eliminates TREM2+inflammatory macrophages and ameliorates pathology in Alzheimer’s disease mouse models. J Exp Med 212: , 287–295. |
[18] | Otero K , Shinohara M , Zhao H , Cella M , Gilfillan S , Colucci A , Faccio R , Ross FP , Teitelbaum SL , Takayanagi H , Colonna M ((2012) ) TREM2 and β-catenin regulate bone homeostasis by controlling the rate of osteoclastogenesis. J Immunol 188: , 2612–2621. |
[19] | Guerreiro R , Wojtas A , Bras J , Carrasquillo M , Rogaeva E , Majounie E , Cruchaga C , Sassi C , Kauwe JSK , Younkin S , Hazrati L , Collinge J , Pocock J , Lashley T , Williams J , Lambert J-C , Amouyel P , Goate A , Rademakers R , Morgan K , Powell J , St George-Hyslop P , Singleton A , Hardy J , Alzheimer Genetic Analysis Group ((2013) ) TREM2 variants in Alzheimer’s disease. N Engl J Med 368: , 117–127. |
[20] | Bird TD , Koerker RM , Leaird BJ , Vlcek BW , Thorning DR ((1983) ) Lipomembranous polycystic osteodysplasia (brain, bone, and fat disease): A genetic cause of presenile dementia. Neurology 33: , 81–86. |
[21] | Yadav VK , Oury F , Suda N , Liu Z-W , Gao X-B , Confavreux C , Klemenhagen KC , Tanaka KF , Gingrich JA , Guo XE , Tecott LH , Mann JJ , Hen R , Horvath TL , Karsenty G ((2009) ) A serotonin-dependent mechanism explains the leptin regulation of bone mass, appetite, and energy expenditure. Cell 138: , 976–989. |
[22] | Oury F , Yadav VK , Wang Y , Zhou B , Liu XS , Guo XE , Tecott LH , Schutz G , Means AR , Karsenty G ((2010) ) CREB mediates brain serotonin regulation of bone mass through its expression in ventromedial hypothalamic neurons. Genes Dev 24: , 2330–2342. |
[23] | Bajayo A , Bar A , Denes A , Bachar M , Kram V , Attar-Namdar M , Zallone A , Kovács KJ , Yirmiya R , Bab I ((2012) ) Skeletal parasympathetic innervation communicates central IL-1 signals regulating bone mass accrual. Proc Natl Acad Sci U S A 109: , 15455–15460. |
[24] | Shi Y , Oury F , Yadav VK , Wess J , Liu XS , Guo XE , Murshed M , Karsenty G ((2010) ) Signaling through the M3 muscarinic receptor favors bone mass accrual by decreasing sympathetic activity. Cell Metab 11: , 231–238. |
[25] | Takeda S , Elefteriou F , Levasseur R , Liu X , Zhao L , Parker KL , Armstrong D , Ducy P , Karsenty G ((2002) ) Leptin regulates bone formation via the sympathetic nervous system. Cell 111: , 305–317. |
[26] | Calarge CA , Butcher BD , Burns TL , Coryell WH , Schlechte JA , Zemel BS ((2014) ) Major depressive disorder and bone mass in adolescents and young adults. J Bone Miner Res 29: , 2230–2237. |
[27] | Braak H , Del Tredici K ((2011) ) The pathological process underlying Alzheimer’s disease in individuals under thirty. Acta Neuropathol 121: , 171–181. |
[28] | Grinberg LT , Rüb U , Ferretti REL , Nitrini R , Farfel JM , Polichiso L , Gierga K , Jacob-Filho W , Heinsen H , Brazilian Brain Bank Study Group ((2009) ) The dorsal raphe nucleus shows phospho-tau neurofibrillary changes before the transentorhinal region in Alzheimer’s disease. A precocious onset? Neuropathol Appl Neurobiol 35: , 406–416. |
[29] | Braak H , Braak E ((1991) ) Neuropathological stageing of Alzheimer-related changes. Acta Neuropathol 82: , 239–259. |
[30] | Yang MW , Wang TH , Yan PP , Chu LW , Yu J , Gao Z Da , Li YZ , Guo BL ((2011) ) Curcumin improves bone microarchitecture and enhances mineral density in APP/PS1 transgenic mice. Phytomedicine 18: , 205–213. |
[31] | Cui S , Xiong F , Hong Y , Jung J-U , Li X-S , Liu J-Z , Yan R , Mei L , Feng X , Xiong W-C ((2011) ) APPswe/Aβ regulation of osteoclast activation and RAGE expression in an age-dependent manner. J Bone Miner Res 26: , 1084–1098. |
[32] | Xia W-F , Jung J-U , Shun C , Xiong S , Xiong L , Shi X-M , Mei L , Xiong W-C ((2013) ) Swedish mutant APP suppresses osteoblast differentiation and causes osteoporotic deficit, which are ameliorated by N-acetyl-L-cysteine. J Bone Miner Res 28: , 2122–2135. |
[33] | Peng Y , Liu J , Tang Y , Liu J , Han T , Han S , Li H , Hou C , Liu J , Long J ((2014) ) High-fat-diet-induced weight gain ameliorates bone loss without exacerbating AβPP processing and cognition in female APP/PS1 mice. Front Cell Neurosci 8: , 225. |
[34] | Li S , Liu B , Zhang L , Rong L ((2014) ) Amyloid beta peptide is elevated in osteoporotic bone tissues and enhances osteoclast function. Bone 61: , 164–175. |
[35] | Andorfer C , Kress Y , Espinoza M , de Silva R , Tucker KL , Barde Y-A , Duff K , Davies P ((2003) ) Hyperphosphorylation and aggregation of tau in mice expressing normal human tau isoforms. J Neurochem 86: , 582–590. |
[36] | Geiszler PC , Barron MR , Pardon M-C ((2016) ) Impaired burrowing is the most prominent behavioral deficit of aging htau mice. Neuroscience 329: , 98–111. |
[37] | Fuchs H , Gau C , Hans W , Gailus-Durner V , Hrabě de Angelis M ((2013) ) Long-term experiment to study the development, interaction, and influencing factors of DEXA parameters. Mamm Genome 24: , 376–388. |
[38] | Lelovas PP , Xanthos TT , Thoma SE , Lyritis GP , Dontas IA ((2008) ) The laboratory rat as an animal model for osteoporosis research. Comp Med 58: , 424–430. |
[39] | Creamer JS , Oborny NJ , Lunte SM ((2014) ) Recent advances in the analysis of therapeutic proteins by capillary and microchip electrophoresis. Anal Methods 6: , 5427–5449. |
[40] | Beccano-Kelly DA , Kuhlmann N , Tatarnikov I , Volta M , Munsie LN , Chou P , Cao L-P , Han H , Tapia L , Farrer MJ , Milnerwood AJ ((2014) ) Synaptic function is modulated by LRRK2 and glutamate release is increased in cortical neurons of G2019S LRRK2 knock-in mice. Front Cell Neurosci 8: , 301. |
[41] | Dengler-Crish CM , Smith MA , Inman DM , Wilson GN , Young JW , Crish SD ((2014) ) Anterograde transport blockade precedes deficits in retrograde transport in the visual projection of the DBA/2J mouse model of glaucom. Front Neurosci 8: , 1–12. |
[42] | Xu L-R , Liu X-L , Chen J , Liang Y ((2013) ) Protein disulfide isomerase interacts with tau protein and inhibits its fibrillization. PLoS One 8: , e76657. |
[43] | Warner R ((2013) ) Applied Statistics: From Bivariate Through Multivariate Techniques, SAGE Publications, Thousand Oaks, CA. |
[44] | Beamer WG , Donahue LR , Rosen CJ , Baylink DJ ((1996) ) Genetic variability in adult bone density among inbred strains of mice. Bone 18: , 397–403. |
[45] | Kunimura Y , Iwata K , Iijima N , Kobayashi M , Ozawa H ((2015) ) Effect of sex steroid hormones on the number of serotonergic neurons in rat dorsal raphe nucleus. Neurosci Lett 594: , 127–132. |
[46] | Franklin BJ PG ((2007) ), The mouse brain in stereotaxic coordinates, Academic Press, New York. |
[47] | Watanabe K , Hishiya A ((2005) ) Mouse models of senile osteoporosis. Mol Aspects Med 26: , 221–231. |
[48] | Barnes LL , Wilson RS , Bienias JL , Schneider JA , Evans DA , Bennett DA ((2005) ) Sex differences in the clinical manifestations of Alzheimer disease pathology. Arch Gen Psychiatry 62: , 685–691. |
[49] | Ishii M , Wang G , Racchumi G , Dyke JP , Iadecola C ((2014) ) Transgenic mice overexpressing amyloid precursor protein exhibit early metabolic deficits and a pathologically low leptin state associated with hypothalamic dysfunction in arcuate neuropeptide Y neurons. J Neurosci 34: , 9096–9106. |
[50] | Almeida M , Iyer S , Martin-Millan M , Bartell SM , Han L , Ambrogini E , Onal M , Xiong J , Weinstein RS , Jilka RL , O’Brien CA , Manolagas SC ((2013) ) Estrogen receptor-alpha signaling in osteoblast progenitors stimulates cortical bone accrual. J Clin Invest 123: , 394–404. |
[51] | Viña J , Lloret A ((2010) ) Why women have more Alzheimer’s disease than men: Gender and mitochondrial toxicity of amyloid-beta peptide. J Alzheimers Dis 20: (Suppl 2), S527–S533. |
[52] | Udrisar DP , Wanderley MI , Porto RCC , Cardoso CLP , Barbosa MCL , Camberos MC , Cresto JC ((2005) ) Androgen- and estrogen-dependent regulation of insulin-degrading enzyme in subcellular fractions of rat prostate and uterus. Exp Biol Med (Maywood) 230: , 479–486. |
[53] | Barreto GE , Santos-Galindo M , Garcia-Segura LM ((2014) ) Selective estrogen receptor modulators regulate reactive microglia after penetrating brain injury. Front Aging Neurosci 6: , 132. |
[54] | Lei D-L , Long JM , Hengemihle J , O’Neill J , Manaye KF , Ingram DK , Mouton PR ((2003) ) Effects of estrogen and raloxifene on neuroglia number and morphology in the hippocampus of aged female mice. Neuroscience 121: , 659–666. |
[55] | Kanno K , Shima S , Ishida Y , Yamanouchi K ((2008) ) Ipsilateral and contralateral serotonergic projections from dorsal and median raphe nuclei to the forebrain in rats: Immunofluorescence quantitative analysis. Neurosci Res 61: , 207–218. |
[56] | Vertes RP , Fortin WJ , Crane AM ((1999) ) Projections of the median raphe nucleus in the rat. J Comp Neurol 407: , 555–582. |
[57] | Simic G , Stanic G , Mladinov M , Jovanov-Milosevic N , Kostovic I , Hof PR ((2009) ) Does Alzheimer’s disease begin in the brainstem?: Annotation. Neuropathol Appl Neurobiol 35: , 532–554. |
[58] | Baglietto-Vargas D , Chen Y , Suh D , Ager RR , Rodriguez-Ortiz CJ , Medeiros R , Myczek K , Green KN , Baram TZ , LaFerla FM ((2015) ) Short-term modern life-like stress exacerbates Aβ-pathology and synapse loss in 3xTg-AD mice. J Neurochem 134: , 915–926. |
[59] | Sotiropoulos I , Silva J , Kimura T , Rodrigues AJ , Costa P , Almeida OFX , Sousa N , Takashima A ((2015) ) Female hippocampus vulnerability to environmental stress, a precipitating factor in tau aggregation pathology. J Alzheimers Dis 43: , 763–774. |
[60] | Li X , Zhu W , Roh M-S , Friedman AB , Rosborough K , Jope RS ((2004) ) In vivo regulation of glycogen synthase kinase-3beta (GSK3beta) by serotonergic activity in mouse brain. Neuropsychopharmacology 29: , 1426–1431. |
[61] | Ramos-Rodriguez JJ , Molina-Gil S , Rey-Brea R , Berrocoso E , Garcia-Alloza M ((2013) ) Specific serotonergic denervation affects tau pathology and cognition without altering senile plaques deposition in APP/PS1 mice. PLoS One 8: , e79947. |
[62] | Mongeau R , Martin CBP , Chevarin C , Maldonado R , Hamon M , Robledo P , Lanfumey L ((2010) ) 5-HT2C receptor activation prevents stress-induced enhancement of brain 5-HT turnover and extracellular levels in the mouse brain: Modulation by chronicaroxetine treatment. J Neurochem 115: , 438–449. |
[63] | Martin CB , Martin VS , Trigo JM , Chevarin C , Maldonado R , Fink LH , Cunningham KA , Hamon M , Lanfumey L , Mongeau R ((2015) ) 5-HT2C receptor desensitization moderates anxiety in 5-HTT deficient mice: From behavioral to cellular evidence. Int J Neuropsychopharmacol 18: , pyu056. |
Figures and Tables
Fig.1
Skeletal bone mineral density (BMD) is reduced in htau mice compared to controls and is influenced by sex differences. A) DEXA scan of a mouse identifying regions of interest for which BMD was measured. Whole body tracing indicates the total skeletal region sampled in whole-body measurements. Rectangles highlight two regions of interest, the lumbar spine and femur, for which specific BMD measurements were also obtained. The oval surrounding the skull indicates that this area was excluded from analysis which is standard procedure in whole body densitometry due to distortions produced by skull density. Scans were obtained using a Lunar PixiMUS bone densitometer and associated Lunar software (GE Healthcare). B) Mean whole-body skeletal BMD of female htau (circle) mice is significantly lower than female C57 (triangle) mice from 2–6 months of age (indicated by *). Skeletal BMD also differs between female htau and tau-/- (inverted triangle) mice at 2, 3, and 5 months of age (indicated by #). Extrapolation points for 12 + months of age are the mean skeletal BMD of a non-longitudinal sample of aged htau and C57 female mice (n = 3/per strain) that are plotted for reference. C) Whole body skeletal BMD of male htau mice does not differ from controls at 2 months, but is significantly lower than C57 males beginning at 3 months and for the duration of the study (indicated by *). Male htau BMD is also lower than male tau-/- BMD at 3, 4, and 6 months of age. Extrapolation points for 12 + months of age are the mean skeletal BMD of a non-longitudinal sample of aged htau and C57 male mice (n = 2/per strain) that are plotted for reference. For panels B&C, mean skeletal BMD values from 2–6 months were derived from 8 mice per genotype per sex (total n = 48 mice). Error bars depict standard error of the mean. No statistical analyses were performed on 12 + month extrapolation samples due to small n.
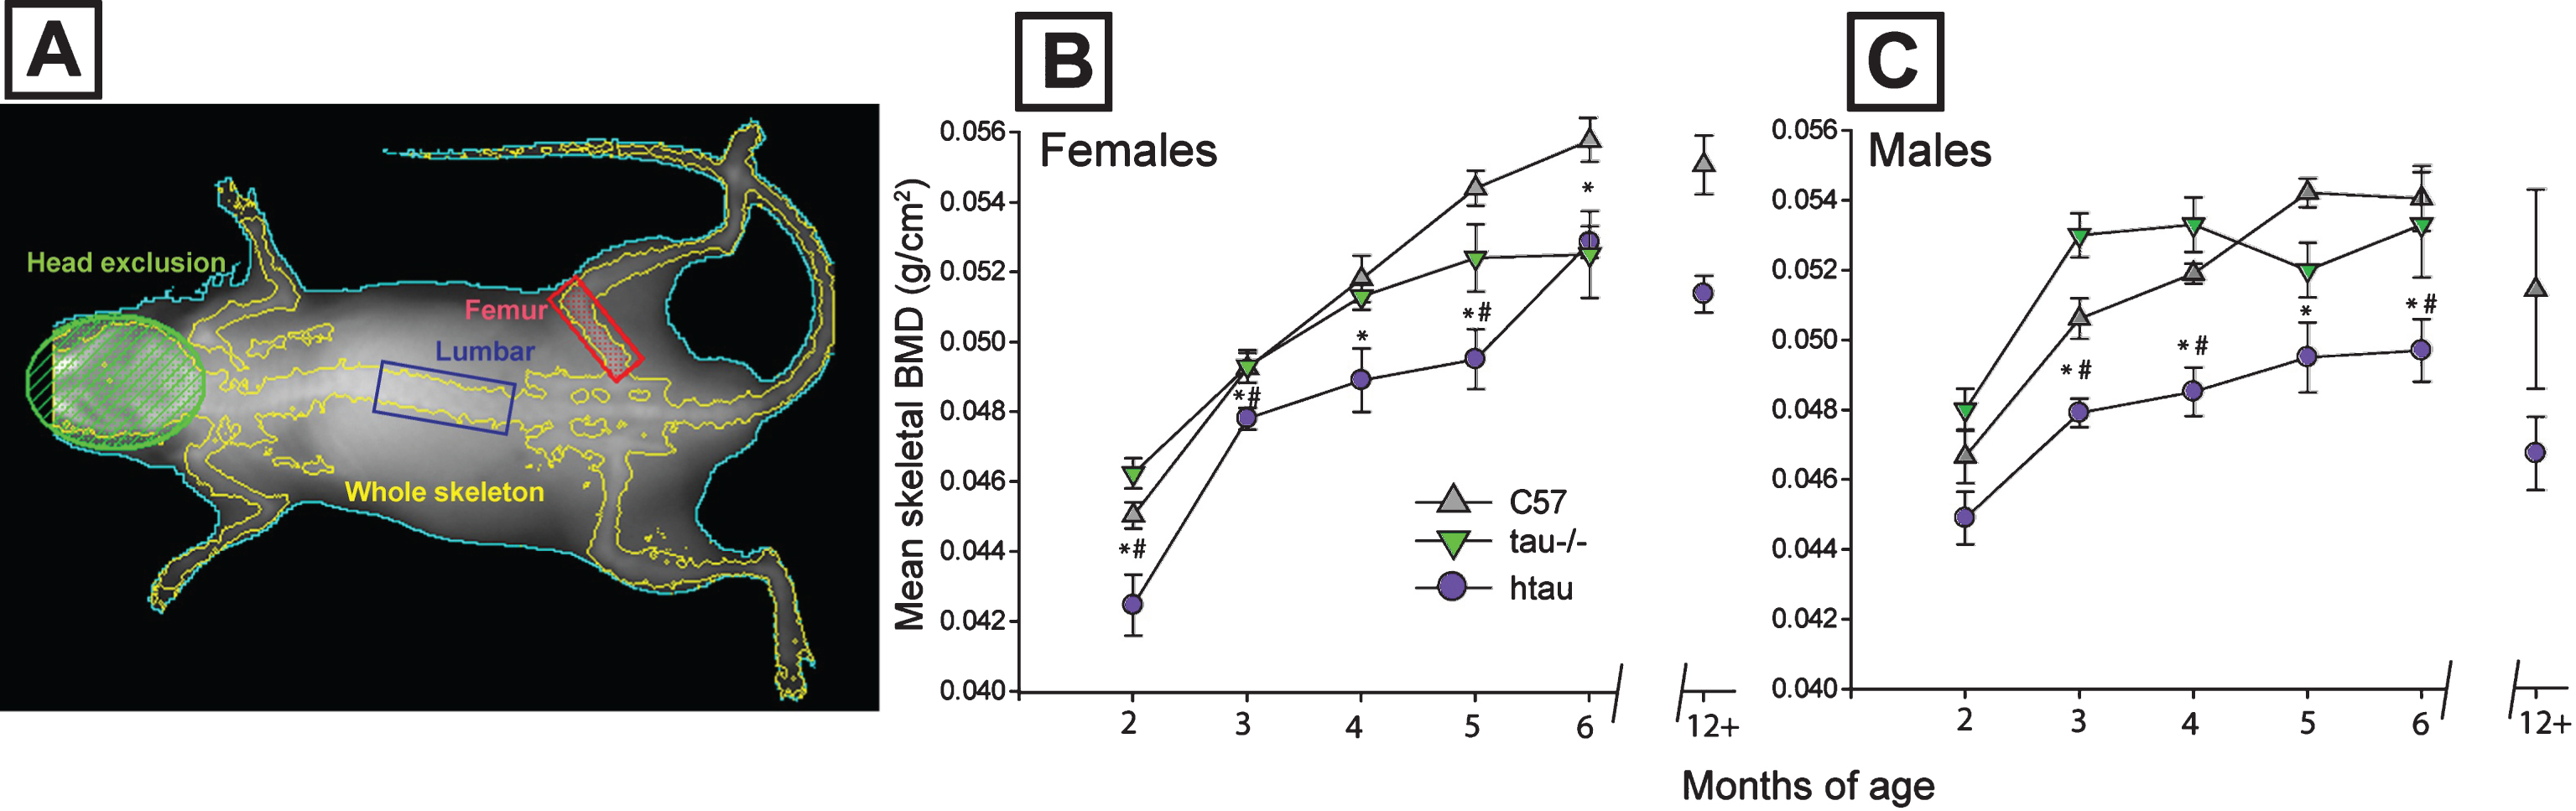
Fig.2
Magnitude of skeletal BMD reduction in htau mice and body weight differences between genotypes. A) Distribution of individual skeletal bone mineral density (BMD) measurements for C57 and htau mice across representative ages. Female whole body BMD data are depicted with dots; male data are depicted with inverted triangles; n = 8/gender/genotype. Top panel: At 2-months of age, half of female htau BMDs are sufficiently low enough to fall with an osteoporotic range (blue shaded bar area) whereas only 1 male htau case meets this criterion. Middle panel: By 4 months of age, fewer female htau BMDs meet osteoporotic criteria, but the majority of male htau BMD values fall within this osteoporotic range. Bottom panel: By 6 months of age, all male htau BMDs are sufficiently low enough to fall within the osteoporotic range. The majority of female htau mice also meet these criteria. Group means for each genotype within each gender are shown with a black bar. Osteoporotic range was defined as BMD values that were more than two standard deviations below the average BMD of C57 mice at each respective time point for each sex. B) Body weight and composition for htau and C57 mice. Top: Mean body weight does not differ between htau and C57 females at any age of the study. Bottom: Male htau mice weigh significantly less than male C57 mice from 2–5 months of age. C) Top: Percent body fat increases from the beginning to end of the 4-month study at the same rates for both htau (lighter bar) and C57 (darker bar) females. Bottom: Both male htau (lighter bar) and C57 (darker bar) might experience increases in percent body fat over the duration of the 4-month study, but male htau mice fail to gain as much body fat as controls by the end of the observation period and display significantly decreased body fat composition compared to C57 males. Asterisks indicate statistical significance of p < 0.05. Error bars on all figures represent standard error of the mean.
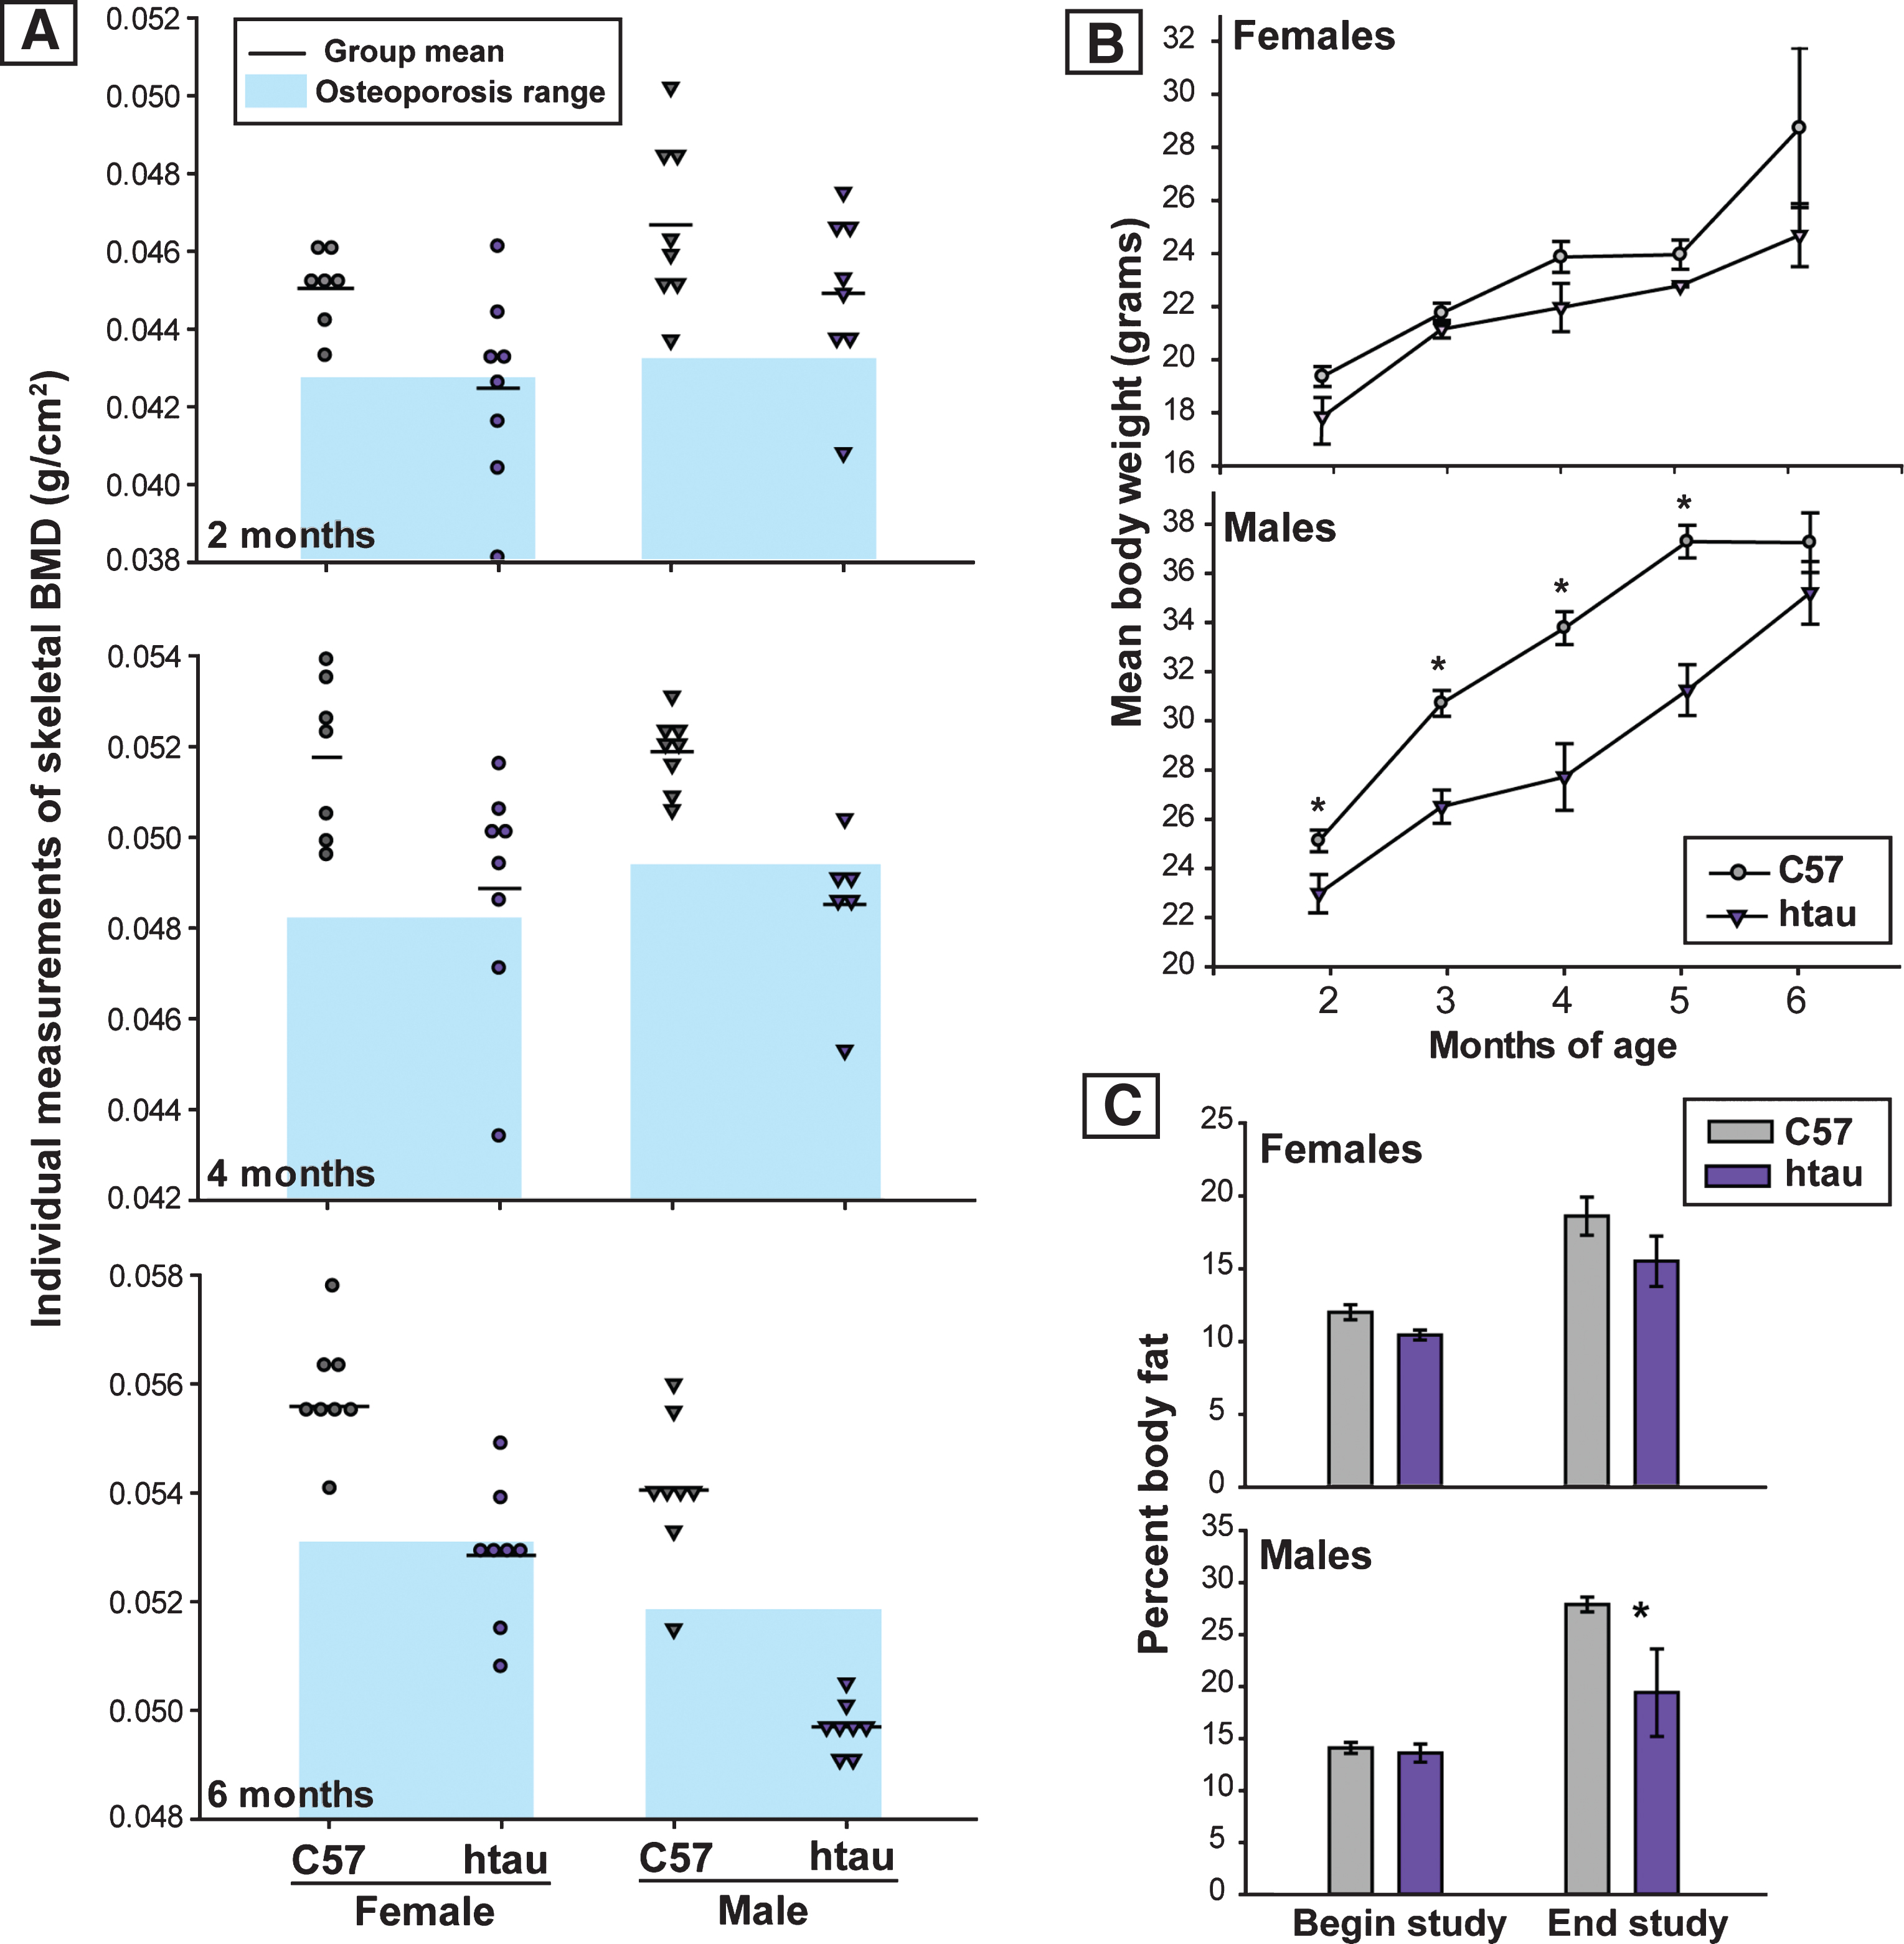
Fig.3
Reduction in TPH and evidence of increased ptau in brainstem raphe nuclei of htau mice. A) Tryptophan hydroxylase (TPH) protein levels in brainstem of 6-month-old htau and C57 mice as measured by Simple Western. TPH protein levels in brainstem of htau mice are significantly reduced from C57 control levels (p < 0.05). There were no differences in TPH protein levels between sexes, so data were pooled across sex within each genotype for analysis (n = 6/genotype). Bar graph depicts quantified chemiluminescence of TPH as normalized to the loading control GAPDH; error bars show standard error of the mean. Blot data are shown below the bar graph for female (♀) and male (♂) of each genotype for TPH as compared to loading control (GAPDH). B) ptau (ser202) levels in brainstem of 4-month-old htau, C57, and tau-/- mice. ptau levels are significantly elevated in htau mice compared to controls (p < 0.05). Female htau mice exhibit significantly more ptau in brainstem nuclei than their male counterparts (p < 0.05). Measurements of ptau-202 in tau-/- samples were negligible and served as a negative control–sex differences were not assessed in this strain due to these levels. C) Bar graph: Quantification of TPH+ cells in the brainstem raphe show a significant decrease in TPH+ cells in dorsal raphe nucleus (DRN) of 6-month-old htau mice (* indicates p < 0.05). TPH cell counts in MRN did not differ as a function of strain or sex. Micrographs: Representative brainstem sections containing immunofluorescent labeling for TPH in 6-month-old C57 and htau mice. Note the large reduction in TPH-immunoreactivity in the htau DRN but not the MRN. Outlines provide anatomical reference for DRN, MRN, and the superior cerebellar decussation (decuss) that separates the two raphe nuclei at this plane of section. Other landmarks include cerebral aqueduct (aq) and periaqueductal grey (PAG).Scale bar = 200 μm.
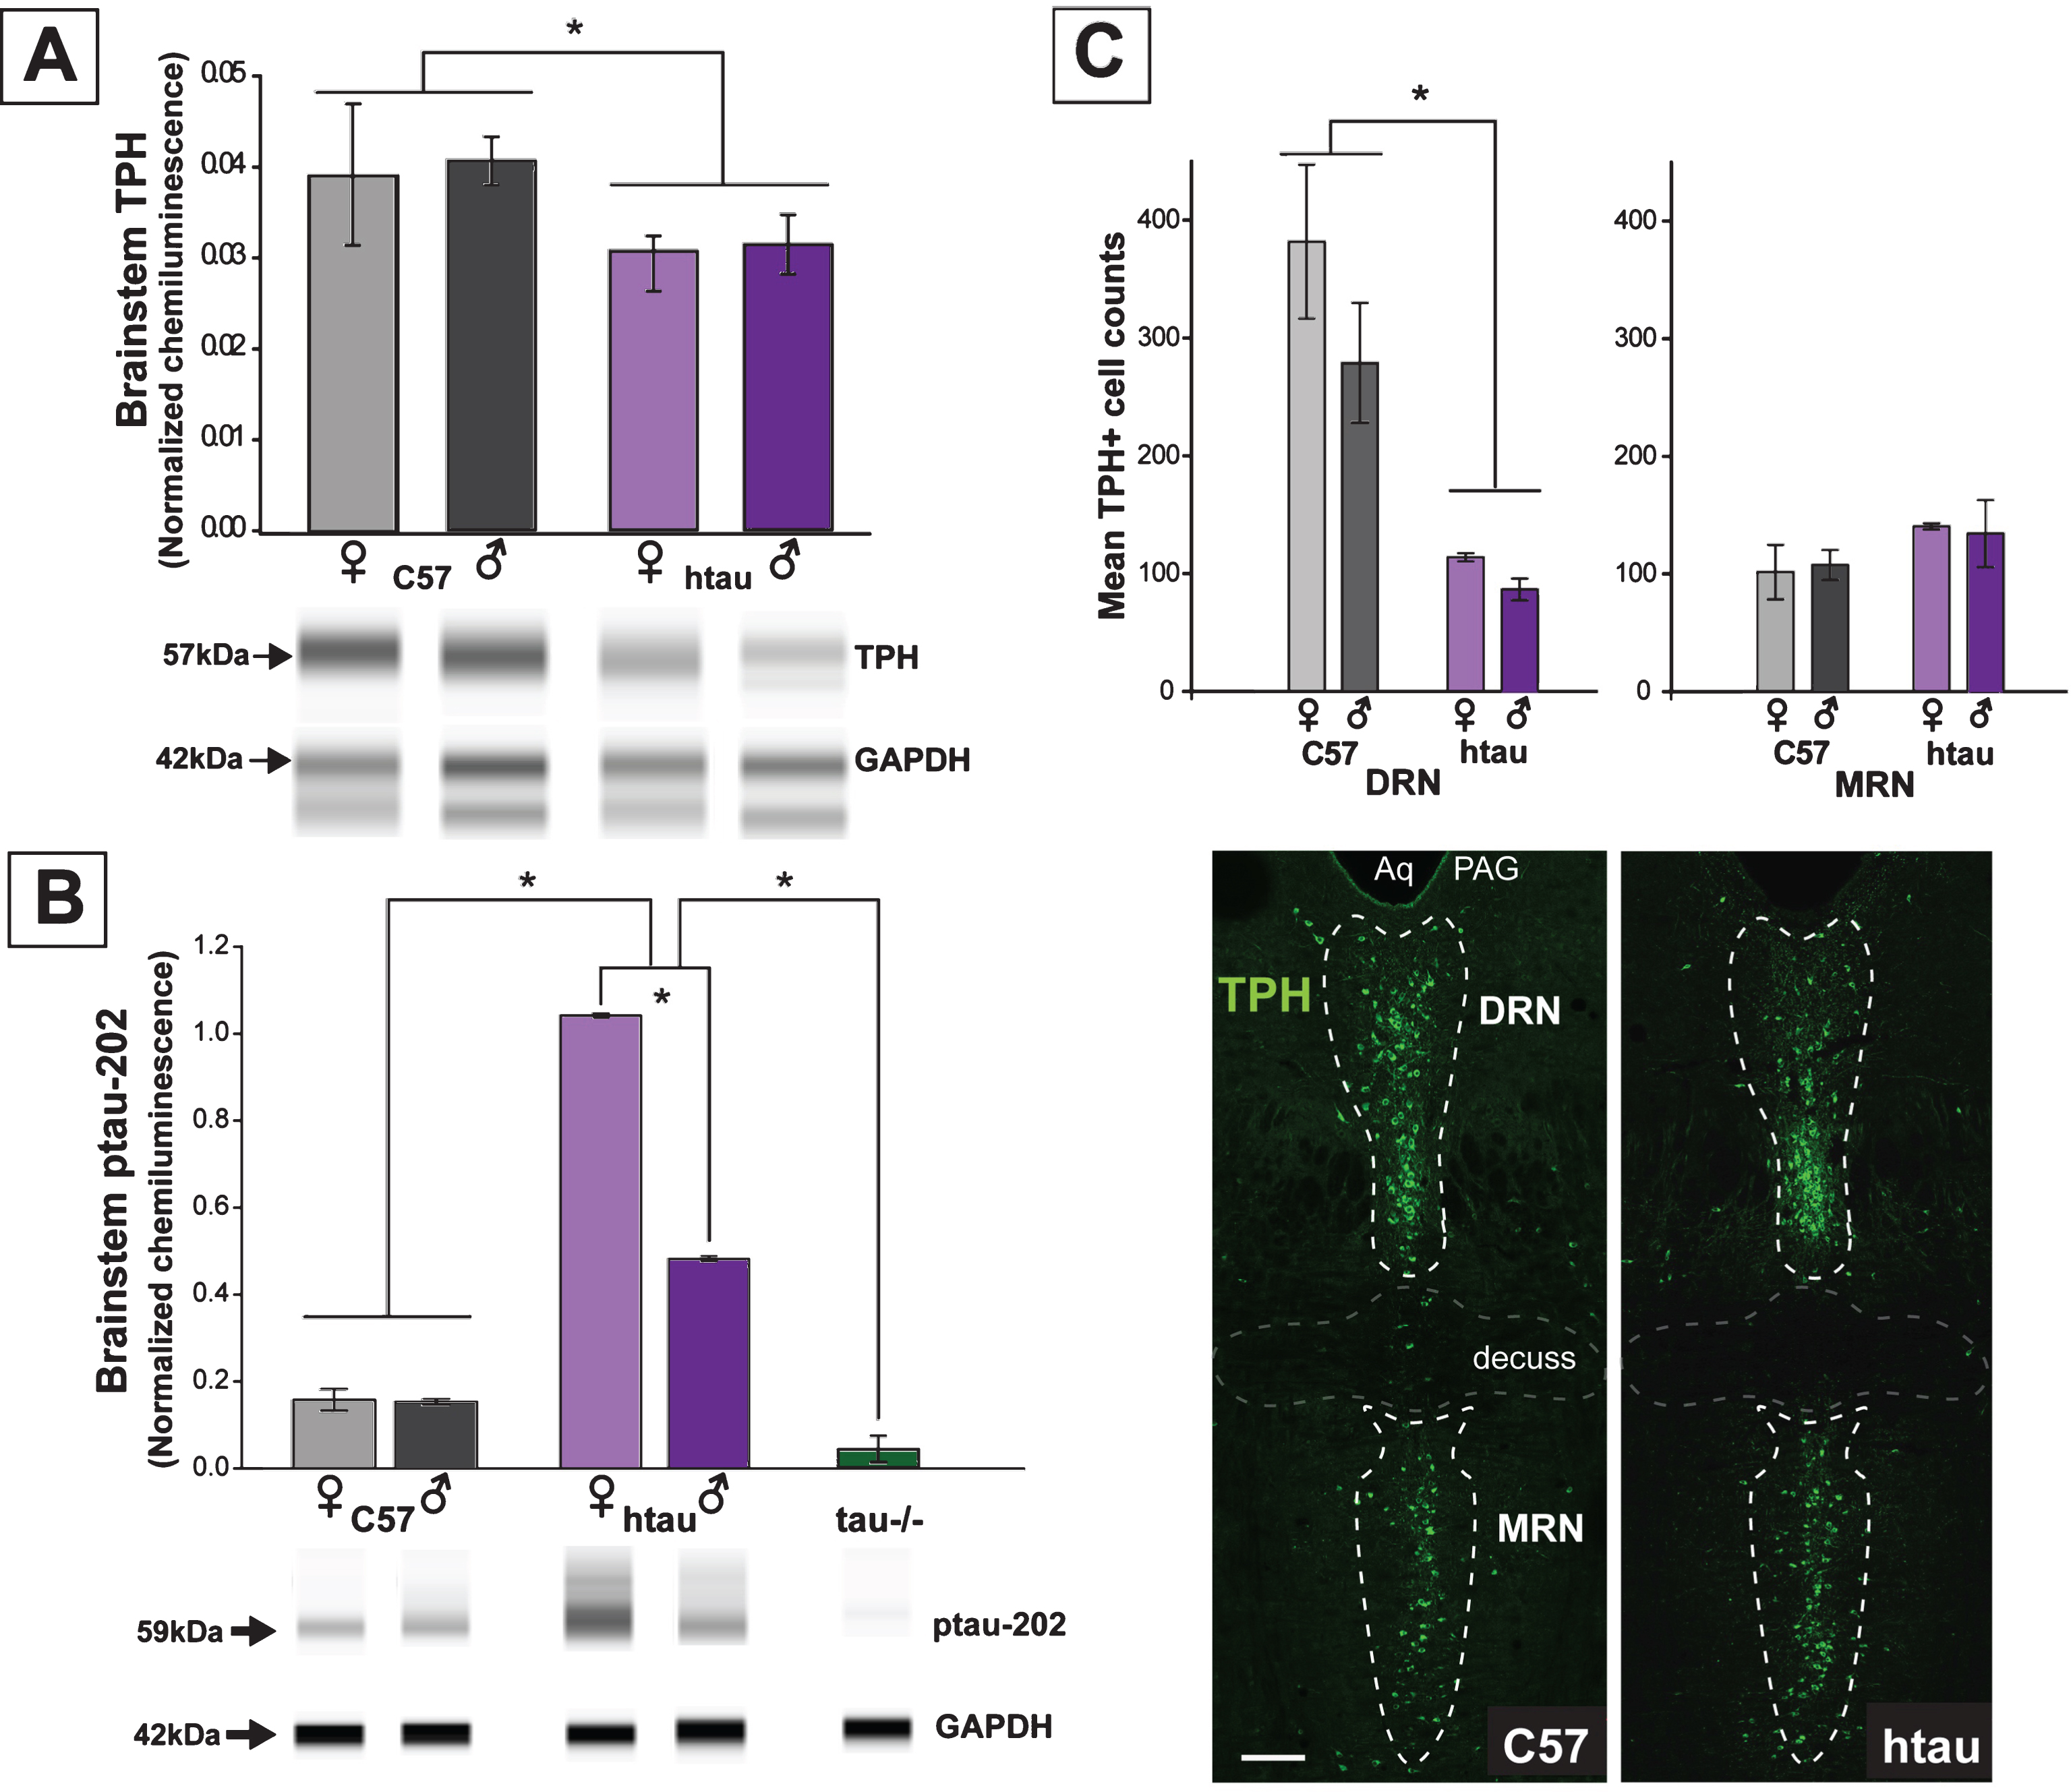
Fig.4
Phosphorylated tau (ptau) accumulation in trytophan hydroxylase (TPH)-positive cells of the DRN is evident in 4-month-old htau mice. Photomicrographs of immunofluorescent-stained DRN sections are shown in the first three columns for C57, tau-/-, and htau mice. All mice exhibit distinctly-labeled TPH cells; however, ptau-231 label is non-existent in C57 and tau-/- DRN. ptau-231 immunofluorescence is obvious in DRN sections of 4-month-old htau mice with substantial co-label of this marker in TPH-positive cells. Fourth column: Photomicrographs of merged channels of TPH and ptau for MRN from each respective animal. Note that ptau-231 fluorescence in htau MRN is weak compared to DRN. Scale bar = 100 μm.
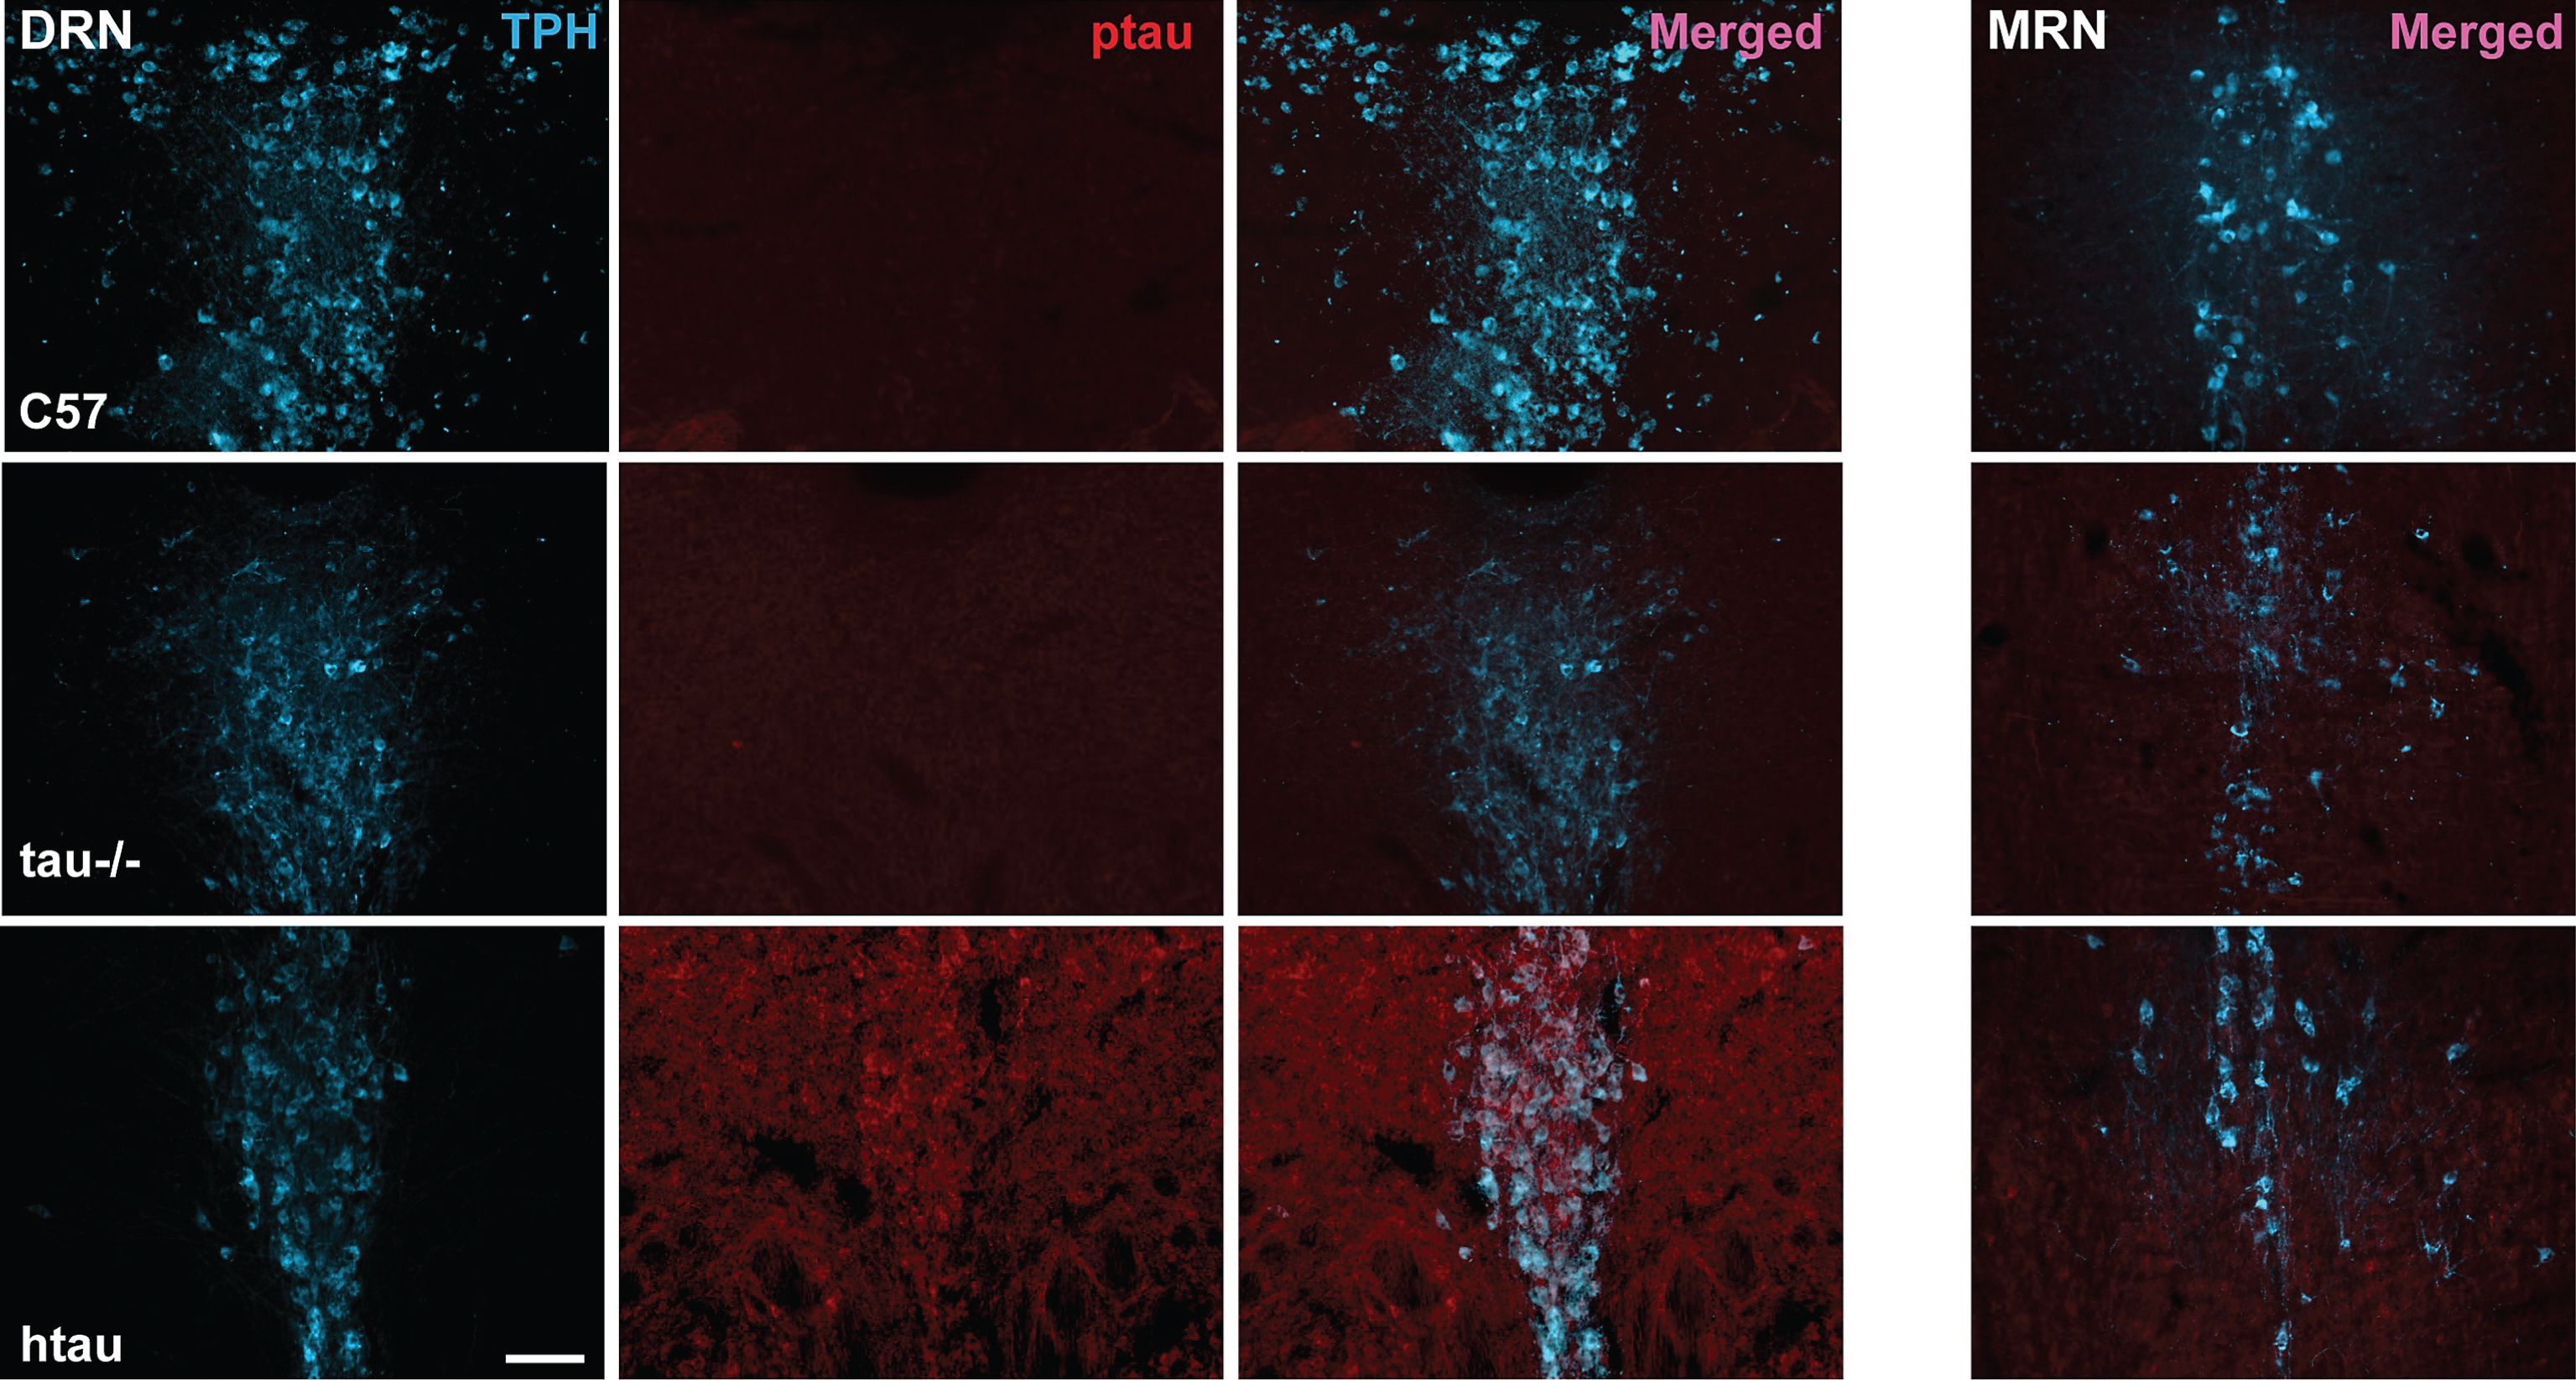
Fig.5
Co-localization of ptau-231 in tryptophan hydroxylase (TPH)-positive cells of 4-month-old htau DRN. A) Confocal images of single planes through rostral DRN at the level of the trochlear nuclei for C57, tau-/-, and htau mice. Phosphorylated tau (ptau) fluorescence is co-localized to TPH-positive cells in the htau section only. Scale bar = 10 μm. B) 3-D reconstruction of a TPH-positive cell in the htau DRN. Orthogonal views of the stack depict fluorescence label across tissue depth. Crosshairs (dashed lines) indicate the plane of section for the X, Y, and Z dimensions. The TPH-positive cell shows prominent ptau label in the cytoplasm of the soma with sparser puncta in TPH-positive processes.Scale bar = 10 μm.
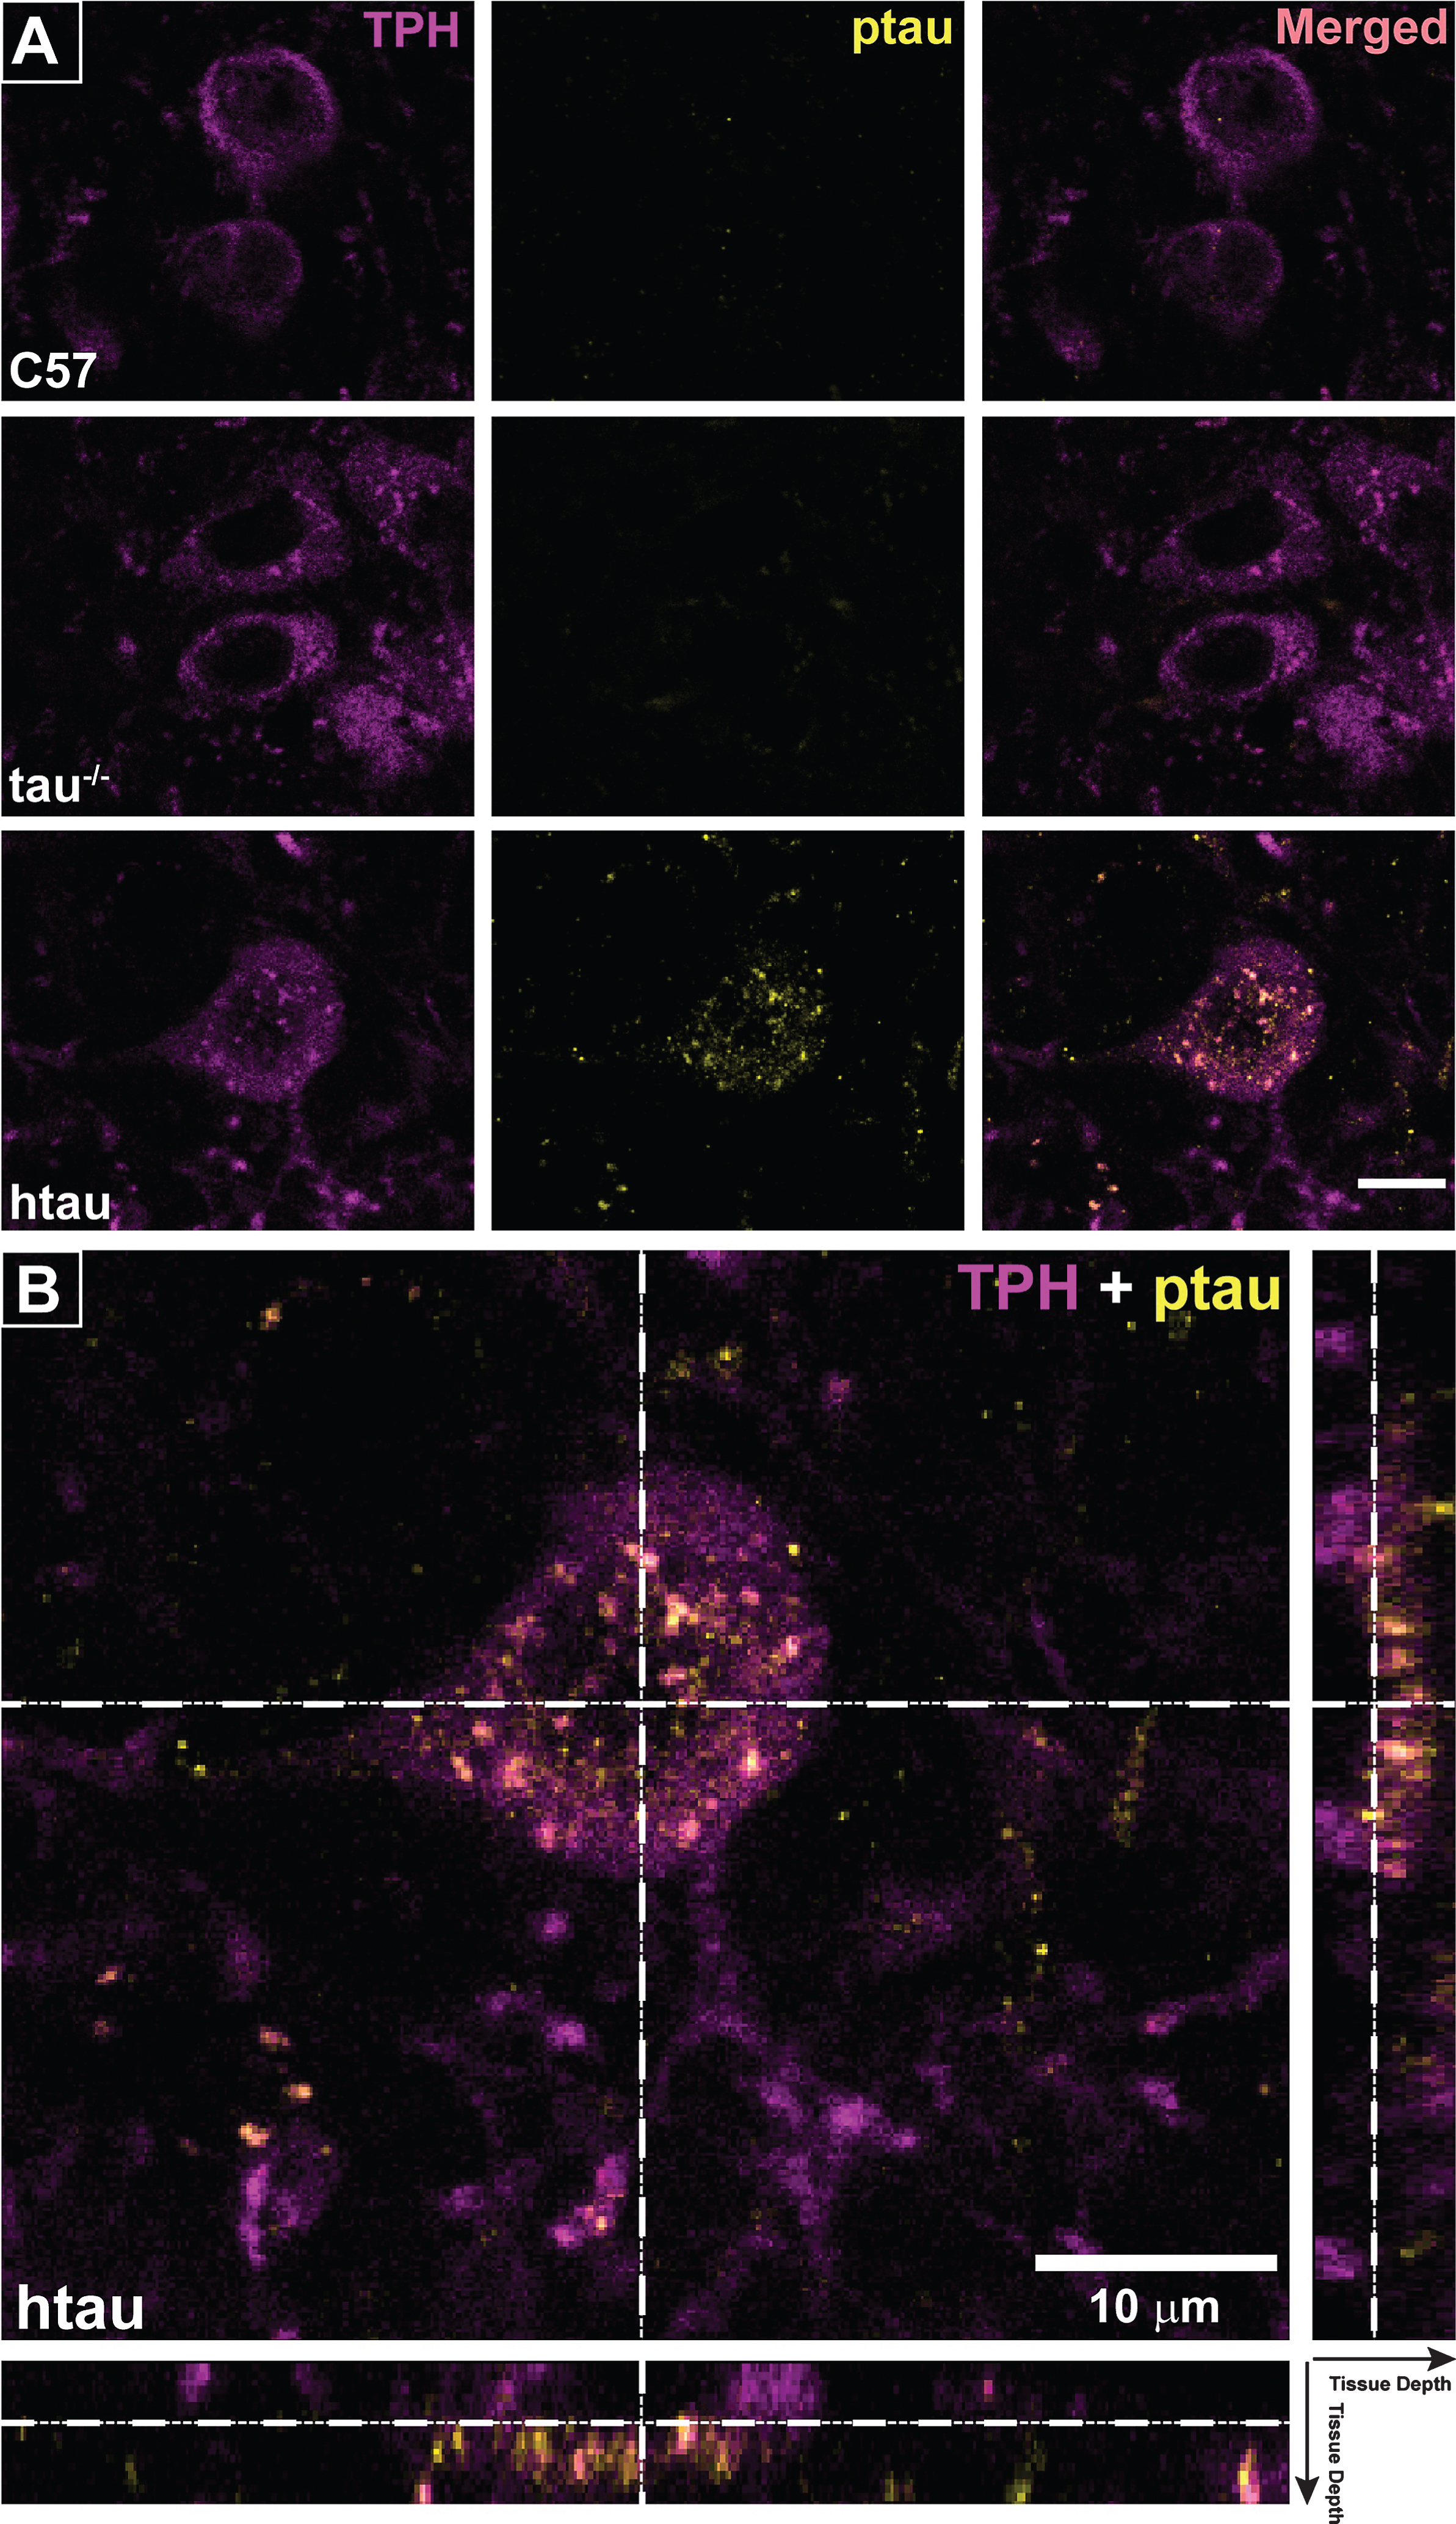
Table 1
Mean bone mineral density (BMD) for lumbar spine and femur across age/genotype
| Female | Male | |||||||
| C57 | Htau | C57 | Htau | |||||
| Lumbar | Mean | SEM | Mean | SEM | Mean | SEM | Mean | SEM |
| Age (mo) | ||||||||
| 2 | 0.051 | 0.00069 | 0.049 | 0.00154 | 0.0519 | 0.00091 | *0.0479 | 0.00088 |
| 3 | 0.0544 | 0.00103 | 0.053 | 0.00129 | 0.0545 | 0.00058 | *0.0499 | 0.00214 |
| 4 | 0.0584 | 0.00147 | *0.0516 | 0.00163 | 0.054 | 0.00160 | 0.0489 | 0.00191 |
| 5 | 0.0565 | 0.00058 | 0.0519 | 0.00114 | 0.0548 | 0.00084 | 0.0519 | 0.00214 |
| 6 | 0.0558 | 0.00095 | 0.0529 | 0.00131 | 0.0568 | 0.00065 | *0.0478 | 0.00214 |
| Femur | ||||||||
| 2 | 0.0594 | 0.00075 | 0.0681 | 0.00185 | 0.0566 | 0.00127 | 0.0639 | 0.00217 |
| 3 | 0.0669 | 0.00065 | 0.0766 | 0.00223 | 0.0668 | 0.00042 | 0.0723 | 0.00137 |
| 4 | 0.0696 | 0.00061 | 0.0792 | 0.00124 | 0.0667 | 0.00200 | *0.0708 | 0.00176 |
| 5 | 0.0713 | 0.00127 | 0.0775 | 0.00195 | 0.071 | 0.00188 | 0.0735 | 0.00045 |
| 6 | 0.0735 | 0.00080 | 0.0874 | 0.00245 | 0.0723 | 0.00168 | *0.0733 | 0.00055 |
*Indicates significant difference from sex-matched C57 control (p < 0.01).

