
Heart Rate Spectra Confirm the Presence of Autonomic Dysfunction in Dementia Patients
Abstract
Recent data suggest autonomic dysfunction in patients suffering dementia. This study evaluated autonomic modulation in dementia patients with and without autonomic involvement, employing ECG spectral analysis in the time-frequency domain (wavelet transform) in supine resting and head-up tilt (HUT) position. Thirty-six patients were prospectively evaluated at the Department of Neurology and Psychiatry, General Hospital of the City of Linz, between 2009 and 2014. A standard cardiovascular autonomic test series (Ewing battery) was performed to screen for autonomic dysfunction. The Ewing battery diagnoses were used as reference standard and compared to the diagnostic results obtained by spectral analysis (time-frequency domain) of ECG recordings. Based on the Ewing battery results, 14 patients suffered autonomic dysfunction, while 22 did not. Time frequency domain was accessed by using the continuous wavelet transformation (CWT) with an analytical Morlet mother wavelet in supine resting and HUT position. Within each cohort the modification of spectral components from supine resting to HUT was analyzed reflecting the autonomic modulation. For patients without autonomic dysfunction, a significant increase of autonomic modulation was detected by wavelet transformed ECG recordings (8%, p < 0.05; low frequency content) during HUT compared to supine resting. There was no significant modulation between HUT and supine resting in patients suffering autonomic dysfunction. In dementia patients suffering autonomic dysfunction, CWT identified blunted autonomic regulation only by analysis of ECG recordings without the need to assess other biosignals or tests depending on the patient’s cooperation. Further studies are needed to evaluate whether CWT is a suitable method to support the standard Ewing battery in demented patients.
INTRODUCTION
Only few data exist on autonomic dysfunction in Alzheimer’s disease (AD) and behavioral variant of frontotemporal dementia (bvFTD). Dysautonomia is not a predominant clinical feature in AD and bvFTD. However using autonomic testing, Allan and co-workers (2007) demonstrated pathologic cardiovascular autonomic test results [1] in 39% patients out of an AD cohort. A recent study comparing autonomic involvement of AD and bvFTD found a comparable prevalence of autonomic dysfunction in both dementias without significant differences between patient groups (44% AD patients and 42% bvFTD patients) [2].
Central autonomic modulation is strongly influenced by the insular cortex. In particular the ventral anterior insula is an important autonomic control area [3]. It is activated during autonomic/interoceptive tasks inter alia [4]. Insular involvement in AD was reported to be related to autonomic dysfunction [5]. In addition, the anterior insular cortex is involved early in the development of frontotemporal dementia [6] and clinical severity correlates with connectivity disruption in this area [7]. Thus, insular cortex degeneration in frontotemporal dementia may have a direct relationship to autonomic dysfunction. This pathophysiologic concept never has been tested in a structured approach until now.
Even more, to date, it is unclear which branches of autonomic innervation are impaired in dementia patients. Sympathetic involvement was demonstrated mainly in alpha-synucleinopathies including dementia with Lewy bodies. In those patients, MIBG uptake was demonstrated to be reduced [8] and plasma norepinephrine concentrations supine and standing are reduced. Parasympathetic involvement was found to be partially impaired [9] and correlated with cognitive decline [10]. In the light of high incidence of autonomic dysfunction, a closer look on autonomic modulation seems appropriate, facilitating a different technical approach than previously applied: The standard test battery for cardiovascular autonomic evaluation, the Ewing battery, provides data on sympathetic and parasympathetic dysfunction during standardized tests, by investigating the biosignals blood pressure and electrocardiogram (ECG) with linear time-series analysis [11, 12]. However, the Ewing battery depends in large part on the cooperation of the patient (Valsalva maneuver, deep breathing, active standing). This is a challenge in many demented patients and renders this widely used method unreliable for this specific group. Test protocols independent of patient’s cooperation are needed. A different approach for autonomic evaluation is the analysis of the frequency characteristics of cardiac beat-to-beat variation during orthostatic challenge [13–15].
Frequency analysis of the heart rate variability (HRV) enables a reliable evaluation of autonomic cardiovascular regulation by assessing the low frequency (LF) and high frequency (HF) spectral content of HRV [15, 16]. The HF component’s (0.15 Hz – 0.4 Hz) power reflects the respiratory sinus arrhythmia modulated by parasympathetic cholinergic innervation. The LF content (0.04 Hz – 0.15 Hz) power is controversially determined by both sympathetic and parasympathetic outflow.
Recent studies, however, demonstrated that LF power provides a reliable index for autonomic baroreflex function [17]. Normalization to total power minimizes the influence of absolute values and can be regarded as a more reliable parameter for the real modulation of the two branches of the autonomic nervous system (ANS) [18]. Montano et al. showed a correlation of LFnu (normalized LF spectrum) to sympathetic activity and a HFnu (normalized HF spectrum) relationship to vagal activity, respectively [19], supporting our approach of evaluating the two branches of the ANS from a single biosignal like the ECG.
The classical fast Fourier transform (FFT) based Fourier analysis bears some serious pitfalls when analyzing biological signals. FFT obtains a global spectrum that does not provide an apparent time related frequency information. Additionally, FFT was developed for decomposition of infinite stationary and periodic signals [20–22].
Biosignals are varying over time and it is crucial to know when frequency or even phase transitions occur. Therefore, in theory, FFT is not the most appropriate method to evaluate biosignals.
To overcome these shortcomings of FFT alternative methods like the “short-time Fourier transform” (STFT) are applied. The STFT uses an analytical window of fixed length, which is shifted over the signal to be analyzed. The length of this window function determines the maximal possible frequency resolution. In contrast to STFT, the wavelet transform (WT) uses a frequency dependent window length resulting in an improved frequency resolution particularly at the LF and HF ranges mentioned above. WT is a more appropriate analytical tool for biosignals like the HRV [20–23].
This study evaluates the HRV’s spectral components (LF, HF) obtained by WT giving insight into autonomic modulation in dementia patients during postural change from supine resting to head-up tilt (HUT) position.
The objective target is to elucidate whether ECG examination in form of HRV-time-frequency analysis (CWT) detects autonomic dysfunction in two predefined patient groups (with and without autonomic dysfunction) clustered by Ewing battery protocol tests.
METHODS
bvFTD and AD patients of both sexes, with dementia or a suspected diagnosis of dementia confirmed during clinical follow-up, were prospectively recruited from 2009 until 2014 at the Department for Neurology and Psychiatry, General Hospital of the City of Linz. bvFTD and AD were diagnosed according to the revised criteria of Neary et al. [24], and from 2011 according to the revised Raskovsky [25] and McKhann criteria [26].
The study was approved by the Ethical Committee of the province of Upper Austria. Patients and their caregivers gave written informed consent to be enrolled in this study, which complied with the Declaration of Helsinki.
Inclusion/exclusion criteria
Patients were included if they: 1) had a confirmed diagnosis of bvFTD (revised criteria of Neary et al. [24]) or AD (McKhann criteria [26]); or 2) had their suspected diagnosis of dementia confirmed during clinical follow-ups.
Subjects were excluded if they: 1) had their diagnosis revised during follow-up; 2) suffered atrial fibrillation or arrhythmias; 3) had more than 15% of detected R-peaks per record derived from artifacts (supraventricular extrasystole, ventricular extrasystole); or 4) had an incomplete autonomic dataset (complete autonomic Dataset: supine resting + HUT recording).
Clinical assessments
All patients received an extensive medical assessment including medical history, indirect history, investigation of concomitant diseases, and clinical neurological examination including Unified Parkinson’s Disease Rating Scale, Tandem-walk performance, Timed Get Up & Go, and Tinetti Test. A full neuropsychological assessment using Frontal Assessment Battery, CERAD-Plus with evaluation of aphasia status was conducted together with cerebral imaging employing 1.5 or 3 Tesla MRI. Clinical follow up was performed every 6 months. Those tests had been performed in the scale of a large follow up study (FTLA Studie, OeNB grant 13240) ensuring that the clinical dementia diagnosis was sound. The clinical diagnosis was reevaluated at follow-up.
Autonomic evaluation
All autonomic assessment took place in the morning and patients were asked to refrain from caffeine and nicotine consumption, but drink a sufficient amount of water or fruit tea prior to autonomic testing. Medications, which might influence autonomic test results (e.g., antihypertensive drugs, beta blockers, dopaminergic drugs, and anticholinergic drugs) were stopped for a minimum duration of the double half-life before testing.
Ewing battery tests
Autonomic testing was performed according to the Ewing battery [11]. Tests were executed by a well-trained medical research scientist with a minimum experience of at least 500 tests. Every patient statement regarding the individual condition during the test was marked within the signal record. Additionally, the research scientist proactively asked the patient for his condition and labeled it in the timecourse if an obvious event (paleness, blood pressure drop off, etc.) took place. An autonomic dysfunction was classified following Ewing’s classification of autonomic failure [11].
Parasympathetic tests
Heart rate variability.
For 15 minutes of relaxed lying, the coefficient of the variance (CV) of R-peak distances was calculated. The CV correlates with the vagal tone [27, 28].
Deep breathing.
For a 90 seconds interval, the patient had to breath in an out at a frequency of 0.1 Hz, 6 breaths per minute. The expiration/inspiration ratio (EI), the ratio between the mean of the longest R-R interval during expiratory phase and the mean of the shortest R-R interval during inspiratory phase, also reflects the vagal tone [13, 29].
Parasympathetic and sympathetic tests
Valsalva manoeuvre.
According to baroreflex activation, this test assesses both branches of the ANS and is separated in phases I-IV. The patient has to exhale against an almost occluded mouthpiece and maintain an exhalation pressure of 40 mmHg for 15 seconds. The decrease in heart rate and increase in blood pressure during phase I is triggered by the onset of the strain and the mechanical compression of the cava vein. Hemodynamic changes in this phase are almost secondary to the mechanical stress and not mediated by autonomic innervation. Phase IIa is dedicated to parasympathic decrease, while in phase IIb, sympathetic activations leads to blood pressure recovery. Phase IV indicates a parasympathetic recovery with the appearance of a baroreflex induced bradycardia. The heart rate and blood pressure changes in phase III are mainly attributed to mechanical decompression of the cava vein[13, 30, 31].
Head-up tilt (HUT).
The patient is passively tilted up from the supine to the 70° standing position. The analysis examines hemodynamic modifications triggered by baroreceptor reflex activation. In contrast to the active standing the muscular pump of the legs is suspended. The gravity driven blood flow gradient toward the lower body and the resulting decreased blood pressure in the upper body triggers the baroreceptor reflex. Feedback loops activate sympathetic innervation of the cardiovascular system simultaneously decreasing parasympathetic activity. The cardiac responses are evaluated by the TILT30/15 ratio which is the ratio of the longest RR interval around the 30th heart beat after HUT and the shortest RR interval around the 15th heart beat after HUT. The TILT30/15 ratio is dedicated to the cardiovagal feedback loop and therefore a measure for parasympathetic activity. Similar to active standing tests, the initial blood pressure drop after tilting is examined as a measure for the sympathetic cardiovascular innervation feedback loop to re-establish normal blood pressure levels. A decrease of >20 mmHg systolic blood pressure or a >10 mmHg diastolic blood pressure drop are considered pathologic and define orthostatic hypotension [30]. Before and during HUT, plasma noradrenaline was quantitatively examined. An increase of noradrenaline <50% from supine to HUT was regarded as pathologic (normal value > 150 pg/ml in resting state; >200 pg/ml in standing state).
Sympathetic tests
Cold immersion test or cold pressor test.
The patient’s left hand was immersed to ice-cold water for 120 seconds to induce an activation of pain and temperature fibers. The resulting sympathetic innervation through the spinothalamic tract typically provokes a progressive increase of blood pressure throughout the manoeuver [13]. A systolic increase of max.19 mmHg from the initial value was regarded as physiological [2].
Mental arithmetic.
The patient was asked to keep on subtracting 7 for 120 seconds starting at 400 [2].
Active standing.
The patient is asked to proactively stand up from a relaxed supine position as quick as possible and remain standing for 120 seconds. The blood pressure is continuously monitored and a change of 20 mmHg systolic or 10 mmHg diastolic is considered pathological defining orthostatic hypotension [30].
Data acquisition
The biosignals heart rate, continuous blood pressure, and breathing pattern where recorded noninvasively with a self-developed autonomic test system using Labview® (National Instruments Inc.) and Matlab® (R2012a). Heart rate was recorded by 3-channel ECG, amplified by a biosignal amplifier (g.Bsamp®, g.tec), blood pressure using Portapres® (Finapres Medical Systems), and respiration by using a piezosensor band around the chest (g.RESPsensor®, g.tec). All data were sampled with 1000 Hz per channel and a resolution of 16 bit using an A/D-converter (NI DAQCard®, National Instruments Inc.).
Data analysis
The analysis software was developed using Labview® (National Instruments Inc.) and Matlab® (R2012a).
Artifact processing
To exclude any influence from signal artifacts, time series were manually screened before further processing. By these means, ECG artifacts, extrasystoles, and Portapres® calibration intervals were excluded from analysis. Whole ECG time courses were excluded if more than 15% of the detected R-peaks were attributed to artifacts like supraventricular extrasystoles or when the supine resting–HUT data set was incomplete (i.e., at least one position recording was missing) thus assuring that each included patient had a complete set of ECG-signals in both conditions, supine resting and HUT.
Wavelet analysis
MATLAB® (R2012a) was used for ECG preprocessing, WT, and spectral analysis.
ECG data were denoised, corrected for baseline shifts and artifacts like supraventricular extrasystoles or ventricular extrasystoles.
HRV was extracted from these preprocessed signals (Fig. 1a), followed by a subsequent calculation of CWT with fast Fourier algorithms (cwtft) from the HRV applying a Morlet mother wavelet. The application of Morlet mother wavelets for HRV analysis has been described by Acharya (2006) and Newandee (2003) and promises good time resolution for high frequency spectral components and good frequency resolution for low frequency spectral components [15, 20, 21].
The WT provides a scalogram with pseudofrequencies (scales) on the ordinate and the timeline on the abscissa; corresponding activity is plotted on the z-axes (Figs. 2 and 3a,b). According to the mathematical derivation shown by Torrence and Compo, these scalograms with the distinct scales can be used to calculate the scale averaged wavelet power for the two frequency bands of interest (LF and HF) followed by the normalization to absolute power (LFnu and HFnu) (see Supplementary Material) [18, 32]. All quantitative and statistical analyses are performed using LFnu and HFnu.
For intuitive visualizing, only the activity of ANS at the corresponding timepoints in WT (we employed the discrete time series LFnu[n] and HFnu[n]) is shown in Figs. 2 and 3c,d (Formula A3.5, Supplementary Material). We have to note that the average of this visualization (
Statistical analysis
Statistical analysis has been performed with Matlab® (R2012a).
According to the normalization process, the sum of LFnu and HFnu results in 100% ANS activity.
An increase of the LFnu fraction simultaneously decreases the HFnu content in exactly the same amount and vice versa. Therefore it is appropriate to omit HFnu in statistical analysis (p-values are equal to LFnu analysis).
The null hypotheses (H0) expected no change in LFnu activity from the resting to the HUT position (i.e. no autonomic innervation takes place during postural changes).
(
Two patient groups were formed according to Ewing battery results: a) group with autonomic dysfunction and b) group without autonomic dysfunction. Each group formed distinct LFnu distribution for resting and HUT position.
The distributions of sympathetic activity (LFnu) were compared within each group: LFnu _ Resting versus LFnu _ HUT (see H0).
First a one sample Kolmogorov-Smirnov test was performed for each distribution to test for normal distribution. This was followed by a two sample F-test for equality of the variances within each group (σ of LFnu _ Resting versus σ of LFnu _ HUT). Every test was performed at the 5% significance level.
Non-normal distributions were tested by non-parametric Wilcoxon ranksum test (Mann-Whitney U-test) [33, 34].
RESULTS
Demographic results
Based on Ewing battery results, 47 patients were divided into two groups: a) group of patients with autonomic dysfunction and b) group without autonomic dysfunction detected by Ewing battery examinations. 11 patients showed more than 15% artifacts based on the total amount of detected R-peaks per individual recording (supine resting or HUT). Artifacts result mainly from supraventricular extrasystoles or ventricular extrasystoles. These 11 patients were excluded from further analysis meeting the exclusion criteria.
36 patients were ultimately enrolled in this study. 14 showed pathologic Ewing battery results (group with autonomic dysfunction) and 22 showed normal Ewing battery results (group without autonomic dysfunction) when compared with controls matching age and sex [35] (see Table 1 for details on patient demography). All patients were geriatric and many polymorbid, which is a regular finding in dementia patients. Of the patients included, 6 patients had mild diabetes mellitus under oral treatment (5 in the pathologic Ewing battery group, 1 in the normal Ewing battery group), and two patients in the normal Ewing battery group had other conditions that might involve the ANS (one had vitamin B12 deficiency–at the time of testing corrected, one had a history of moderate regular alcohol consumption).
Ewing battery results
Table 1 shows the results of the Ewing battery. CV, EI, VAL, and TILT30/15 are expressed as: mean±standard deviation (median) [number of patients able to perform the test]. For phases IIb and IV (Valsalva manoeuver), the number of patients with normal or pathologic phase reactions are shown.
Only for CV and TILT30/15 (passive examinations with little compliance needed) was is possible to obtain reliable data from all patients. Some patients were unable to perform EI and VAL test routines because high compliance was needed. Whereas the deep breathing test (EI value) mostly depends on mental compliance, the Valsalva manoeuver requires considerably more effort and was therefore even harder to achieve for single patients. 4 patients did not manage to perform the EI test routine and 5 patients were overstrained by the Valsalva test routine. For the demented patients included in this study, however, the EI and VAL values showed significant differences (based on Wilcoxon ranksum test) to separate them into groups with and without autonomic dysfunction whereas the passive tests (relaxed lying (CV) and HUT (TILT30/15)) did not. The TILT30/15 value provided significant difference when an alpha error of 14% was accepted (see Table 1)
The standard ECG recording was accessible even for these patients with very little or even no compliance.
Autonomic involvement during HUT
As LFnu and HFnu fractions are normalized to total autonomic activity (Formula A3.4 Supplementary Material), the sum of both branches result in 100% autonomic activity and they are inversely related (i.e., when LFnu increases, HFnu equally decreases and vice versa). LFnu values are specified by mean±standard deviation (median).
Within patients without autonomic dysfunction, LFnu significantly increased from supine resting 72.8% ± 16.07% (78.21%) to HUT condition 78.99% ± 16.98% (84.75%). LFnu values (median) increased significantly by 6.53% (α-error = 0.036; Table 1). H0 for equality of the medians had to be rejected according to Wilcoxon ranksumtest.
Patients with autonomic dysfunction did not show a change in wavelet parameters reflecting autonomic activity; there was only a slight but non-significant increase in LFnu from the resting to the HUT position by 2.26% (p-value 0.4; affirmed H0; Table 1).
Two cases of patients without (Fig. 2) and with (Fig. 3) autonomic dysfunction are presented.
DISCUSSION
This study shows a pathologic pattern of autonomic regulation in demented patients suffering autonomic dysfunction as diagnosed by the standard Ewing battery. Examinations like Valsalva maneuver and deep, metronomic breathing require a high degree of motivation and cooperation and are not feasible in demented patients. Particularly in advanced stages of the neurodegenerative process the performance declines and false or no results are the consequence.
This fact is reflected in the high drop-out rate of 9 patients. In this study we used frequency analysis of heart rate data in supine and HUT condition to investigate dysfunction in cardiac autonomic regulation. This method is nearly completely independent of understanding and cooperation of the testperson.
These results are derived by switching from time domain analysis (Ewing battery) to time-frequency domain analysis, thereby extending signal evaluation by the parameter frequency. Both classic Fourier analysis and the more sophisticated WT render a measure for the frequency distribution of the original signal. WT has advantages in the evaluation of transient signal effects and the evaluation of non-stationary biosignals [36, 37].
The validity of WT analysis for heart rate time series has been demonstrated previously. Ducla Soares et al. have already described the advantages of WT compared to FFT and its application in autonomic testing. Their study was carried out in healthy subjects using discrete wavelet analysis [13].
Nowak et al. used discrete WT to examine autonomic activity in fainters and healthy subjects focusing only on two single frequencies (0.25 Hz and 0.15 Hz), arguing that the 0.15 Hz Mayer Wave reflects the sympathetic baroreflex activity [38].
In contrast to previous studies, we employed CWT, in combination with analytical wavelets. The advantage of this approach is that the absolute value of the wavelet coefficients is independent of the translation in time. Direct correlation to the time-frequency distribution of signal energy is provided and the visual impression of the energy distribution is improved [39]. In addition, the normalization of LF and HF activity to total autonomic power minimizes the effect of magnitude variation between the individual subjects and patient groups [18].
There is increasing evidence for the prevalence of autonomic dysfunction in patients suffering dementia [1, 2]. However, previous data did not allow for analysis of innervations patterns of the sympathetic/parasympathetic cardiovascular control.
Our data demonstrates impaired modulation of autonomic control from supine to upright body position by using spectral analysis of ECG signals in this patient collective.
In contrast to previous findings based on time domain results and hinting to parasympathetic involvement [9], we identified the low frequency content being significantly reduced in orthostatic stress, hinting rather to sympathetic dysfunction, a novel finding.
The pathophysiologic background of this observation remains beyond the scope of this study. Based on a previous finding, that hinted not to peripheral but to central autonomic dysfunction in dementia patients [2], we might hypothesize, that the disease progress also extents to autonomic centers causing autonomic dysfunction.
Novel approaches always bear the danger of over interpretation of clinical results. The advantage of a standard evaluation like Ewing battery is the good comparability of clinical data to elaborate scientific evidence and normative data. However, even for this well established method, there exist only limited data for dementia patients [1, 2]. Autonomic results in demented patients also with standard techniques have to be interpreted with care and with regard to the clinical picture.
CONCLUSION
In summary, we could for the first time implement WT in the evaluation of cardiovascular autonomic function in dementia patients.
Using a method independent of cooperation of the patient, we were able to replicate with this technique impaired autonomic control assessed with the Standard Ewing battery. The procedure depends only on the analysis of the ECG recorded in two body positions (supine and HUT) without any cooperation from the tested individual. Further studies will test the feasibility of CWT and advanced spectral analysis methods for supplementing autonomic testing in demented individuals and to elucidate the pathophysiologic causes for these findings.
ACKNOWLEDGMENTS
This study was funded by the National Bank of Austria (OeNB grant 13240).
Authors’ disclosures available online (http://j-alz.com/manuscript-disclosures/16-0084r1).
Appendices
The supplementary material is available in the electronic version of this article: http://dx.doi.org/10.3233/JAD-160084.
REFERENCES
[1] | Allan LM , Ballard CG , Allen J , Murray A , Davidson AW , McKeith IG , Kenny RA ((2007) ) Autonomic dysfunction in dementia. J Neurol Neurosurg Psychiatry 78: , 671–677. |
[2] | Struhal W , Javor A , Brunner C , Benesch T , Schmidt V , Vosko MR , Ransmayr G ((2014) ) The phoenix from the ashes: Cardiovascular autonomic dysfunction in behavioral variant of frontotemporal dementia. J Alzheimers Dis 42: , 1041–1046. |
[3] | Oppenheimer SM , Gelb A , Girvin JP , Hachinski VC ((1992) ) Cardiovascular effects of human insular cortex stimulation. Neurology 42: , 1727–1732. |
[4] | Mutschler I , Wieckhorst B , Kowalevski S , Derix J , Wentlandt J , Schulze-Bonhage A , Ball T ((2009) ) Functional organization of the human anterior insular cortex. Neurosci Lett 457: , 66–70. |
[5] | Royall DR ((2008) ) Insular Alzheimer disease pathology and the psychometric correlates of mortality. Cleve Clin J Med 75: , 97–99. |
[6] | Seeley WW ((2010) ) Anterior insula degeneration in frontotemporal dementia. Brain Struct Funct 214: , 465–475. |
[7] | Seeley WW ((2008) ) Selective functional, regional, and neuronal vulnerability in frontotemporal dementia. Curr Opin Neurol 21: , 701–707. |
[8] | Miyamoto T , MM , SK , NM , IM HK , Miyamoto T , Miyamoto M , Suzuki K , Nishibayashi M , Iwanami M , Hirata K , Miyamoto T , Miyamoto M , Suzuki K , Nishibayashi M , Iwanami M , Hirata K ((2008) ) 123I-MIBG cardiac scintigraphy provides clues to the underlying neurodegenerative disorder in idiopathic REM. Sleep 31: , 717–723. |
[9] | de Vilhena Toledo MA , Junqueira LF ((2008) ) Cardiac sympathovagal modulation evaluated by short-term heart interval variability is subtly impaired in Alzheimer’s disease. Geriatr Gerontol Int 8: , 109–118. |
[10] | Toledo MADV , Junqueira LF ((2010) ) Cardiac autonomic modulation and cognitive status in Alzheimer’s disease. Clin Auton Res 20: , 11–17. |
[11] | Ewing DJ , Martyn CN , Young RJ , Clarke BF ((1985) ) The value of cardiovascular autonomic function tests: 10 years experience in diabetes. Diabetes Care 8: , 491–498. |
[12] | Low PA ((2003) ) Testing the autonomic nervous system. Semin Neurol 23: , 407–422. |
[13] | Ducla-Soares JL , Santos-Bento M , Laranjo S , Andrade A , Ducla-Soares E , Boto JP , Silva-Carvalho L , Rocha I ((2007) ) Wavelet analysis of autonomic outflow of normal subjects on head-up tilt, cold pressor test, Valsalva manoeuvre and deep breathing. Exp Physiol 92: , 677–686. |
[14] | Malik M , Bigger J , Camm A ((1996) ) Heart rate variability standards of measurement, physiological interpretation, and clinical use. Eur Heart J 17: , 354–381. |
[15] | Rajendra Acharya U , Paul Joseph K , Kannathal N , Lim CM , Suri JS ((2006) ) Heart rate variability: A review. Med Biol Eng Comput 44: , 1031–1051. |
[16] | Newandee DA , Reisman SS ((2002) ) Application of the wavelet transform to heart rate variability (HRV). In Proceedings of the IEEE 28th Annual Northeast Bioengineering Conference (IEEE Cat No.02CH37342) IEEE pp. 35–36. |
[17] | Rahman F , Pechnik S , Gross D , Sewell L , Goldstein DS ((2011) ) Low frequency power of heart rate variability reflects baroreflex function, not cardiac sympathetic innervation. Clin Auton Res 21: , 133–141. |
[18] | Belova NY , Mihaylov SV , Piryova BG ((2007) ) Wavelet transform: A better approach for the evaluation of instantaneous changes in heart rate variability. Auton Neurosci 131: , 107–122. |
[19] | Montano N , Ruscone TG , Porta A , Lombardi F , Pagani M , Malliani A ((1994) ) Power spectrum analysis of heart rate variability to assess the changes in sympathovagal balance during graded orthostatic tilt. Circulation 90: , 1826–1831spectrum. |
[20] | Newandee D , Reisman S ((2003) ) Wavelet representation comparison for heart rate variability analysis. Proc Bioeng Conf 2003 IEEE 29th Annu 07012: , 112–113. |
[21] | Addison PS ((2005) ) Wavelet transforms and the ECG: A review. Physiol Meas 26: , R155–R199. |
[22] | Abramovich F , Bailey TC , Sapatinas T ((2000) ) Wavelet analysis and its statistical applications. Statistician 49: , 1–29. |
[23] | Cazelles B , Chavez M , Magny GC , De , Guégan J-F , Hales S ((2007) ) Time-dependent spectral analysis of epidemiological time-series with wavelets. J R Soc Interface 4: , 625–636. |
[24] | Neary D , Snowden JS , Gustafson L , Passant U , Stuss D , Black S , Freedman M , Kertesz A , Robert PH , Albert M , Boone K , Miller BL , Cummings J , Benson DF ((1998) ) Frontotemporal lobar degeneration: A consensus on clinical diagnostic criteria. Neurology 51: , 1546–1554. |
[25] | Rascovsky K , Hodges JR , Knopman D , Mendez MF , Kramer JH , Neuhaus J , Van Swieten JC , Seelaar H , Dopper EGP , Onyike CU , Hillis AE , Josephs KA , Boeve BF , Kertesz A , Seeley WW , Rankin KP , Johnson JK , Gorno-Tempini ML , Rosen H , Prioleau-Latham CE , Lee A , Kipps CM , Lillo P , Piguet O , Rohrer JD , Rossor MN , Warren JD , Fox NC , Galasko D , Salmon DP , Black SE , Mesulam M , Weintraub S , Dickerson BC , Diehl-Schmid J , Pasquier F , Deramecourt V , Lebert F , Pijnenburg Y , Chow TW , Manes F , Grafman J , Cappa SF , Freedman M , Grossman M , Miller BL ((2011) ) Sensitivity of revised diagnostic criteria for the behavioural variant of frontotemporal dementia. Brain 134: , 2456–2477. |
[26] | McKhann G , Drachman D , Folstein M , Katzman R , Price D , Stadlan EM ((1984) ) Clinical diagnosis of Alzheimer’s disease: Report of the NINCDS-ADRDA Work Group under the auspices of Department of Health and Human Services Task Force on Alzheimer’s Disease. Neurology 34: , 939–944. |
[27] | Hayano J , Sakakibara Y , Yamada A , Yamada M , Mukai S , Fujinami T , Yokoyama K , Watanabe Y , Takata K ((2016) ) Accuracy of assessment of cardiac vagal tone by heart rate variability in normal subjects. Am J Cardiol 67: , 199–204. |
[28] | Toichi M , Sugiura T , Murai T , Sengoku A ((1997) ) A new method of assessing cardiac autonomic function and its comparison with spectral analysis and coefficient of variation of R-R interval. J Auton Nerv Syst 62: , 79–84. |
[29] | Reis MS , Arena R , Archiza B , De Toledo CF , Catai AM , Borghi-Silva A ((2014) ) Deep breathing heart rate variability is associated with inspiratory muscle weakness in chronic heart failure. Physiother Res Int 19: , 16–24. |
[30] | Lahrmann H , Rocha I , Struhal W , Thijs RD , Hilz M ((2011) ) Diagnosing autonomic nervous system disorders - existing guidelines and future perspectives. Eur Neurol Rev 6: , 52–56. |
[31] | Risk M , Berghoff M , Freeman R ((2000) ) Characterization of the Valsalva maneuver using wavelet transform. Comput Cardiol 27: , 411–414. |
[32] | Torrence C , Compo G ((1998) ) A practical guide to wavelet analysis. Bull Am Meteorol Soc 79: , 61–78. |
[33] | Fay MP , Proschan MA ((2010) ) Wilcoxon-Mann-Whitney or t-test? On assumptions for hypothesis tests and multiple interpretations of decision rules. Stat Surv 4: , 1–39. |
[34] | Blair RC , Higgins JJ ((1980) ) A comparison of the power of Wilcoxon’s rank-sum statistic to that of Student’s t statistic under various nonnormal distributions. J Educ Stat 5: , 309–335. |
[35] | Ziegler D , Laux G , Dannehl K , Spüler M , Mühlen H , Mayer P , Gries FA ((1992) ) Assessment of cardiovascular autonomic function: Age-related normal ranges and reproducibility of spectral analysis, vector analysis, and standard tests of heart rate variation and blood pressure responses. Diabet Med 9: , 166–175. |
[36] | Teolis A ((1996) ) Computational Signal Processing with Wavelets. Birkhäuser Boston, Boston, MA. |
[37] | Sejdić E , Djurović I , Jiang J ((2009) ) Time–frequency feature representation using energy concentration: An overview of recent advances. Digit Signal Process 19: , 153–183. |
[38] | Nowak JA , Ocon A , Taneja I , Medow MS , Stewart JM ((2009) ) Multiresolution wavelet analysis of time-dependent physiological responses in syncopal youths. Am J Physiol Heart Circ Physiol 296: , H171–H179. |
[39] | Mertins A ((2013) ) Signaltheorie. Springer Vieweg. |
Figures and Tables
Fig.1
A resting ECG, its corresponding heart rate variability, and the heartbeat distribution histogram. In (a) and (b), the lower time course displays the 1 kHz sampled ECG signal which has been denoised and corrected for baseline shift. The second time course above it is the heart rate variability, the time between consecutive R-Peaks in ms. The heartbeat distribution of the whole ECG signal can be seen in (c) with the mean heartbeat frequency of (67.72±4.13) bpm and the mean heart rate variability of (889.29±53.5) ms.
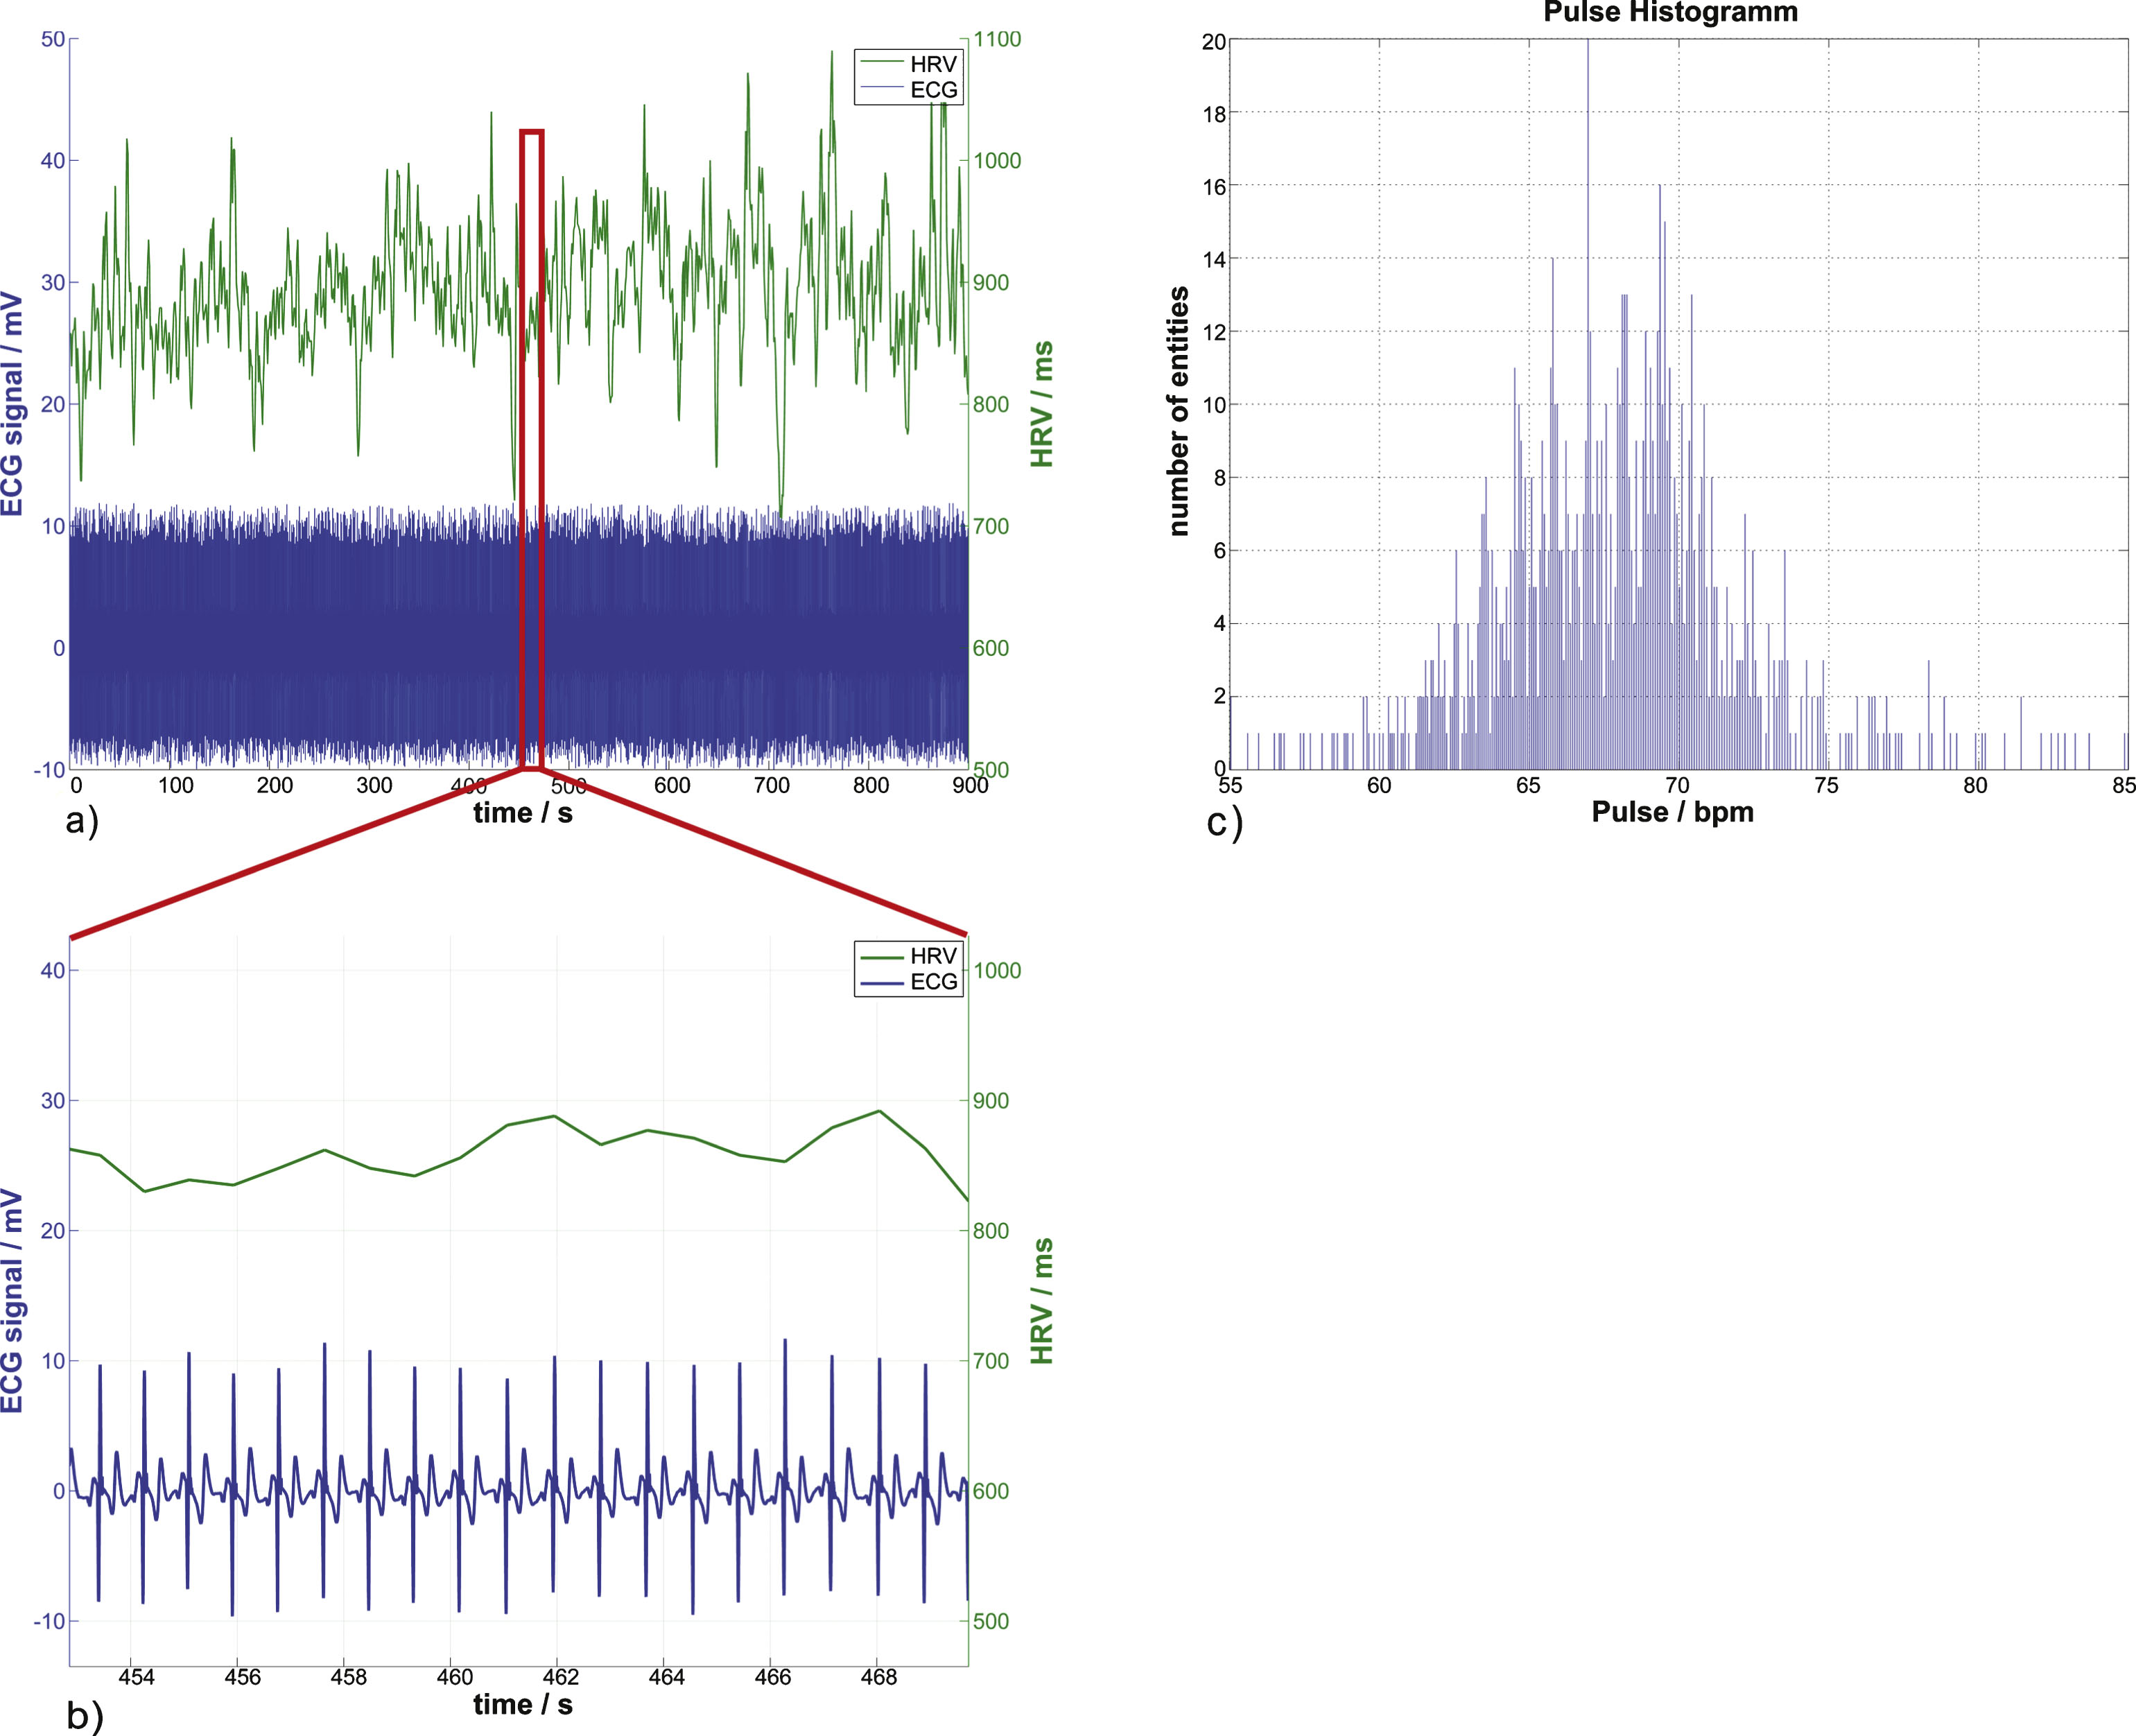
Fig.2
HRV wavelet scalograms (a,b) and the corresponding normalized units time courses (momentary activity of each branch of the autonomic system) (c,d) in a patient without autonomic dysfunction. a) Autonomc activity in resting state. Horizontal lines define the confined LF and HF bands indicating sympathetic and parasympathetic activity. The color visualizes the actual activity shown on the color bar. Scalograms of the same patient are equally color scaled. b) HUT ANS activity for the same patient without autonomic dysfunction. LFnu increases 13% from the resting to the HUT position. c) The momentary ANS activity in the resting position versus the momentary activity during HUT in (d), the estimated momentary activity increases by 15% from resting to HUT.
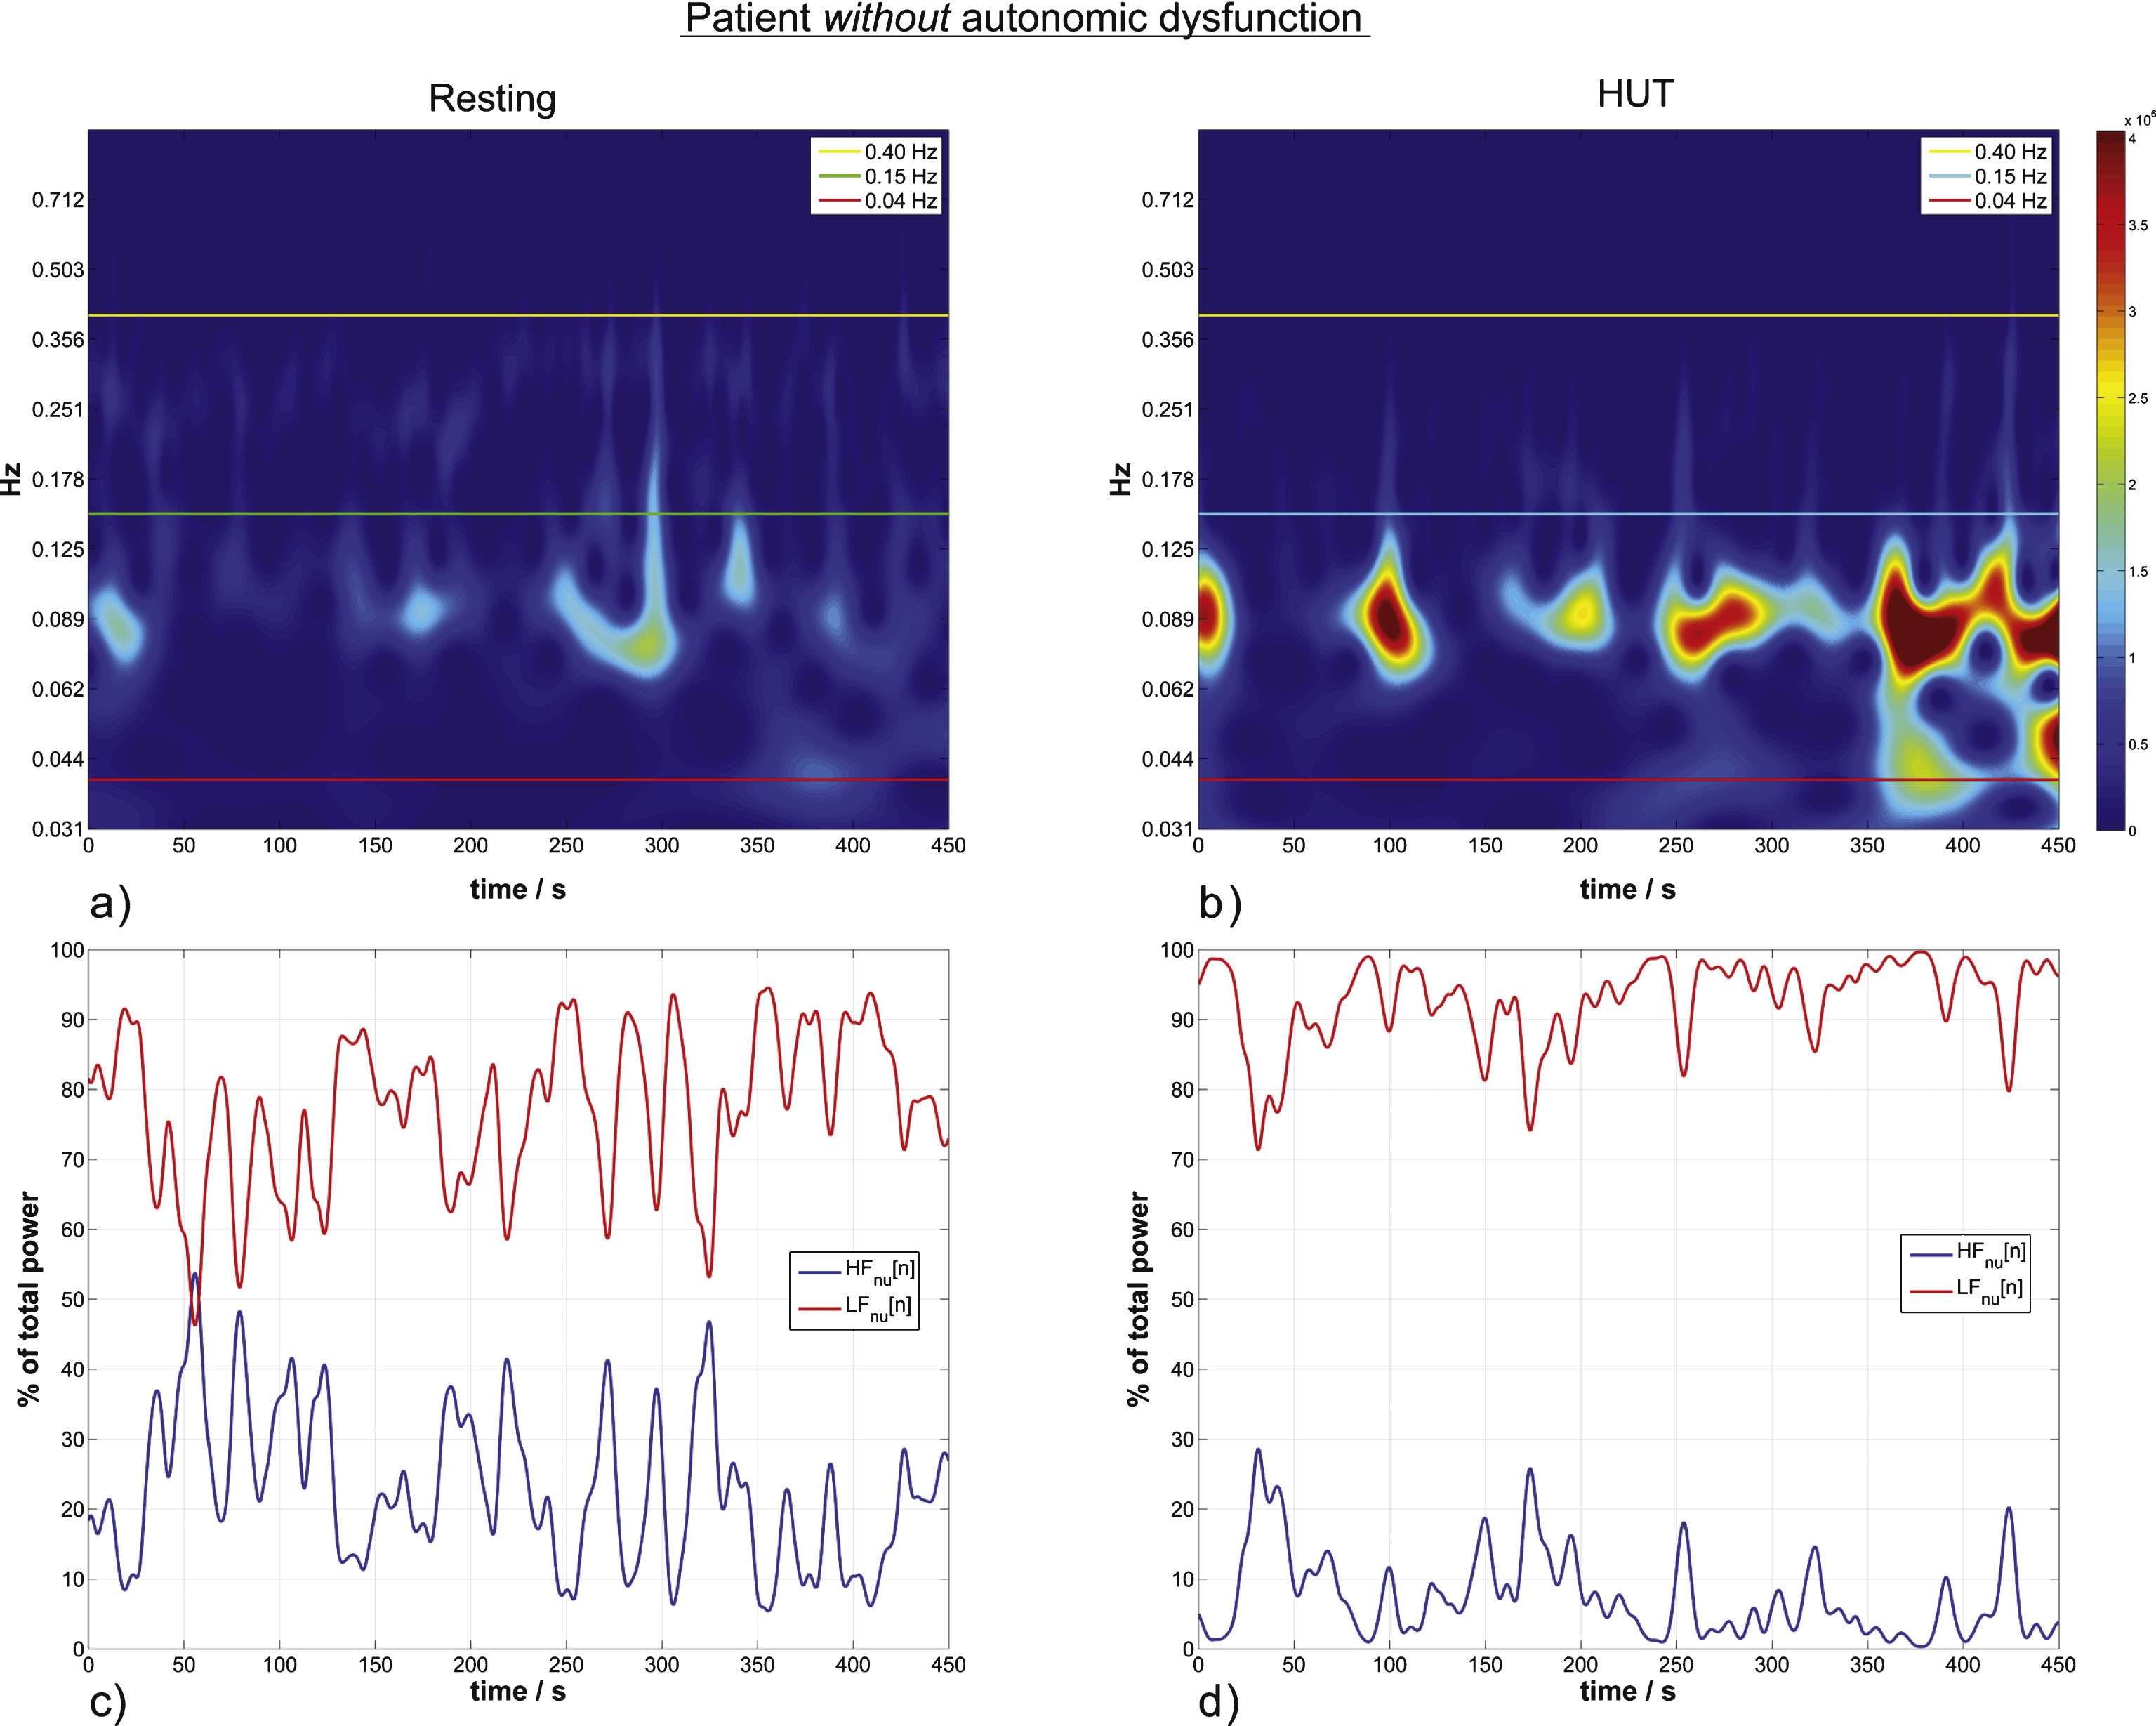
Fig.3
HRV wavelet scalograms and normalized units time courses (similar to Fig. 2) of a patient with autonomic dysfunction. (a) and (b) are scalograms of a representative patient in resting position (a) and during HUT (b) with no significant increase from the resting to the HUT position. (c) and (d) are the corresponding time courses of momentary ANS activity.
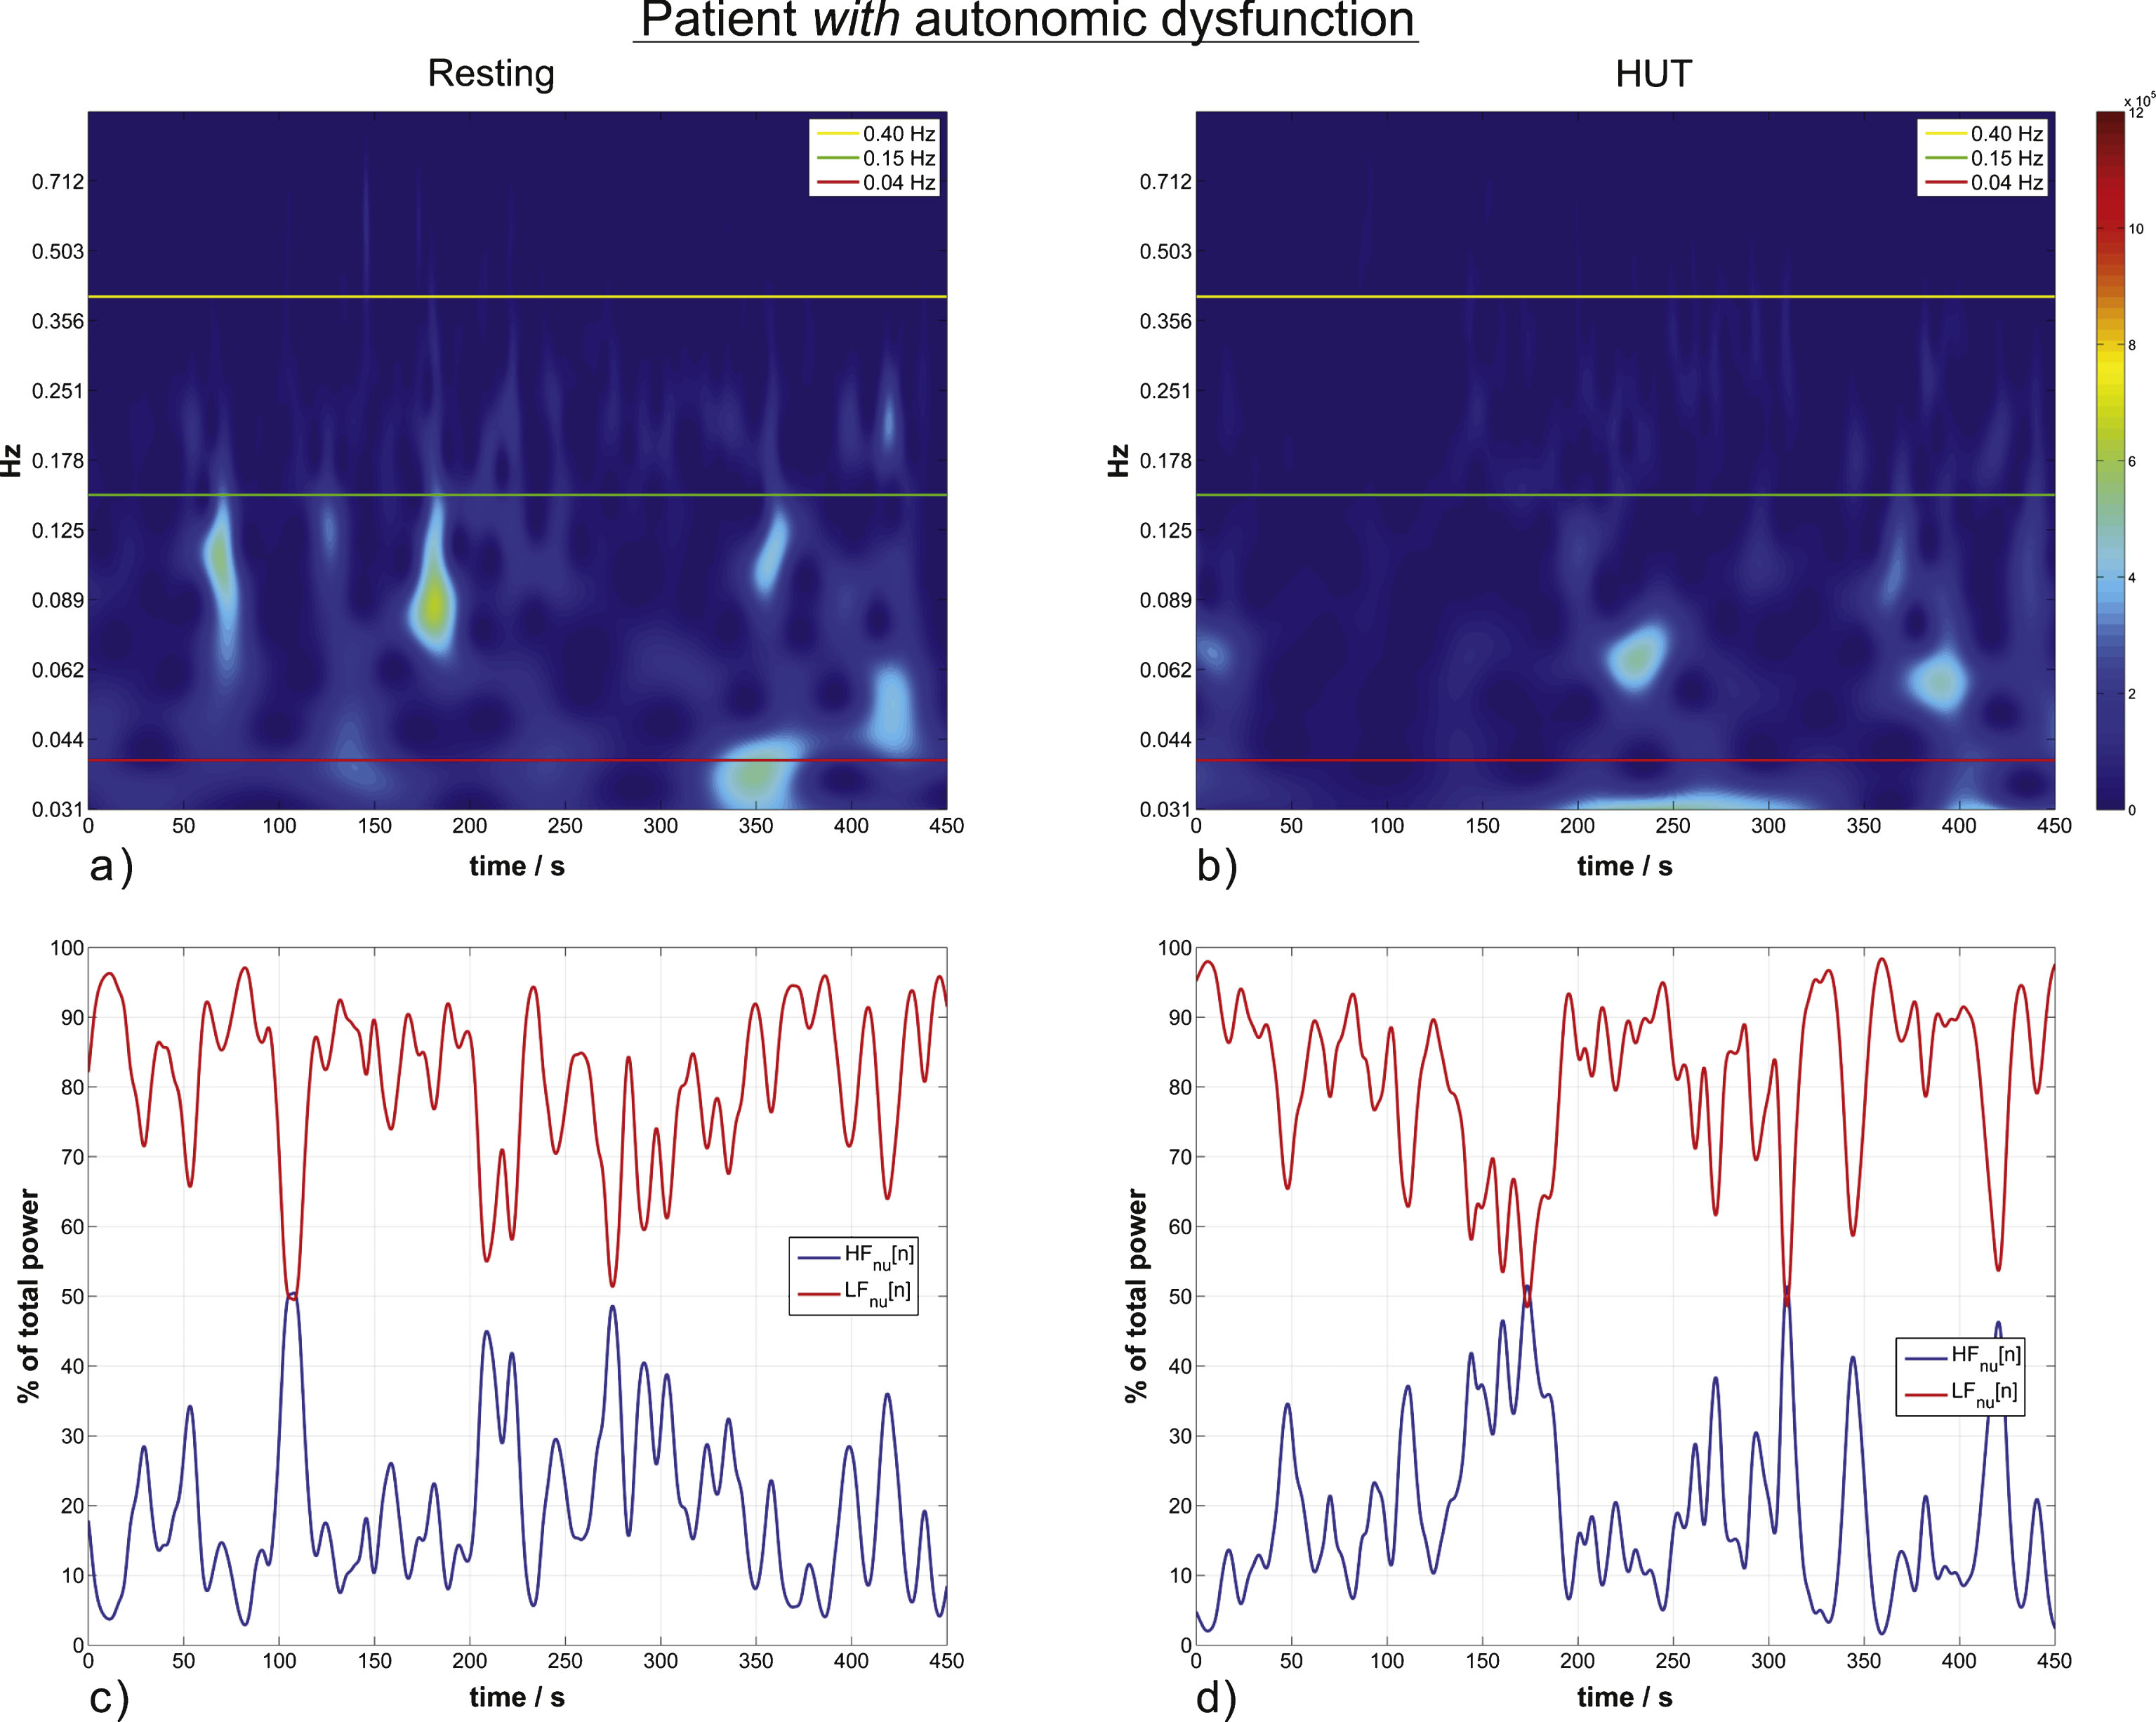
Table 1
Age distribution and total number of cases separated for gender and type of dementia. Data is grouped by diagnosed autonomic dysfunction according to the Ewing batter protocol. Descriptive Data is denoted as mean±standard deviation (Median) and sample size n (Ewing battery). Ewing battery results are displayed for: Coefficient of variance (CV), Expiration-Inspiration ratio (EI), Valsalva phase IIb/IV ratio (VAL), and the TILT30/15 ratio for HUT. Descriptive analysis parameters for LFnu are calculated as percentage of total autonomic activity. The normalized LF activity (LFnu) is significantly increased by δ= +6.53% from supine resting to HUT
| Group with autonomic dysfunction | Group without autonomic dysfunction | |||
| Group size | 14 | 22 | ||
| Age (years)† | 76±6 | 65±9 | ||
| Gender | 8 female / 6 male | 17 female / 5 male | ||
| Dementia Diagnosis | 6 DAT / 8 bvFTD | 8 DAT/14 bvFTD | ||
| Descriptive data Ewing battery | ||||
| CV Mean±Std (Median) | 3.89±1.88 (3.53) [n = 14] | 3.73±1.46 (3.77) [n = 22] | ||
| El Mean±Std (Median))† | 1.12±0.08(1.14) [n = 11] | 1.28±0.22 (1.22)[n = 21] | ||
| VAL Mean±Std (Median))† | 1.12±0.14 (1.11) [n = 11] | 1.32±0.24 (1.30) [n = 20] | ||
| Phase llb normal / blocked | 5/5 | 17/3 | ||
| Phase IV normal /blocked | 5/6 | 17/3 | ||
| TILT30/15 Mean±Std (Median)‡ | 1.1±0.13 (1.09) [n = 14] | 1.16±0.10 (1.15) [n = 22] | ||
| Descriptive data LFnu | ||||
| LFnu _ Resting (%) Mean±std (Median) | 71.18±23.17(78.22) | 72.8±16.07 (78.21) | ||
| LFnu _ hut (%) Mean±Std (Median) | 76.84±21.22 (80.48) | 78.99±16.98 (84.75) | ||
| non- parametric Wilcoxon ranksum test (equality of medians; H0: LFnu _ Resting = LF nu) | ||||
| δ= LFnuhut - LFnu–Resting (%) | 2.26 | 6.53† | ||
| p-Value | 0.395 | 0.036 | ||
†significantly different (p-value < 5%) Wilcoxon ranksum test. ‡significantly different (p-value < 14%) Wilcoxon ranksum test.

