
Measuring Information Processing Speed in Mild Cognitive Impairment: Clinical Versus Research Dichotomy
Abstract
A substantial body of research evidence is indicative of disproportionately slowed information processing speed in a wide range of multi-trial, computer-based, neuroimaging- and electroencephalography-based reaction time (RT) tests in Alzheimer’s disease and mild cognitive impairment (MCI). However, in what is arguably a dichotomy between research evidence and clinical practice, RT associated with different brain functions is rarely assessed as part of their diagnosis. Indeed, often only the time taken to perform a single, specific task, commonly the Trail making test (TMT), is measured. In clinical practice therefore, there can be a failure to assess adequately the integrity of the rapid, serial information processing and response, necessary for efficient, appropriate, and safe interaction with the environment. We examined whether a typical research-based RT task could at least match the TMT in differentiating amnestic MCI (aMCI) from cognitively healthy aging at group level. As aMCI is a heterogeneous group, typically containing only a proportion of individuals for whom aMCI represents the early stages of dementia, we examined the ability of each test to provide intra-group performance variation. The results indicate that as well as significant slowing in performance of the operations involved in TMT part B (but not part A), individuals with aMCI also experience significant slowing in RT compared to controls. The results also suggest that research-typical RT tests may be superior to the TMT in differentiating between cognitively healthy aging and aMCI at group level and in revealing the performance variability one would expect from an etiologically heterogeneous disorder such as aMCI.
INTRODUCTION
Although information processing speed tends to slow with age [1], disproportionate slowing appears related to cognitive limitations [2–5] and a wide range of brain disorders [6], including degenerative brain changes such as Alzheimer’s disease (AD) [6–10], vascular dementia [11], vascular cognitive impairment [12, 13], cerebral small vessel disease [14], amnestic mild cognitive impairment (aMCI) and its conversion to dementia [8] and faster decline in AD progression [15, 16].
Behaviorally, as reaction time (RT) is an important factor in relation to the integrity and efficiency of brain functions such as those involved in attention, cognition, and perception, it may provide a ‘real-life’ indicator of changes to everyday functions and explain, at least in part, some of the signs, symptoms, and changes in behavior related to aMCI and AD. Indeed, disproportionate slowing is associated with the cessation of driving [17, 18], mortality among community-dwelling older adults [19], functional dependence in activities of daily living [19, 20], walking speed [21], and outcome after stroke [22].
Of particular relevance to potential clinical impact of such research is the substantial body of evidence indicative of the relationship between RT and some aspects of the brain’s structural integrity. Information processing speed as indicated by RT (i.e., the time elapsed between the presentation of a stimulus and the behavioral response), measured over a number of trials of computer-based stimulus response tests, can represent a behavioral ‘marker’ of neurophysiological integrity. For example, disruption to white matter and cerebral integrity and change in neurotransmitters is associated with disproportionate slowing of and raised intra-individual variability in RT [1, 8, 23–30]. Arguably therefore this link between structural and functional integrity and behavioral RT indicates the potential for simple RT tests as valid adjuncts to the assessment of diagnosis, status, stage, progression, and interventional success in dementia and related disorders [31].
Furthermore, with appropriate methodological design, RT can be used to assess the integrity of specific aspects of brain function including attention, perception, visual processing, and cognition, at various levels of processing and in response to different processing and resource demands [8]. Indeed, the majority of dementia-related research studies examining RT in relation to brain structure and function (e.g., using techniques such as DTI, EEG, MRI, fMRI) have tended to utilize multi-trial computer-based tasks. These have not only allowed measures of the relationship between behavioral RT and structure and function but generated additional information related to performance variability, fatigue, stimuli and threshold responses, processing load, resource availability and utilization, patterns of functional decline and integrity, and response to intervention. RT is arguably therefore an indicator of an individual’s ability to respond rapidly, efficiently, appropriately, and repeatedly to ever-changing stimuli and thus represents a valid, yet easily obtained, indicator of the efficiency by which a person can successfully interact with their surroundings. An example being the constant need for vigilance and response to change required by driving.
Clinically, despite this research evidence, information processing speed tends not to be assessed using a variety of function-specific, computer-based, multi-trial RT tests. Although a variety of RT-based tests are available and in use clinically, in some cases information processing speed is assessed by measuring the time taken to perform a given task, namely using a stop-watch to measure the single trial performance of the pen and paper Trail Making Test (TMT) [32–38]. The TMT is a test administered in two parts. In Trails A, individuals are required to connect a series of consecutively numbered circles that are presented in a random pattern on the paper: a task typically described as probing functions such as speed of processing in relation to attention, visual scanning and search, number recognition, numeric sequencing, and motor speed. In Trails B, individuals are required to connect a series of numbered and lettered circles alternating between the two sequences; a task typically described as probing the efficiency of set shifting, mental flexibility, executive function, divided attention, attention switching, visual search set shifting, simultaneous maintenance of two sequences, working memory and cognitive flexibility; arguably a measure of information processing speed in relation to multiple high level, non-specific functions [33, 34, 39]. TMT performance, in both parts A and B, is evaluated by scoring the time for completion in seconds, using one trial only.
Although research indicates that TMT performance, as in RT, is slower in older compared to younger adults [33, 40], with additional slowing related to pathological aging such as MCI, AD [41, 42], and vascular dementia [43] (but see also [10, 15, 21, 41, 44–54]), there are potential limitations associated with the clinical use of the TMT. Although Trails B is more difficult than Trails A, involving greater information processing load, range and depth of operations, and arguably of greatest clinical usefulness, not all individuals can complete it [55]. Any visual or motor impairment due to extraneous factors such as stroke, injury, blindness, or arthritis for example, will affect test performance. In those circumstances the test is not administered, or it is interpreted with caution. Furthermore, the fact that TMT performance is examined over one trial only precludes the complex analysis of speed/error trade-off, the motor and non-motor components of reaction time, thresholds for change, the influence of environmental factors and stimulus properties, practice or fatigue effects, the intra-individual variability of an individual’s performance at any one time, and the components of rapid, successive information processing and response, possible with the use of RT tests. RT tests arguably therefore can provide more ‘data rich’ results than the TMT. Furthermore the fact that the TMT is pen and paper-based also means that it is difficult to use in its exact clinical format in conjunction with neuroimaging, EEG, and many other imaging studies relating behavioral response with underlying physiology (although see Müller et al. [36] and Hagen et al. [34]).
Arguably, in the time it takes to administer the TMT, a highly sophisticated and function-specific RT and RT variability test (and one typically used in neuroimaging studies) could be administered using the user-friendly interfaces of computers, laptops, or mobile technology devices (e.g., tablets). Potentially, the use of such technology can permit the automatic and immediate availability and electronic transfer of results for interpretation and comparison with previous results. Taking this concept one step further, mobile device technology means that clinically relevant and research-based RT testing does not have to be performed within a clinical setting and does not necessarily require someone to administer it [56].
Although a major research focus in aMCI relates to the potential for disproportionate RT slowing as a ‘marker’ of the increased risk of developing dementia, the generally ignored fact remains that irrespective of cause, substantially slowed information processing and response may have significant detrimental impact upon daily living. Arguably, in terms of ecological validity and clinical relevance, measuring processing speed with respect to TMT performance only, means that degradation in the integrity of the operations involved in rapid responses to constantly changing or repeatedly presented information is not considered when evaluating task competences and behaviors with inherent RT components. The operations involved in processing and responding to rapid and repeated stimuli in a RT test will be different to those related to the performance of the TMT, and we suggest that measuring RT may be more akin to, ecologically valid or relevant with respect to the investigation of the integrity of information processing speed related to every day tasks which typically require repeated rapid processing, decision making, and response. Taking into account all these considerations, should information about processing speed included in the clinical diagnosis and follow-up of aMCI and dementia be based solely on TMT performance?
We address this question by investigating two measures commonly used as indicators of processing speed in aMCI and AD, namely the TMT, sometimes used in clinical assessment, and the RT component of a form of visual search test commonly employed in research and specifically that is used in a series of previous studies by Tales and colleagues (e.g., [8]), in which RT to a target appearing in isolation is compared to the time taken to respond to the same target when it is surrounded by distracting information. These tasks are similar to Trails B and Trails A, in that they are generally assumed to involve complex and higher processing levels and varying loads, attention shifting, eye movements, sequencing, suppression and inhibition of irrelevant or previously attended locations and stimuli, but unlike the TMT, numerous trails are presented in quick succession (as described in the methods section to follow). We examine in the first instance whether the visual search based RT tests can at least match the ability of the TMT to differentiate aMCI from cognitively healthy aging at group level. Secondly, as aMCI is a clinically heterogeneous group typically containing a proportion of individuals for whom aMCI represents the early stages of a dementing process, a proportion for whom it remains of unknown etiology and others for whom it is a temporary condition, we examine the ability of each test to capture intra-individual variation in performance. As both disproportionately slower task-completion time and RT are related to the presence of dementia, one would expect to see some performance variability within the aMCI but not the cognitively healthy control group in bothtests.
Research has also indicated that in older adults both age and educational level can influence TMT performance, although outcome appears to vary with respect to TMT scoring methods, type of analysis, and the interpretation of errors [33–35, 41, 57–62]. There is some evidence also that gender can influence RT although this effect appears to be task dependent [33, 58, 63–66]. In the present study therefore, as is common practice, education, age, and gender were matched at group level to the best of our abilities. Furthermore, as earlier research on TMT has been criticized because of the lack of inclusion of a measure of IQ [41, 67], we employed the National adult reading test (NART) [68, 69] to provide an estimate of general/pre-morbid intelligence or indeed a proxy of cognitive reserve. As previous evidence highlights the potential for outcome variability between studies of processing speed in such populations [8, 70, 71], the same individuals are included in all tests so direct comparisons of performance can be made.
METHODS
This study was conducted according to the principles in the Declaration of Helsinki. It was approved by Frenchay Research Ethics Committee and all participants gave written informed consent to participate. Only individuals with the capacity to consent were included. Capacity to consent was assessed by the clinician (JH) with specialist expertise in this field and consistent with the requirements of the Mental Capacity Act.
Participants
Community-dwelling cognitively healthy older adults and patients with aMCI+ (multi-domain amnestic MCI) were recruited via the Bristol Memory Disorders Clinic. All had normal or corrected-to-normal vision. Medication could not be controlled but none of the participants were receiving medication or intervention deemed likely to affect cognitive or reaction-time-related function and those with aMCI+ were receiving no drug treatment or intervention for this condition, none were classed as anxious or depressed. All participants performed a typical Bristol Memory Disorders clinic battery of neuropsychological tests including Mini-Mental State Examination (MMSE) [72], WAIS-III (Wechsler Adult Intelligence Scale) subtests (digit span, similarities, picture completion) [73], Hopkins Verbal Learning Test-Revised [74], CLOX (executive clock drawing task) [75], Visual Form Discrimination Task [76], NART [68], S-word fluency and animal fluency [45], Story Recall (Adult Memory Information Processing Battery) [77], Bristol Activities of Daily Living scale (BADLS) [78], and Brief Assessment Schedule, Depression Cards (BASDEC) (screen for depression) [79]. By definition, all the cognitively healthy older adults performed at age-appropriate levels on all tests (i.e., z-score above -1.5). Individuals with a diagnosis of aMCI+ had self-reported and informant corroborated change in memory and objective decline (z scores equal or less than -1.5 in memory and at least one other area of function), in the absence of dementia and intact ability to perform activities of daily living. Exclusion criteria included past history of serious head injury, evidence of physical slowing (e.g., related to Parkinson’s disease or arthritis), stroke, and other significant neurological or psychiatric condition (see Phillips et al. [8] and [80, 81]). In total, 87 individuals took part in this research, 48 older adults with mild cognitive impairment and 39 cognitively healthy older adult controls1. The demographic details are shown in Table 1.
The cognitively healthy older adult and the aMCI+ groups did not differ significantly with respect to mean Age [Z = –1.65, p = 0.098] or mean Educational level [Z = –0.53, p = 0.6], indicating that attempts at matching these demographics between groups was successful. However, the NART score (level of pre-morbid intelligence) was significantly poorer for the aMCI+ compared to the cognitively healthy older adult group [Z = –3.3, p = 0.001]. As expected, MMSE score was significantly lower for the aMCI+ compared to the cognitively healthy older adult group [Z = –2.98, p = 0.003].
Experimental task and procedure
In a counter balanced procedure, the TMT (both Trails A and Trails B) and the visual search task (both target alone and target plus distracter conditions) were administered to all participants by a trained psychometrist. Testing took place within the Bristol Memory Disorders Clinic.
The pen and paper TMT
When administering Trails A, the psychologist provided the participants with a practice sheet as a way of visually explaining the task. Once the participants completed the practice sheet, they completed the full Trails A. For this task the participants were instructed to draw one continuous line joining a series of circled numbers in ascending order on a sheet a paper as fast as they could. They were given a maximum of 2 minutes to complete this task. Similarly for Trails B, participants were given a practice sheet and when happy with the instructions were asked to complete the full Trails B. The test required them to draw one continuous line joining a series of circled numbers and letters in ascending and alphabetical order on a sheet of paper as fast as they could. A time limit of 5 minutes is stipulated for this task. Scores are based on the number of seconds until completion and the participant’s age. If errors were made on either tasks participants are immediately informed and they are allowed to correct them. Errors like this were accounted for in the time to complete the task or if they failed to complete the task in the allotted time.
The computer-based Visual Search Task
The visual search task used was one employed in several previous studies by Tales and colleagues [8, 80, 81, see also 7], in which the time taken to respond to a target (namely to discriminate whether an arrow-head was pointing to the left or right) when it appeared in isolation upon the computer screen and the time taken to respond to the same target when it was surrounded by similar but irrelevant and distracting stimuli was determined. This paradigm was presented on a Toshiba Satellite-Pro lap top computer viewed at a distance of 57 cm. Superlab software (Cedrus Corporastion San Pedro, CA) was used to deliver stimulus presentation and response capture. This choice RT task included a black target, either a right or left-pointing arrow head; with participants required to indicate whether the arrow-head was pointing to the left or right. The distracting stimuli consisted of seven black arrow-heads pointing either up or down. A ‘clock-face’ configuration (see Fig. 1) was used to position the target, both when it appeared alone and when surrounded by seven distracters, in a counterbalanced arrangement in order to eliminate any visual field position-related differences in processing. The target appeared eight times at each of the possible ‘clock-face’ locations giving a total of sixty-four trials. Distracters were presented for half the trials. On each trial the central fixation cross appeared on screen for 1000 ms prior to the appearance of the target and remained on screen for the duration of the trial. The stimuli remained on screen until a response was made. Participants were instructed to fixate on the center cross at the beginning of each trial and to respond as quickly but as accurately as possible as to whether the target was pointing to the right or left by pressing one of two computer keyboard keys. After instruction, all participants were asked to explain the task to the researcher in order to demonstrate that they fully understood the task and then performed approximately 10 practice trials. The ability of the participants to fixate upon the central cross was checked at the beginning of each trial by researcher observation. The researcher was also in a position to record any lack of trial response and to prompt re-engagement of the task. Participants received no performance-feedback during testing.
DATA ANALYSIS AND RESULTS
Group mean analysis for RT speed was based on the mean values (of correct trials only) for each individual within the group. The mean response times for TMT, Trails A and B, and the mean RTs (ms) for the target alone and the target plus distracter search are displayed in Table 3, together with the corresponding standard deviation and standard error of the mean. Note that in the TMT, no participants exceeded the five-minute time limit. For the visual search tasks, only correct trials were included in the statistical analysis. Accuracy was high; the mean percentage of errors overall was low for both the cognitively healthy (3.2% ) and aMCI+ (4.6% ) groups with no evidence of speed accuracy trade off effects. No participants failed to respond to a trial and none required prompting.
In response to the generally non-normal distribution of our RT data (see Table 2, Figs. 2 and 3), SPSS non-parametric statistical analysis was employed in line with common practice.
Trails A & B response time analysis
For Trails A, analysis revealed no significant difference in group-mean response time (in seconds)between cognitively healthy aging and aMCI+ [Z = –1.4, p = 0.16]. Note, however, that whereas Trails A performance was normally distributed for the cognitively healthy older adult group, this was not the case for the aMCI+ group. Note also that multiple correlational analysis (with Bonferroni correction) failed to reveal any correlation of response time with age, education, NART score, or MMSE score in either group [all p-values >0.05].
For Trails B, mean response time was significantly slower in aMCI+ compared to cognitively healthy aging [Z = –1.96, p = 0.05; effect size (r) = 0.21]. For both groups, performance of Trails B was not normally distributed and multiple correlational analysis (with Bonferroni correction) failed to reveal any correlation of response time with age, education, NART score, or MMSE score in the older adult group[all p-values >0.05] and education, NART score, or MMSE score in the aMCI+ group [p-values >0.05], although performance of Trails B in the aMCI+ group was significantly correlated with age [r = 0.522, p < 0.001 which survives Bonferroni correction; p = 0.004].
Visual search target alone and target plus distracter reaction time analysis
Mean RT in response to the target alone Visual Search task was significantly slower for the aMCI+ compared to the cognitively healthy older adult group [Z = –2.8, p = 0.006; effect size (r) = 0.3]. For both groups RT was not normally distributed and was not significantly correlated with age, education, NART or MMSE scores [all p-values >0.05].
In response to the target plus distracters Visual Search task, mean RT was significantly slower for the aMCI+ compared to the cognitively healthy older adult group [Z = –3.5, p < 0.001; effect size = 0.38]. Although performance of this task was normally distributed for the cognitively healthy older adult group this was not the case for the aMCI+ group. RT was not significantly correlated with age, education, NART or MMSE scores [all p-values >0.05] in either group.
Gender
Males and females in the cognitively healthy older adult group did not differ significantly in mean response time for Trails A [Z = –0.745, p = 0.45] or B [Z = –1.32, p = 0.186], or in RT for the target alone [Z = –0.056, p = 0.96] or target plus distracters Visual Search tasks [Z = –0.787, p = 0.43].
In the aMCI+ group, there was no gender difference in target plus distracters Visual Search task [Z = –1.041, p = 0.298], Trails A [Z = –0.433, p = 0.665] or B [Z = –0.928, p = 0.353] performance. In response to the target alone Visual Search task, however, males were significantly faster than females [Z = –2.073, p = 0.038, effect size r = 0.3]. It is possible that this gender difference may be related to the greater educational level of males than females in this group [Z = –3.061, p = 0.002, effect size (r) = 0.44], further analysis revealed, however, that RT was not correlated with educational level [p > 0.05]. Note that in both groups there was no significant difference between males and females with respect to mean age, NART score, or MMSE score and no difference in educational level within the cognitively healthy older adult group [all p-values >0.05].
DISCUSSION
The TMT is sometimes used clinically to assess the speed of information processing in dementia, MCI, and related disorders, by measuring the time taken to complete the task of consecutively joining a series of numbers and or letters on a sheet of paper. However, in research terms, speed of information processing is generally described with respect to reaction time, i.e., the time elapsed between the relatively rapid presentation of a stimulus and the behavioral response, measured over a number of trials at relatively short intervals. Arguably, the processing involved in processing and responding to such rapid and repeated stimuli is different from that involved in performing the TMT, and we suggest that measuring RT may indeed be more akin to, ecologically valid or relevant with respect to the investigation of the integrity of information processing speed related to every day tasks which typically require rapid processing, decision making, andresponse.
However, although RT tests may, in theory, represent a clinically valid replacement of the TMT, we have not been able to identify any evidence investigating both measures in clinical populations. Here, therefore, we examined the performance of the TMT (both A and B versions) and two versions of a computer based multi-trial visual search-based RT task (a target alone and a target plus distracters condition) in the same groups of cognitively healthy older adults and patients with aMCI+, in an attempt to determine whether the visual search based RT tests can at least match the ability of the TMT to differentiate aMCI+ from cognitively healthy aging at group level. Secondly, as aMCI+ is a clinically heterogeneous group typically containing a proportion of individuals for whom aMCI+ represents the early stages of a dementing process, a proportion for whom it remains of unknown etiology and others for whom it is a temporary condition, we examined the ability of each test to provide intra-group variation in performance. As both disproportionately slower task-completion time and RT are related to the presence of dementia, one would expect to see some performance variability within the aMCI+ but not the cognitively healthy control group in both tests.
Trails A and B performance
Trails A performance failed to significantly differentiate aMCI+ from cognitively healthy aging at group level. Arguably this result is indicative of a lack of sensitivity of the Trails A test to the presence of MCI. Indeed the box plot (Fig. 2) reveals just how similar the results are for the patient and control groups. Furthermore, response time was normally distributed for the cognitively healthy older adult but not for the aMCI+ group (see Table 2). Given the etiological heterogeneity of aMCI+, in that at least a proportion of such individuals would be expected to be in the prodromal stages of dementia with an generally acknowledged accompanying slowing of response time, the relative lack of individual variability in response time within this group is surprising.
In contrast, Trails B performance significantly differentiated aMCI+ from cognitively healthy aging. As shown in Fig. 2, response time is clearly slowed for the aMCI+ compared to the control group and there are a number of individuals within the aMCI+ group whose performance is represented by clear outliers. This potentially represents the within-group heterogeneity one might expect from such an etiologically varied group. However, Trails B also reveals heterogeneity of performance within the cognitively healthy older adult group; indeed response time is not normally distributed in either group (see Table 2), with both characterized by some disproportionately slower reaction times and therefore some degree of performance overlap.
Visual search reaction time performance
The RT in response to the simple target alone visual search test was significantly slower in aMCI+ compared to cognitively healthy aging. However, as is clear from Fig. 3, RT was abnormally distributed for both groups, with a number of disproportionately slower responses, i.e., outliers characterizing both groups and thus indicative of some degree of overlap between cognitively healthy aging and aMCI+. Nevertheless, the effect size of the significant difference in performance between the two groups was greater than that for the Trails B test (effect size ‘r’ = 0.21 and 0.3), respectively.
For the target plus distracter visual search task, mean RT was significantly slower in aMCI+ compared to cognitively healthy aging. The effect size of this outcome (r = 0.38) was greater than that exhibited for the target alone search (r = 0.3) and the Trails B (r = 0.21) tasks, indicating that the target plus distracter visual search task is the one most sensitive to aMCI+. Furthermore, whereas the distribution of RT performance was normal within the cognitively healthy older adult group for the target plus distracter visual search task this was not the case for the aMCI+ group, revealing instead a number of considerably slower responses, i.e., outliers (see the Box plot in Figs. 2 and 3, and Table 2). There is, of course, once again some degree of overlap between performance in the control and the patient group and therefore not everyone with aMCI+ reveals slower mean RT compared to cognitively healthy aging. It appears rather that the aMCI+ group contains a greater proportion of individuals with disproportionately slower, responses. However, unlike Trails A, Trails B, and the simple target alone visual search RT task, the target plus distracter visual search RT task promotes outliers, i.e., disproportionately slowed responses only within the aMCI+ group. It may be the case that this RT task does not produce as many ‘false positives’ i.e., disproportionately poor performance within the control group, as does the target alone search RT task and the Trails B test. Note also that three individuals in the aMCI+ group are outliers in both the Trails B and the target plus distracter visual search RT test. This may indicate that for some people with aMCI+, both aspects of information processing speed are abnormal whereas for others only specific aspects of such processing are affected. If this is the case, changes over time in the profile of performance of an individual may be more useful than just testing one function. As suggested by Johnstone et al. [50], profile analysis is likely to assist in making differential diagnoses between cognitive disorders, and it may be the case that the identification of distinct deficit profiles of processing speed integrity and changes over time can better identify individuals’ cognitive strengths and weaknesses.
Although such disproportionate slowing within the aMCI+ group may be related to an increased risk of developing dementia (e.g., Phillips et al. [8]; Kochan et al. [10]), or represent a decline to dementia if such tests are administered to an individual over time, lack of follow up of all the participants in this study precludes us from making such an analysis. Such heterogeneity within the aMCI+ may, however, explain, at least in part, some of the disparity in RT outcome between previous studies, as slowing may be related to specific etiologies of aMCI+, only some of which have a neurodegenerative basis. Importantly, however, that a proportion of individuals with aMCI+ have very slow RTs, much beyond those associated with cognitively healthy aging, indicates that for some individuals processing related to continuous changes in the environment and situations in everyday life that require serial, rapid, and repeated detection, processing, and response can be significantly impaired. These effects are of potential importance irrespective of whether an individual with aMCI+ has the early stages of dementia or not.
Gender, age, education, IQ (NART), and MMSE
A gender-related difference in performance was evident only within the aMCI+ group. RT was significantly faster for males than females for the target alone visual search group. Although there was a significantly greater educational level for males than females in this group, which may have potentially contributed to this result, there was no significant correlation between educational level in either males or females and RT and it remains to be seen why a gender-related effect should be evident in the target alone visual search task RT only. Nevertheless this pattern of results indicates that within the same research groups, processing speed outcome and its relation to gender may be influenced by the test used, although one does have to consider that it may be a spurious effect.
In previous studies, TMT outcome has reportedly varied considerably with respect to whether or not performance is correlated with age and education (e.g., [41, 57]). In the present study we found that for the cognitively healthy older adult group, although initial analysis suggested some degree of correlation between Trails A performance speed and age, this did not survive Bonferroni correction for multiple correlational analysis; and performance was not significantly correlated with age per se for the aMCI+ group. It appears that over the relatively narrow range of ages within our data set this was a weak effect and one that only appears to occur in cognitively healthy aging. It may be the case that such a relationship occurs only when a wider range of ages is included. In contrast, although performance of Trails B was not significantly correlated with age in the control group, it was significantly correlated with age (surviving Bonferroni correction) in the aMCI+ group: a finding which if further research finds to be robust, may have implications for the interpretation of results over this age range. The finding that age is not similarly correlated with performance in both cognitively healthy aging and aMCI+ also breaks an assumption necessary for covariate analysis (if parametric analysis of RT data is attempted; another reason why we used non-parametric testing for our results). In contrast to Trails A and B, RT of both versions of the visual search task was not significantly correlated with age for either the cognitively healthy older adult or the aMCI+groups.
Performance of Trails A, B, and both versions of the visual search RT task was not significantly correlated with educational level for either the cognitively healthy older adult or the aMCI+ groups (although there was some evidence of a correlation for Trails A performance and education for the aMCI+ group it did not survive Bonferroni correction). Although the aMCI+ group had a significantly lower IQ (NART score), explained by the lower score for females compared to males in this group, performance of none of the four tasks was significantly correlated with IQ. Performance of TMT and both visual search tasks was not significantly correlated with MMSE (note however that for the aMCI+ group, Trails B was significantly correlated with MMSE score but again this did not survive Bonferroni correction).
There is therefore some room for debate about whether some relatively small effects of age and education and MMSE occur in relation to TMT and whether they differ with respect to group. However, such effects may be contingent upon the ranges of these factors within the groups (e.g., in wider or different ranges than those used in the present study) and dependent upon the numbers tested over each age range (i.e., related to the determination of normative data in which smaller numbers tend be tested for each age range and research studies in which a narrower range of measures are usually employed).
What is clear from the present study, however, is the lack of relationship between age, education, MMSE, IQ, and visual search based RT performance. This may indicate that such tests are less susceptible to, i.e., relatively independent of, the influence of age, education, and IQ upon performance [57, 82].
Potential study limitations
Unfortunately we were unable to follow up both groups in order to determine clinical outcome thus precluding analysis of whether those individuals with outlying response times and RTs in the aMCI+ group were most likely to develop dementia. Furthermore, interpretation of the results and thus their potential for impact is limited by the fact that we did not test performance repeatedly and over various time periods. Ideally we would have combined our behavioral tasks with an imaging study in order to determine the relationship between our RT and response speed results and structural and functional integrity both at group and individual level. We would have also explored the impact of methodological manipulations of RT tests such as time pressure, processing load, and various types of distraction in order to explore deficits in a wider range of information processingoperations.
Furthermore, we only measured response speed and RT in aMCI+; it would have been useful to determine the sensitivity of such tests to aMCI and to subjective cognitive decline, conditions that may represent lower stages on a continuum between health and dementia. Repeating this study with a larger sample size and wider range of demographic factors would allow further investigation in to the potential relationship between processing speed and RT and factors such as age, IQ, educational level, and level of cognitive impairment. Further research would also investigate a wider range of processing speed and RT tests typically used in research and clinically and in relation to factors such as practice effects.
Nevertheless, the very fact that the search tests seem more sensitive to aMCI+ than the Trails B tests and the fact that the search tests appear less affected by demographic factors than the TMT indicates that such tests have a place in clinical assessment.
Conclusions
These results indicate that as well as potential slowing in performance of the operations involved in the TMT used in clinical assessment, individuals with aMCI+ may also experience a substantial slowing of the rapid RT responses necessary for the safe, appropriate, and efficient environmental interaction required in real life; the importance of which is great irrespective of etiology. The results also suggest that RT tests typically used in research may be superior to the TMT in their ability to significantly differentiate between cognitively healthy aging and aMCI+ at group level and in revealing a heterogeneity of performance one would expect from an etiologically heterogeneous disorder such as aMCI+. These findings, together with evidence from previous studies regarding the relationship between RT and neurological status, indicates that RT tests should at least be included in the diagnosis and follow-up of cognitive impairment.
1 Please note that some of the participants included in this research were part of a larger cohort Phillips et al. [8] for whom both Trails A and Trails B and visual search RT1 and RT8 conditions were completed in full.
ACKNOWLEDGMENTS
BRACE-Alzheimer’s Research [registered charity number 297965] and Maggie Agg for assistance in participant recruitment.
Authors’ disclosures available online (http://j-alz.com/manuscript-disclosures/15-0791r2).
REFERENCES
[1] | Ferreira D , Molina Y , Machado A , Westman E , Wahlund L-O , Nieto A , Carreia R , Junqué C , Díaz-Flores L , Barroso J ((2014) ) Cognitive decline is mediated by gray matter changes during middle age. Neurobiol Aging 35: , 1086–1094. |
[2] | Salthouse TA ((1996) ) The processing-speed theory of adult age differences in cognition. Psychol Rev 103: , 403–428. |
[3] | Zimprich DM ((2002) ) Can longitudinal changes in processing speed explain longitudinal changes in fluid intelligence? Psychol Aging 17: , 690–695. |
[4] | Wahl HW , Schmitt M , Danner D , Coppin A ((2010) ) Is the emergence of functional ability decline in early old age related to change in speed of cognitive processing and also to change in personality? J Aging Health 22: , 691–712. |
[5] | Salthouse TA ((1994) ) The nature of the influence of speed on adult age-differences in cognition. Develop Psychol 30: , 240–259. |
[6] | Warkentin S , Erikson C , Janciauskiene S ((2008) ) rCBF pathology in Alzheimer’s disease is associated with slow processing speed. Neuropsychologia 46: , 1193–1200. |
[7] | Amieva H , Rouch-Leroyer I , Fabrigoule C , Daetigues JF ((2000) ) Deterioration of controlled processes in the preclinical phase of dementia: A confirmatory analysis. Dement Geriatr Cogn Disord 11: , 46–52. |
[8] | Phillips M , Rogers P , Haworth J , Bayer A , Tales A ((2013) ) Intra-individual reaction time variability in mild cognitive impairment and Alzheimer’s disease: Gender, processing load and speed factors. PLOS One 8: , e65712. |
[9] | Van Deursen JA , Vuurman EFPM , Smits LL , Verhey FRJ , Riedel WJ ((2009) ) Response speed, contingent negative variation and P300 in Alzheimer’s disease and MCI. Brain Cogn 69: , 592–599. |
[10] | Kochan N , Bunce D , Pont S , Slavin M , Reppermund S , Brodaty H , Crawford J , Mather K , Kang K , Sachdev P ((2013) ) Reaction-time measures predict incident dementia over 4 years: The Sydney Memory and Ageing Study. Alzheimers Dement 9: (Suppl), 536. |
[11] | Rosler A , Billino J , Muller NG , Weidauer S , Steinmetz H , Kleinschmidt A ((2005) ) Visual search in patients with subcortical vascular dementia: Short fixations but long reaction times. Dement Geriatr Cogn Disord 20: , 375–380. |
[12] | Duering M , Gesierich B , Seiler S , Pirpamer L , Gonik M , Hofer E , Jouvent E , Duchesnay E , Chabriat H , Ropele S , Schmidt R , Dichgans M ((2014) ) Strategic white matter tracts for processing speed deficits in age-related small vessel disease. Neurology 82: , 1946–1950. |
[13] | Jacobs HIL , Leritz EC , Williams VJ , Van Boxtel MPJ , van der Elst W , Jolles J , Verhey FRJ , McGlinchey RE , Milberg WP , Salat DH ((2013) ) Association between white matter microstructure, executive functions, and processing speed in older adults: The impact of vascular health. Hum Brain Mapp 34: , 77–95. |
[14] | Righart R , Duering M , Gonik M , Jouvent E , Reyes S , Hervé D , Chabriat H , Dichgans M ((2013) ) Impact of regional cortical and subcortical changes on processing speed in cerebral small vessel disease. Neuroimage Clin 2: , 854–861. |
[15] | Parikh M , Hynan LS , Weiner MF , Lacritz L , Ringe W , Cullum CM ((2014) ) Single neuropsychological test scores associated with rate of cognitive decline in early Alzheimer’s disease. Clin Neuropsychol 28: , 926–940. |
[16] | Caramelli P , Chaves ML , Engelhardt E , Machado JC , Schultz RR , Vale FA , Charchat-Fichman H ((2004) ) Effects of galantamine on attention and memory in Alzheimer’s disease measured by computerised neuropsychological tests: Results of the Brazilian multi-center galantamine study [GAL-BRA-01]. Arq Neuropsiquiatr 62: , 379–384. |
[17] | Edwards JD , Delahunt PB , Mahncke HW ((2009) ) Cognitive speed of processing delays driving cessation. J Gerontol A Sci Med Sci 64: , 1262–1267. |
[18] | Edwards JD , Bart E , O’Connor ML , Cissell G ((2010) ) Ten years down the road: Predictors of driving cessation. Gerontologist 50: , 393–399. |
[19] | Iwasa H , Kai I , Yoshida Y , Suzuki T , Kim H , Yoshida H ((2014) ) Information processing speed and 8-year mortality among community-dwelling elderly Japanese. J Epidemiol 24: , 52–59. |
[20] | Iwasa H , Gondo T , Yoshida Y , Kwon J , Inagaki H , Kawaai C , Masui Y , Kim H , Yoshida H , Suzuki T ((2008) ) Cognitive performance as a predictor of functional decline among the non-disabled elderly dwelling in a Japanese community: A 4-year population-based prospective cohort study. Arch Gerontol Geriatr 47: , 139–149. |
[21] | Welmer A-K , Rizzuto D , Qui C , Caracciolo B , Laukka EJ ((2014) ) Walking speed, processing speed, and dementia: A population-based longitudinal study. J Gerontol A Biol Sci Med Sci 69: , 1503–1510. |
[22] | Cumming TB , Brodtmann A , Darby D , Bernhardt J ((2012) ) Cutting a long story short: Reaction times in acute stroke are associated with longer term cognitive outcomes. J Neurol Sci 322: , 102–106. |
[23] | Reuter-Lorenz P , Park DC ((2010) ) Human neuroscience and the aging mind: A new look at old problems. J Gerontol B Psychol Sci Soc Sci 64B: , 405–415. |
[24] | Lu PH , Lee GJ , Tishler TA , Meghpara M , Thompson PM , Bartzokis G ((2013) ) Myelin breakdown mediates age-related slowing in cognitive processing speed in healthy elderly men. Brain Cogn 81: , 131–138. |
[25] | Ritchie SJ , Bates TC , Der G , Starr JM , Deary IJ ((2013) ) Education is associated with higher later life IQ scores but not with faster cognitive processing speed. Psychol Aging 28: , 515–521. |
[26] | Kerchner GA , Racine CA , Hale S , Wilheim R , Laluz V , Miller BL , Kramer JH ((2012) ) Cognitive processing speed in older adults: Relationship with white matter integrity. PLOS One 7: , e50425. |
[27] | Kochunov P , Coyle T , Lancaster J , Robin DA , Hardies J , Kochunov V , Bartzokis J , Royall D , Schlosser AE , Null M , Fox PT ((2010) ) Processing speed is correlated with cerebral health markers in the frontal lobes as quantified by neuroimaging. Neuroimage 49: , 1190–1199. |
[28] | Schneider KK , Schote AB , Meyer J , Markett S , Reuter M , Frings C ((2015) ) Individual response speed is modulated by variants of the gene encoding the alpha 4 sub-unit of the nicotinic acetylcholine receptor (CHRNA4). Behav Brain Res 284: , 11–18. |
[29] | Bartzokis G , Lu PH , Geschwind DH , Tingus K , Huang D , Mendez M , Edwards N , Mintz J ((2007) ) Apolipoprotein E affects both myelin breakdown and cognition: Implications for age-related trajectories of decline into dementia. Biol Psychiatr 63: , 1380–1387. |
[30] | Bartzokis G , Lu PH , Tingus K , Mendez MF , Richard A , Peters DG , Oluwadara B , Barrall KA , Finn JP , Villablanca P , Thompson PM , Mintz J ((2010) ) Lifespan transition of myelin integrity and maximum motor speed. Neurobiol Aging 31: , 1554–1562. |
[31] | Wolinsky FD , Vander Weg MW , Bryant Howren M , Jones MP , Dotson MM ((2013) ) A randomized controlled trial of cognitive training using a visual speed of processing intervention in middle aged and older adults. PLOS One 8: , e61624. |
[32] | Reitan RM , Wolfson D ((1993) ) The Halstead-Reitan neuropsychological test battery: Theory and clinical interpretations. Neuropsychology Press, Tuscon, AZ. |
[33] | Tombaugh TN ((2004) ) Trail Making Test A and B: Normative data stratified by age and education. Arch Clin Neuropsychol 19: , 203–214. |
[34] | Hagen K , Ehlis AC , Haeussinger FB , Heinzel S , Dresler T , Mueller LD , Herrmann MJ , Fallgatter AJ , Metzger FG ((2014) ) Activation during the Trail Making Test measured with functional near-infra-red spectroscopy in healthy elderly subjects. Neuroimage 85: , 583–591. |
[35] | Salthouse TA ((2011) ) What cognitive abilities are involved in trail-making performance? Intelligence 39: , 222–232. |
[36] | Müller LD , Guhn A , Zeller JBM , Biehl SC , Dresler T , Hahn T , Fallgatter AJ , Polak T , Deckert J , Herrmann MJ ((2014) ) Neural correlates of a standardized version of the trail making test in young and elderly adults: A functional near-infra-red spectroscopy study. Neuropsychologia 56: , 271–279. |
[37] | Rabin LA , Barr WB , Burton LA ((2005) ) Assessment practices of clinical neuropsychologists in the united states and Canada: A survey of INS, NAN, and APA Division 40 members. Arch Clin Neuropsychol 1: , 33–65. |
[38] | Schmid NS , Ehrensperger MM , Berres M , Beck IR , Monsch AU ((2014) ) The extension of the German CERAD Neuropsychological assessment battery with tests assessing subcortical, executive and frontal functions improves accuracy in dementia diagnosis. Dement Geriatr Cogn Dis Extra 4: , 322–334. |
[39] | Lezak MD ((1995) ) Neuropsychological Assessment. Oxford University Press, New York Oxford. |
[40] | Sofko C , Boettcher A , Hoadley R , Hil B ((2014) ) Differential rates of age-related decline on Trail Making tests. Arch Clin Neuropsychol 29: , 511. |
[41] | Bezdicek O , Motak L , Axelrod BN , Preiss M , Nikolai T , Vyhnalek M , Poreh A , Ruzicka E ((2012) ) Czech version of the trail making test: Normative data and clinical utility. Arch Clin Neuropsychol 27: , 906–914. |
[42] | Baudic S , Dalla Barba G , Thibaudet MC , Smagghe A , Remy P , Traykov L ((2006) ) Executive function deficits in early Alzheimer’s disease and their relations with episodic memory. Arch Clin Neuropsychol 21: , 15–21. |
[43] | Boyle PA , Cohen RA , Paul R , Moser D , Gordon N ((2002) ) Cognitive and motor impairments predict functional declines in patients with vascular dementia. Int J Geriatr Psychiatry 17: , 164–169. |
[44] | Barr A , Benedict R , Tune L , Brandt J ((1992) ) Neuropsychological differentiation of Alzheimer’s disease from vascular dementia. Int J Geriatr Psychiatry 7: , 621–627. |
[45] | Spreen O , Strauss E ((1998) ) A Compendium of Neuropsychological Tests, Oxford University Press, Oxford. |
[46] | Mendez MF , Cherrier MM , Perryman KM ((1997) ) Differences between Alzheimer’s disease and vascular dementia on information processing measures. Brain Cogn 34: , 301–310. |
[47] | Yuspeh RL , Vanderploeg RD , Crowel TA , Mullan M ((2002) ) Differences in executive functioning between Alzheimer’s disease and subcortical ischemic vascular dementia. J Clin Exp Neuropsychol 24: , 745–754. |
[48] | Greenlief CL , Margolis RB , Erker GJ ((1985) ) Application of the Trail Making Test in differentiating neuropsychological impairment of elderly persons. Percept Mot Skills 61: , 1283–1289. |
[49] | Paul R , Moser D , Cohen R , Browndyke J , Zawacki T , Gordon N ((2001) ) Dementia severity and pattern of cognitive performance in vascular dementia. Appl Neuropsychol 8: , 211–217. |
[50] | Johnstone B , Hogg JR , Schopp LH , Kapila C , Edwards S ((2002) ) Neuropsychological deficit profiles in senile dementia of the Alzheimer’s type. Arch Clin Neuropsychol 17: , 273–281. |
[51] | Nestor PG , Parasuraman R , Haxby JV ((1991) ) Speed of information processing and attention in early Alzheimer’s dementia. Dev Neuropsychol 7: , 243–356. |
[52] | Rasmusson XD , Zonderman AB , Kawas C , Resnick SM ((1998) ) Effects of age & dementia on the Trail Making Test. Clin Neuropsychol 12: , 169–178. |
[53] | Classen S , Wang Y , Winter SM , Velozo CA , Lanford DN , Bédard M ((2013) ) Concurrent criterion validity of the safe driving behavior measure: A predictor of on-road driving outcomes. Am J Occup Ther 67: , 108–116. |
[54] | Pillon B , Gouider-Khouja N , Deweer B , Vidailhet M , Malapani C , Dubois B , Agid Y ((1995) ) Neuropsychological pattern of striatonigral degeneration: Comparison with Parkinson’s disease and progressive supranuclear palsy. J Neurol Neurosurg Psychiatry 58: , 174–179 . |
[55] | Schmid N ((2013) ) Neuropsychological signs of Alzheimer’s disease 8 years prior to diagnosis. J Alzheimers Dis 34: , 537–546. |
[56] | Lee H , Baniqued PL , Cosman J , Mullen S , McAuley E , Severson , Kramer AF ((2012) ) Examining cognitive function across the lifespan using a mobile application. Comp Hum Behav 28: , 1934–1946. |
[57] | Ptotek W , tyskawa W , Kluzik A , Grześkowiak M , Podlewski R , Żaba Z , Drobnik L ((2014) ) Evaluation of the trail making test and interval timing as a measures of cognition in healthy adults: Comparisons by age, education, and gender. Med Sci Monit 20: , 173–181 . |
[58] | Cangoz B , Karakoc E , Selekler K ((2009) ) Trail making test: Normative data for Turkish elderly population by age, sex and education. J Neurol Sci 283: , 73–78. |
[59] | Ashendorf L , Jefferson AL , O’Connor MK , Chaisson C , Green RC , Stern RA ((2008) ) Trial making test errors in normal aging, mild cognitive impairment, and dementia. Arch Clin Neuropsychol 23: , 129–137. |
[60] | Seo EH , Lee DY , Kim KW , Lee JH , Jhoo JH , Youn JC , Choo IH , Ha J , Woo JI ((2006) ) A normative study of the Trail Making Test in Korean elders. Int J Geriatr Psychiatry 21: , 844–852. |
[61] | Liu Y , Julkunen V , Paajanen T , Westman E , Wahlund L-O , Aitken A ((2012) ) Education increases reserve against Alzheimer’s disease-evidence from structural MRI analysis. Neurorad 54: , 929–938. |
[62] | Corrigan JD , Hinkeldey NS ((1987) ) Relationships between parts A and B of the Trail Making Test. J Clin Psychol 43: , 402–409. |
[63] | Lu P , Lee G , Raven E , Tingus K , Khoo T , Thompson PM , Bartzokis G ((2011) ) Age-related slowing in cognitive processing speed is associated with myelin integrity in a very healthy elderly sample. J Clin Exp Neuropsychol 33: , 1059–1068. |
[64] | Der G , Deary IJ ((2006) ) Age and sex differences in reaction time in adulthood: Results from the United Kingdom Health and Lifestyle Survey. Psychol Ageing 21: , 62–73. |
[65] | Dykiert D , Der G , Starr JM , Deary IJ ((2012) ) Sex differences in reaction time mean and intraindividual variability across the lifespan. Dev Psychol 48: , 1262–1276. |
[66] | Roivainen E ((2011) ) Gender differences in processing speed: A review of recent research. Learn Individ Differ 21: , 145–149. |
[67] | Mitrushina M , Boone K ((2005) ), Handbook of normative data for neuropsychological assessment, Oxford University Press, New York. |
[68] | Nelson HE , Willison JR ((1991) ) National Adult Reading Test (NART). Test manual including new data supplement, NFER-NELSON, Windsor. |
[69] | Dykiert D , Deary IJ ((2013) ) Retrospective validation of WTAR and NART scores as estimators of prior cognitive ability using the Lothian Birth Cohort 1936. Psychol Assess 25: , 1361–1366. |
[70] | van Deursen JA , Vuurman EFPM , Smits LL , Verhey FRJ , Riedel WJ ((2009) ) Response speed, contingent negative variation and P300 in Alzheimer’s disease and MCI. Brain Cogn 69: , 592–599. |
[71] | Levinoff E , Saumier D , Chertkow H ((2005) ) Focused attention deficits in patients with Alzheimer’s disease and mild cognitive impairment. Brain Cogn 57: , 127–130. |
[72] | Folstein MF , Folstein SE , McHugh PR ((1975) ) Mini-mental state: A practical method for grading the cognitive state of patients for the clinician. J Psychiatr Res 12: , 189–198. |
[73] | Wechsler D ((1998) ) Adult Intelligence Scale-III. The Psychological Corporation, London, UK. |
[74] | Brandt J ((1991) ) The Hopkins Verbal Learning Test: Development of a new memory test with six equivalent forms. Clin Neuropsychol 5: , 125–142. |
[75] | Royall DR , Cordes JA , Polk M ((1988) ) An executive clock drawing task. J Neurol Neurosurg Psychiatry 64: , 588–594. |
[76] | Benton AL , Sivan AB , Hamshere KD , Varney NR , Spreen O ((1994) ) Visual Form Discrimination Test. Contributions to Neuropsychological Assessment, 2nd ed, Oxford University Press, Oxford. |
[77] | Coughlan AK , Hollows S ((1995) ) The adult memory and information processing battery. St. James University Hospital, Leeds, UK. |
[78] | Bucks RS , Ashworth DL , Wilcock GK , Siegfried K ((1996) ) Assessment of activities of daily living in dementia: Development of the Bristol Activities of Daily Living Scale. Age Ageing 25: , 113–120. |
[79] | Adshead F , Cody DD , Pitt B ((1992) ) BASDEC: A novel screening instrument for depression in elderly medical inpatients. BMJ 305: , 397. |
[80] | Tales A , Bayer AJ , Haworth J , Snowden RJ , Philips M , Wilcock G ((2011) ) Visual search in mild cognitive impairment: A longitudinal study. J Alzheimers Dis 24: , 151–160. |
[81] | Tales A , Haworth J , Nelson S , Snowden R , Wilcock G ((2005) ) Abnormal visual search in mild cognitive impairment in Alzheimer’s disease. NeuroCase 11: , 80–84. |
[82] | Rabbitt P , Osman P , Moore B ((2001) ) There are stable individual differences in performance variability, both from moment to moment and from day to day. Q J Exp Psychol A 54A: , 981–1003. |
Figures and Tables
Fig.1
Schematic of the visual search task: target alone and target plus distracter conditions.
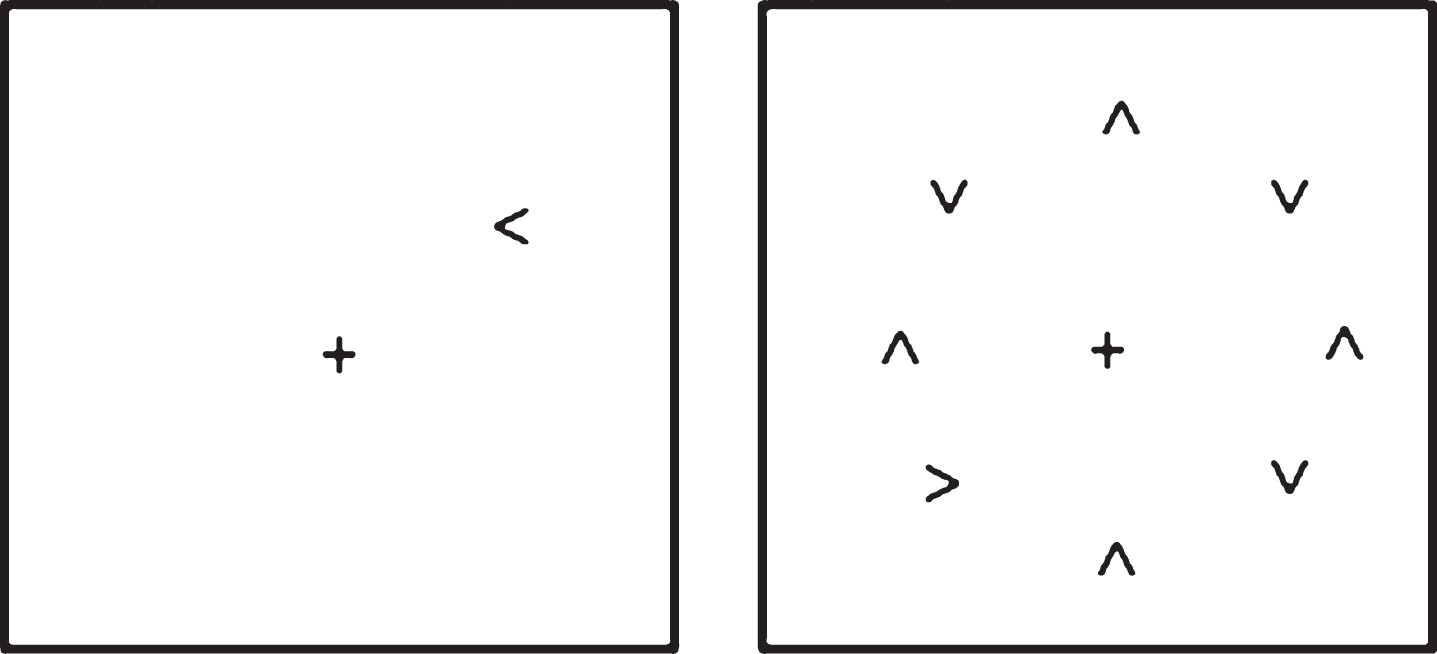
Fig.2
BOX plot of Trails A and B performance based on individual response speed (seconds).
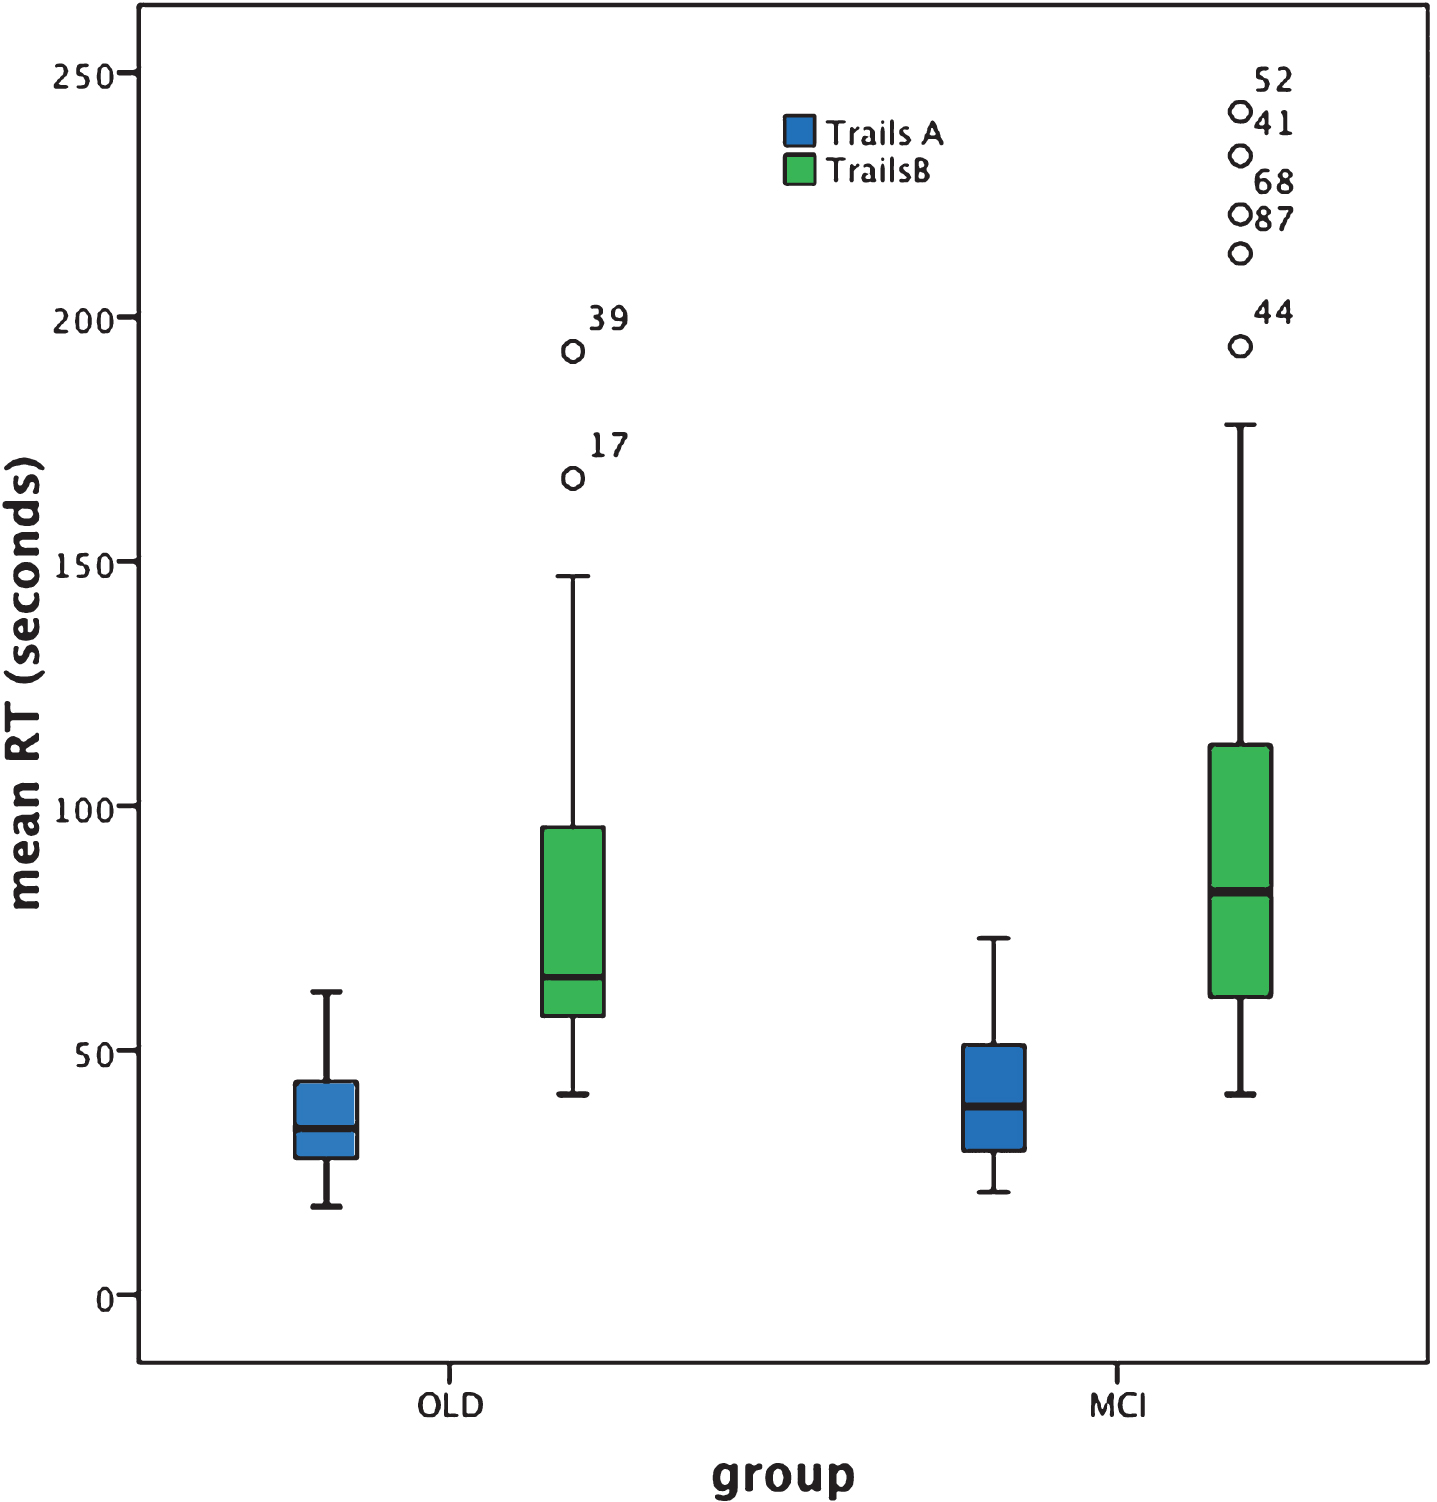
Fig.3
Box plot for target alone (RT1) and target plus distracters search (RT8) performance based on individual reaction time (RT) (ms).
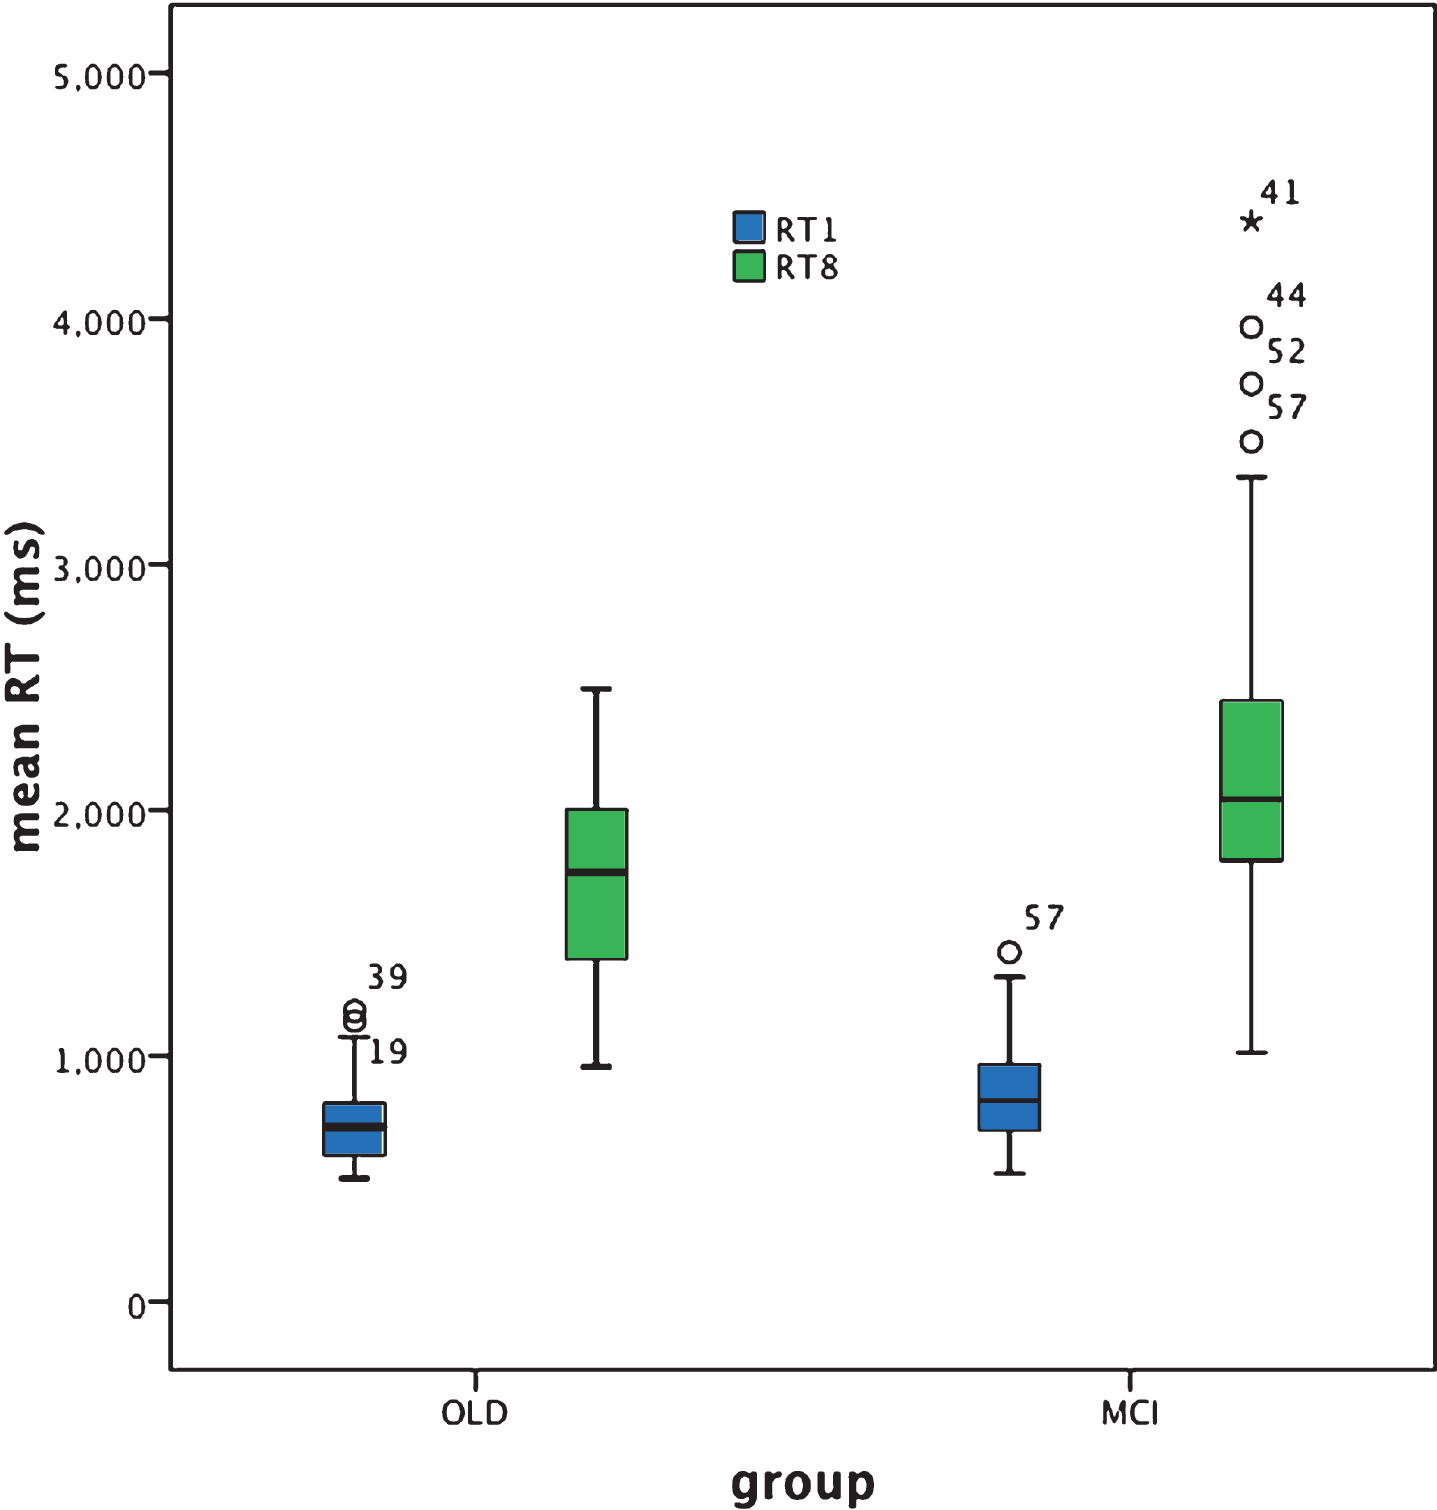
Table 1
Demographic details
| Education | Age | NART | MMSE | ||
| Cognitively healthy older adults (n = 39) | Mean | 14.56 | 70.5 | 118.3 | 27.1 |
| SD | 3.1 | 8.3 | 8.1 | 1.5 | |
| SEM | 0.49 | 1.3 | 1.3 | 0.2 | |
| aMCI+ (n = 48) | Mean | 14.4 | 67.6 | 111.8 | 25.9 |
| SD | 3.72 | 8.6 | 16.6 | 1.8 | |
| SEM | 0.54 | 1.2 | 2.4 | 0.25 |
Table 2
Normality of distribution (Shapiro Wilkes test)
| OLD | aMCI+ | |||||
| statistic | df | Sig. | statistic | df | Sig | |
| Age | 0.939 | 39 | 0.036 | 0.941 | 48 | 0.017 |
| Education | 0.953 | 39 | 0.104 | 0.911 | 48 | 0.002 |
| NART | 0.924 | 39 | 0.012 | 0.764 | 48 | 0.000 |
| MMSE | 0.950 | 39 | 0.085 | 0.932 | 48 | 0.008 |
| Search: target alone | 0.911 | 39 | 0.005 | 0.944 | 48 | 0.022 |
| Search: target &distracters | 0.949 | 39 | 0.077 | 0.911 | 48 | 0.001 |
| Trails A | 0.973 | 39 | 0.459 | 0.942 | 48 | 0.019 |
| Trails B | 0.833 | 39 | 0.000 | 0.822 | 48 | 0.000 |
Table 3
Mean response times (s) for the TMT (Trails A and B) and the mean RTs (ms) for the target alone and the target plus distracter visual search tasks, together with the corresponding standard deviation (SD) and standard error of the mean (SEM)
| Trails A Mean response time (s) | Trails B Mean response time (s) | Search Target alone Mean RT (ms) | Search Target &distracters Mean RT (ms) | ||
| Healthy older adult controls | 35.9 | 78.7 | 744.2 | 1730.6 | |
| SD | 10.4 | 34.7 | 172.9 | 402.9 | |
| SEM | 1.7 | 5.6 | 27.7 | 64.5 | |
| aMCI+ | 40.6 | 98.2 | 861.1 | 2230.4 | |
| SD | 13.8 | 51.6 | 209.2 | 709.9 | |
| SEM | 2.0 | 7.5 | 30.2 | 102.5 |

