
Protein Kinase Activity Decreases with Higher Braak Stages of Alzheimer’s Disease Pathology
Abstract
Alzheimer’s disease (AD) is characterized by a long pre-clinical phase (20–30 years), during which significant brain pathology manifests itself. Disease mechanisms associated with pathological hallmarks remain elusive. Most processes associated with AD pathogenesis, such as inflammation, synaptic dysfunction, and hyper-phosphorylation of tau are dependent on protein kinase activity. The objective of this study was to determine the involvement of protein kinases in AD pathogenesis. Protein kinase activity was determined in postmortem hippocampal brain tissue of 60 patients at various stages of AD and 40 non-demented controls (Braak stages 0-VI) using a peptide-based microarray platform. We observed an overall decrease of protein kinase activity that correlated with disease progression. The phosphorylation of 96.7% of the serine/threonine peptides and 37.5% of the tyrosine peptides on the microarray decreased significantly with increased Braak stage (p-value <0.01). Decreased activity was evident at pre-clinical stages of AD pathology (Braak I-II). Increased phosphorylation was not observed for any peptide. STRING analysis in combination with pathway analysis and identification of kinases responsible for peptide phosphorylation showed the interactions between well-known proteins in AD pathology, including the Ephrin-receptor A1 (EphA1), a risk gene for AD, and sarcoma tyrosine kinase (Src), which is involved in memory formation. Additionally, kinases that have not previously been associated with AD were identified, e.g., protein tyrosine kinase 6 (PTK6/BRK), feline sarcoma oncogene kinase (FES), and fyn-associated tyrosine kinase (FRK). The identified protein kinases are new biomarkers and potential drug targets for early (pre-clinical) intervention.
INTRODUCTION
Alzheimer’s disease (AD) is an irreversible, progressive neurodegenerative disorder and the most prevalent form of dementia. Memory loss and cognitive decline due to synaptic failure and neuronal death are clinical symptoms of AD. The disease is further characterized by a long pre-clinical phase (20–30 years), during which significant brain pathology manifests itself [1, 2]. The identification of causative genes and risk factors as well as the characterization of clinical and pathological features of AD during the last 25 years support the existence of a long pre-clinical phase. However, the disease mechanisms involved in the early stages of AD pathology remain elusive.
The modification of proteins by reversible phosphorylation is a key mechanism in the regulation of a large number of physiological processes. Abnormal protein kinase activity can cause diseases by altering the phosphorylation of those proteins that are critical for normal cellular and metabolic processes. The level of protein phosphorylation is controlled by the opposing activities of protein kinases and phosphatases. Accumulating evidence reveals a role of protein kinases in the brains of AD patients [3]. Protein kinases such as glycogen synthase kinase 3β (GSK3β), p25/Cyclin-dependent kinase 5 (Cdk5), dual-specific tyrosine regulated kinase 1A (Dyrk1A), and mitogen-activated protein kinases (MAPKs) increase in activity and/or expression, while protein kinases such as protein kinase C (PKC) and protein kinase A (PKA) decrease in activity [4]. An increasing number of studies support a role of aberrant protein phosphorylation in the progression of AD, by the altering of cellular processes such as subcellular localization, ligand binding, protein folding, and protein-protein interaction. For example, both hyperphosphorylation of tau and amyloid-β (Aβ) production contribute to AD pathology [3, 5, 6]. However, most studies focus on the changes in activity or phosphorylation of a single protein kinase. So far, overall changes in protein kinase activity in human brain tissue during the progression of AD have not been investigated. Changes in the phosphorylation state of proteins, which are independent of changes in total expression level, will provide insights into molecular pathways and mechanisms such as synaptic transmission and neuroplasticity [7].
The objective of this study was to determine the changes in protein kinase activity during AD pathogenesis. To that end, frozen hippocampal brain sections were selected from patients in all stages of AD and in non-demented controls (Braak stages 0-VI; N = 100) and the protein kinase activities were determined using a peptide-based microarray platform (PamChip ®). This platform allows for the investigation of protein kinase activity of small amounts (μL) of protein lysates by monitoring changes in phosphorylation of the peptides on the arrays [8–10].
The results revealed an overall decrease in protein kinase activity; a decrease was already evident at early stages of the disease (Braak I-II), i.e., at a point in time preceding the clinical manifestation of AD. The phosphorylation of 139 Serine/Threonine (STK) peptides and 54 Tyrosine (PTK) peptides (out of 142 peptides each) was decreased significantly (p-value <0.01). Using the STRING online database, a network of kinases implicated in AD were identified, e.g., Ephrin receptor A1 (EphA1), a risk gene for AD [11, 12], and sarcoma tyrosine kinase (Src), a synaptic kinase involved in memory formation [13, 14]. Additionally, protein kinases that have not yet been linked to AD pathology were found, such as protein tyrosine kinase 6 (PTK6/BRK) and fyn-associated tyrosine kinase (FRK) with STRING protein-protein network analysis and pathway analysis.
MATERIALS AND METHODS
Case selection
Human brain tissue was obtained from the Netherlands Brain Bank (NBB, Amsterdam, The Netherlands). Prior to death, all donors gave written informed consent in accordance with the Declaration of Helsinki for the use of their brain tissue and medical records for research purposes. This study was approved by the ethics committee of the NBB. Dementia status at death was determined on the basis of clinical information available during the last year of life. Neuropathological diagnosis was performed using histochemical stainings (hematoxilin and eosin, periodic acid Schiff-Luxol fast blue). Analysis of formalin-fixed, paraffin-embedded tissue from different parts of the brain, including the frontal cortex (F2), temporal pole cortex, parietal cortex (superior and inferior lobule), occipital pole cortex and the hippocampus (essentially CA1 and entorhinal area of the parahippocampal gyrus) was performed. Hippocampus and cortical areas were stained with methenamine silver [15], and Gallyas silver staining was used for neurofilament proteins. Immunohistochemistry was performed using antibodies raised against hyperphosphorylated tau (AT8) and Aβ (1–17, Dako [16]). Staging of AD pathology was evaluated according to modified assessment of Braak and Alafuzoff [17]. Severity of dementia was measured using the Global Deterioration Scale of Reisberg (GDS) [18]. Cases with and without clinical neurological disease diagnosis were processed identically. Patients with co-morbidities like Parkinson’s disease, frontotemporal dementia (FTLD), or dementia with Lewy bodies were excluded from the study. In total, 60 patients with confirmed AD and 40 non-demented controls were included, with a median age at death of 84 years for women and 79 years for men (Table 1). Age, gender, clinical diagnosis, pH of the cerebrospinal fluid (CSF), and Braak score for neurofibrillary tangles of all cases used in this study are listed in Supplementary Table 1. Postmortem delay (PMD) of all cases was between 2.5 and 15.5 hours with a median of less than 6 hours.
Preparation of brain tissue lysates
Twenty 10μm-thick frozen hippocampal tissue slices were taken from the hippocampus containing the subiculum and CA1-4 region. The hippocampal region was routinely divided into 5 parts from anterior to posterior at autopsy. We used the middle region (3) at the level of the corpus geniculatum laterale. Sections contained the hippocampal formation including the entorhinal region. All samples were obtained in the same medical center following a strict standardized protocol. Sections were cut and lysed at 0 °C using M-PER (Mammalian Protein Extraction Reagent, Thermo Scientific, MA, USA) lysis buffer (0.1 g/ml) containing Protease Inhibitor Cocktail (Roche, Basel, Switzerland) and Phosphatase Inhibitor Cocktail (Roche, Basel, Switzerland). After centrifugation (10 min, 4 °C, 10.000× g), the pellet was washed and re-centrifuged. The supernatants were pooled, snap frozen in 100μl aliquots and stored at –80 °C. The protein concentration was determined using the Bradford Lowry Assay (Bio-Rad Protein Assay) with bovine serum albumin (BSA) as the standard. Lysates are very susceptible to freeze-thawing which can result in up to 30% loss of kinase activity [10, 19]. Therefore, frozen aliquots were never re-frozen, but used directly for kinase activity determination.
Protein kinase activity profiling
Kinase activity profiles were determined using the PamChip ® 96 serine/threonine (STK) and protein tyrosine (PTK) peptide microarray system from PamGene International B.V. (‘s-Hertogenbosch, The Netherlands) according to the instructions of the manufacturer, as described previously [8, 19–21].
The PamChip ® 96 contains 96 identical arrays grouped on 24 strips each containing 4 arrays. Each array is pre-printed with either 142 tyrosine or serine/threonine containing peptides (13 amino acids long) derived from known human phosphorylation sites. The peptides are covalently attached to a porous matrix via a spacer. Brain tissue lysates are pumped up and down through the porous array in the presence of ATP to facilitate the phosphorylation of peptides by protein kinases in the lysates. The optimal sample input was determined by testing a concentration range for three out of the 100 samples.
In order to minimize the variation between plates, all PamChip ® 96 array plates used in this study came from the same production batch and all plates were run on the same PamStation instrument. The experimental design resulted in a total of 14 STK and 14 PTK plates with a minimum of 6 technical replicates per plate. The term technical replicate refers to identical samples from the same patient using the same assay mixture but different arrays. Early and late Braak stages were distributed evenly over the 96 array plates. Several samples were analyzed on more than one plate to allow assessment of variation between experimental runs. For technical reasons, one sample was excluded from the analysis of the STK arrays (TIS138 (Braak II) and 97 samples were analyzed on the PTK arrays (excluded: TIS138 (Braak II), TIS156 (Braak V) and TIS141 (Braak VI)).
The arrays on the PamChip ® 96 STK plate were incubated with Odyssey blocking buffer (LI-COR Biosciences, Lincoln, Nebraska, USA) for 30 cycles (15 min) to prevent non-specific binding. Plates were washed three times with kinase assay buffer (50 mM Tris-HCl pH 7.5, 10 mM MgCl2, 1 mM EGTA, 2 mM DTT, 0.01% Brij35). The reaction mixture contained 0.01 % BSA in kinase assay buffer supplemented with anti-phospho-Ser/Thr antibodies (PamGene International BV [19]). All reaction mixtures contained 0.5% DMSO in a total assay volume of 40μl. For each STK assay, 0.5μg of protein was used, and the enzymatic assay was started by adding ATP (final concentration 100μM; Sigma-Aldrich, St. Louis, MO, USA). The incubation mixture was pumped up and down through the porous membrane for 60 cycles (in total 30 min). After washing of the arrays, they were incubated for 60 min with a secondary antibody (polyclonal swine anti-rabbit Immunoglobulin/FITC). Table 2 provides details about the antibodies. Images at 50 ms exposure time were captured every 10 min with an integrated CCD-based optical system in combination with Evolve software (version 1.5, PamGene International BV). After removal of the secondary antibody and a wash step, post-wash images were taken at different exposure times (20, 50, 100, and 200 ms).
The PTK assay mixture contained the same kinase assay buffer, 100μM ATP and 0.01% BSA, supplemented with 4μl protein kinase (PK)-additive (PamGene International BV), 10 mM Dithiothreitol (DTT, Fluka, Sigma-Aldrich, St. Louis, MO, USA) and fluorescein isothiocyanate (FITC) labeled anti-phosphotyrosine antibody ((PamGene International BV, ‘s-Hertogenbosch, The Netherlands). For each PTK assay, 7.5μg of protein was used. Since a labeled antibody is present in the PTK assay mixture, peptide phosphorylation was monitored during the incubation with assay mixture, by taking images every 5 min at 50 ms exposure time, allowing real time recording of the reaction kinetics (one-step reaction). After washing of the array, fluorescence was detected at different exposure times (20, 50, 100, and 200 ms).
Signal quantification
The fluorescent signal intensity for each peptide was analyzed using BioNavigator 6.1 software (PamGene International BV, ‘s-Hertogenbosch, The Netherlands) a statistical analysis and visualization software tool with an App-based infrastructure (https://www.pamgene.com/en/bionavigator.htm). For signal quantification, the slope of the fluorescent signal versus exposure time was calculated in order to increase the dynamic range and to filter out time differences between plates. Saturated signals were excluded. Visual quality control was performed to exclude defective arrays from the analysis.
Reproducibility of sample preparation
In order to establish the reproducibility and robustness of the sample preparation and the kinase profiling method, nineteen of the one hundred cases were cut again, lysed and both tyrosine and serine/threonine activities were determined. The phosphorylation profiles for the two N = 19 datasets were compared (Fig. 2). For each peptide, the signal intensity was expressed with respect to the mean signal for the 19 samples. This centering step was used to account for differences in sample input and experimental differences.
Statistical analysis
The chip design resulted in fluorescent data with a complex correlation structure. In a prior study, the plate-to-plate, strip-to-strip (within a plate) and array-to-array (within a strip) variability had been determined. We developed a linear mixed-effects model that analyzed the signals of all peptides jointly while taking the correlation structure into account, thus enabling proper inference on the fixed effects of interest, i.e., the difference in signal strength per Braak stages for each peptide.
We modeled the change of log(signals) over log(time). The obtained STK and PTK median kinase signal intensities were analyzed without correction for the local background in order to avoid additional variability in the signal measurements. The model included common effects (for all peptides) and peptide-specific plate, strip and array random effects, with strip nested in the plate and the array nested in the strip and the plate. The measurement error was modeled using a peptide-specific variance component covariance matrix that allowed for heterogeneous variances among exposure time points.
STRING protein-protein interaction analysis
The Search Tool for Retrieval of Interacting Genes/Proteins (STRING) database (http://string-db.org) was used to construct a protein-protein interaction (PPI) network. In order to keep the PPI network readable, a sub-selection of the most significant peptides was made (p-value corrected for multiple testing <10–10, Supplementary Table 2). Those peptides (N = 122) were traced back to their corresponding protein of origin by using Basic Local Alignment Search Tool (BLAST; http://blast.ncbi.nlm.nih.gov/Blast.cgi) software. UniProtID’s of the proteins of origin (100% identity) were included in the protein data set. After removal of duplicated UniProtIDs, 107 unique UniProtIDs remained and were entered into the STRING database. The settings “multiple names” and organism “Homo sapiens” were selected. For “interactors wanted” the option “proteins” was chosen. Known and predicted associations were scored and integrated, resulting in a comprehensive protein network (Fig. 3) [22].
Pathway analysis
MetaCoreTM from Thomson Reuters was used for pathway analysis. The same dataset as for the STRING analysis (107 UniProtIDs) was used as input. UniProtIDs are mapped onto pathways that are constructed from curated literature data. The top 50 pathways were then grouped according to processes indicated in the pathway name.
Identification of upstream kinases
The upstream protein kinases able to phosphorylate residues in peptides on the PTK and STKarrays were identified in the Human Protein ReferenceDatabase (http://www.hprd.org) [23], in Phosphosite(http://www.phosphosite.org) and Reactome (http://www.reactome.org) [24]. These kinases were projected on the kinase phylogenetic tree using the Kinome Render tool (http://bcb.med.usherbrooke.ca/kinomerender.php). When databases used different names to indicate a kinase, the kinase names were converted to those used in Kinome Render via their UniProtID. For kinases linked to multiple UniProtIDs, only the ID used in the Kinome Render tool was retained.
RESULTS
A large cohort (N = 100) of AD patients in all Braak stages (n = 60) and non-demented controls (n = 40) was selected for this study (Table 1). All human hippocampal brain samples originated from the same medical center. Possible confounding factors are listed in Supplementary Table 1. No significant correlations were found between those factors. We observed a downward trend with increasing Braak stage for pH of the CSF (R2 = 0.176) and for brain weight (R2 = 0.314) (data not shown).
Decreased protein kinase activity was observed at early stages of AD
For 100 well-characterized cases of patients with AD and non-demented controls (CON) at all different stages (Braak 0-VI), freshly frozen hippocampal brain tissue extracts were prepared and protein kinase activity was determined using the serine/threonine kinase (STK) and protein tyrosine kinase (PTK) PamChip ® arrays (see Supplementary Table 1 and Supplementary Figure 3). All brain tissue samples showed protein kinase activity (Supplementary Figure 3). The experimental workflow is represented in Supplementary Figure 1. The mean value per peptide for each sample was calculated, and the data was visualized in a heatmap (Supplementary Figure 3). Peptides were sorted by the signal intensity per peptide for the first sample (highest intensity on top, TIS140, Braak 0). The mean signal intensity per Braak stage was calculated (Fig. 1).
As a result of nonspecific binding, the background of the PTK array was higher because a 15-fold greater protein concentration (for PTK 7.5μg protein per array, for STK 0.5μg/array) is required compared to the STK assay. This could indicate that brain extracts contain more STK kinase activity than PTK kinase activity. It is also known that STK phosphorylation is more abundant (98% ) than tyrosine phosphorylation, which accounts for less than 2% of the kinome [25].
Decreased phosphorylation was observed for AD (Braak VI) compared to controls (Braak I) in both the STK and the PTK assays (Fig. 1 and Supplementary Figures 2 and 3). The overall signal intensities of the STK arrays were higher (Fig. 1A, B) than of the PTK arrays (Fig. 1C, D). No phosphorylation signal was visible in the absence of ATP (Supplementary Figure 2). For each sample, the signal intensities for STK and PTK arrays did not correlate with each other (R2 = 0.052), e.g., a high signal intensity on the STK chip does not imply high signal intensity on the PTK chip as well.
To investigate whether age, disease duration, gender, ApoE genotype, and brain weight correlated with the signal intensity of the samples, we performed continuous one-way ANOVA analyses with each one of these factors as a continuous factor. None of the factors correlated significantly with the observed phosphorylation signal intensity, neither for the PTK nor the STK assays (Supplementary Figure 4), except for brain weight. In addition, we investigated whether there was a correlation between PMD and the kinase activity. The samples were sorted by (increasing) PMD (Supplementary Figure 5A and B, respectively). One-way ANOVA analysis with PMD as continuous factor resulted in three peptides with a p-value <0.01 (Supplementary Figure 5). When the same analysis was done with the pH of CSF, a significant correlation between the pH of the CSF and both STK and PTK signal intensity was found (Supplementary Figure 6A and B, respectively).
Statistical analysis: Identification of peptides that show significantly altered phosphorylation profiles at different Braak stages
The mixed effects model (Materials and Methods) was fitted to the STK and PTK phosphorylation data separately. The mean peptide-specific change in signals at the Braak stages was consistent with a linear decrease. For instance, the mean change between Braak stages 0 and I was similar to the mean change between Braak stage IV and V. Hence, Braak stage was included as a continuous, peptide-specific fixed effect. This resulted in an average signal (one value) per Braak stage per peptide. In this way, the model provided one estimated effect for changes in signal intensity over Braak stage for each peptide (Supplementary Table 2). The estimates represent the estimated mean effect sizes on a binary log scale with associated p-values. Therefore, the more negative the estimate, the bigger the decrease in protein kinase activity. A p-value below 0.01 was considered significant. An estimate of 1 on the binary log scale was treated as no effect. Due to the testing of all peptides simultaneously, reported p-values are corrected for multiple testing by controlling their False Discovery Rate (FDR) at 5% .
139/142 STK peptides and 54/142 PTK peptides showed a significant decrease in phosphorylation with Braak stage (p-value <0.01 and Supplementary Table 2). These peptides are derived from proteins with a wide variety of functions, e.g., transcription factors, structural proteins, protein kinases, cell adhesion proteins, ion channels, and transport proteins. Nopeptides were observed to have a significant increase of phosphorylation with increasing Braak stage.
Reproducibility of sample preparation
The reproducibility of sample preparation was assessed by repeating the cutting, lysis, and kinase activity determination for 19 samples selected at random. Most of the repeat samples (N = 19) gave similar signals as the initial samples (N = 100, Fig. 2). Only 3 samples from Braak V and Braak VI showed small differences, which are most likely due to cutting tissue from a slightly different section of the hippocampal tissue block. The data showed that sample cutting, lysis, and the protein kinase activity profiling have a high reproducibility.
Protein-protein interaction network (STRING analysis)
Building interaction networks of proteins is beneficial for understanding their role in complex biological pathways. Since in most molecular pathways serine/threonine kinases and tyrosine kinases occur inthe same pathway and sometimes even interact, we combined the two datasets into one. In order to keep the network readable, a selection was made of the most significant peptides (p-value corrected for multiple testing <10–10, Supplementary Table 2), resulting in a selection of 122 peptides that changed the most over Braak stages. The corresponding 107 proteins from which those peptides were derived were used for the STRING analysis. The outcome of the STRING analysis is shown in Fig. 3. Each protein is represented as a node with edged interactions. Selected proteins are marked with a star and discussed in this manuscript. They correspond to the outcome of the MetacoreTM pathwayanalysis (Fig. 4) and identification of upstream kinases (Fig. 5). Protein kinases such as Src and Janus kinase 2 (JAK2) are highly connected, whereas Myristoylated alanine-rich C-kinase substrate (MARCKS) and Vasodilator-stimulated phosphoprotein (VASP) are at the edges of the network. Different colors represent different kinds of evidence of connections between proteins.
Proteins with a strong functional interactive pattern include Src, rapidly accelerated fibrosarcoma 1 serine kinase (RAF1), JAK2, mammalian target of Rapamycin (mTOR/FRAP), members of the Ephrin receptor family (EPHA1, EPHA2, EPHA7, EPHB1), nuclear factor kappa-light-chain-enhancer of activated B cells (NFκB1), phosphatidylinositol 3-kinase regulatory subunit alpha (PIK3R1), receptor tyrosine-protein kinase erbB-2 (ERBB2), microtubule-associated protein tau (MAPT), cAMP response element-binding protein 1 (CREB1), the estrogen receptor (ESR1), and 3-phosphoinositide-dependent protein kinase 1 (PDPK1). The protein kinase C beta (PKCβ, PRKCB), protein kinase CK2 (CSNK2A1) and Aurora A kinase were found in the center of the STRING network. In addition, protein kinases that are not known to be linked to AD were identified, e.g., PTK6/BRK, feline sarcoma tyrosine kinase (FES), and FRK.
Pathway analysis of top 50 pathways
A pathway analysis (MetaCoreTM) using the same protein input yielded 50 pathways likely to be affected in AD. These pathways are highly significant, as their p-values range from 2.38*10–12 to 2.7*10–6. A p-value of 10–4 is considered significant. These pathways were grouped according to processes and are represented as a pie chart (Fig. 4). 52 of the 107 UniProt IDs were represented in these 50 pathways. Identification of kinases known to phosphorylate the original phospho-sites from the HPRD, Reactome, and Phosphosite databases gave 83 upstream kinases. For the Protein IDs not represented in the pathways, 39 upstream kinases were identified.
Identification of putative upstream kinases
Since a number of peptides were not represented in the pathway diagrams, we extended the upstream kinase analysis. For all phosphosites in this peptide set (N = 122) the kinases that are known to phosphorylate the sites were extracted from the HPRD, Reactome, and Phosphosite databases and visualized on the kinome phylogenetic tree (Fig. 5A). The number of kinases identified in each database and the overlap between the databases is visualized in a Venn diagram (Fig. 5B). Kinases that are present in the phylogenetic tree and the STRING network as well as the MetaCore™ pathways are marked with black circles (Fig. 5A).
DISCUSSION
In the present study, we used protein kinase activity profiling to investigate the changes in protein kinase activity associated with AD progression. We analyzed a cohort of 100 postmortem hippocampal brain tissue samples of all stages at AD and non-demented controls, with short postmortem delay and without any co-morbidities. To our knowledge, this is the first report of a study in which all Braak stages are studied in such a large cohort from one medical center [26]. Our main finding was that overall protein kinase activities decrease with disease progression. Interestingly, we found that as early as the pre-clinical phase of AD, protein kinase activities decrease, indicating the importance to target early events in the pathophysiology of AD, such as synaptic loss and inflammation. Hence, protein kinases are promising targets for (early) pharmacological intervention in AD.
In this study we used two types of microarrays to determine, in a multiplex fashion, the activity of tyrosine and serine/threonine protein kinases in hippocampal protein extracts by phosphorylation of specific peptides present on the array [8, 20]. We have shown previously that protein kinase activity profiling on peptide microarrays can be used to reveal novel protein kinases and new signaling pathways involved in AD pathology [27, 28]. McGuire et al. recently profiled protein kinases of the frontal cortex of patients with schizophrenia, revealing both a modest increase and decrease in kinase activity in patients with the disease compared to controls with no mental illness [29]. Investigating protein kinase activity, as opposed to determining the presence of a kinase, is an unbiased and more direct measure to monitor global changes occurring in the cell or tissue.
Detection of changes by generic antibodies is unbiased and does not require a priori hypotheses about what proteins could be involved. An advantage of the PamChip ® kinase activity microarrays (PamGene International BV) is their robustness and the small amount of protein that is required (i.e., typically 2.5–5μg of total protein for one PTK array and 0.25–1μg per STK array). This is in contrast to much higher amounts required for other proteomics technologies (e.g., several milligrams of total protein required for mass spectrometry analysis [30]). The PamChip ® 96 peptide microarray platform produced highly reproducible data (Fig. 2). We found that the development of a robust experimental design in combination with the use of highly detailed standard operating procedures for the handling of the material guaranteed highly reproducible data sets.
Brain alterations can only be examined after autopsy when diverse ante- and post-mortem events may well have damaged the living proteome. It has been reported that protein phosphorylation of human brain tissue is affected by the PMD, i.e., the time from death to extraction and freezing of the brain tissue at –80°C [31–34]. Most phosphoproteins are stable for 24 h or longer after autopsy of mouse brains [35] and human brains [10]. In addition, it has been shown that most postmortem changes of the phospho-proteome in tumor samples occur during the first 30 min after death [36] while changes after that time are far less drastic. In this study we selected brain tissue with a short postmortem delay (4–6 h) and showed that the observed changes in kinase activity of human hippocampal brain tissue cannot be explained by differences in PMD. We concluded that PMD is a random factor, not associated with Braak stage or kinaseactivity.
In this cohort age, gender, differences in brain weight (except for a few peptides) or ApoE genotype did not correlate to the differences in phosphorylation (Supplementary Figure 4). PMD is a random factor, not associated with Braak stage. The pH value might also reflect brain alterations. For brain tissue, pH values above 7.0 were associated with violent death and mean pH values below 6.5 with a slow death, i.e., following a prolonged agonal phase [37]. Unfortunately, neither pH measurements of the brain itself nor information about the agonal status of patients prior to death were available for this cohort, though data for the pH of the CSF was available. Due to the large sample size of our cohort (N = 100) and the random distribution of causes of death between Braak stages, we do not consider agonal state to be a significant factor in the outcome of this study. Hardy et al. found a correlation between cortical pH and pH of the CSF [38] which was also supported by others [39–41]. We consequently used the pH measurements of the CSF to act as a surrogate for the total brain pH. We discovered that the pH of the CSF correlated to a certain extent with Braak stage. The average pH of the CSF from patients in higher Braak stages was considerably lower (Supplementary Figure 6). A lower pH of the CSF promotes apoptosis [42] and could be associated with disease. However, not all samples with a low pH had low kinase activity. For that reason we conclude that changes in pH do not explain the variation in kinase activity between the samples. In accordance with others [43], we did not find any correlation between pH and PMD.
We observed changes in protein kinase activity from early Braak stages. In order to gain more insight into the potential biological mechanisms underlying the observed phenomenon, we used curated biological knowledge associated with the proteins represented by the detected phosphorylated peptides. We performed three different types of analysis: a protein-protein interaction network analysis, a pathway analysis, and an identification of direct upstream kinase analysis. The STRING protein-protein interaction tool allows the formation of an interaction network. The connectivity network revealed proteins with the strongest functional interacting pattern. Some of these have been implicated in AD (Src, EphA1, CK2), while for others little to nothing is known about their involvement in AD pathogenesis (PTK6/BRK, FES, Aurora A). The MetaCore tool facilitates the construction of differentially modulated pathways. The top 50 pathways revealed a profound involvement of developmental processes (44% ), signal transduction processes (16% ), and apoptosis and survival processes (10% ). Proteins like the lipid kinase PI3K and the protein kinases PDPK, RAF, PKA, PKB, PKC, and Src are present in many pathways, while other important nodes (CK2, PKC, Aurora A) are less frequently present in the pathway diagrams. Kinases known to phosphorylate the phosphorylation sites in the peptides were identified in databases (HPRD, Reactome, Phosphosite). A phylogenetic tree was created from curated literature data (HPRD, Reactome, and Phosphosite databases) using the Kinome Render tool. PKA, PKB, and the PKC family are well represented in many pathways. GSK3β appears as a kinase able to phosphorylate Myc, which is an important node in the protein-protein interaction network and connected to other regulators of cell division like p53, Aurora A and Rb. The protein kinases PKA, PKB and PKC are well represented among the upstream kinases. Several other kinases that were present as important nodes in the protein-protein interaction analysis also appear in this set of upstream kinases: Src, JAK2, RAF, mTor/FRAP, PKC, CK2 and FES. Since kinases of the same family share substrate preferences, many family members are likely to appear in the phylogenetic tree (Fig. 5). However, it is worth considering that only one family member might actually be active.
The interaction analysis, the pathway analysis and the upstream kinases analysis (Figs. 3–5A) are based on published and curated literature data. This reflects current knowledge and is biased towards known pathways and well-investigated kinases. In the following section, we will discuss a few selected protein kinases and pathways that were found with protein-protein interaction analysis, pathway analysis, and upstream kinase analysis and their potential role in AD pathogenesis.
An important pathway represented in the interaction analysis is the phosphatidylinositol 3-kinase (PI3K)/AKT/mTOR pathway, which is involved in neuronal proliferation, aging, and synaptic plasticity and is deregulated in several models of neurodegeneration [44, 45], including the Tg2576 transgenic mouse model for AD [46], murine cultured neurons [47] and brains of patients with Down syndrome [48]. In AD, synaptic plasticity decreases and neurons become dysfunctional, then visibly degenerate, and finally, synaptic connections are decreased [49]. The loss of synapses is an early event in the pathogenesis of AD and correlates best with loss of cognitive function of AD patients [50]. A significant loss and altered distribution of the major negative regulator of AKT, PTEN (phosphatase and tensin homologue deleted on chromosome 10), has been detected in the hippocampal CA1 region at end stages of AD and in human cultured AD neurons [51]. In the adult human brain, PI3K signaling is involved in the regulation of long-term potentiation (LTP) in the hippocampus, which is impaired in patients with AD. Decreased activity of the PI3K/AKT pathway may thus contribute to neuronal dysfunction and reduced synaptic plasticity. Memory consolidation by promoting cell survival via mTOR activation might be beneficial for future drug targets [45, 52].
When PDPK1 phosphorylation is reduced, downstream signaling pathways involved in insulin regulation, protein kinase B (AKT or PKB), protein kinase C (PKC) and serum- and glucocorticoid-induced protein kinase (SGK) become aberrant. Interestingly, AKT and PKC are downregulated in AD [4, 51, 53]. In this study we showed that reduction of PDPK1 phosphorylation is an early event in AD. One of the hypotheses about the possible role of insulin resistance is that downregulation of insulin receptor/PI3K/AKT pathway would lead to lowered inhibition of glycogen synthase kinase 3 beta (GSK3β) and subsequently hyperphosphorylation of tau [54]. Although the molecular mechanisms underlying insulin-dependent regulation of synaptic plasticity and cognitive function are not clearly understood, they seem to involve the activation of PI3K and MAPK signaling pathways [55]. Therefore, supplementing insulin at early stages of the disease may lead to reduced AD pathophysiology and neuronal repair due to the activation of PKC signaling via extracellular-signal-regulated kinases 1/2 (ERK1/2), MAPK, and Src [56].
Src is an important node found in the interaction analysis. We suggest that the observed decrease of Src activity in early stages of AD contributes to the loss of synaptic plasticity. In healthy individuals, Src catalyzes the induction of long term potentiation in the CA1 region of the hippocampus in an N-methyl-D-aspartate receptor (NMDAR) mediated manner [13, 57]. It has been reported that the inhibition of Src prevents the induction of long-term memory [13] and that the PKC-FAK2-Src cascade pathway is essential for memory formation [58]. PKC is downregulated in AD [4, 59] with the potential consequence of a down-regulation of the downstream Src. Together these findings suggest that activation of PKC or Src could be beneficial for synaptic strength and memory formation in patients with AD.
The erythropoietin-producing hepatocellular (Eph) receptor tyrosine kinases (RTK) contribute to aberrant synaptic function associated with neurodegeneration [60]. They are subdivided into two distinct classes (A and B), based on their structural similarity and affinity. Class A receptors are anchored to the cell surface via a glycosylphosphatidylinositol motif, whereas EphB receptors are type I transmembrane proteins [61]. We recently reported that the distribution of EphA4 RTK is altered in human hippocampal brain tissue of AD patients compared to controls [62]. This altered distribution pattern was observed at early stages of the disease suggesting a reduced availability of EphA4 is likely to contribute to synaptic dysfunction, an early event in AD pathogenesis [62]. A decrease in EphB2 and EphA4 expression was observed in hAβPPswe-ind mice, a mouse model for AD. The decrease coincided with the onset of memory decline [63]. Furthermore, a signaling cascade has been proposed in which activation of EphB receptors leads to the activation of Src and subsequently the enhancement of NMDAR tyrosine phosphorylation and thereby upregulation of NMDAR function and LTP [64]. This suggests that Src and EphB share common pathways. The decrease in protein kinase activity of several members of the Eph-receptor RTKs, which was observed in this study, is in accordance with previous reports, thereby validating our approach.
Another relevant kinase, which was present in the interaction network and the phylogenetic trees, was the protein kinase CK2, formerly called casein kinase 2. Interestingly, CK2 was one of the first protein kinases identified with abnormal activity in the AD brain [65]. Different roles for CK2 in AD have been suggested, including roles in synaptic plasticity [66, 67], AβPP processing [68–70], tau accumulation [71, 72], and insulin signaling [73]. Recently CK2 was found to be present in human astrocytes, and its involvement in neuroinflammatory events during AD pathogenesis was reported (Rosenberger et al., in preparation).
Janus kinase 2 (JAK2) is part of the JAK2/STAT3 pathway and phosphorylation of JAK2 in BV-2 microglia is downregulated by Aβ. Microglia and astrocytes are the immune cells of the brain and are thus directly involved in inflammatory responses that contribute to AD pathogenesis and progression [74–77]. Recently, hydroxyl-safflor yellow A (HSYA), a novel chalcone glycoside, was reported to upregulate the JAK2/STAT3/NF-κB pathway, thereby suppressing microglia activation and reducing the inflammatory response in mice that had Aβ1-42 injected into the hippocampus to introduce Aβ pathology [78]. The authors showed that HSYA treatment of Aβ1-42 mice ameliorated the spatial learning and memory deficits, by using a Morris water maze test. These results indicated that HSYA might be a promising drug target for the treatment of AD at early stages.
While the kinases discussed thus far play a role in AD that has been well-documented, we have identified additional protein kinases that have not been previously associated with AD, such as PTK6/BRK, FES, and FRK. PTK6/BRK can phosphorylate PDPK, PLCG, and RET. Interestingly, FRK phosphorylates several members of the EphA family, EPOR, Fer, FES, PI3K and PDPK. FES is known to phosphorylate PDPK, FES, and RET.
The FRK protein shows ~60% amino acid similarity with the tau kinase Fyn, though its function is not known. Fyn interacts with both Aβ and tau and plays an important role in regulating synaptic plasticity. A reduction in Fyn activation may lead to impairments in long-term potentiation and could affect cognitive function in humans. Interestingly, Fyn knockout mice have an age-dependent reduction in dendritic spines, the single contact points between an axon and a dendrite critical for synaptic function [79].
The cytosolic protein tyrosine kinase FES acts downstream of cell surface receptors and plays a role in the regulation of the actin cytoskeleton, microtubule assembly, cell attachment and cell spreading. FES has not been associated with AD. However, FES has been reported to play a role in the regulation of cell differentiation and promotes neuritic outgrowth in response to nerve growth factor signaling. The c-Fes tyrosine kinase cooperates with the breakpoint cluster region protein (Bcr) to induce neurite extension in a Rac- and Cdc42-dependent manner [80].
Another kinase recently implicated in age-related neurodegeneration (inflammation, neurovascular unit compromise, and exhaustion) is the protein kinase C (PKC). PKC isoforms have numerous functions important for memory, blood-brain barrier maintenance, and injury repair that change with aging [81]. Furthermore we identified PTK6/BRK, which has not been associated with AD before. PTK6/BRK is involved in the formation and regulation of neurons and was recently linked to focal adhesion kinase (FAK) and AKT [82]. PTK6/BRK augments proliferation and promotes cell survival in breast, colon, and skin cancers [83]. The precise role of FRK and PTK6/BRK in the early stages of AD remains to be determined. The identified protein kinases need to be investigated further to establish their functional role in AD pathogenesis and their potential as biomarkers and/or drug targets.
The Aurora A kinase, also known as serine/threonine-protein kinase 6 (STK6), is a member of a family of mitotic serine/threonine kinases. It is implicated in important processes during mitosis and meiosis and is integral for healthy cell proliferation. Aurora A is activated by one or more phosphorylations, with peak activity during the G2 phase to M phase transition in the cell cycle [84]. In the interaction analysis, several nodes involved in cell division were present: Myc, p53, and Rb. Aurora A dysregulation has been associated with high occurrence of cancer [85], but to date, no link to AD has been reported.
In conclusion, we analyzed protein kinase activity in a well-defined cohort of 100 human post-mortem brains, which included all Braak stages, and wediscovered aberrant activities even in the early stages of AD (Braak I and II) before clinical symptoms are apparent. Several processes are affected during AD, and in our analysis, we could confirm the involvement of several proteins already implicated in AD. Furthermore, kinases that have previously not yet been associated with AD were identified (Aurora A, FRK, FES, and PTK6/BRK).
We anticipate that the protein kinases that change early in the disease might be attractive drug targets. The currently available AD therapeutics, unfortunately, have minor effects on improving cognition or slowing down the progression of the disease. This may be because most therapeutics are directed against relatively late events in AD pathology, when irreversible damage has already occurred in the brain [86–88]. In the future, pharmacological interventions will have to be directed against pre-clinical events that can now be identified by protein kinase activityprofiling.
ACKNOWLEDGMENTS
This study was conducted within the framework of the European EUROTRANS-BIO – ERA-NET project ‘B4AD’ (Bayesian-statistics and Bioinformatics in Biomarker and Biobanks in Alzheimer’s Disease), a collaborative project of the International Drug Development Institute (Louvain-la-Neuve, Belgium), PamGene International BV (Den Bosch, The Netherlands), and the VU University medical center and the Alzheimer center (Amsterdam, The Netherlands). The VUmc Alzheimer center is supported by Alzheimer Nederland and Stichting VUmc funds, AFNR was supported by Agentschap NL and Stichting Zabawas. Research of the VUmc Alzheimer center and the Department of Pathology is part of the neurodegeneration research program of the Neuroscience Campus Amsterdam.
We thank the Netherlands Brain Bank (NBB) for supplying human brain tissue. We are grateful to Elise van Haastert, David Hondius, Liesbeth Houkes, and Liesbeth Hovestad for their assistance in the laboratory and with data analysis. Rinie van Beuningen and Tomasz Burzykowski helped with the experimental design and setup. We thank Savithri Rangarajan and Darryl Dawkins for revising the manuscript. We are grateful to the reviewers for their suggestions for improving the manuscript.
Authors’ disclosures available online (http://j-alz.com/manuscript-disclosures/15-0429r2).
Appendices
The supplementary material is available in the electronic version of this article: http://dx.doi.org/10.3233/JAD-150429.
REFERENCES
[1] | Bateman RJ , Xiong C , Benzinger TLS , Fagan AM , Goate A , Fox NC , Marcus DS , Cairns NJ , Xie X , Blazey TM , Holtzman DM , Santacruz A , Buckles V , Oliver A , Moulder K , Aisen PS , Ghetti B , Klunk WE , McDade E , Martins RN , Masters CL , Mayeux R , Ringman JM , Rossor MN , Schofield PR , Sperling RA , Salloway S , Morris JC ((2012) ) Clinical and biomarker changes in dominantly inherited Alzheimer’s disease. N Engl J Med 367: , 795–804. |
[2] | Caselli RJ , Reiman EM ((2013) ) Characterizing the preclinical stages of Alzheimer’s disease and the prospect of presymptomatic intervention. J Alzheimers Dis 33: (Suppl 1), S405–S416. |
[3] | Chung S-H ((2009) ) Aberrant phosphorylation in the pathogenesis of Alzheimer’s disease. BMB Rep 42: , 467–474. |
[4] | Olariu A , Yamada K , Nabeshima T ((2005) ) Amyloid pathology and protein kinase C (PKC): Possible therapeutics effects of PKC activators. J Pharmacol Sci 97: , 1–5. |
[5] | Tagawa K , Homma H , Saito A , Fujita K , Chen X , Imoto S , Oka T , Ito H , Motoki K , Yoshida C , Hatsuta H , Murayama S , Iwatsubo T , Miyano S , Okazawa H ((2015) ) Comprehensive phosphoproteome analysis unravels the core signaling network that initiates the earliest synapse pathology in preclinical Alzheimer’s disease brain. Hum Mol Genet 24: , 540–558. |
[6] | Hanger DP , Anderton BH , Noble W ((2009) ) Tau phosphorylation: The therapeutic challenge for neurodegenerative disease. Trends Mol Med 15: , 112–119. |
[7] | Martins-De-Souza D , Guest PC , Vanattou-Saifoudine N , Rahmoune H , Bahn S ((2012) ) Phosphoproteomic differences in majordepressive disorder postmortem brains indicate effects on synapticfunction. Eur Arch Psychiatry Clin Neurosci 262: , 657–666. |
[8] | Hilhorst R , Houkes L , van den Berg A , Ruijtenbeek R ((2009) ) Peptide microarrays for detailed, high-throughput substrate identification, kinetic characterization, and inhibition studies on protein kinase A. Anal Biochem 387: , 150–161. |
[9] | Sikkema AH , Diks SH , den Dunnen WF , ter Elst A , Scherpen FJ , Hoving EW , Ruijtenbeek R , Boender PJ , de Wijn R , Kamps WA , Peppelenbosch MP , de Bont ES ((2009) ) Kinome profiling in pediatricbrain tumors as a new approach for target discovery. CancerRes 69: , 5987–5995. |
[10] | McCullumsmith RE , Hammond JH , Shan D , Meador-Woodruff JH ((2014) ) Postmortem brain: An underutilized substrate for studying severemental illness. Neuropsychopharmacology 39: , 65–87. |
[11] | Hollingworth P , Harold D , Sims R , Gerrish A , Lambert JC , Carrasquillo MM , Abraham R , Hamshere ML , Pahwa JS , Moskvina V , Dowzell K , Jones N , Stretton A , Thomas C , Richards A , Ivanov D , Widdowson C , Chapman J , Lovestone S , Powell J , Proitsi P , Lupton MK , Brayne C , Rubinsztein DC , Gill M , Lawlor B , Lynch A , Brown KS , Passmore PA , Craig D , McGuinness B , Todd S , Holmes C , Mann D , Smith AD , Beaumont H , Warden D , Wilcock G , Love S , Kehoe PG , Hooper NM , Vardy ER , Hardy J , Mead S , Fox NC , Rossor M , Collinge J , Maier W , Jessen F , Rüther E , Schürmann B , Heun R , Kölsch H , van den Bussche H , Heuser I , Kornhuber J , Wiltfang J , Dichgans M , Frölich L , Hampel H , Gallacher J , Hüll M , Rujescu D , Giegling I , Goate AM , Kauwe JS , Cruchaga C , Nowotny P , Morris JC , Mayo K , Sleegers K , Bettens K , Engelborghs S , De Deyn PP , Van Broeckhoven C , Livingston G , Bass NJ , Gurling H , McQuillin A , Gwilliam R , Deloukas P , Al-Chalabi A , Shaw CE , Tsolaki M , Singleton AB , Guerreiro R , Mühleisen TW , Nöthen MM , Moebus S , Jöckel KH , Klopp N , Wichmann HE , Pankratz VS , Sando SB , Aasly JO , Barcikowska M , Wszolek ZK , Dickson DW , Graff-Radford NR , Petersen RC , van Duijn CM , Breteler MM , Ikram MA , DeStefano AL , Fitzpatrick AL , Lopez O , Launer LJ , Seshadri S , Berr C , Campion D , Epelbaum J , Dartigues JF , Tzourio C , Alpérovitch A , Lathrop M , Feulner TM , Friedrich P , Riehle C , Krawczak M , Schreiber S , Mayhaus M , Nicolhaus S , Wagenpfeil S , Steinberg S , Stefansson H , Stefansson K , Snaedal J , Björnsson S , Jonsson PV , Chouraki V , Genier-Boley B , Hiltunen M , Soininen H , Combarros O , Zelenika D , Delepine M , Bullido MJ , Pasquier F , Mateo I , Frank-Garcia A , Porcellini E , Hanon O , Coto E , Alvarez V , Bosco P , Siciliano G , Mancuso M , Panza F , Solfrizzi V , Nacmias B , Sorbi S , Bossù P , Piccardi P , Arosio B , Annoni G , Seripa D , Pilotto A , Scarpini E , Galimberti D , Brice A , Hannequin D , Licastro F , Jones L , Holmans PA , Jonsson T , Riemenschneider M , Morgan K , Younkin SG , Owen MJ , O’Donovan M , Amouyel P , Williams J ((2011) ) Common variants at ABCA7, MS4A6A/MS4A4E, EPHA1, CD33 andCD2AP are associated with Alzheimer’s disease. Nat Genet 43: , 429–435. |
[12] | Morgan K ((2011) ) The three new pathways leading to Alzheimer’s disease. Neuropathol Appl Neurobiol 37: , 353–357. |
[13] | Lu YM ((1998) ) Src activation in the induction of long-termpotentiation in CA1 hippocampal neurons. Science 279: , 1363–1368. |
[14] | Kalia LV , Gingrich JR , Salter MW ((2004) ) Src in synaptic transmission and plasticity. Oncogene 23: , 8007–8016. |
[15] | Yamaguchi H , Haga C , Hirai S , Nakazato Y , Kosaka K ((1990) ) Distinctive, rapid, and easy labeling of diffuse plaques in the Alzheimer brains by a new methenamine silver stain. Acta Neuropathol 79: , 569–572. |
[16] | Thal DR , Rüb U , Schultz C , Sassin I , Ghebremedhin E , DelTredici K , Braak E , Braak H ((2000) ) Sequence of Abeta-proteindeposition in the human medial temporal lobe. J NeuropatholExp Neurol 59: , 733–748. |
[17] | Braak H , Alafuzoff I , Arzberger T , Kretzschmar H , Del Tredici K ((2006) ) Staging of Alzheimer disease-associated neurofibrillary pathology using paraffin sections and immunocytochemistry. Acta Neuropathol 112: , 389–404. |
[18] | Reisberg B , Ferris SH , De Leon MJ , Crook T ((1982) ) The global deterioration scale for assessment of primary degenerative dementia. Am J Psychiatry 139: , 1136–1139. |
[19] | Hilhorst R , Houkes L , Mommersteeg M , Musch J , van den Berg A , Ruijtenbeek R ((2013) ) Peptide microarrays forprofiling ofserine/threonine kinase activity of recombinant kinases andlysates of cells and tissue samples. Methods Mol Biol 977: , 259–271. |
[20] | Sikkema AH , Diks SH , den Dunnen WF , ter Elst A , Scherpen FJ , Hoving EW , Ruijtenbeek R , Boender PJ , de Wijn R , Kamps WA , Peppelenbosch MP , de Bont ES ((2009) ) Kinome profiling in pediatricbrain tumors as a new approach for target discovery. CancerRes 69: , 5987–5995. |
[21] | Versele M , Talloen W , Rockx C , Geerts T , Janssen B , Lavrijssen T , King P , Göhlmann HWH , Page M , Perera T ((2009) ) Response prediction to a multitargetedkinase inhibitor in cancer cell lines andxenograft tumors using high-content tyrosine peptide arrays with akinetic readout. Mol Cancer Ther 8: , 1846–1855. |
[22] | Franceschini A , Szklarczyk D , Frankild S , Kuhn M , Simonovic M , Roth A , Lin J , Minguez P , Bork P , von Mering C , Jensen LJ ((2013) ) STRING v9.1: Protein-protein interaction networks, with increasedcoverage and integration. Nucleic Acids Res 41: , D808–D815. |
[23] | Keshava Prasad TS , Goel R , Kandasamy K , Keerthikumar S , Kumar S , Mathivanan S , Telikicherla D , Raju R , Shafreen B , Venugopal A , Balakrishnan L , Marimuthu A , Banerjee S , Somanathan DS , Sebastian A , Rani S , Ray S , Harrys Kishore CJ , Kanth S , Ahmed M , Kashyap MK , Mohmood R , Ramachandra YL , Krishna V , Rahiman BA , Mohan S , Ranganathan P , Ramabadran S , Chaerkady R , Pandey A ((2009) ) Human Protein Reference Database–2009 update. Nucleic Acids Res 37: , D767–D772. |
[24] | Matthews L , Gopinath G , Gillespie M , Caudy M , Croft D , de Bono B , Garapati P , Hemish J , Hermjakob H , Jassal B , Kanapin A , Lewis S , Mahajan S , May B , Schmidt E , Vastrik I , Wu G , Birney E , Stein L , D’eustachio P ((2009) ) Reactome knowledgebase of human biologicalpathways and processes. Nucleic Acids Res 37: , D619–D622. |
[25] | Hunter T , Sefton BM ((1980) ) Transforming gene product of Rous sarcoma virus phosphorylates tyrosine. Proc Natl Acad Sci U S A 77: , 1311–1315. |
[26] | Korolainen MA , Nyman TA , Aittokallio T , Pirttilä T ((2010) ) Anupdate on clinical proteomics in Alzheimer’s research. J Neurochem 112: , 1386–1414. |
[27] | Hoozemans JJM , Hilhorst R , Ruijtenbeek R , Rozemuller AJM , Van Der Vies SM ((2012) ) Protein kinase activity profiling of postmortem human brain tissue. Neurodegener Dis 10: , 46–48. |
[28] | Hoozemans JJM , Haastert ES , Van Mulder SD , Nielsen HM , Veerhuis R , Ruijtenbeek R , Rozemuller AJM , Hilhorst R , Van Der Vies SM ((2014) ) IncreasedIRAK-4 kinase activity in Alzheimer’s disease; Inhibitory effectof IRAK-1/4 inhibitor I on pro-inflammatory cytokine secretion butnot on uptake of amyloid beta by human glial cells. J ClinCell Immunol 5: , 243 |
[29] | McGuire JL , Hammond JH , Yates SD , Chen D , Haroutunian V , Meador-Woodruff JH , McCullumsmith RE ((2014) ) Altered serine/threonine kinase activity in schizophrenia. Brain Res 1568: , 42–54. |
[30] | Bratland A , Boender PJ , Høifødt HK , Østensen IHG , Ruijtenbeek R , Wang M-Y , Berg JP , Lilleby W , Fodstad Ø , Ree AH ((2009) ) Osteoblast-induced EGFR/ERBB2 signaling inandrogen-sensitive prostate carcinoma cells characterized bymultiplex kinase activity profiling. Clin Exp Metastasis 26: , 485–496. |
[31] | Li X , Greenwood AF , Powers R , Jope RS ((1996) ) Effects of postmorteminterval, age, and Alzheimer’s disease onG-proteins inhuman brain. Neurobiol Aging 17: , 115–122. |
[32] | Li X , Friedman AB , Roh MS , Jope RS ((2005) ) Anesthesia and post-mortem interval profoundly influence the regulatory serine phosphorylation of glycogen synthase kinase-3 in mouse brain. J Neurochem 92: , 701–704. |
[33] | O’Callaghan JP , Sriram K ((2004) ) Focused microwave irradiation of the brain preserves in vivo protein phosphorylation: Comparison with other methods of sacrifice and analysis of multiple phosphoproteins. J Neurosci Methods 135: , 159–168. |
[34] | Funk KE , Kuret J ((2012) ) Lysosomal fusion dysfunction as a unifying hypothesis for Alzheimer’s disease pathology. Int J Alzheimers Dis 2012: , 752894 |
[35] | Oka T , Tagawa K , Ito H , Okazawa H ((2011) ) Dynamic changes of the phosphoproteome in postmortem mouse brains. PLoS One 6: , e21405 |
[36] | Mertins P , Yang F , Liu T , Mani DR , Petyuk VA , Gillette MA , Clauser KR , Qiao JW , Gritsenko MA , Moore RJ , Levine DA , Townsend R , Erdmann-Gilmore P , Snider JE , Davies SA , Ruggles KV , Fenyo D , Kitchens RT , Li S , Olvera N , Dao F , Rodriguez H , Chan DW , Liebler D , White F , Rodland KD , Mills GB , Smith RD , Paulovich AG , Ellis M , Carr SA ((2014) ) Ischemia in tumors induces early and sustained phosphorylation changes in stress kinase pathways but does not affect global protein levels. Mol Cell Proteomics 13: , 1690–1704. |
[37] | Kingsbury AE , Foster OJ , Nisbet AP , Cairns N , Bray L , Eve DJ , Lees AJ , Marsden CD ((1995) ) Tissue pH as an indicator of mRNA preservation in human post-mortem brain. Brain Res Mol Brain Res 28: , 311–318. |
[38] | Hardy JA , Wester P , Winblad B , Gezelius C , Bring G , Eriksson A ((1985) ) The patients dying after long terminal phase have acidotic brains; implications for biochemical measurements on autopsy tissue. J Neural Transm 61: , 253–264. |
[39] | Mexal S , Berger R , Adams CE , Ross RG , Freedman R , Leonard S ((2006) ) Brain pH has a significant impact on human postmortem hippocampal gene expression profiles. Brain Res 1106: , 1–11. |
[40] | Johnston NL , Cervenak J , Shore AD , Torrey EF , Yolken RH ((1997) ) Multivariate analysis of RNA levels from postmortem human brains as measured by three different methods of RT-PCR. Stanley Neuropathology Consortium. J Neurosci Methods 77: , 83–92. |
[41] | Harrison PJ , Heath PR , Eastwood SL , Burnet PW , McDonald B , Pearson RC ((1995) ) The relative importance of premortem acidosis and postmortem interval for human brain gene expression studies: Selective mRNA vulnerability and comparison with their encoded proteins. Neurosci Lett 200: , 151–154. |
[42] | Webb BA , Chimenti M , Jacobson MP , Barber DL ((2011) ) Dysregulated pH: A perfect storm for cancer progression. Nat Rev Cancer 11: , 671–677. |
[43] | Monoranu CM , Apfelbacher M , Grünblatt E , Puppe B , Alafuzoff I , Ferrer I , Al-Saraj S , Keyvani K , Schmitt A , Falkai P , Schittenhelm J , Halliday G , Kril J , Harper C , McLean C , RiedererP , Roggendorf W ((2009) ) PH measurement as quality control on humanpost mortem brain tissue: A study of the BrainNet Europeconsortium. Neuropathol Appl Neurobiol 35: , 329–337. |
[44] | Heras-Sandoval D , Avila-Muñoz E , Arias C ((2011) ) The phosphatidylinositol 3-kinase/mTor pathway as a therapeutic target for brain aging and neurodegeneration. Pharmaceuticals 4: , 1070–1087. |
[45] | Heras-Sandoval D , Pérez-Rojas JM , Hernández-Damián J , Pedraza-Chaverri J ((2014) ) The role of PI3K/AKT/mTOR pathway in the modulation of autophagy and the clearance of protein aggregates in neurodegeneration. Cell Signal 26: , 2694–2701. |
[46] | Haugabook SJ , Le T , Yager D , Zenk B , Healy BM , Eckman EA , Prada C , Younkin L , Murphy P , Pinnix I , Onstead L , Sambamurti K , Golde TE , Dickson D , Younkin SG , Eckman CB ((2001) ) Reduction of Abeta accumulation in the Tg2576 animal model of Alzheimer’s disease after oral administration of the phosphatidyl-inositol kinase inhibitor wortmannin. FASEB J 15: , 16–18. |
[47] | Bhaskar K , Miller M , Chludzinski A , Herrup K , Zagorski M , Lamb BT ((2009) ) The PI3K-Akt-mTOR pathway regulates Abeta oligomer inducedneuronal cell cycle events. Mol Neurodegener 4: , 14 |
[48] | Perluigi M , Pupo G , Tramutola A , Cini C , Coccia R , Barone E , Head E , Butterfield DA , Di Domenico F ((2014) ) Neuropathological role of PI3K/Akt/mTOR axis in Down syndrome brain. Biochim Biophys Acta 1842: , 1144–1153. |
[49] | DeKosky ST , Scheff SW ((1990) ) Synapse loss in frontal cortex biopsies in Alzheimer’s disease: Correlation with cognitive severity. Ann Neurol 27: , 457–464. |
[50] | Terry RD , Masliah E , Salmon DP , Butters N , DeTeresa R , Hill R , Hansen LA , Katzman R ((1991) ) Physical basis of cognitivealterations in Alzheimer’s disease: Synapse loss is the majorcorrelate of cognitive impairment. Ann Neurol 30: , 572–580. |
[51] | Griffin RJ , Moloney A , Kelliher M , Johnston JA , Ravid R , Dockery P , O’Connor R , O’Neill C ((2005) ) Activation of Akt/PKB, increasedphosphorylation of Akt substrates and loss and altereddistribution of Akt and PTEN are features of Alzheimer’s diseasepathology. J Neurochem 93: , 105–117. |
[52] | Horwood JM , Dufour F , Laroche S , Davis S ((2006) ) Signalling mechanisms mediated by the phosphoinositide 3-kinase/Akt cascade in synaptic plasticity and memory in the rat. Eur J Neurosci 23: , 3375–3384. |
[53] | Bruel A , Cherqui G , Columelli S , Margelin D , Roudier M , Sinet PM , Prieur M , Pérignon JL , Delabar J ((1991) ) Reduced protein kinase C activity in sporadic Alzheimer’s disease fibroblasts. Neurosci Lett 133: , 89–92. |
[54] | Hong M , Lee VM ((1997) ) Insulin and insulin-like growth factor-1 regulate tau phosphorylation in cultured human neurons. J Biol Chem 272: , 19547–19553. |
[55] | Huang C , Lee C , Hsu K ((2009) ) The role of insulin receptor signaling in synaptic plasticity and cognitive function. Chang Gung Med J 33: , 115–125. |
[56] | Nelson TJ , Sun MK , Hongpaisan J , Alkon DL ((2008) ) Insulin, PKC signaling pathways and synaptic remodeling during memory storage and neuronal repair. Eur J Pharmacol 585: , 76–87. |
[57] | Salter MW ((1998) ) Src, N-methyl-D-aspartate (NMDA)receptors,and synaptic plasticity. Biochem Pharmacol 56: , 789–798. |
[58] | Malenka RC , Nicoll RA ((1999) ) Long-termpotentiation–a decade of progress? Science 285: , 1870–1874. |
[59] | Girault JA , Costa A , Derkinderen P , Studler JM , Toutant M ((1999) ) FAK and PYK2/CAKbeta in the nervous system: A link between neuronal activity, plasticity and survival? Trends Neurosci 22: , 257–263. |
[60] | Inoue E , Deguchi-Tawarada M , Togawa A , Matsui C , Arita K , Katahira-Tayama S , Sato T , Yamauchi E , Oda Y , Takai Y ((2009) ) Synaptic activity prompts gamma-secretase-mediated cleavage of EphA4 and dendritic spine formation. J Cell Biol 185: , 551–564. |
[61] | Yamaguchi Y , Pasquale EB ((2004) ) Eph receptors in the adult brain. Curr Opin Neurobiol 14: , 288–296. |
[62] | Rosenberger A , Rozemuller A , van der Flier WM , Scheltens P , vander Vies SM , Hoozemans J ((2014) ) Altered distribution of the EphA4kinase in hippocampal brain tissue of patients with Alzheimer’sdisease correlates with pathology. Acta Neuropathol Commun 2: , 79 |
[63] | Simón AM , de Maturana RL , Ricobaraza A , Escribano L , Schiapparelli L , Cuadrado-Tejedor M , Pérez-Mediavilla A , Avila J , Del Río J , Frechilla D ((2009) ) Early changes in hippocampal Eph receptors precede the onset ofmemory decline in mouse models of Alzheimer’s disease. JAlzheimers Dis 17: , 773–786. |
[64] | Salter MW , Kalia LV ((2004) ) Src kinases: A hub for NMDA receptor regulation. Nat Rev Neurosci 5: , 317–328. |
[65] | Iimoto DS , Masliah E , Deteresa R , Terry RD , Saitoh T ((1990) ) Aberrant casein kinase II in Alzheimer’s disease. Brain Res 507: , 273–280. |
[66] | Chung HJ , Huang YH , Lau L-F , Huganir RL ((2004) ) Regulation of the NMDA receptor complex and trafficking by activity-dependent phosphorylation of the NR2B subunit PDZ ligand. J Neurosci 24: , 10248–10259. |
[67] | Kimura R , Matsuki N ((2008) ) Protein kinase CK2 modulates synaptic plasticity by modification of synaptic NMDA receptors in the hippocampus. J Physiol 586: , 3195–3206. |
[68] | Walter J , Schindzielorz a , Hartung B , Haass C ((2000) ) Phosphorylation of the beta-amyloid precursor protein at the cell surface by ectocasein kinases 1 and 2. J Biol Chem 275: , 23523–23529. |
[69] | Lenzken SC , Stanga S , Lanni C , De Leonardis F , Govoni S , Racchi M ((2010) ) Recruitment of casein kinase 2 is involved in AbetaPPprocessing following cholinergic stimulation. J AlzheimersDis 20: , 1133–1141. |
[70] | Raftery M , Campbell R , Glaros EN , Rye K-A , Halliday GM , Jessup W , Garner B ((2005) ) Phosphorylation of apolipoprotein-E atan atypical protein kinase CK2 PSD/E site}. Biochemistry 44: , 7346–7353. |
[71] | Baum L , Masliah E , Iimoto DS , Hansen LA , Halliday WC , Saitoh T ((1992) ) Casein kinase II is associated with neurofibrillary tangles but is not an intrinsic component of paired helical filaments. Brain Res 573: , 126–132. |
[72] | Lim ACB , Tiu S-Y , Li Q , Qi RZ ((2004) ) Direct regulation of microtubule dynamics by protein kinase CK2. J Biol Chem 279: , 4433–4439. |
[73] | De Felice FG , Vieira MNN , Bomfim TR , Decker H , Velasco PT , Lambert MP , Viola KL , Zhao W-Q , Ferreira ST , Klein WL ((2009) ) Protection of synapses against Alzheimer’s-linked toxins: Insulin signaling prevents the pathogenic binding of Abeta oligomers. Proc Natl Acad Sci U S A 106: , 1971–1976. |
[74] | Schwab C , McGeer PL ((2008) ) Inflammatory aspects of Alzheimerdisease and other neurodegenerative disorders. J AlzheimersDis 13: , 359–369. |
[75] | Verkhratsky A , Rodríguez JJ , Parpura V ((2013) ) Astroglia inneurological diseases. Future Neurol 8: , 149–158. |
[76] | Dhawan G , Floden AM , Combs CK ((2012) ) Amyloid-β oligomers stimulate microglia through a tyrosine kinase dependent mechanism. Neurobiol Aging 33: , 2247–2261. |
[77] | Eikelenboom P , Bate C , Van Gool WA , Hoozemans JJM , Rozemuller JM , Veerhuis R , Williams A ((2002) ) Neuroinflammation in Alzheimer’s disease and prion disease. Glia 40: , 232–239. |
[78] | Zhang Z , Wu Z , Zhu X , Hui X , Pan J , Xu Y ((2014) ) Hydroxy-safflor yellow A inhibits neuroinflammation mediated by Aβ1-42 in BV-2 cells. Neurosci Lett 562: , 39–44. |
[79] | Babus LW , Little EM , Keenoy KE , Minami SS , Chen E , Song JM , Caviness J , Koo SY , Pak DTS , Rebeck GW , Turner RS , Hoe HS ((2011) ) Decreased dendritic spine density and abnormal spine morphology in Fyn knockout mice. Brain Res 1415: , 96–102. |
[80] | Laurent CE , Smithgall TE ((2004) ) The c-Fes tyrosine kinase cooperates with the breakpoint cluster region protein (Bcr) to induce neurite extension in a Rac- and Cdc42-dependent manner. Exp Cell Res 299: , 188–198. |
[81] | Lucke-Wold BP , Turner RC , Logsdon AF , Simpkins JW , Alkon DL , Smith KE , Chen YW , Tan Z , Huber JD , Rosen CL ((2015) ) Common mechanisms of Alzheimer’s disease and ischemic stroke: The role of protein kinase C in the progression of age-related neurodegeneration. J Alzheimers Dis 43: , 711–724. |
[82] | Zheng Y , Gierut J , Wang Z , Miao J , Asara JM , Tyner AL ((2013) ) Protein tyrosine kinase 6 protects cells from anoikis by directly phosphorylating focal adhesion kinase and activating AKT. Oncogene 32: , 4304–4312. |
[83] | Mizuguchi Y , Specht S , Isse K , Sasatomi E , Lunz JG , TakizawaT , Demetris AJ ((2015) ) Breast tumor kinase/protein tyrosine kinase6 (Brk/PTK6) activity in normal and neoplastic biliary epithelia. J Hepatol 63: , 399–407. |
[84] | Carmena M , Ruchaud S , Earnshaw WC ((2009) ) Making the Auroras glow: Regulation of Aurora A and B kinase function by interacting proteins. Curr Opin Cell Biol 21: , 796–805. |
[85] | Mahadevan D , Bearss DJ , Vankayalapati H ((2003) ) Structure-based design of novel anti-cancer agents targeting aurora kinases. Curr Med Chem Anticancer Agents 3: , 25–34. |
[86] | Juhász G , Földi I , Penke B ((2011) ) Systems biology of Alzheimer’s disease: How diverse molecular changes result in memory impairment in AD. Neurochem Int 58: , 739–750. |
[87] | Klafki HW , Staufenbiel M , Kornhuber J , Wiltfang J ((2006) ) Therapeutic approaches to Alzheimer’s disease. Brain 129: , 2840–2855. |
[88] | Schneider LS , Mangialasche F , Andreasen N , Feldman H , Giacobini E , Jones R , Mantua V , Mecocci P , Pani L , Winblad B , Kivipelto M ((2014) ) Clinical trials and late-stage drug development for Alzheimer’s disease: An appraisal from 1984 to 2014. J Intern Med 275: , 251–283. |
Figures and Tables
Fig.1
Phosphorylation profiles (mean 2log signal intensity per Braak stage) for STK (A) and PTK (C). Red indicates high signal intensity, i.e., high protein kinase activity, while green and blue represent moderate and low signal intensity, i.e., low protein kinase activity. The box plots show the range of median 2log signal intensity for each sample per Braak stage for STK (B) and PTK (D). The boxes contain the values of 50 % of the samples, 25% above and 25% under the median, with the horizontal line representing the median of the data. The spacings between the different parts of the box indicate the degree of dispersion (spread) and skewness in the data. The length of the whiskers is 1.5 times the interquartile range. Whiskers reflect the variation, while outliers would be plotted as individual points.
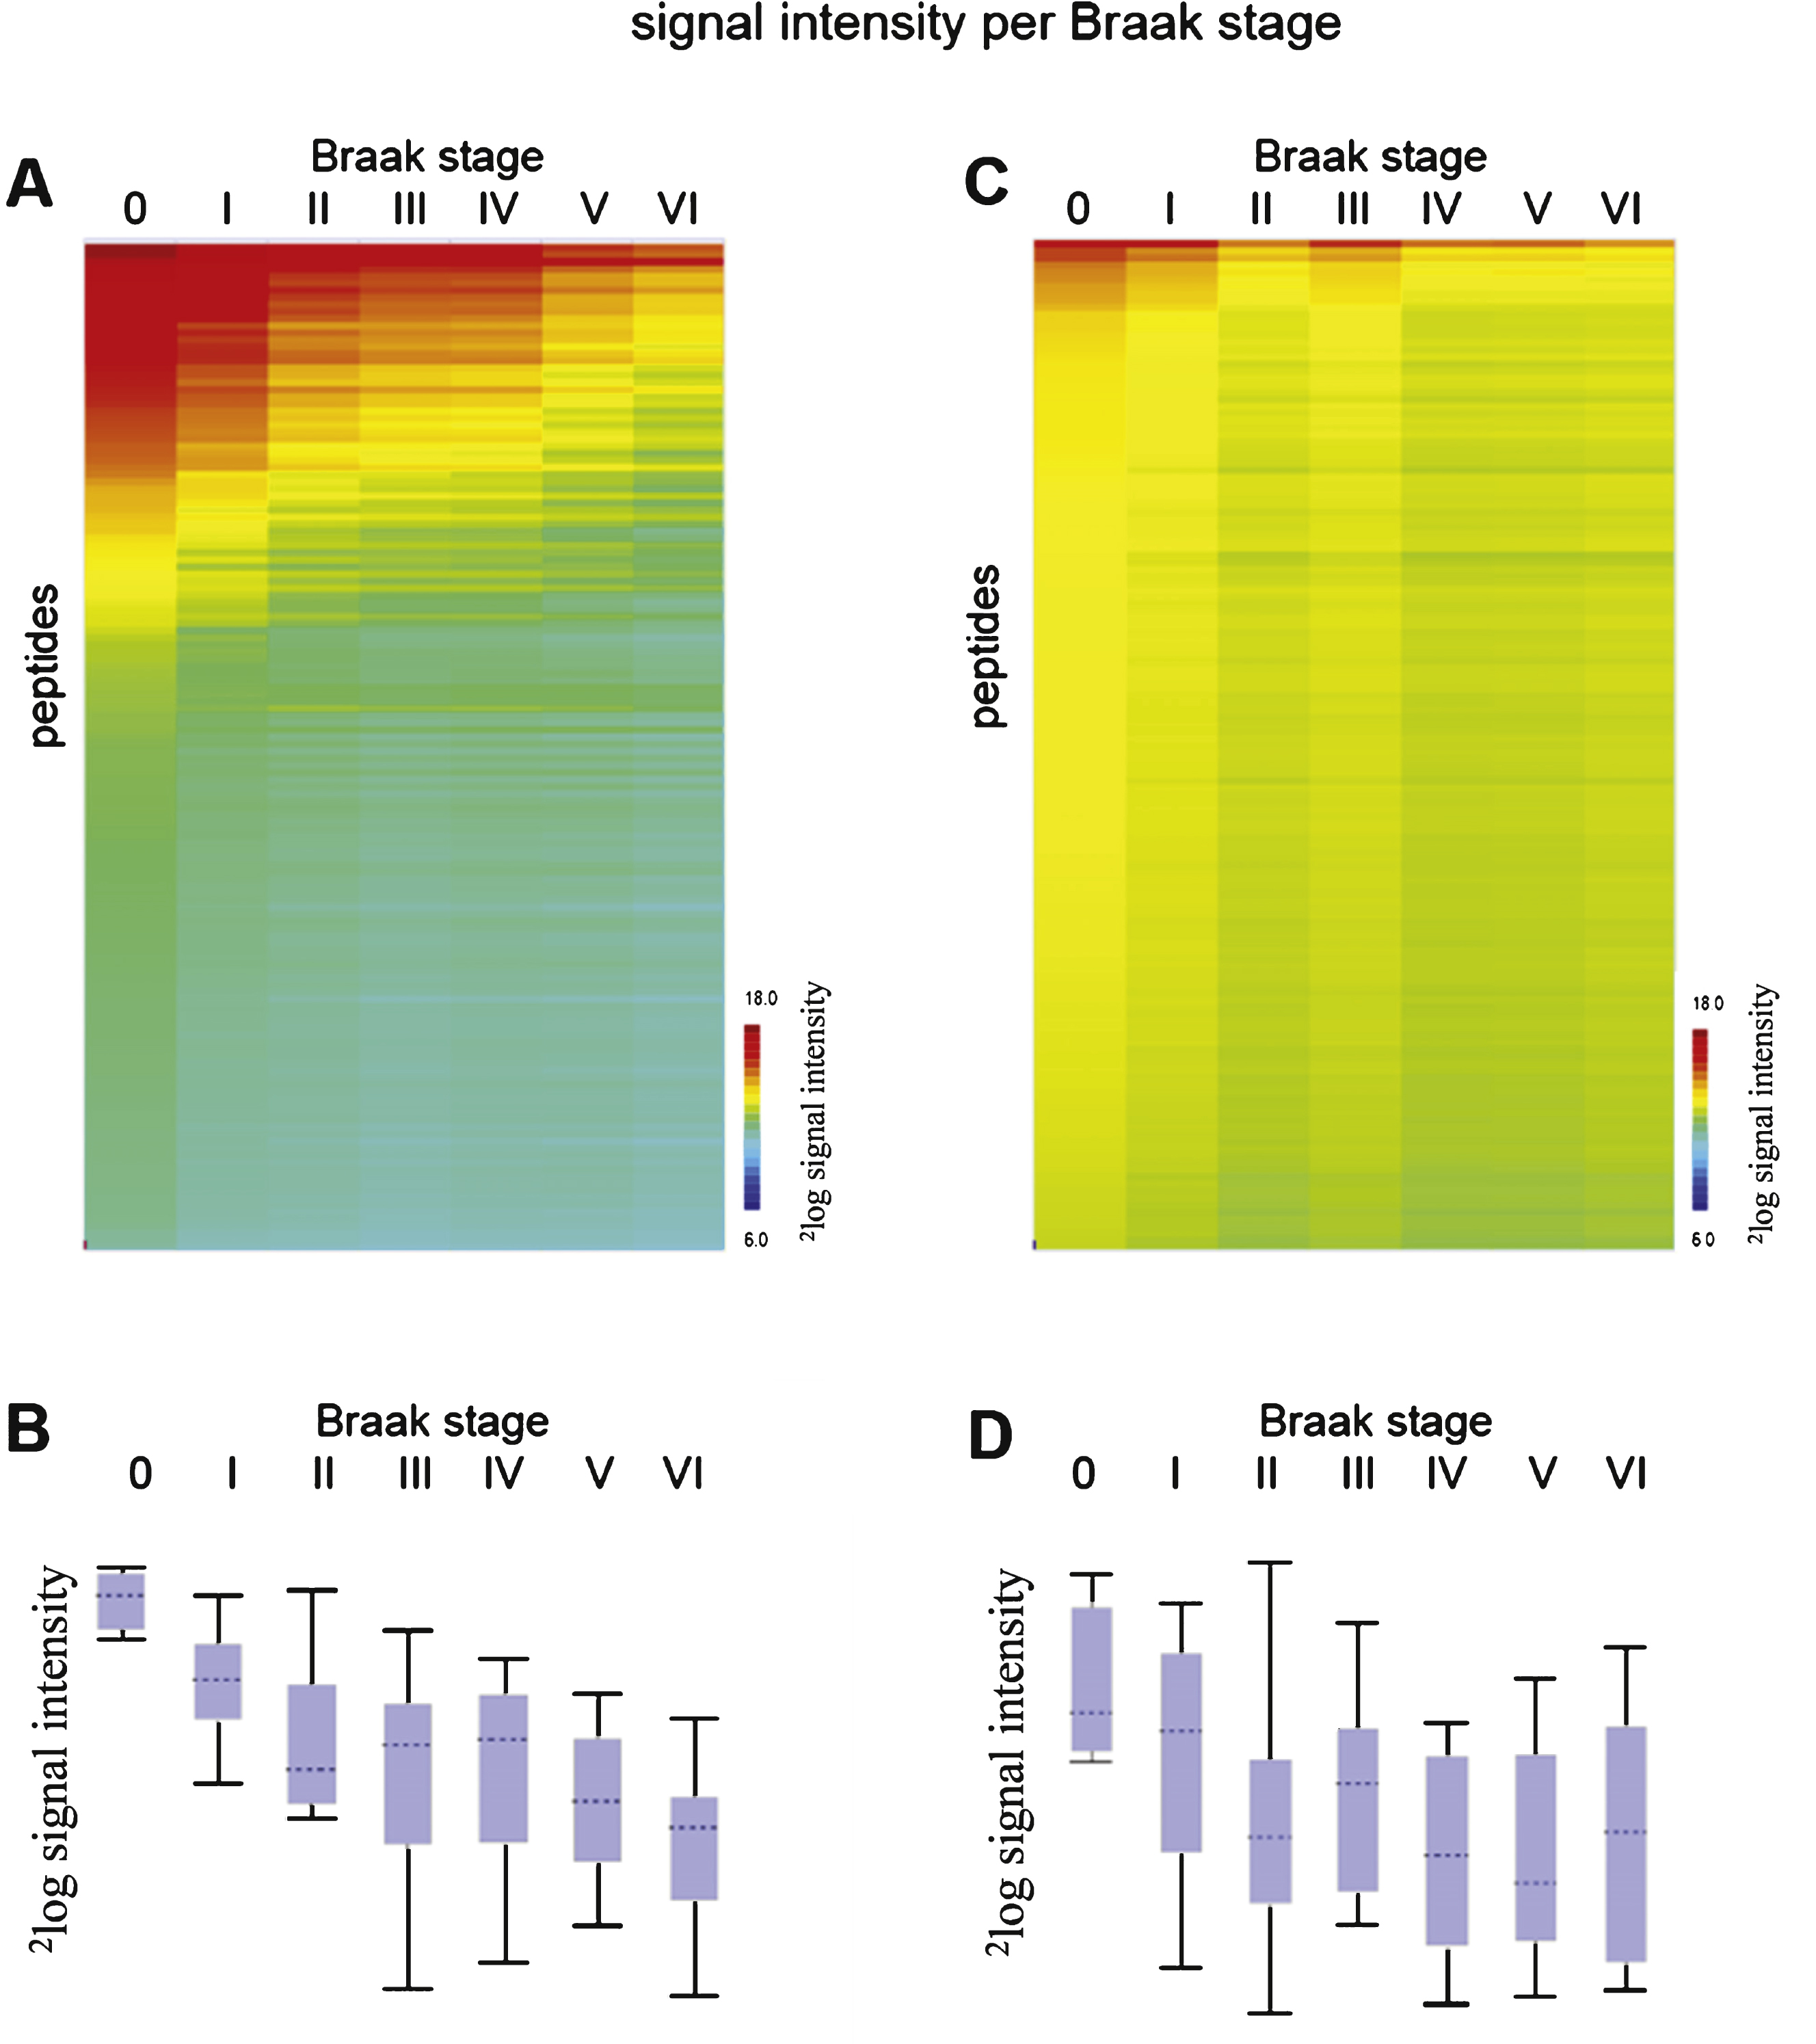
Fig.2
Reproducibility of sample preparation and protein kinase activity profiling. Relative signal intensity of each peptide from N = 100 study (A) and N = 19 study (B). Each column represents one case (for details about cases, see Supplementary Table 1). Centering (expressing the signal for each peptide relative to the mean for the cohort) was performed to make differences between samples more visible.
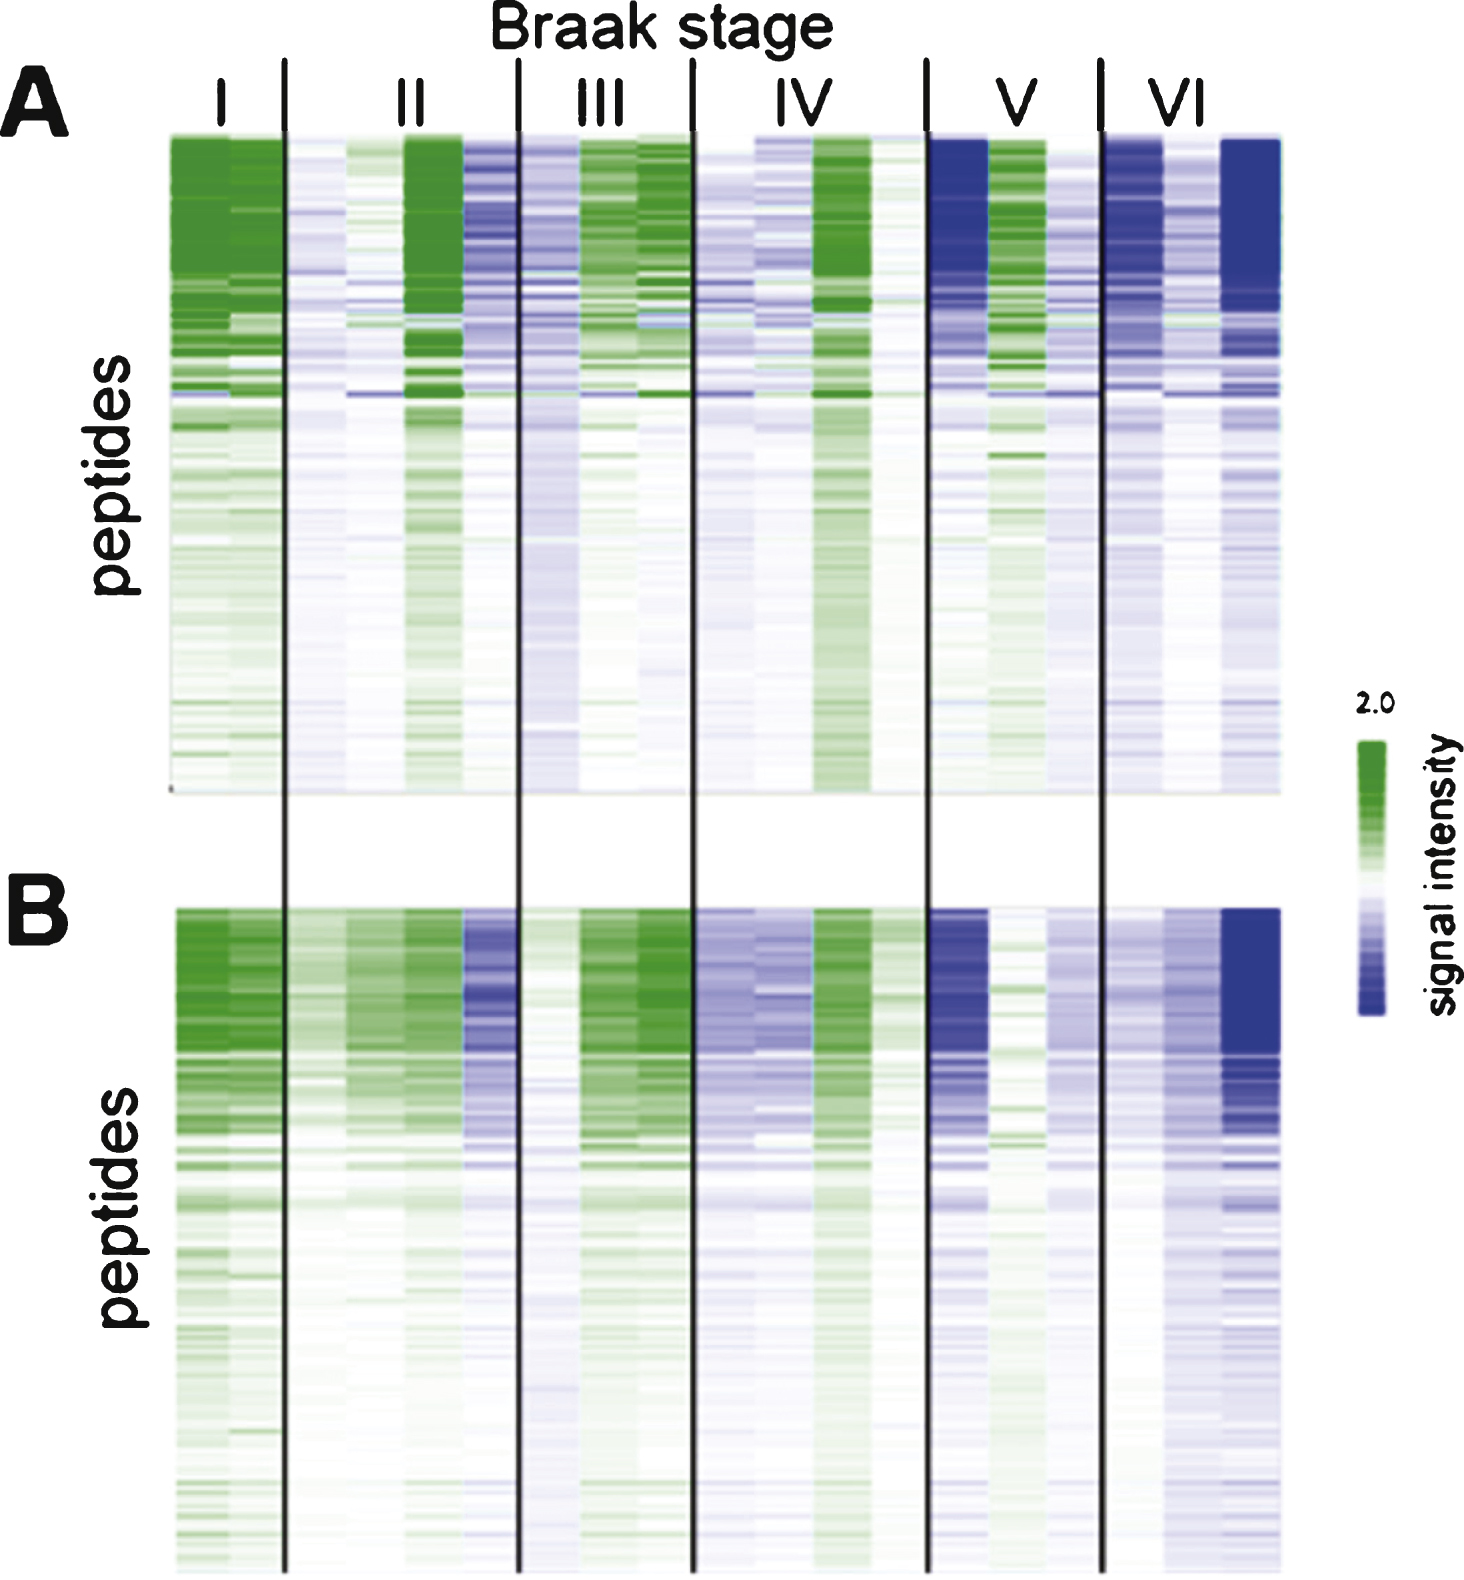
Fig.3
STRING protein-protein interaction network. Network of the interactions between 107 proteins containing the most significant peptides. Stars indicate highly connected proteins with a focus on kinases. Different colors represent different kinds of evidence of connection between proteins. Green represents neighborhood, red gene fusion, bright blue co-occurrence, black co-expression, pink experimental evidence, turquoise database evidence, light green evidence from text mining, and violet homology between the two proteins.
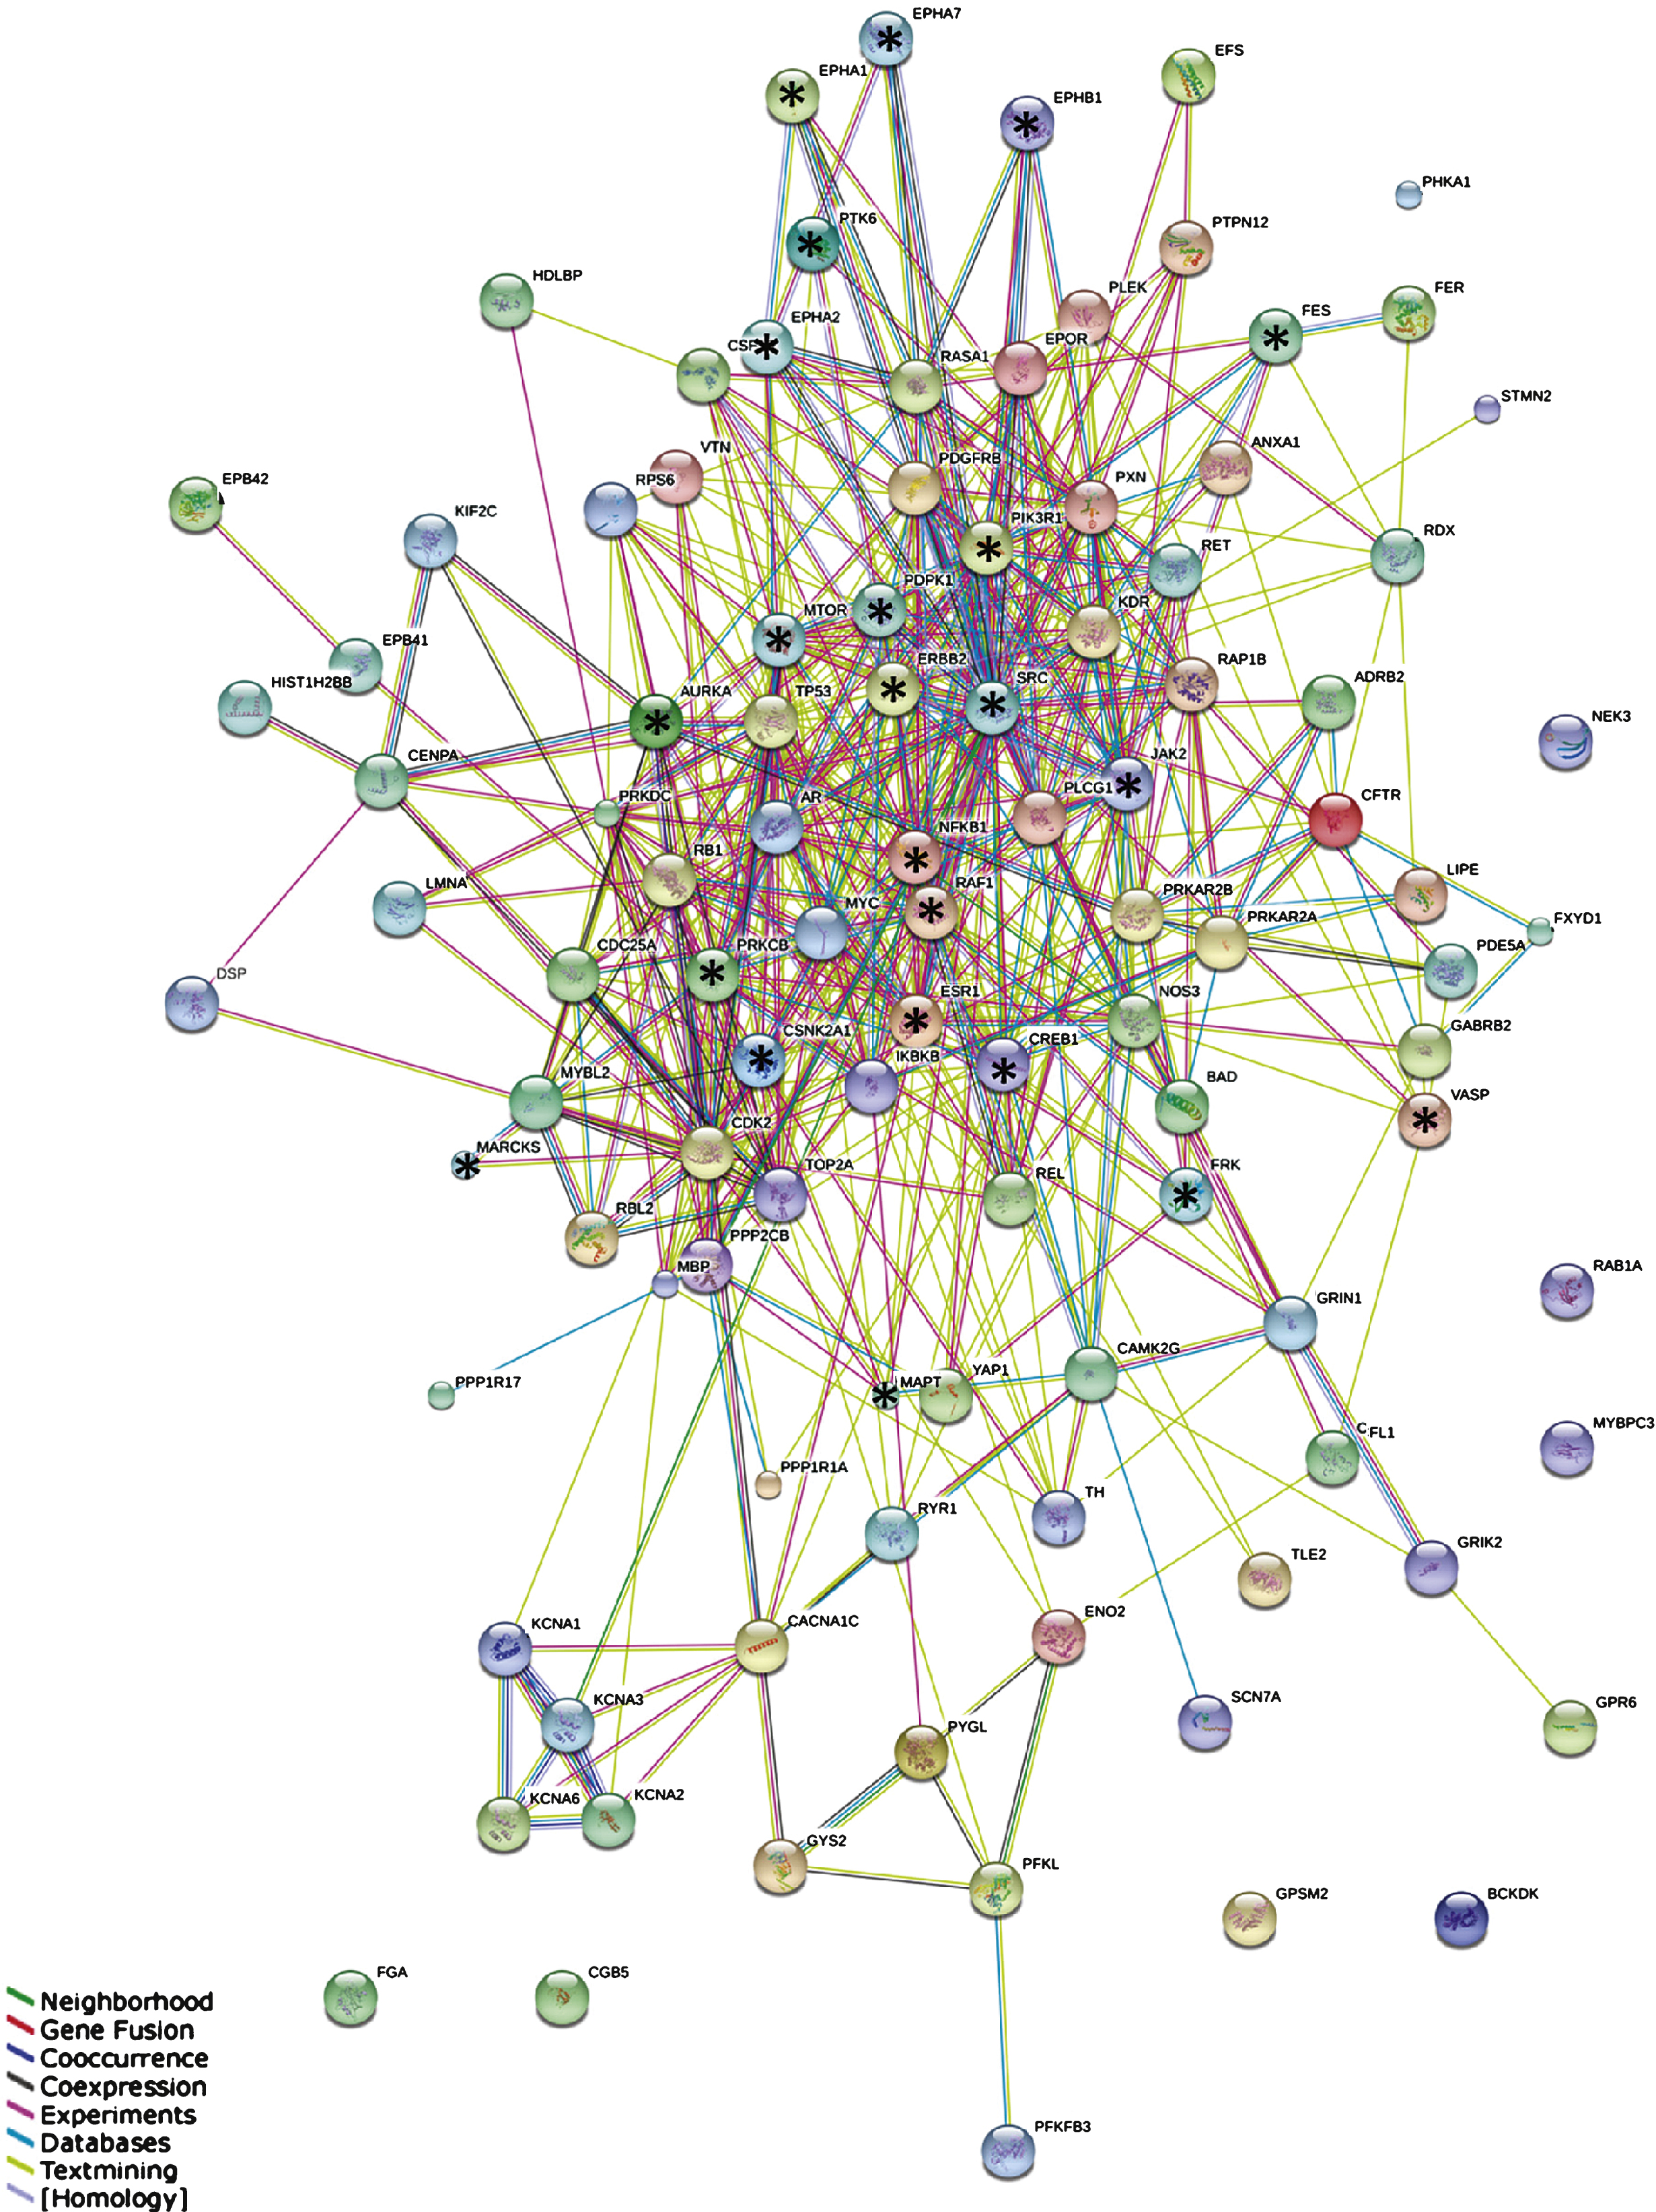
Fig.4
The 50 most significant MetaCoreTM pathways grouped in processes.
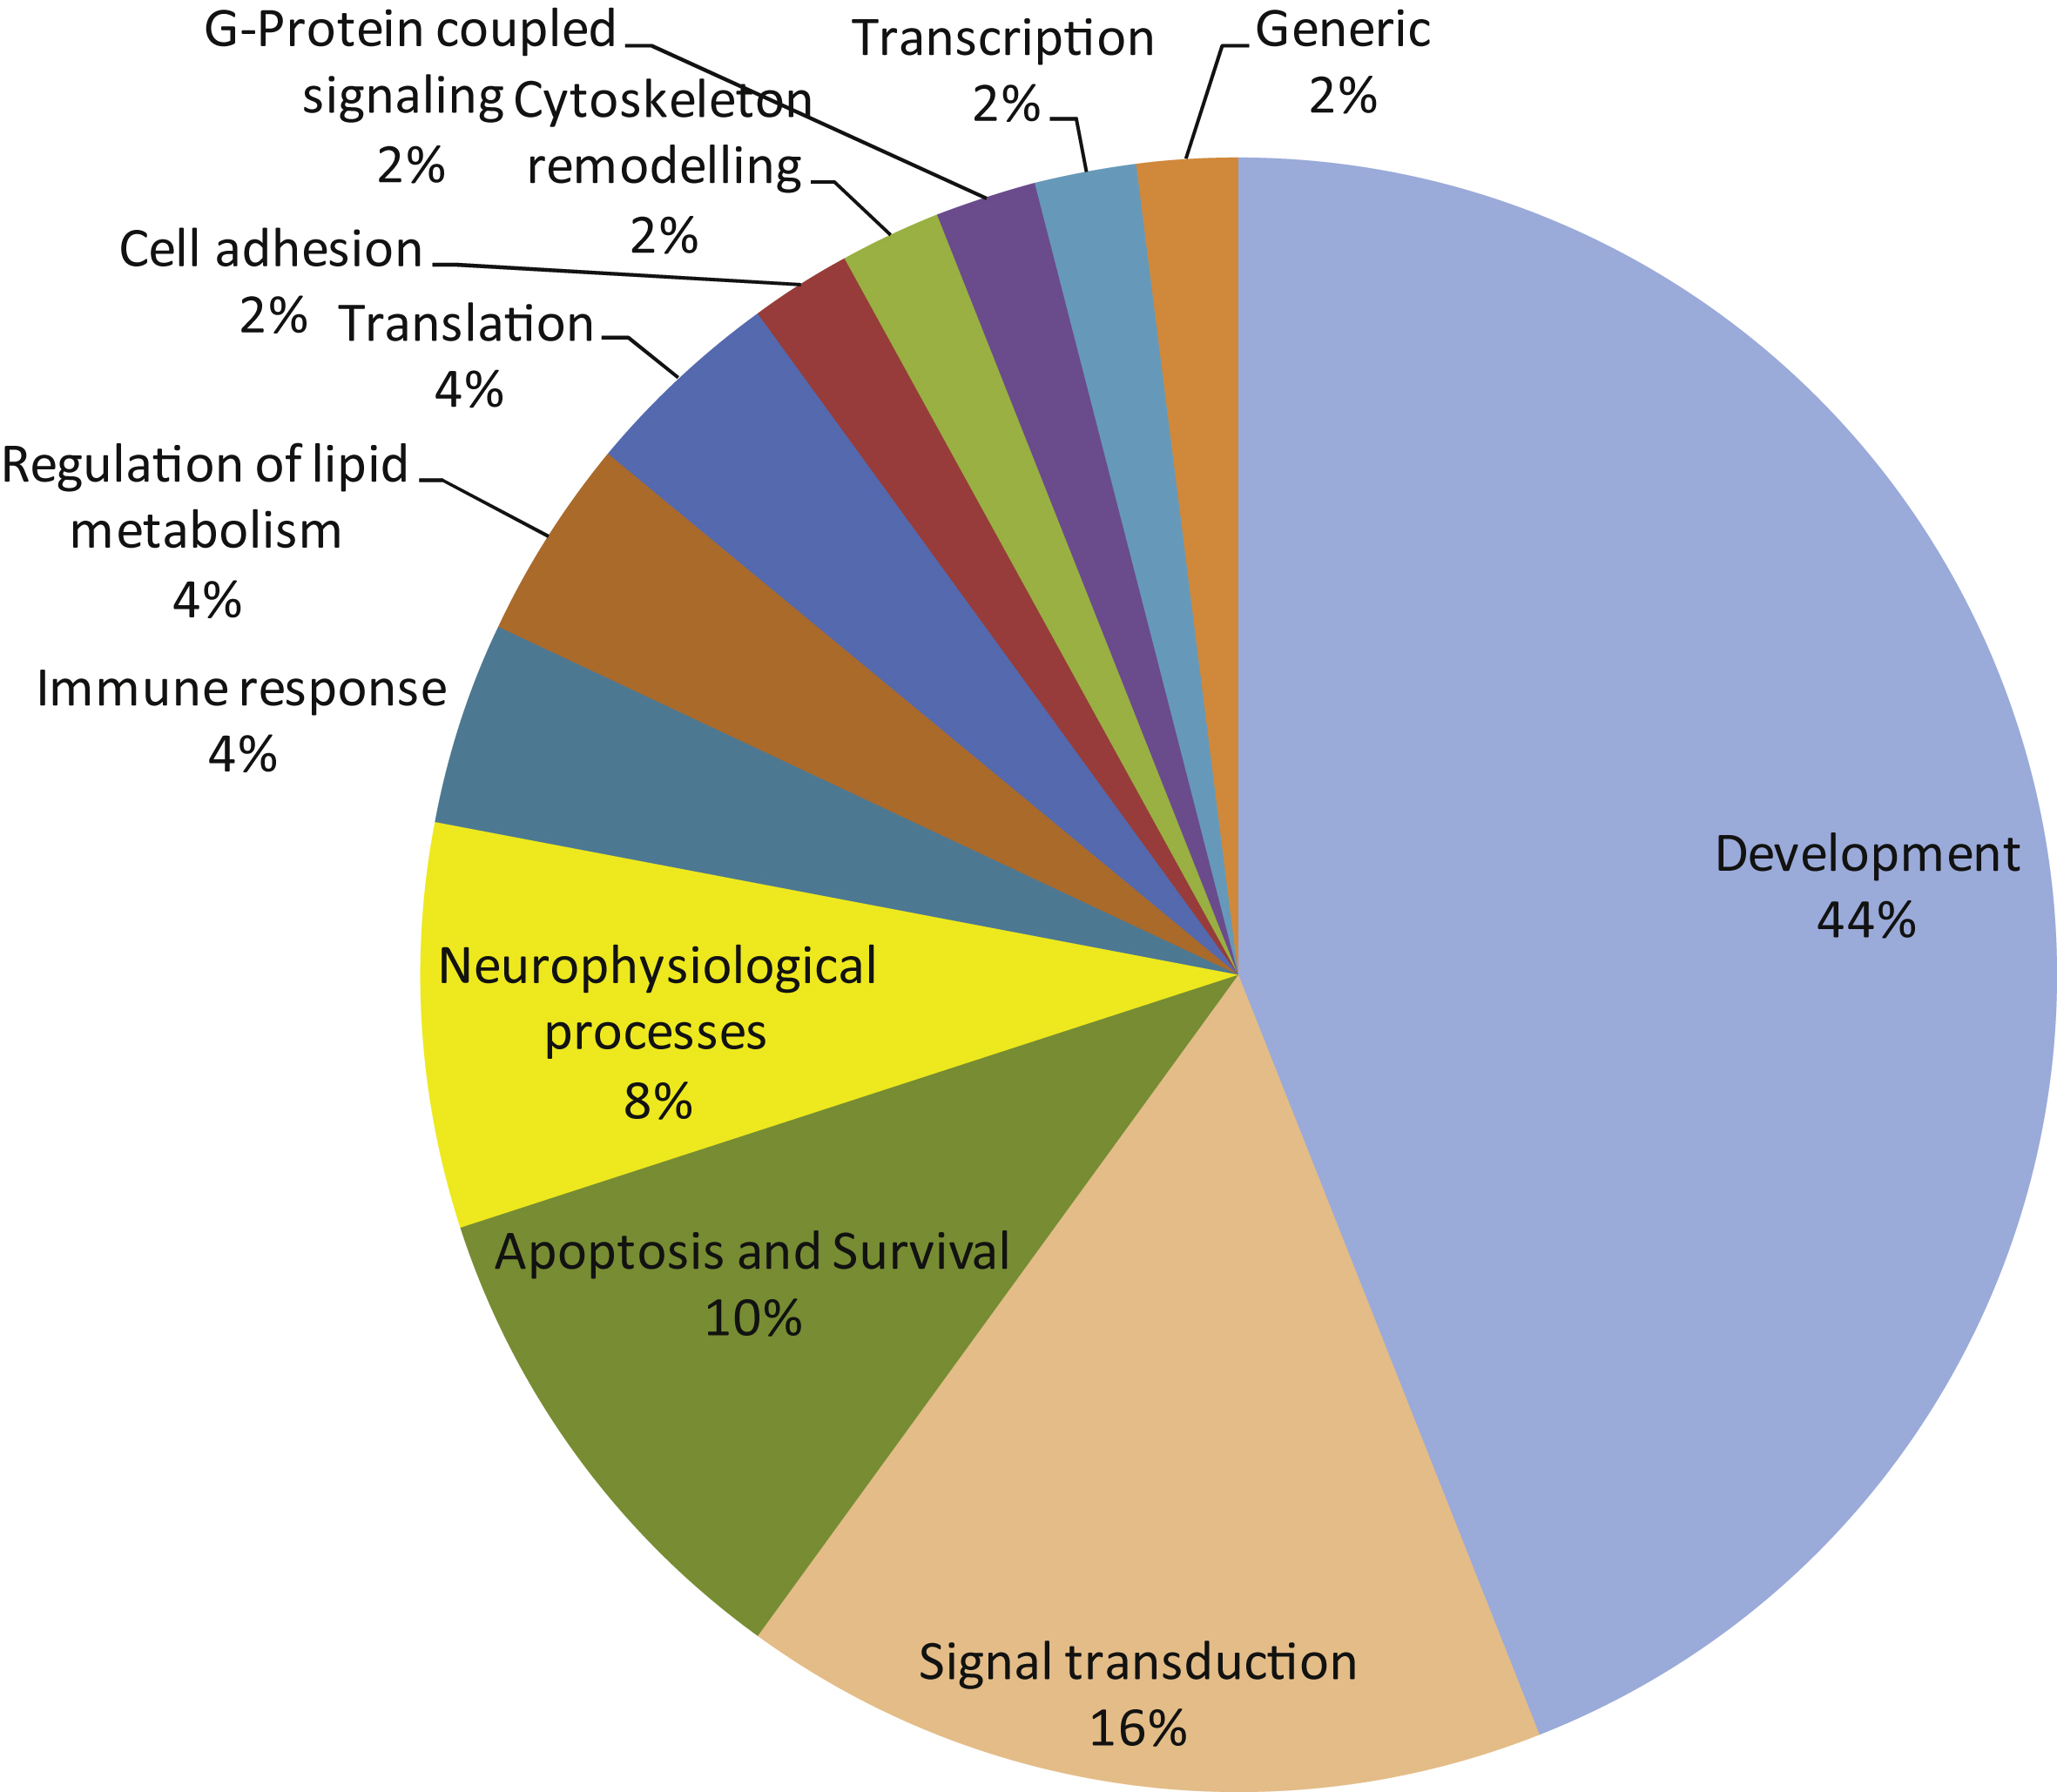
Fig.5
Phylogenetic tree of the human kinome. Kinases known to differentially phosphorylate phospho-sites present on the PTK and STK PamChip arrays (122 peptides) are projected on the tree. The size of the circle indicates the number of sites phosphorylated (range 1–10). For reasons of visualization, the circle size does not increase with 10+ phosphorylation sites. Black circles indicate upstream kinases presented as highly connected nodes in the STRING analysis (Fig. 3). A) Upstream kinases identified from HPRD, Reactome, or Phosphosite database. B) Venn diagram for the overlap between these databases for the 122 most significantly changed peptides.
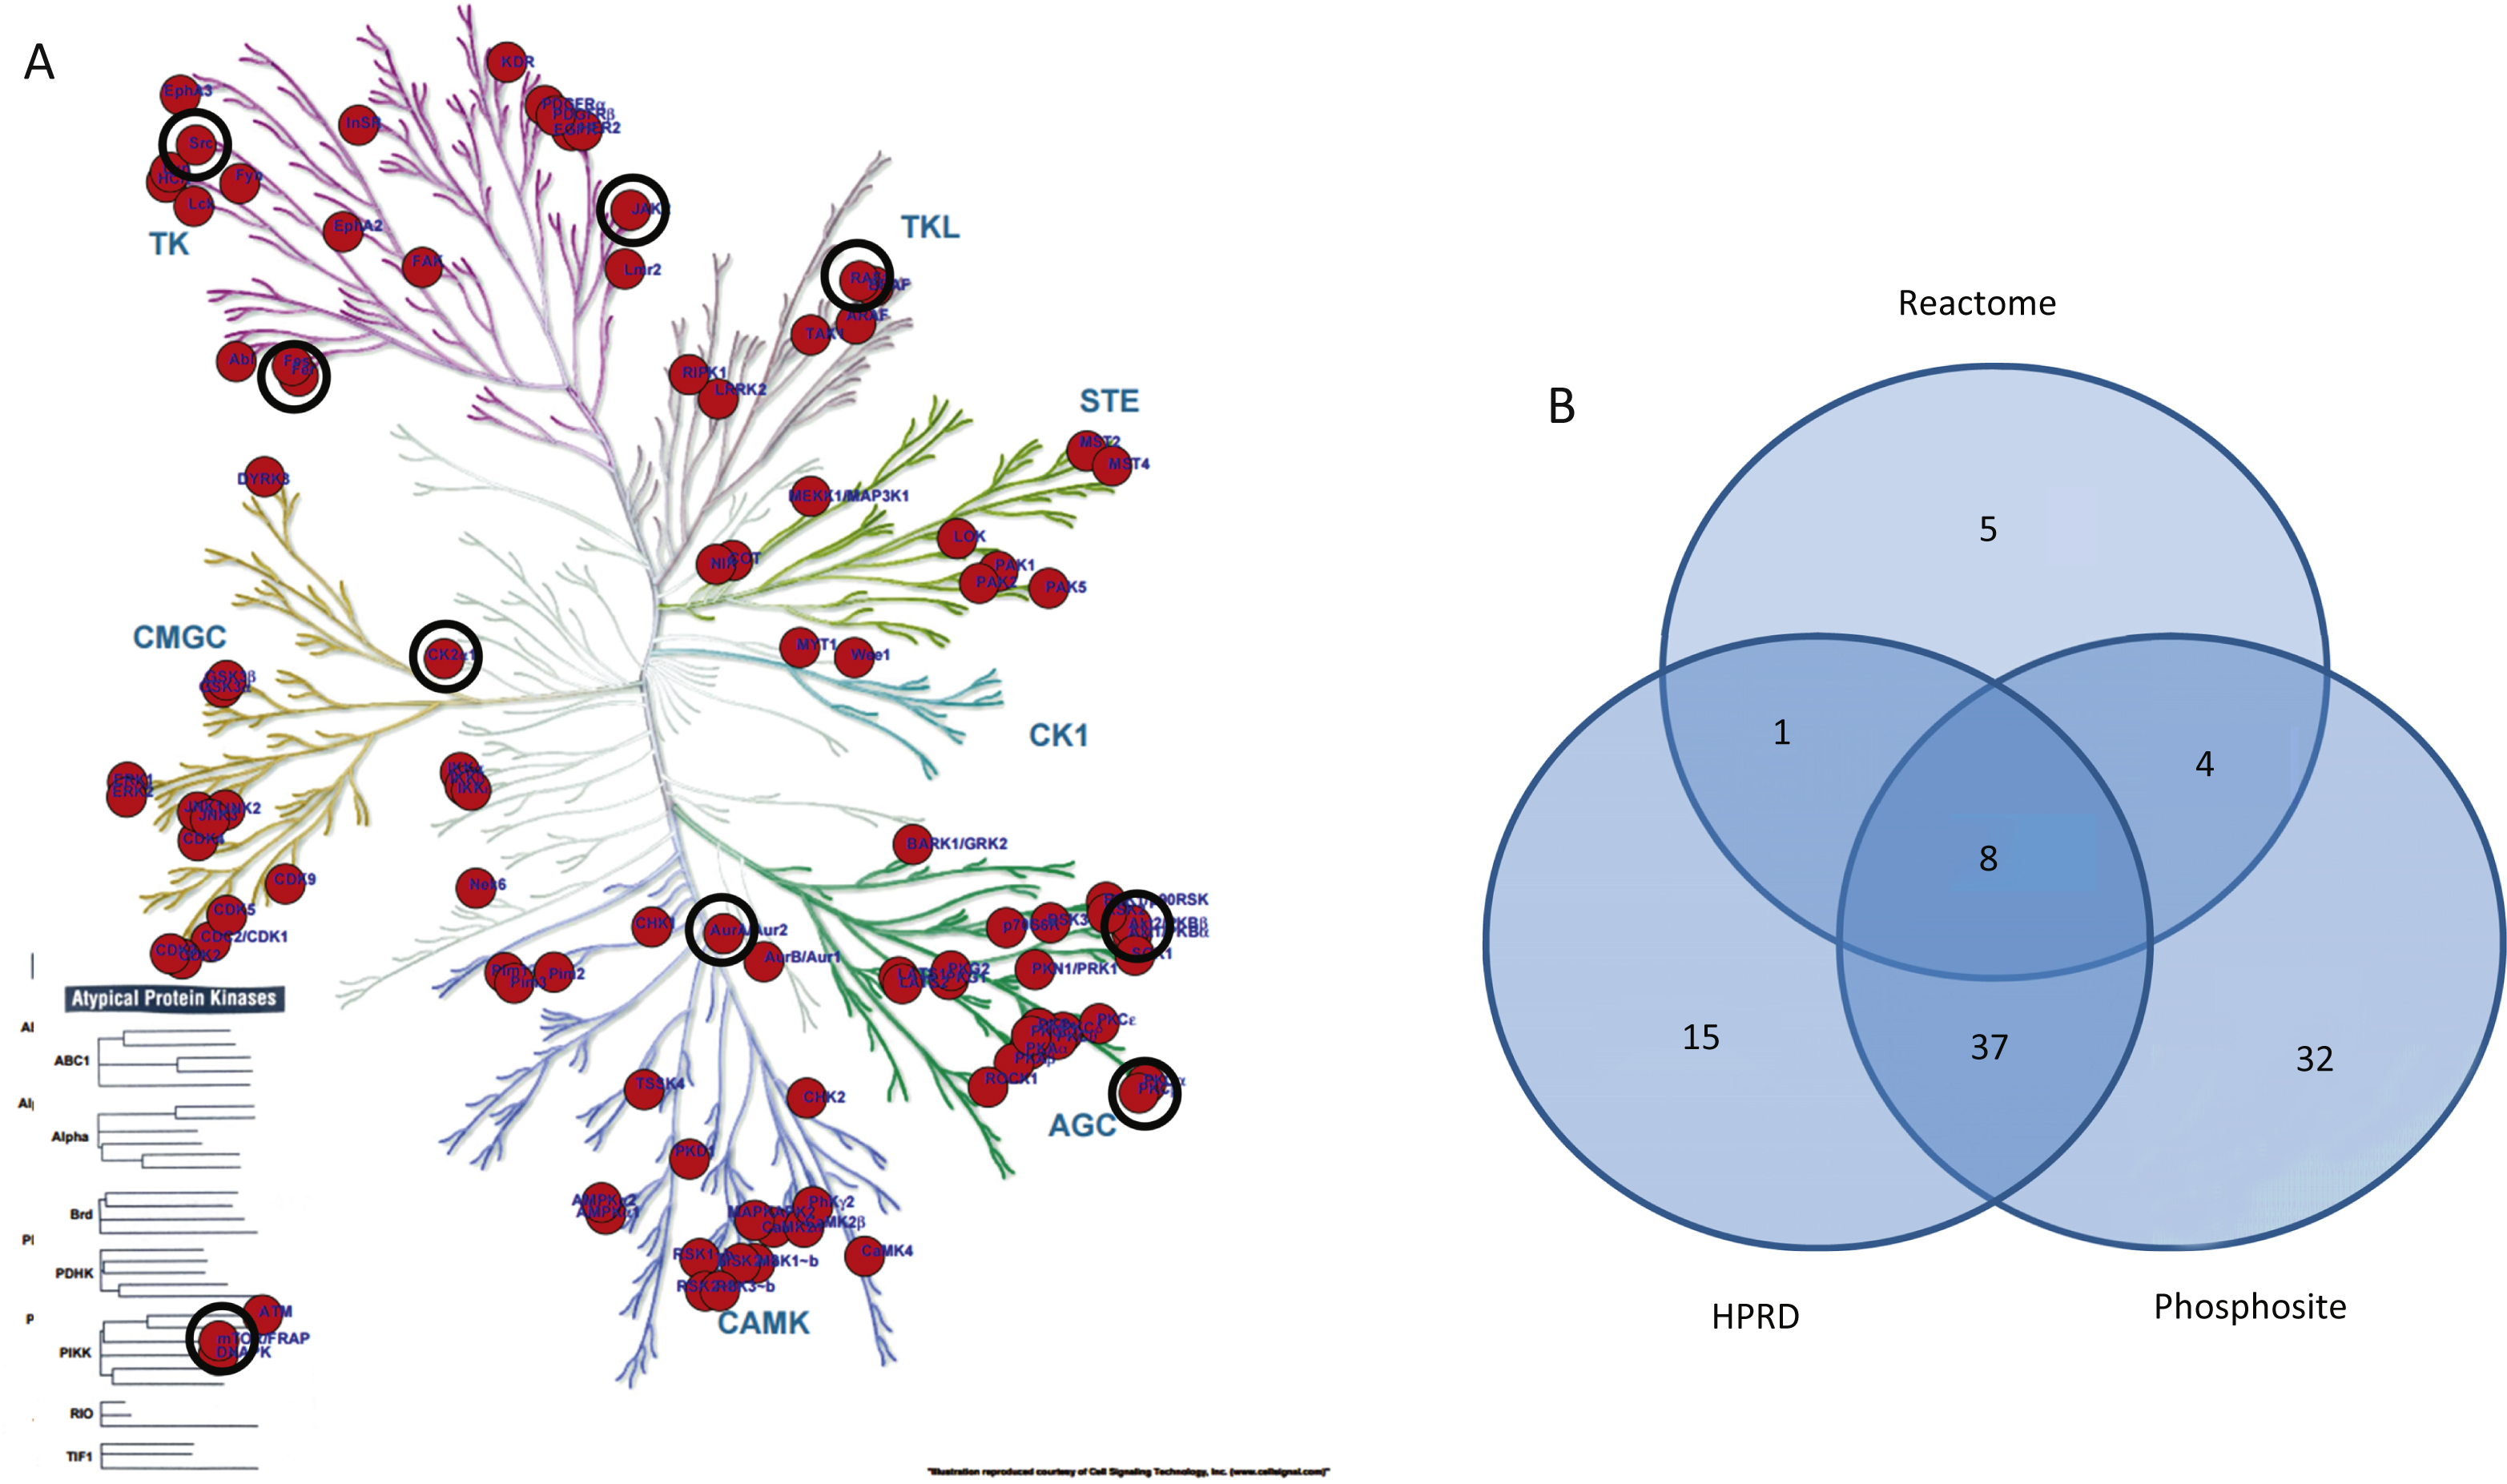
Table 1
Patient characteristics
| Total | Male | Female | Range Male | Female | |||||
| N | 100 | 36 | 64 | ||||||
| AD | 60 | 19 | 41 | ||||||
| Mean Age [years] | 81 | 76 | 83 | ||||||
| Median Age [years] | 83 | 79 | 84 | (51–39) | (50–100) | ||||
| Mean PMD [hours] | 5.65 | 6.09 | 5.44 | ||||||
| Median PMD [hours] | 5.20 | 5.35 | 5.18 | (3.40–12.55) | (2.55–15.40) | ||||
| Braak stage (tau) | Total | Male | Female | Braak stage (Aβ) | O | A | B | C | not det. |
| 0 | 4 | 4 | 0 | 4 | |||||
| 1 | 18 | 7 | 11 | 6 | 6 | 5 | 1 | ||
| 2 | 15 | 5 | 10 | 7 | 1 | 6 | 1 | ||
| 3 | 15 | 7 | 8 | 1 | 2 | 6 | 5 | 1 | |
| 4 | 14 | 4 | 10 | 1 | 12 | 1 | |||
| 5 | 17 | 3 | 14 | 1 | 15 | 1 | |||
| 6 | 17 | 6 | 11 | 17 |
AD, Alzheimer’s disease; PMD, postmortem delay; Braak stage for tau (left) and amyloid-β (right); not det., not determined.
Table 2
Overview of STK and PTK antibodies
| Name, type | Species | Epitope (immunogen) | Source |
| PY20-FITC | monoclonal mouse | phospho-tyrosine | AbD Serotec, Bio-Rad, Hercules, CA, USA |
| #9624 | monoclonal rabbit | phospho-PKA substrate (RRXY*/T*) | Cell Signaling, Danvers, Massachuseets, USA |
| #9614 | monoclonal rabbit | phospho-AKT substrate (RXXS*/T*) | Cell Signaling, Danvers, Massachuseets, USA |
| #2325 | monoclonal rabbit | phospho-MAPKC/CDK substrate (PXS*P or S*PXR/K) | Cell Signaling, Danvers, Massachuseets, USA |
| STK detection | polyclonal swine | anti-rabbit fluorescein isothiocyanate labelled | PamGene International BV |

