
Effects of Low Amyloid-β (Aβ) Concentration on Aβ1–42 Oligomers Binding and GluN2B Membrane Expression
Abstract
Numerous studies have shown that amyloid-β (Aβ) modulate intracellular metabolic cascades and an intracellular Ca2+ homeostasis and a cell surface NMDA receptor expression alteration in Alzheimer’s disease (AD). However most of these findings have been obtained by using non-physiological Aβ concentrations. The present study deals with the effect of low Aβ concentrations on cellular homeostasis. We used nerve growth factor-differentiated PC12 cells and murine cortical neurons sequentially treated with low chronic monomeric or small oligomeric Aβ concentrations and high acute oligomeric Aβ concentrations to bring out a priming effect of chronic treatment on subsequently high Aβ concentrations-elicited cellular response. Both cell types indeed displayed an enhanced capacity to bind oligomeric Aβ after monomeric or small oligomeric Aβ application. Furthermore, the results show that monomeric Aβ1–42 application to the cells induces an increase of the Ca2+-response and of the membrane expression of the extrasynaptic subunit of the NMDA receptor GluN2B in PC12 cells, while the opposite effects were observed in cultured neurons. This suggests a sequential interaction of Aβ with the cellular plasma membrane involving monomers or small Aβ oligomers which would facilitate the binding of the deleterious high molecular Aβ oligomers. This mechanism would explain the slow progression of AD in the human nervous system and the deep gradient of neuronal death observed around the amyloid plaques in the nervous tissue.
INTRODUCTION
The neuropathological hallmarks of Alzheimer’s disease (AD) are characterized by the presence of large extracellular deposits of fibrillar amyloid-β (Aβ) [1–3] and intraneuronal neurofibrillary tangles [4–6]. However, different observations suggest that fibrillar Aβ may not be the primary toxic assembly state responsible for AD pathogenesis. Several groups have reported that individuals with normal cognitive function have Aβ plaque loads that either meet or exceed the criteria for AD diagnosis [7]. Studies have also revealed a positive correlation between soluble Aβ levels and the severity of dementia [8, 9], further suggesting a key role for soluble oligomers species in AD. In vitro studies have reported that not only soluble oligomers and protofibrils are toxic to neuronal cells [10], but that they are more toxic than fibrils [11, 12].
Considering the progression of AD, the mode of exposure of nerve cells to amyloid-β (Aβ) peptides seems to be very important. The question remains whether low soluble Aβ concentrations induce a change in nerve cells. The initial events probably involve the interaction of soluble oligomers with neuronal membranes [13]. But AD evolves over decades in human, while most in vitro experiments are performed within minutes or hours. Similarly, in most biochemical or electrophysiological experiments designed to decipher the mode of action of Aβ, the used concentrations are not physiological.
In an attempt to address this question we used PC12 cells, a cell line which displays a neuronal phenotype when cultivated in the presence of nerve growth factor and primary cultures of mouse cortical neurons. We show that these cells have an increased capacity to bind Aβ oligomers after pre-incubation with nanomolar concentrations of soluble Aβ1–42 and that the toxic effect of oligomers at micromolar concentrations is enhanced. Moreover, we also show that cell exposure to high concentrations of Aβ1–42 oligomers rapidly induces changes in the membrane expression of the GluN2B subunit of the NMDA receptor. These observations may partly explain the slow progression of the disease in the human brain.
MATERIALS AND METHODS
Cell culture
PC12 cells (rat pheochromocytoma) were cultured in RPMI 1640 medium supplemented with 5% heat-inactivated horse serum, 10% fetal bovine serum and antibiotics (penicillin 100 U/ml, streptomycin 100 U/ml) at 37°C in 5% CO2. PC12 cells were reseeded once a week. Before use, cells were plated in 35 mm glass-bottom culture dishes coated with rat tail type I collagen (0.1 mg/ml) and Poly-L-ornithine (0.5 mg/ml) and NGF (50 μg/l) was added in the culture medium to induce their neuronal differentiation. Cells were used after 5 days in vitro.
Except for rat tail type I collagen and poly-L-ornithine which were supplied by Sigma-Aldrich (Sigma, St. Louis, MO) all products used to cultivate PC12 cells were supplied by Life Technologies® (St Aubin, France).
Primary neuronal cultures were prepared from C57Bl6-OF1 mouse embryos (E16-E18). Pregnant females were from Charles River (L’Abresle, France) or from Chronobiotron-CNRS (Strasbourg, France). Cortices were dissociated in a trypsin-EDTA enzymatic solution (0.05% , Life Technologies) for 2 min at 37°C. The dissociation was then mechanically completed in Neurobasal medium supplemented with B27 (2% ), glutamax (1% ), and antibiotics (streptomycine 100 U/mL, penicillin 100 U/mL). After centrifugation (500 g, 5 min), the pellet was resuspended in Neurobasal medium and seeded on glass-bottom culture dishes (Corning, Avon, France). The cultures were kept at 37°C under 5 % CO2 atmosphere during 9 to 14 days with a partial medium renewal every 2 days.
Preparation of amyloid peptide monomers, oligomers
Aβ1–42 (Bachem, Bubendorf, Switzerland) was dissolved in hexafluoroisopropanol (HFIP; Sigma-Aldrich), distributed in aliquots, dried (HFIP film) and stored at −80°C as previously described [14, 15]. The day before the experiment the peptide film was dissolved (1 mM) in sterile dimethylsulfoxide (DMSO). The solution was then diluted with phosphate buffered saline (PBS, pH 7.4) at a final nominal concentration of 100 μM and aged overnight at 4°C. The preparation was centrifuged for 15 min at 14000× g to remove insoluble aggregates (Protofibrils and fibrils) and the supernatant containing soluble Aβ1–42 oligomers was transferred to new tubes and stored at 4°C. The “monomer” solutions were used immediately after dissolution in DMSO.
We measured Aβ1–42 concentrations in the stock solution with a classical method (Bradford). However in the experimental conditions of cell pre-treatment, the Aβ1–42 solution was applied within the culture medium, which introduces measurement bias. We thus used an ELISA kit specifically developed for Aβ1–42 (BetaMark-x42, Eurogentec, San Diego, CA USA). In this case, the actual final concentration measured was between 2 and 4 nM for a nominal concentration of 10 nM. For this reason, the nominal concentration is systematically quoted, knowing that the final concentration is probably less.
Aβ peptidic treatment
The Aβ1–42 and the Aβ42–1 synthetic peptides (Bachem) were first dissolved in DMSO (Sigma) and then diluted in the working media. According to experimental conditions, two types of peptidic treatments have been applied on the cells. For “chronic” treatment, cells were maintained at 37°C in 5% CO2 and the treatment consisted of an overnight application of peptide Aβ1–42 or Aβ42–1 (10 nM nominal). For “acute” application, Aβ1–42 or the reverse peptide Aβ42–1 were diluted in phosphate buffered saline (PBS) for immunochemistry or Hepes buffer (D–Glucose 5.5 mM, MgCl2 1 mM, CaCl2 2 mM, NaCl 130 mM, KCl 5.4 mM, Hepes 10 mM, pH 7.4) buffer for calcium imaging and then applied to the cells at a final concentration of 1 μM. To quantify the binding of Aβ1–42 oligomers to the cells (see following section), this solution was applied at 200 nM final concentration.
Immunocytochemistry
In a first double immunolabeling experiments (Figs. 2 and 3), cells were acutely treated ([Aβ1–42 or the reverse Aβ42–1] = 1 μM diluted in PBS, for 10 min). Cells were subsequently rinsed to eliminate unbound Aβ and fixed with 4% paraformaldehyde in PBS for 10 min. Cells were then incubated in a blocking solution (3% BSA in PBS) for 1 h at room temperature. Fixed and non-permeabilized PC12 cells were first incubated with Alexa Fluor 488-conjugated cholera toxin subunit B (1 : 500, Life Technologies) for 30 min at room temperature, then washed and incubated overnight with a primary antibody directed against every forms of Aβ (6E10, mouse monoclonal, 1 : 1000, Covance Inc., Rueil-Malmaison, France). Cells were washed 3×10 min with the blocking solution and incubated with the appropriate secondary Dylight 549-conjugated Goat anti-mouse IgG (1 : 1000, Jackson ImmnunoResearch Laboratories Inc., West Grove, PA, USA). Glass slides were mounted in Mowiol and observed with a Nikon DIAPHOT–TMD inverted fluorescence microscope and images were acquired with a digital camera (DXM1200, Nikon) and the Metamorph software (Molecular Devices).
In experiments aimed at quantifying the binding of Aβ1–42 oligomers (Figs. 6 and 7) the cells have undergone a chronic treatment ([Aβ1–42 or the reverse Aβ42–1] = 10 nM diluted in culture media overnight) and/or an acute treatment with 200 nM Aβ1–42 oligomer solution or with 200 nM Aβ42–1 in order to avoid micrograph light saturation. A rabbit polyclonal antibody A11 directed against Aβ oligomers (Chemicon International, Temecula, CA; diluted 1 : 1500 in blocking solution) was applied to the cells overnight at 4°C. Cells were washed three times for 10 min with the blocking solution and incubated with the appropriate secondary alexa 546-conjugated antibody (1 : 2000, Life Technologies) for 2 h at room temperature, washed 3×10 min in PBS. In this case fixed primary cultured neurons were also incubated with an anti MAP2 primary antibody (chicken polyclonal, 1 : 5000, Thermo Scientific) and with an anti-GFAP antibody (rabbit polyclonal, 1 : 5000, Dako, Denmark) and revealed with secondary antibodies (Dylight.649 goat anti chicken IgY, 1 : 1000 and Dylight 488 anti rabbit IgG, 1 : 1000; Jackson ImmnunoResearch Laboratories Inc.).
For GluN2B quantification experiments, cells were incubated with an antibody directed against the GluN2B subunit (Rabbit polyclonal, 1 : 500, Abcam, Bristol, UK). The immunoreactivity was then revealed by incubating the preparation with Dylight 488-conjugated Goat anti-rabbit IgG antibodies (1 : 1000, Jackson ImmnunoResearch Laboratories Inc.) for 2 h at room temperature, washed 3×10 min in PBS and mounted in Mowiol.
In some experiments, fixed neurons were also incubated with an anti-Thy-1.2 primary antibody (rat monoclonal, 1 : 1000; Pharmingen, San Diego, USA) and revealed with Dylight 549-conjugated Goat anti-rat IgG (1 : 1000, Jackson ImmnunoResearchLaboratories Inc.).
For quantitative imaging, the micrograph recordwas performed on a Carl Zeiss LSM 510 confocal microscope (Munich, Germany). Images were subsequently processed with Image J software (NIH) for quantification and the Pearson coefficient was calculated to assess for the co-localization of the markers.
Calcium imaging
Fura-2 AM dissolved in DMSO (100 μM) and Pluronic F-127 (16 μM dissolved in DMSO, Life Technologies) were mixed (1/1 v) and added to cells platted on glass–bottom culture dishes in a Hepes buffer for 20 min at 37°C (1 μM Fura-2 final concentration). Cells were washed 3 times and again incubated in Hepes buffer for 20 min at 37°C to ensure the complete probe hydrolysis. Cells were maintained in Hepes buffer during image acquisition. Data were acquired with an Axiovert 135 microscope (Carl Zeiss), an IMAGE-CDD digital camera (Hamamatsu photonics) and the MetaFluor software (Molecular Devices). Fluorescence was excited by a xenon lamp equipped with two alternating filters allowing a fluorescence excitation at 350 nm for Ca2+-bound Fura-2 and at 380 nm for unbound Fura-2. Emitted fluorescence intensities (510 nm) were measured from regions of interest centered on individual cells. A pair of images was captured every five seconds. Normalized ratio were calculated by dividing all ratio between fluorescence intensities emitted when cells were excited at 350 nm and when cells were excited at 380 nm by the mean of this ratio during baseline time (F 350/F 380)/mean (F 350/F 380). Variations of these normalized ratio reflect [Ca2+]i changes.
Cells were pretreated with Aβ1–42 or reverse Aβ42–1 (10 nM) overnight when required. Aβ1–42 (1 μM final concentration), reverse Aβ42–1 (1 μM) were dissolved in Hepes buffer and added to the extracellular medium about 3 min after starting the recording. When required, N-methyl-D-aspartate receptor (NMDAR) antagonists were added to the extracellular medium just before starting theacquisition.
Western blots
To characterize the proportions of Aβ monomers and oligomers in the solutions applied on cells, chronic and acute solutions were prepared by diluting Aβ1–42 in RPMI medium (50 nM) or in PBS (1 μM). Samples were diluted in a reducing sample buffer (TrisHCl 63 mM, glycerol 30% , SDS 2% , Bromophenol blue 0.00025% , pH 6.8) and electrophoretically separated by SDS-PAGE using 4–20% Tris-Glycine polyacrylamide gels and Novex Tris Glycin running buffer (Life Technologies) at 125 mV for 1 h 40 min. The gels were transferred to nitrocellulose membranes (1 h 15 min at 125 mA) in transfer buffer (Tris 25 mM, Glycine 192 mM, SDS 0.02% , ethanol 20% ). The membranes were blocked in 0.5% nonfat dry milk in PBS-Tween20 0.1% and incubated for 15 min with an monoclonal anti-Aβ 6E10 primary antibody (Covance Inc.) and an HRP-conjugated Goat anti-mouse IgG secondary antibody (Jackson) using the SNAPi.d system (Millipore, Molsheim, France). Final detection was performed with chemioluminescence (Supersignal west femto sensitivity substrate, Thermo Scientific) using CL-Xposure films (Thermo Scientific).
Statistical analysis
Values are expressed as mean ± standard deviation. The statistical significance was assessed by one way ANOVA and subsequent Bonferroni test analysis.
RESULTS
Biochemical characterization of Aβ1–42 oligomers
Each peptide preparation applied to the cells was evaluated for the presence of soluble oligomers by SDS-PAGE and immunoblotting. Gels were processed for western blotting using 6E10 monoclonal antibody, which recognizes every form of Aβ. Western blots showed that preparations at low Aβ concentrations (nanomolar range) contained a mixture of monomers and higher molecular weight oligomers. In preparations containing high Aβ concentrations (micromolar range) most of the peptide was oligomeric (Fig. 1).
Aβ interaction with the cellular membrane
To confirm that Aβ1–42 interacts with the plasma membrane of either differentiated PC12 cells or cultured neurons in our experimental conditions, multi-labelling immunochemistry experiments were performed on cells previously incubated for 10 min in the presence of 200nM Aβ. Aβ binding on PC12 cells was revealed by using the 6E10 monoclonal antibody and a secondary Dylight-549-conjugated antibody associated with Alexa Fluor 488-conjugated cholera toxin which binds to lipid microdomains [16]. As shown in Fig. 2 Aβ1–42 clearly labels the membrane with a partial but consistent colocalization with cholera toxin. The Pearson coefficient value was 0.226 ± 0.032 significantly higher than the value obtained in control conditions (0.034 ± 0.171 p < 0.05) with a reversed Aβ42–1 peptide.
In cultured neurons, we used an anti-MAP2 primary antibody which is a general marker for differentiated neurons [17] and an anti-Thy-1.2 primary antibody which labels the neuronal plasma membrane [18]. In MAP2-positive cells, Fig. 3 shows that Aβ1–42 partially co-localizes with Thy-1.2 (Pearson coefficient 0.192 ± 0.64). As a control we also used the inactive reverse peptide Aβ42–1(Pearson coefficient 0.022 ± 0.019). In this case no label was observed on the cultured neurons similarly to cells preincubated with the vehicle solution (Fig. 3). This observation means that Aβ1–42 directly interacts at least partially with the plasma membrane of the cells in each studied model.
Aβ triggers intracellular calcium increase
Calcium imaging experiments showed that an acute application of Aβ1–42 oligomers induces a rapid rise of intracellular calcium concentration in PC12 cells (Fig. 4A). This calcium response was dose-dependent. When a low concentration of Aβ1–42 (0.1 μM) was applied, the calcium response developed slowly and the amplitude was reduced but detectable; for Aβ1–42 concentrations greater than or equal to 0.5 μM, the calcium response was fast and large with a time-to-peak within 2 min. No response was observed following application of the reverse peptide Aβ42–1 suggesting a specific effect of Aβ1–42 (not shown). The response was rapidly desensitizing according to a two exponential kinetics (Fig. 4).
The effects of homogeneous monomeric and oligomeric preparations of soluble Aβ1–42 were examined in fura-2-AM-loaded PC12 cells. Figure 4b illustrates the increase of intracellular free Ca2+. Application of monomers and low molecular weight oligomers at a final concentration of 1 μM evoked no detectable change in Ca2+ concentration whereas application of the same concentration of high molecular weight oligomers evoked a rapid increase of [Ca2+]i. This oligomeric Aβ-induced calcium response correlates with adhesion of Aβ1–42 oligomers on the membrane surface of PC12 cells as revealed by immunocytochemistry with an antibody specific for the oligomeric form of Aβ42 (A11) (see Fig. 6B).
A similar Ca2+-response was observed in cultured neurons after Aβ1–42 oligomers application (Fig. 4C): a sharp peak and a rapid subsequent decrease of the intracellular [Ca2+]. As observed for PC12 cells monomeric Aβ1–42 applied to neurons did not evoke any Ca2+ signal (Fig. 4C) in cultured neurons.
NMDA-R involvement in Aβ1–42 oligomer-induced response
Since it has been shown that Aβ1–42 toxicity involves NMDA receptors (for a review, see [19]), we first checked whether our models were responsive to NMDA. Either in PC12 cells or in neurons NMDA (100 μM) application induced a progressive increase of the intracellular [Ca2+] without an initial peak in Ca2+ concentration and without desensitization along the duration of the recording (around 20 min); indeed this response was completely inhibited by a previous incubation of the cells in the presence of D-APV a non-selective antagonist of NMDA receptors (notillustrated).
Most of the PC12 cells were not responding to Aβ1–42 application in the presence of 50 μM APV (Table 1). In the remaining responding cells (about 5% of the total cell number), the [Ca2+]i increase induced by Aβ1–42 was almost completely inhibited (94 ± 1.5% ) (Table 1).
Aβ1–42 -evoked Ca2+ response following D-APV application was also inhibited in neurons: we observed a partial but consistent inhibition and a decreased number of responding cells (Table 1).
Chronic incubation with low Aβ42 concentration modulates the oligomer–induced intracellular calcium response
To mimic physiopathological conditions, we incubated PC12 cells overnight with nanomolar concentrations of Aβ1–42 or Aβ42–1.
Acute subsequent application of Aβ1–42 peptide (1 μM; 10 min) on PC12 cells triggered a rapid rise in intracellular calcium concentration ([Ca2+]i) (Fig. 5A) and this response was potentiated when the cells were preincubated with the Aβ1–42 peptide (10 nM) overnight or at least 16 h (chronic treatment, Fig. 5A). The peak amplitude of the [Ca2+]i response was significantly increased (704 ± 822 nM, n = 51, in preincubated cells versus 295 ± 129 nM, n = 45, in non preincubated cells, p < 0.01) although this value varied from cell to cell. This [Ca2+]i cellular response was specific for Aβ1–42 application since neither acute application of the reverse peptide Aβ42–1 at μmolar concentration nor chronic treatment with the reverse peptide Aβ42–1 had a significant effect on the cells when applied (Fig. 5A). Moreover, chronic treatment of PC12 cells with Aβ1–42 peptide followed by acute application of the reverse peptide Aβ42–1 did not induce a significant response as compared to control (Fig. 5A). This lack of effect of the reverse peptide Aβ42–1 was also confirmed by the weak percentage of responding cells (Fig. 5B). It should be pointed out that the overnight preincubation of the PC12 cells with Aβ1–42 did not significantly alter the number of responsive cells (Fig. 5B). The preincubation alone did not modified the resting [Ca2+]i (53.6 ± 10.8 nM in control cells versus 53.4 ± 8.9 nM in preincubated cells).
We performed this experiment with increasing concentrations of acutely applied Aβ1–42 after a chronic incubation of the cells with Aβ1–42. This resulted in a dose-dependent increase of the calcium signal, which was not significantly different from the dose dependence observed in cells not chronically incubated with Aβ1–42 (not illustrated).
Similar experiments were performed on cultured neurons. In this case, acute application of Aβ1–42 (1 μM) following an overnight incubation of the neurons in the presence of 10 nM Aβ1–42 resulted in a decrease of the cellular calcium response as compared to the effect of a single acute application of the peptide (Fig. 5C). The specificity of this effect was checked using the reverse peptide Aβ42–1 and no effect was detected with the reverse peptide either on Ca2+ concentration (Fig. 5C) or on the number of responding cells (Fig. 5D). Furthermore as previously observed for PC12 cells no significant change was observed in the basal [Ca2+]i in neurons incubated overnight with 10 nM Aβ1–42 and then acutely treated with vehicle (Fig. 5C).
Aβ1–42 oligomers detection in PC12 cells and cultured neurons
Two questions arose: what was the tertiary form of the peptide bound to the cells and responsible for the priming effect induced on the intracellular calcium response and was it similar in both cellular models? To answer these points, we performed immunocytochemical experiments: PC12 cells or neurons were incubated with 200 μM oligomeric Aβ1–42 with or without preincubation with 10 nM Aβ1–42, fixed and then revealed with an antibody specifically directed against Aβ oligomers.
In PC12 cells, no significant increase of the fluorescent signal was observed after overnight preincubation with 10 nM Aβ1–42 (Fig. 6C) or after acute application of 200 μM oligomeric Aβ1–42 (Fig. 6B). When overnight preincubation was associated to a subsequent acute Aβ1–42 application, a clear signal increase was observed (Fig. 6D, G) suggesting that most bound Aβ1–42 was under the oligomeric form. The quantitative analysis of fluorescence intensities correlates with the priming effect observed on the Aβ-induced Ca2+ response: the fluorescence intensity in cells chronically incubated with Aβ1–42 was not significantly different from the fluorescence measured in control cells, while the effect of previous chronic incubation on a subsequent acute Aβ1–42 application was highly significant (p < 0.001, Fig. 6G).
In neurons, the pattern of Aβ1–42 binding according to the incubation conditions was similar to that observed in PC12 cells: Fig. 7 shows a significant increase of Aβ1–42 immunodetection following preincubation with 10 nM Aβ1–42 and subsequent application of 200 nM oligomeric Aβ1–42.
Hence the observed opposite effect of Aβ1–42 preincubation combined with subsequent application of high concentration on the induced Ca2+-response in PC12 cells and in cultured neurons was not due to a difference in binding properties of Aβ1–42 oligomers following the preincubation step.
Effect of Aβ42 application on GluN2B subunit expression.
Previous studies have reported an involvement of the GluN2B subunit of NMDA receptor in the cellular response induced by Aβ1–42 application [17–21]. Since we observed that the Ca2+ response induced by Aβ1–42 in PC12 cells was almost completely mediated by NMDA receptors, we checked whether the amyloid peptide was co-localized with NMDA receptors on the cellular membrane. For this purpose we performed double immunolabelling experiments on fixed but non permeabilized PC12 cells. We used an antibody directed against the GluN2B subunit of the NMDA receptor and another antibody (6E10) directed against Aβ1–42. As illustrated in Fig. 8, we observed a partial co-localization of the membrane-bound Aβ1–42 with the GluN2B subunit. This co-localization occurred in the presence of 10 nM monomeric Aβ1–42 as well as 1 μM oligomeric Aβ1–42 (Fig. 8).
We also observed that the fluorescence intensity reflecting GluN2B immunoreactivity was enhanced in cells treated with Aβ (Fig. 8, lower graph). Indeed, a quantification of the fluorescence intensity revealed no significant increase of GluN2B expression after chronic exposure of the PC12 cells to 10 nM monomeric Aβ1–42. However GluN2B immunoreactivity was significantly increased when the cells were incubated with 1 μM oligomeric Aβ1–42. In this case, a trend of priming effect after chronic Aβ1–42 application was observed although not significant. It should be pointed out that the cells appeared heterogeneous in the label immuno-intensity for GluN2B (Fig. 8, arrows). This probably reflects a partial differentiation of some cells, and it may also explain the lack of significance of priming effect of the cells pretreatment.
A similar experiment was performed on cultured cortical neurons. In this case, due to the heterogeneity of the cellular types present in the culture it was necessary to characterize neurons with a membranous neuronal marker. We used double immunolabelling of the non permeabilized cells with antibodies directed against the GluN2B subunit and Thy1.2 respectively. Several cellular types were present in the cell culture; among these cells, some displaying a neuronal morphology were expressing GluN2B but not Thy1.2 (Fig. 9 arrows). Immunolabelling on these cells was not quantified. On Thy1.2 positive cells we observed a significant decrease of GluN2B expression on the membrane after chronic application of 10 nM monomeric Aβ1–42 (Fig. 9). Indeed this decrease was amplified when the cells were also subjected to acute 1 μM oligomeric Aβ1–42 for 10 min.
DISCUSSION
Growing evidence points to a disruption of intra-cellular Ca2+ homeostasis in AD and other neurodegenerative diseases (for a review, see [22]), and intracellular Ca2+ levels are known to trigger metabolic cascades that ultimately lead to synaptic dysfunction and cell death [22, 23]. It has been established that this deleterious effect is mainly induced by the soluble forms of the amyloid peptides [8, 9]. However considering the pathological and physiological concentrations of soluble Aβ encountered in the nervous tissue raises the question of such low concentrations effects on the cellular homeostasis.
In the present report, we show that micromolar concentrations of Aβ1–42 induce a transient increase of intracellular [Ca2+] in PC12 cells expressing a neuronal phenotype as well as in cultured cortical neurons. Although the concentration used is high compared to physiological concentrations, this is in agreement with numerous previous studies performed either on primary cultures of nerve cells or on cell lines [24–26]).
Additionally the pharmacological characterization of the observed Ca2+ cellular response corroborates previous observations: we show that this response is preferentially induced by Aβ1–42 oligomers in agreement with other published observations [27–29]. Prefibrillar amyloid aggregates have been shown to elevate cytosolic Ca2+ in neurons or neuronal cell lines ([30, 31]), and this phenomenon has been proposed to result from Ca2+ influx across the plasma membrane either through cation-selective channels formed by Aβ1–42 itself or through a general disruption of lipid integrity [12, 31, 32]. Another still controversial hypothesis is based on the effect of Aβ1–42 itself on voltage operated calcium channels although the peptide has been described to inhibit L-type channels at micromolar concentrations [33] and P/Q type channels at nanomolar concentrations [34]. We cannot exclude these hypotheses but they appear unlike since we observed that the Aβ1–42-induced Ca2+ response was almost completely inhibited by APV, an antagonist of the NMDA receptor, and Ifenprodyl, an antagonist specific for GluN2B subunit (not illustrated), in both cellular models in agreement a previous observation [35].
This observation needs some comments: Aβ1–42 has been described to directly activate NMDA receptors in transfected cells expressing GluN1, GluN2A, and GluN2B subunits [36]. However one should notice the rapid desensitization of the response induced in PC12 cells and in neuronal cultures (see Figs. 4 and 6). By contrast [Ca2+]i is increasing without an initial peak and without desensitization upon continuous NMDA application to PC12 cells or cultured neurons (not illustrated). A more precise observation shows that the decrease rate fits with a bi-exponential curve. This means that NMDA channel activation is not the only component involved but that a second component is also involved in the observed response. The nature of this process is not yet identified. In a recent study, Kessels et al. suggest a metabotropic activity of NMDA receptor induced by Aβ1–42 application [37]. Another possibility would be a massive involvement of intracellular Ca2+ stores triggered by NMDA receptors as already observed [38–40] and a delayed subsequent enzymatic activity of the endoplasmic reticulum calcium pump, which regulates Ca2+ homeostasis and would contribute to the rapid decrease of the response. This point has to be further elucidated.
Overnight exposure of PC12 cells to 10 nM Aβ1–42 did not modify the basal [Ca2+]i in agreement with previously published data [29]. Moreover we did not observe a significant oligomeric Aβ1–42 accumulation on the cellular membranes after chronic exposure of the cells as revealed by immunocytochemistry. Thus we were not able to show any noticeable change, which would be elicited by preincubating the cells with low concentrations of Aβ1–42.
There are some clues in the literature indicating that Aβ1–42 is acting differently depending on its cellular location or on its concentration: Puzzo et al. [42] showed on hippocampal slices that pmolar Aβ1–42 application was able to increase long term potentiation while μmolar Aβ1–42 application inhibited it. Acute application of Aβ1–42 was described to increase the K +-induced Ca2+ response while chronic application would induce apoptosis [29]. Additionally different species (monomeric or oligomeric forms) of Aβ1–42 were described to interact with cellular membranes of PC12 cells [43]. As revealed by fluorescence measurement, these different species were not exchangeable in solution [44] and their amount binding to the membranes depended on the peptide conformation according to their size: low concentration would favor monomeric or small oligomeric forms while high peptide concentration triggers the binding of large soluble oligomers [43] in agreement with our results. In our study, however, we show a priming effect of low concentrations of monomeric Aβ1–42 on the subsequent binding of large oligomers, which suggests a functional coupling between these two interaction modes of the peptide with the cellular membrane. Nag et al. [43] suggested that monomers or small oligomers bound to the membrane would favor further aggregation of the peptide to form large oligomers at the cellular surface. From our results we cannot exclude such a mechanism. More recently Bateman and Chakrabartty [45] showed that monomeric Aβ1–42 stays at the surface of differentiated PC12 cells while large oligomers are rapidly internalized, suggesting different properties of these two Aβ1–42 forms. By introducing a sequential aspect our results corroborate and further characterize the Aβ1–42 binding observed previously [43–45]. Furthermore we also demonstrate that this mode of Aβ1–42 interaction is also relevant for cultured cortical neurons.
The functional consequences of the priming effect on Aβ1–42 binding are not even in cultured primary neurons or in PC12 cells. Indeed the amyloid peptide has been suggested to interact with extra synaptic NMDA receptors involving GluN2B subunits [36, 46]. In mouse neurons, the primed binding of Aβ1–42 oligomers induced a decrease in the Ca2+-response and in the membrane expression of GluN2B. This has been often described in the recent literature (for a review see [48]). In PC12 cells, however, the chronic exposure to low Aβ1–42 concentrations induced a significant increase of the Ca2+ response induced by a subsequent acute application of 1 μM Aβ1–42 and an increased expression of GluN2B on the plasma membranes of the cells. Such a positive priming effect of low Aβ1–42 concentrations was also observed in PC12 cells by Innocent et al. [29]. In this case the K +-induced Ca2+ response was increased. Given the rapid effect observed (within 5 min) and the fact that it was revealed in non permeabilized cells, this phenomenon should not be assigned to protein synthesis but rather to a translocation of GluN2B from the cytoplasm or from endogenous vesicles toward the plasma membrane. Is this discrepancy with cultured mouse neurons reflecting species differences between rat PC12 cells and murine cortical neurons? Recently Liu et al. [47] also reported that Aβ42 induced an increase of GluN1 and GluN2B subunits in rat hippocampal neurons in culture, which would support this hypothesis. However numerous previous data suggested a decrease in GluN2B after Aβ1–42 oligomers application to rat primary neuronal cultures or to organotypic slices (for a review, see [48]). Several pathways regulating GluN2B including ERK/MAPK, ApoER2/reelin, STEP61, casein kinase, or calpain activity have been described to be involved in the toxicity of Aβ1–42 oligomers [48]. The PC12 cell line derives from a rat tumor and is subject to instability. Whether these regulating pathways are functional in this cell line remains to be clarified.
Hence the present study describes a functional link between two forms of Aβ1–42 interacting on the plasma membrane of PC12 cells and of cultured cortical neurons. Considering these observations we would suggest that a low physiologic Aβ1–42 concentration induces monomers (or small oligomers) binding to cellular plasma membranes, which in turn favors large oligomers to bind when the peptide concentration increases. Coming back to the physiopathology of the disease, this could explain the deep gradient of degenerated neurons around amyloid plaques in the brain tissue and the slow progression of the disease. A continuous secretion of amyloid peptides does not notably hinder neuronal function but prepare the bad end of the neurons. Degeneration maximally occurs in close vicinity to senile plaques. These plaques can be considered as Aβ1–42 reservoirs generating high concentration of soluble amyloid peptide oligomers. Due to the size of the oligomers, the diffusion of the peptide through the brain tissue is limited and therefore the concentration gradient should be high around the amyloid plaques.
This hypothesis does not explain the spreading of the disease throughout the brain during the course of the pathology. It has been suggested similarities between prion diseases and AD involving intracellular transport of misfolded particles [49, 50] before extracellular secretion. According to this hypothesis, monomers or small oligomers of misfolded proteins could serve as seeds for larger pathogenic particles. Our present observation completes this suggestion: soluble misfolded Aβ1–42 could be not only seeds for larger oligomers, protofibrils, and ultimately plaques, but also anchors for soluble large oligomers on cellular membranes.
Additionally Aβ1–42 is observed not only in CNS but also in peripheral tissues including vessels and blood in a number of pathologies. As an example Aβ1–42 is secreted by platelets in AD. It should be of interest to determine whether this priming effect on Aβ1–42 oligomers binding capacity applies to a broad variety of peripheral cell types and could serve as a biomarker for the disease.
ACKNOWLEDGMENTS
This work was supported by CNRS, by a special grant for Alzheimer’s disease research from the Fondation pour la Recherche Médicale and received a financial support from the SATT Conectus. We are grateful to Odile Proscksh for her technical support.
Authors’ disclosures available online (http://j-alz.com/manuscript-disclosures/14-2529r2).
REFERENCES
1 | Castano EM, Frangione B(1988) Human amyloidosis, Alzheimer disease and related disordersLab Invest58: 122132 |
2 | Ogomori K, Kitamoto T, Tateishi J, Sato Y, Suetsugu M, Abe M(1989) Beta-protein amyloid is widely distributed in the central nervous system of patients with Alzheimer’s diseaseAm J Pathol134: 243251 |
3 | Braak H, Braak E, Ohm T, Bohl J(1989) Alzheimer’s disease: mismatch between amyloid plaques and neuritic plaquesNeurosci Lett103: 2428 |
4 | Kidd M(1963) Paired helical filaments in electron microscopy of Alzheimer’s diseaseNature197: 192193 |
5 | Braak H, Braak E, Ohm T, Bohl J(1988) Silver impregnation of Alzheimer’s neurofibrillary changes counterstained for basophilic material and lipofuscin pigmentStain Technol63: 197200 |
6 | Braak H, Braak E(1991) Neuropathological stageing ofAlzheimer-related changesActa Neuropathol82: 239259 |
7 | Dickson DW, Crystal HA, Mattiace LA, Masur DM, Blau AD, Davies P, Yen SH, Aronson MK(1992) Identification of normal andpathological aging in prospectively studied nondemented elderlyhumansNeurobiol Aging13: 179189 |
8 | McLean CA, Cherny RA, Fraser FW, Fuller SJ, Smith MJ, Beyreuther K, Bush AI, Masters CL(1999) Soluble pool of Abeta amyloid as adeterminant of severity of neurodegeneration in Alzheimer’sdiseaseAnn Neurol46: 860866 |
9 | Wang J, Dickson DW, Trojanowski JQ, Lee VM(1999) The levels of soluble versus insoluble brain Abeta distinguishAlzheimer’s disease from normal and pathologic agingExp Neurol158: 328337 |
10 | Hartley DM, Walsh DM, Ye CP, Diehl T, Vasquez S, Vassilev PM, Teplow DB, Selkoe DJ(1999) Protofibrillar intermediates of amyloid beta-protein induce acute electrophysiological changes and progressive neurotoxicity in cortical neuronsJ Neurosci19: 88768884 |
11 | Kayed R, Head E, Thompson JL, McIntire TM, Milton SC, Cotman CW, Glabe CG(2003) Common structure of soluble amyloid oligomers implies common mechanism of pathogenesisScience300: 486489 |
12 | Kayed R, Sokolov Y, Edmonds B, McIntire TM, Milton SC, Hall JE, Glabe CG(2004) Permeabilization of lipid bilayers is a common conformation-dependent activity of soluble amyloid oligomers in protein misfolding diseasesJ Biol Chem279: 4636346366 |
13 | Evangelisti E, Wright D, Zampagni M, Cascella R, Bagnoli S, Relini A, Nichino D, Scartabelli T, Nacmias B, Sorbi S, Cecchi C(2013) Lipid rafts mediate amyloid-induced calcium dyshomeostasis and oxidative stress in Alzheimer’s diseaseCurr Alzheimer Res10: 1431453 |
14 | Lambert MP, Barlow AK, Chromy BA, Edwards C, Freed R, Liosatos M, Morgan TE, Rozovsky I, Trommer B, Viola KL, Wals P, Zhang C, Finch CE, Krafft GA, Klein WL(1998) Diffusible, nonfibrillar ligands derived from Abeta1-42 are potent central nervous system neurotoxinsProc Natl Acad Sci U S A95: 64486453 |
15 | Lacor PN, Buniel MC, Chang L, Fernandez SJ, Gong Y, Viola KL, Lambert MP, Velasco PT, Bigio EH, Finch CE, Krafft GA, Klein WL(2004) Synaptic targeting by Alzheimer’s-related amyloid beta oligomersJ Neurosci24: 1019110200 |
16 | Kenworthy AK, Petranova N, Edidin M(2000) High-resolution FRET microscopy of cholera toxin B-subunit and GPI-anchored proteins in cell plasma membranesMol Biol Cell11: 16451655 |
17 | Kosik KS, Finch EA(1987) MAP2 and tau segregate into dendritic and axonal domains after the elaboration of morphologically distinct neurites: an immunocytochemical study of cultured rat cerebrumJ Neurosci7: 31423153 |
18 | Raedler E, Raedler A(1986) Developmental modulation of neuronal cell surface determinantsBibl Anat61130 |
19 | Malinow R(2012) New developments on the role of NMDA receptors in Alzheimer’s diseaseCurr Opin Neurobiol22: 559563 |
20 | Hu NW, Klyubin I, Anwyl R, Rowan MJ(2009) GluN2B subunit-containing NMDA receptor antagonists prevent Abeta-mediated synaptic plasticity disruption in vivoProc Natl Acad Sci U S A106: 2050420509 |
21 | Rammes G, Hasenjager A, Sroka-Saidi K, Deussing JM, Parsons CG(2011) Therapeutic significance of NR2B-containingNMDA receptors and mGluR5 metabotropic glutamate receptors in mediating the synaptotoxic effects of beta-amyloidoligomers on long-term potentiation (LTP) in murine hippocampal slicesNeuropharmacology60: 982990 |
22 | Mattson MP(2007) Calcium and neurodegenerationAging Cell6: 337350 |
23 | Berridge MJ, Bootman MD, Lipp P(1998) Calcium–a life and death signalNature395: 645648 |
24 | Huang TH, Yang DS, Fraser PE, Chakrabartty A(2000) Alternate aggregation pathways of the Alzheimer beta-amyloidpeptide. An in vitro model of preamyloidJ Biol Chem275: 3643636440 |
25 | Arispe N, Diaz J, Durell SR, Shafrir Y, Guy HR(2010) Polyhistidine peptide inhibitor of the Abeta calciumchannel potently blocks the Abeta-induced calcium response in cells. Theoretical modeling suggests acooperative binding processBiochemistry49: 78477853 |
26 | Kim HS, Park CH, Cha SH, Lee JH, Lee S, Kim Y, Rah JC, Jeong SJ, Suh YH(2000) Carboxyl-terminal fragment of Alzheimer’s APP destabilizes calcium homeostasis and renders neuronal cells vulnerable to excitotoxicityFASEB J14: 15081517 |
27 | Ono K, Condron MM, Teplow DB(2009) Structure-neurotoxicity relationships of amyloid beta-protein oligomersProc Natl Acad Sci U S A106: 1474514750 |
28 | Fradinger EA, Monien BH, Urbanc B, Lomakin A, Tan M, Li H, Spring SM, Condron MM, Cruz L, Xie CW, Benedek GB, Bitan G(2008) C-terminal peptides coassemble into Abeta42 oligomers and protect neurons against Abeta42-inducedneurotoxicityProc Natl Acad Sci U S A105: 1417514180 |
29 | Innocent N, Evans N, Hille C, Wonnacott S(2010) Oligomerisation differentially affects the acute and chronicactions of amyloid-beta in vitroNeuropharmacology59: 343352 |
30 | Demuro A, Mina E, Kayed R, Milton SC, Parker I, Glabe CG(2005) Calcium dysregulation and membrane disruption as a ubiquitous neurotoxic mechanism of soluble amyloid oligomersJ Biol Chem280: 1729417300 |
31 | Kawahara M, Kuroda Y, Arispe N, Rojas E(2000) Alzheimer’s beta-amyloid, human islet amylin, and prion protein fragment evoke intracellular free calcium elevations by a common mechanism in a hypothalamic GnRH neuronal cell lineJ Biol Chem275: 1407714083 |
32 | Kagan BL, Hirakura Y, Azimov R, Azimova R, Lin MC(2002) The channel hypothesis of Alzheimer’s disease: current statusPeptides23: 13111315 |
33 | Ueda K, Shinohara S, Yagami T, Asakura K, Kawasaki K(1997) Amyloid beta protein potentiates Ca2+ influx through L-type voltage-sensitive Ca2+ channels: a possible involvement of free radicalsJ Neurochem68: 265271 |
34 | Nimmrich V, Grimm C, Draguhn A, Barghorn S, Lehmann A, Schoemaker H, Hillen H, Gross G, Ebert U, Bruehl C(2008) Amyloid beta oligomers (A beta(1-42) globulomer) suppress spontaneous synaptic activity by inhibition of P/Q-type calcium currentsJ Neurosci28: 788797 |
35 | Ferreira IL1, Bajouco LM, Mota SI, Auberson YP, Oliveira CR, Rego AC(2012) Amyloid beta peptide 1–42 disturbs intracellular calcium homeostasis through activation of GluN2B-containing N-methyl-d-aspartate receptors in cortical culturesCell Calcium51: 95106 |
36 | Texido L, Martin-Satue M, Alberdi E, Solsona C, Matute CAmyloid beta peptide oligomers directly activate NMDAreceptorsCell Calcium49: 184190 |
37 | Kessels HW, Nabavi S, Malinow R(2013) Metabotropic NMDA receptor function is required for beta-amyloid-induced synaptic depressionProc Natl Acad Sci U S A110: 40334038 |
38 | Goussakov I, Miller MB, Stutzmann GE(2010) NMDA-mediated Ca2+influx drives aberrant ryanodine receptoractivation in dendrites of young Alzheimer’s disease miceJNeurosci30: 1212812137 |
39 | Demuro A, Parker I(2013) Cytotoxicity of intracellular amyloid oligomers involves Ca2+ release from endoplasmicretuculum by stimulated production of inositol triphosphateJ Neurosci33: 38243833 |
40 | Costa RO1, Lacor PN, Ferreira IL, Resende R, Auberson YP, Klein WL, Oliveira CR, Rego AC, Pereira CM(2012) Endoplasmic reticulum stress occurs downstream of GluN2B subunit of N-methyl-d-aspartate receptor in mature hippocampal cultures treated with amyloid-beta oligomersAging Cell11: 823833 |
41 | Edwards MA, Loxley RA, Williams AJ, Connor M, Phillips JK(2007) Lack of functional expression of NMDA receptors in PC12 cellsNeurotoxicology28: 876885 |
42 | Puzzo D, Privitera L, Leznik E, Fa M, Staniszewski A, Palmeri A, Arancio O(2008) Picomolar amyloid-betapositively modulates synaptic plasticity and memory in hippocampusJ Neurosci28: 1453714545 |
43 | Nag S, Chen J, Irudayaraj J, Maiti S(2010) Measurement of the attachment and assembly of small amyloid-betaoligomers on live cell membranes at physiological concentrations using single-molecule toolsBiophys J99: 19691975 |
44 | Bateman DA, Chakrabartty A(2009) Two distinct conformations of Abeta aggregates on the surface of living PC12 cellsBiophys J96: 42604267 |
45 | Bateman DA, Chakrabartty A(2011) Cell surface binding and internalization of Aβ modulated by degree ofaggregationInt J Alzheimers Dis2011: 962352 |
46 | Kervern M, Angeli A, Nicole O, Leveille F, Parent B, Villette V, Buisson A, Dutar P(2012) Selective impairment of some forms of synaptic plasticity by oligomeric amyloid-beta peptide in the mouse hippocampus: implication of extrasynaptic NMDA receptorsJ Alzheimers Dis32: 183196 |
47 | Liu Z, Lv C, Zhao W, Song Y, Pei D, Xu T(2012) NR2B-containingNMDA receptors expression and their relationship to apoptosis inhippocampus of Alzheimer’s disease-like ratsNeurochem Res37: 14201427 |
48 | Mota SI, Fereira IL, Rego AC(2014) Dysfunctional synapse in Alzheimer’s disease e A focus on NMDA receptorsNeuropharmacology76: 1626 |
49 | Brundin P, Melki R, Kopito R(2010) Prion-like transmission of protein aggregates in neurodegenerative diseasesNat Rev Mol Cell Biol11: 301307 |
50 | Jucker M, Walker LC(2011) Pathogenic protein seeding in Alzheimer disease and other neurodegenerative disordersAnn Neurol70: 532540 |
Figures and Tables
Fig.1
Biochemical characterization of Aβ1–42 applied solutions. SDS-PAGE separation followed by western blot revealed with 6E10 antibody shows that the RPMI solution of Aβ1–42 at low concentration (10 nM) contains a mixture of monomers (4.3 kD) and higher molecular weight oligomers (68 kD), while at high concentration (1 μM) the Aβ42 preparation mostly contains high molecular weight oligomers (60–68 kD and 140 kD).
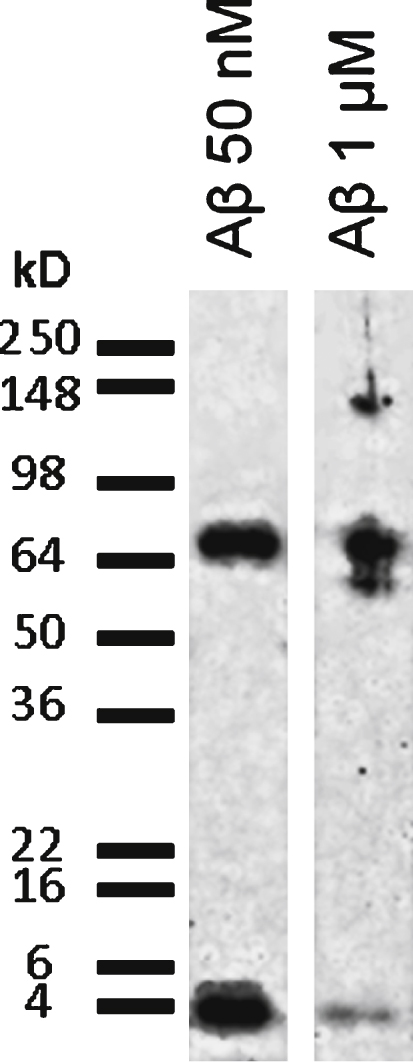
Fig.2
Aβ1–42 partially co-localizes with cholera toxin on the surface of PC12 cells. Aβ1–42 immunochemical detection on PC12 cells. Cells were incubated with either 1 μM Aβ42–1 (the reverse peptide as a control condition) or with 1 μM Aβ42 (Ac Aβ1–42) prior to fixation and immunolabeling for Aβ1–42 (red) and cholera toxin (green). Aβ1–42 as revealed by the monoclonal antibody 6E10 (directed against every form of the peptide) partially colocalized with membrane microdomains revealed by cholera toxin as quantified by a Pearson coefficient of 0.23 ± 0.03. Calibration bar 20 μm.
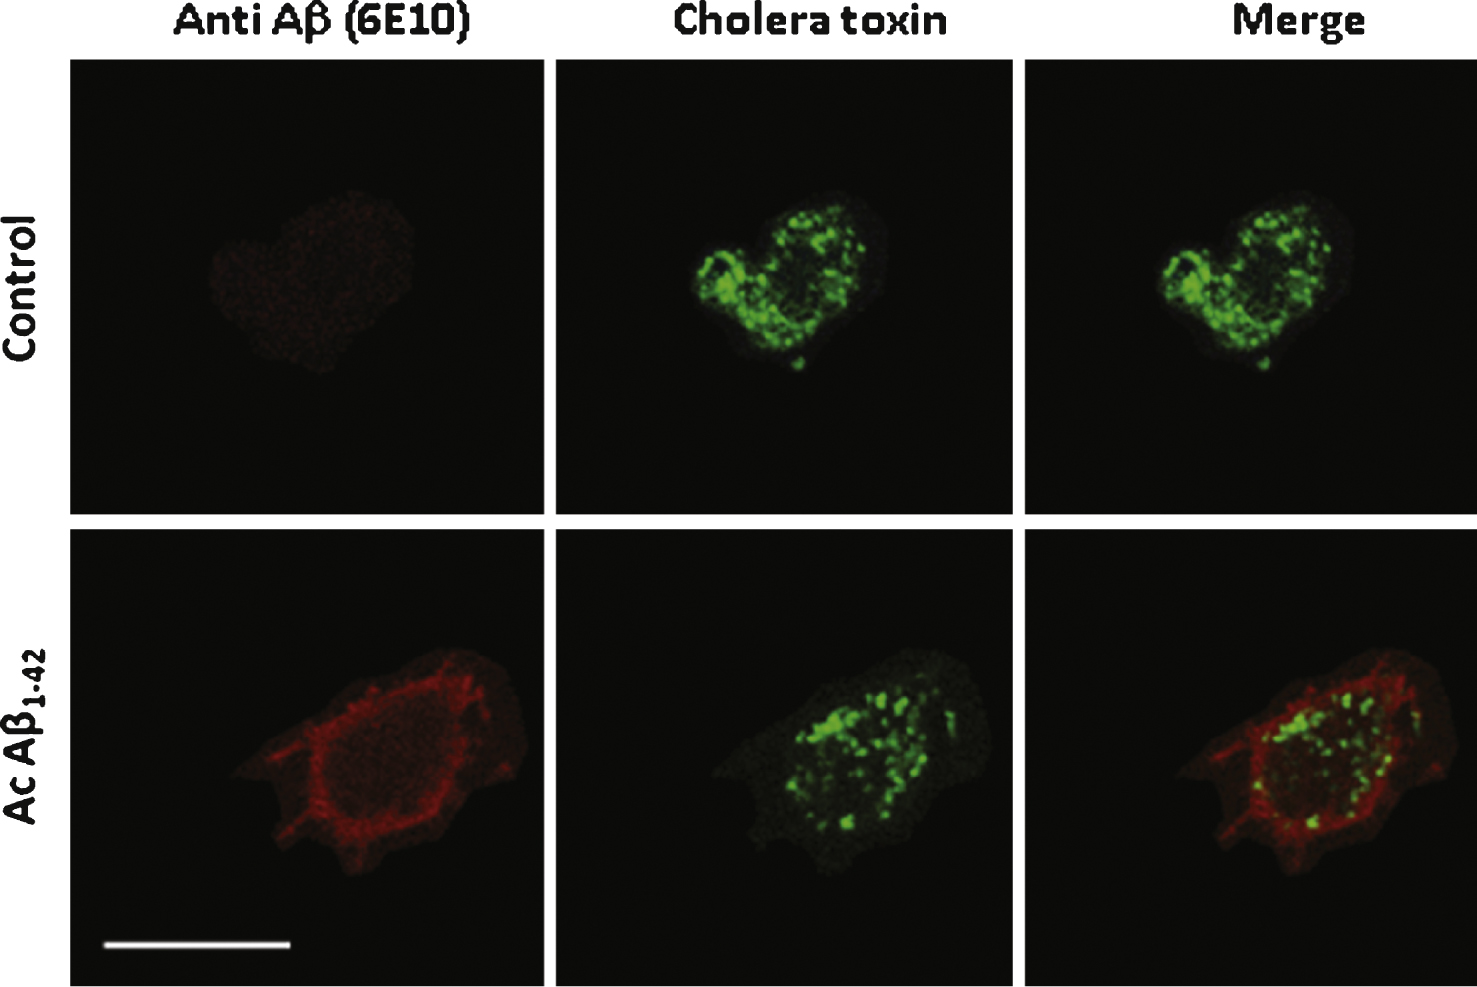
Fig.3
Aβ42 binds and partially colocalizes with Thy1 on the surface of cultured neurons. Aβ1–42 immunochemical detection on cultured mouse cortical neurons. Cells were incubated either with 1 μM Aβ1–42 or with 1 μM Ab42–1 as a control or with the vehicle solution prior to fixation. Aβ1–42 was revealed by the 6E10 monoclonal antibody (green) and two other neuronal markers were used to characterize the neuronal phenotype of the cells: Thy-1 (red), which is a membrane marker, and MAP2 (blue), a cytoplasmic marker. No Aβ label was detected in control conditions (vehicle solution applied to the cells). Calibration bar 20 μm.
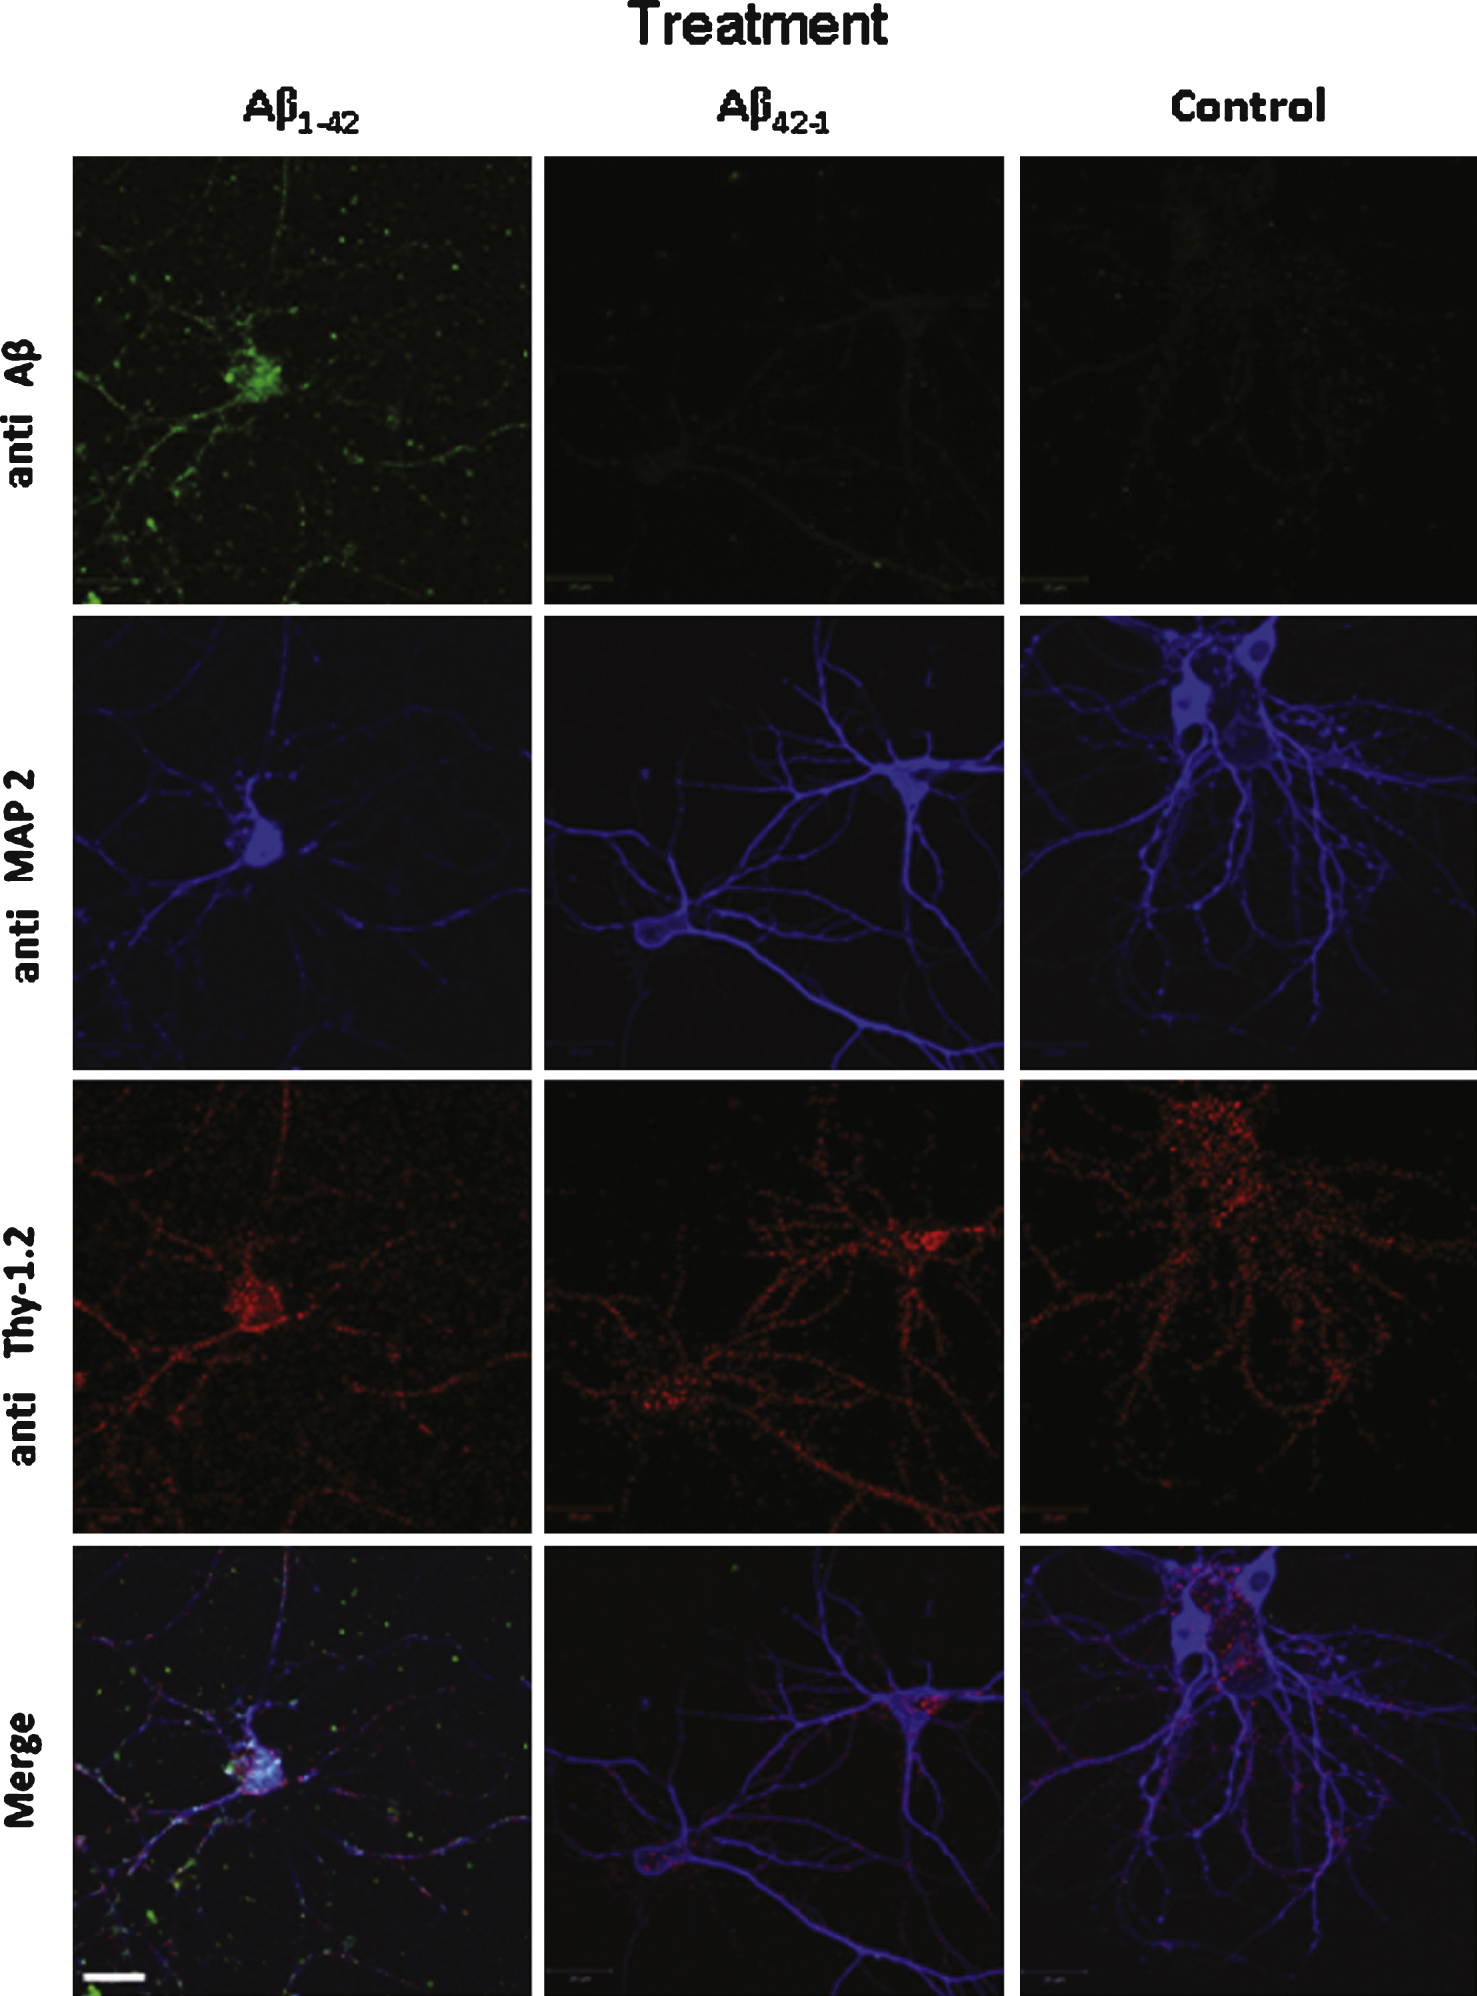
Fig.4
A) Aβ1–42-induced Ca2+ increase in PC12 cells. The effect induced by acute application of Aβ1–42 is dose dependent (curves are representative of the average of 50 recorded cells; control: vehicle application). B) Comparison of the Ca2+ response induced in PC12 cells after acute application of an Aβ1–42 monomer solution (1 μM) or of an Aβ1–42 oligomer solution (1 μM) as indicated by the arrow. The monomer solution induces a weak Ca2+ response as compared to the oligomer-induced response. C) Comparison of the Ca2+ response induced in cultured mouse cortical neurons after acute application of an Aβ1–42 monomer solution (1 μM) or of an Aβ1–42 oligomer solution (1 μM). No significant response was induced by monomers application.
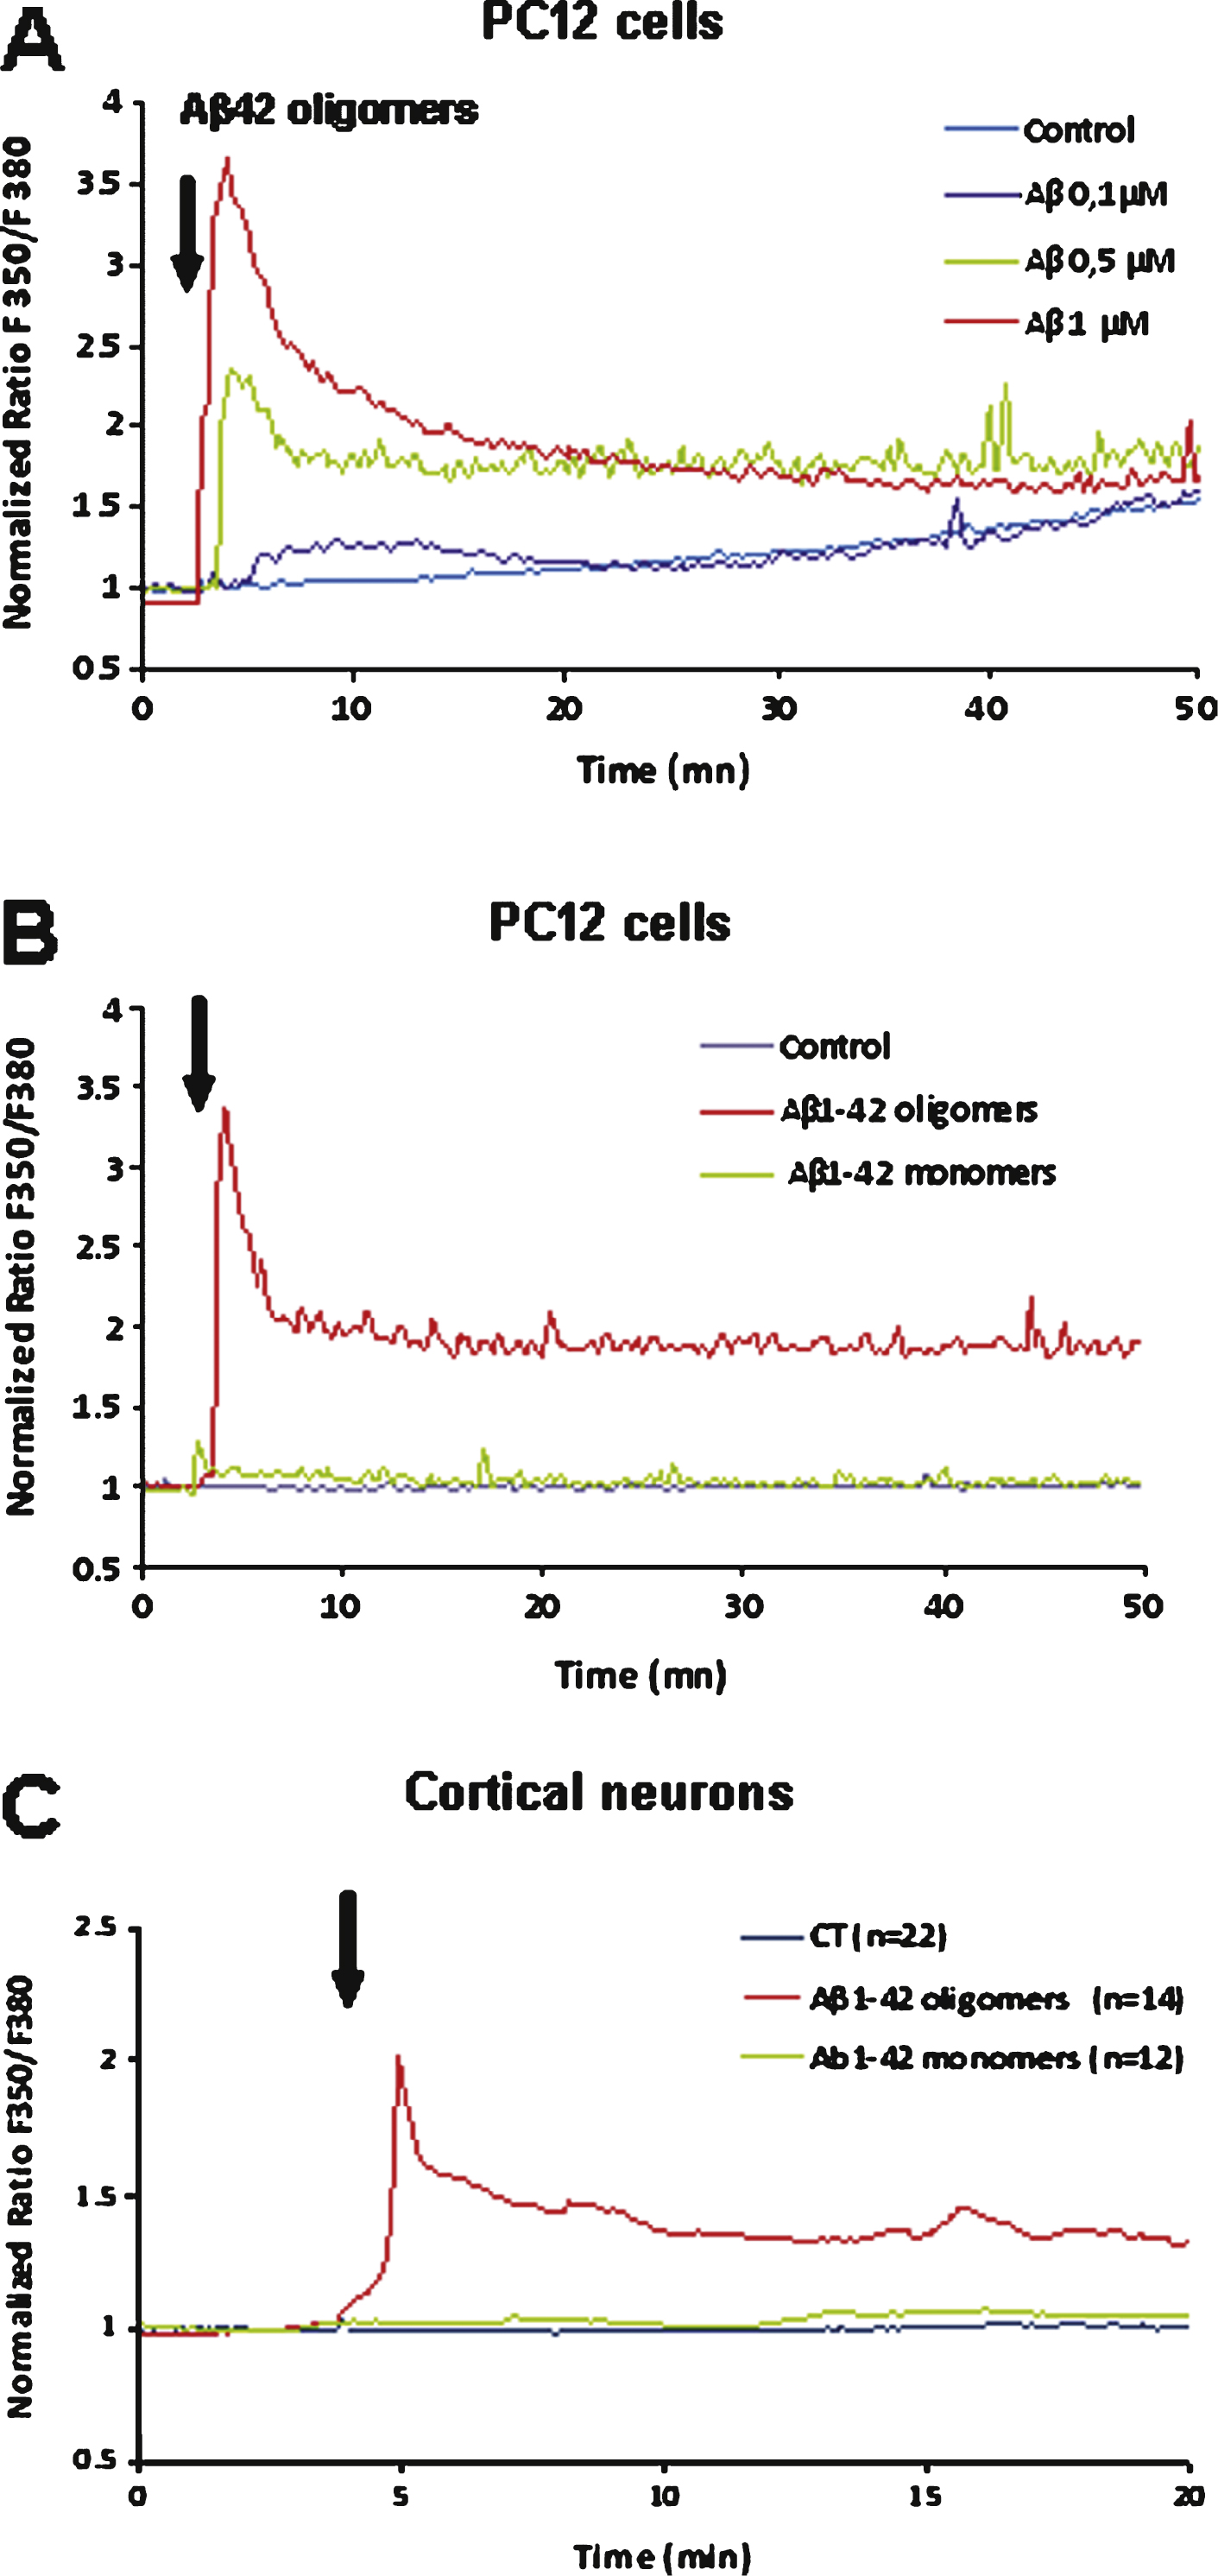
Fig.5
A) Chronic incubation of PC12 cells with 10 nM Aβ1–42 concentration enhances the Ca2+ response induced by subsequent 1 μM Aβ1–42 application. The inactive reverse peptide Aβ42–1 neither induces a Ca2+ response nor modifies the Aβ1–42 -induced response. B) Proportion of observed responding PC12 cells (Mean ± SD). C) Chronic incubation of cultured cortical neurons with 10 nM Aβ1–42 concentrations reduces the Ca2+ response induced by subsequent 1 μM Aβ1–42 application. D) Percentage of observed responding neurons (Mean ± SD). As observed for PC12 cells the reverse peptide Aβ42–1 has no effect on cortical neurons. (Statistics: one way ANOVA and subsequent Bonferroni test; *p < 0.05; **p < 0.01; control: vehicle application).
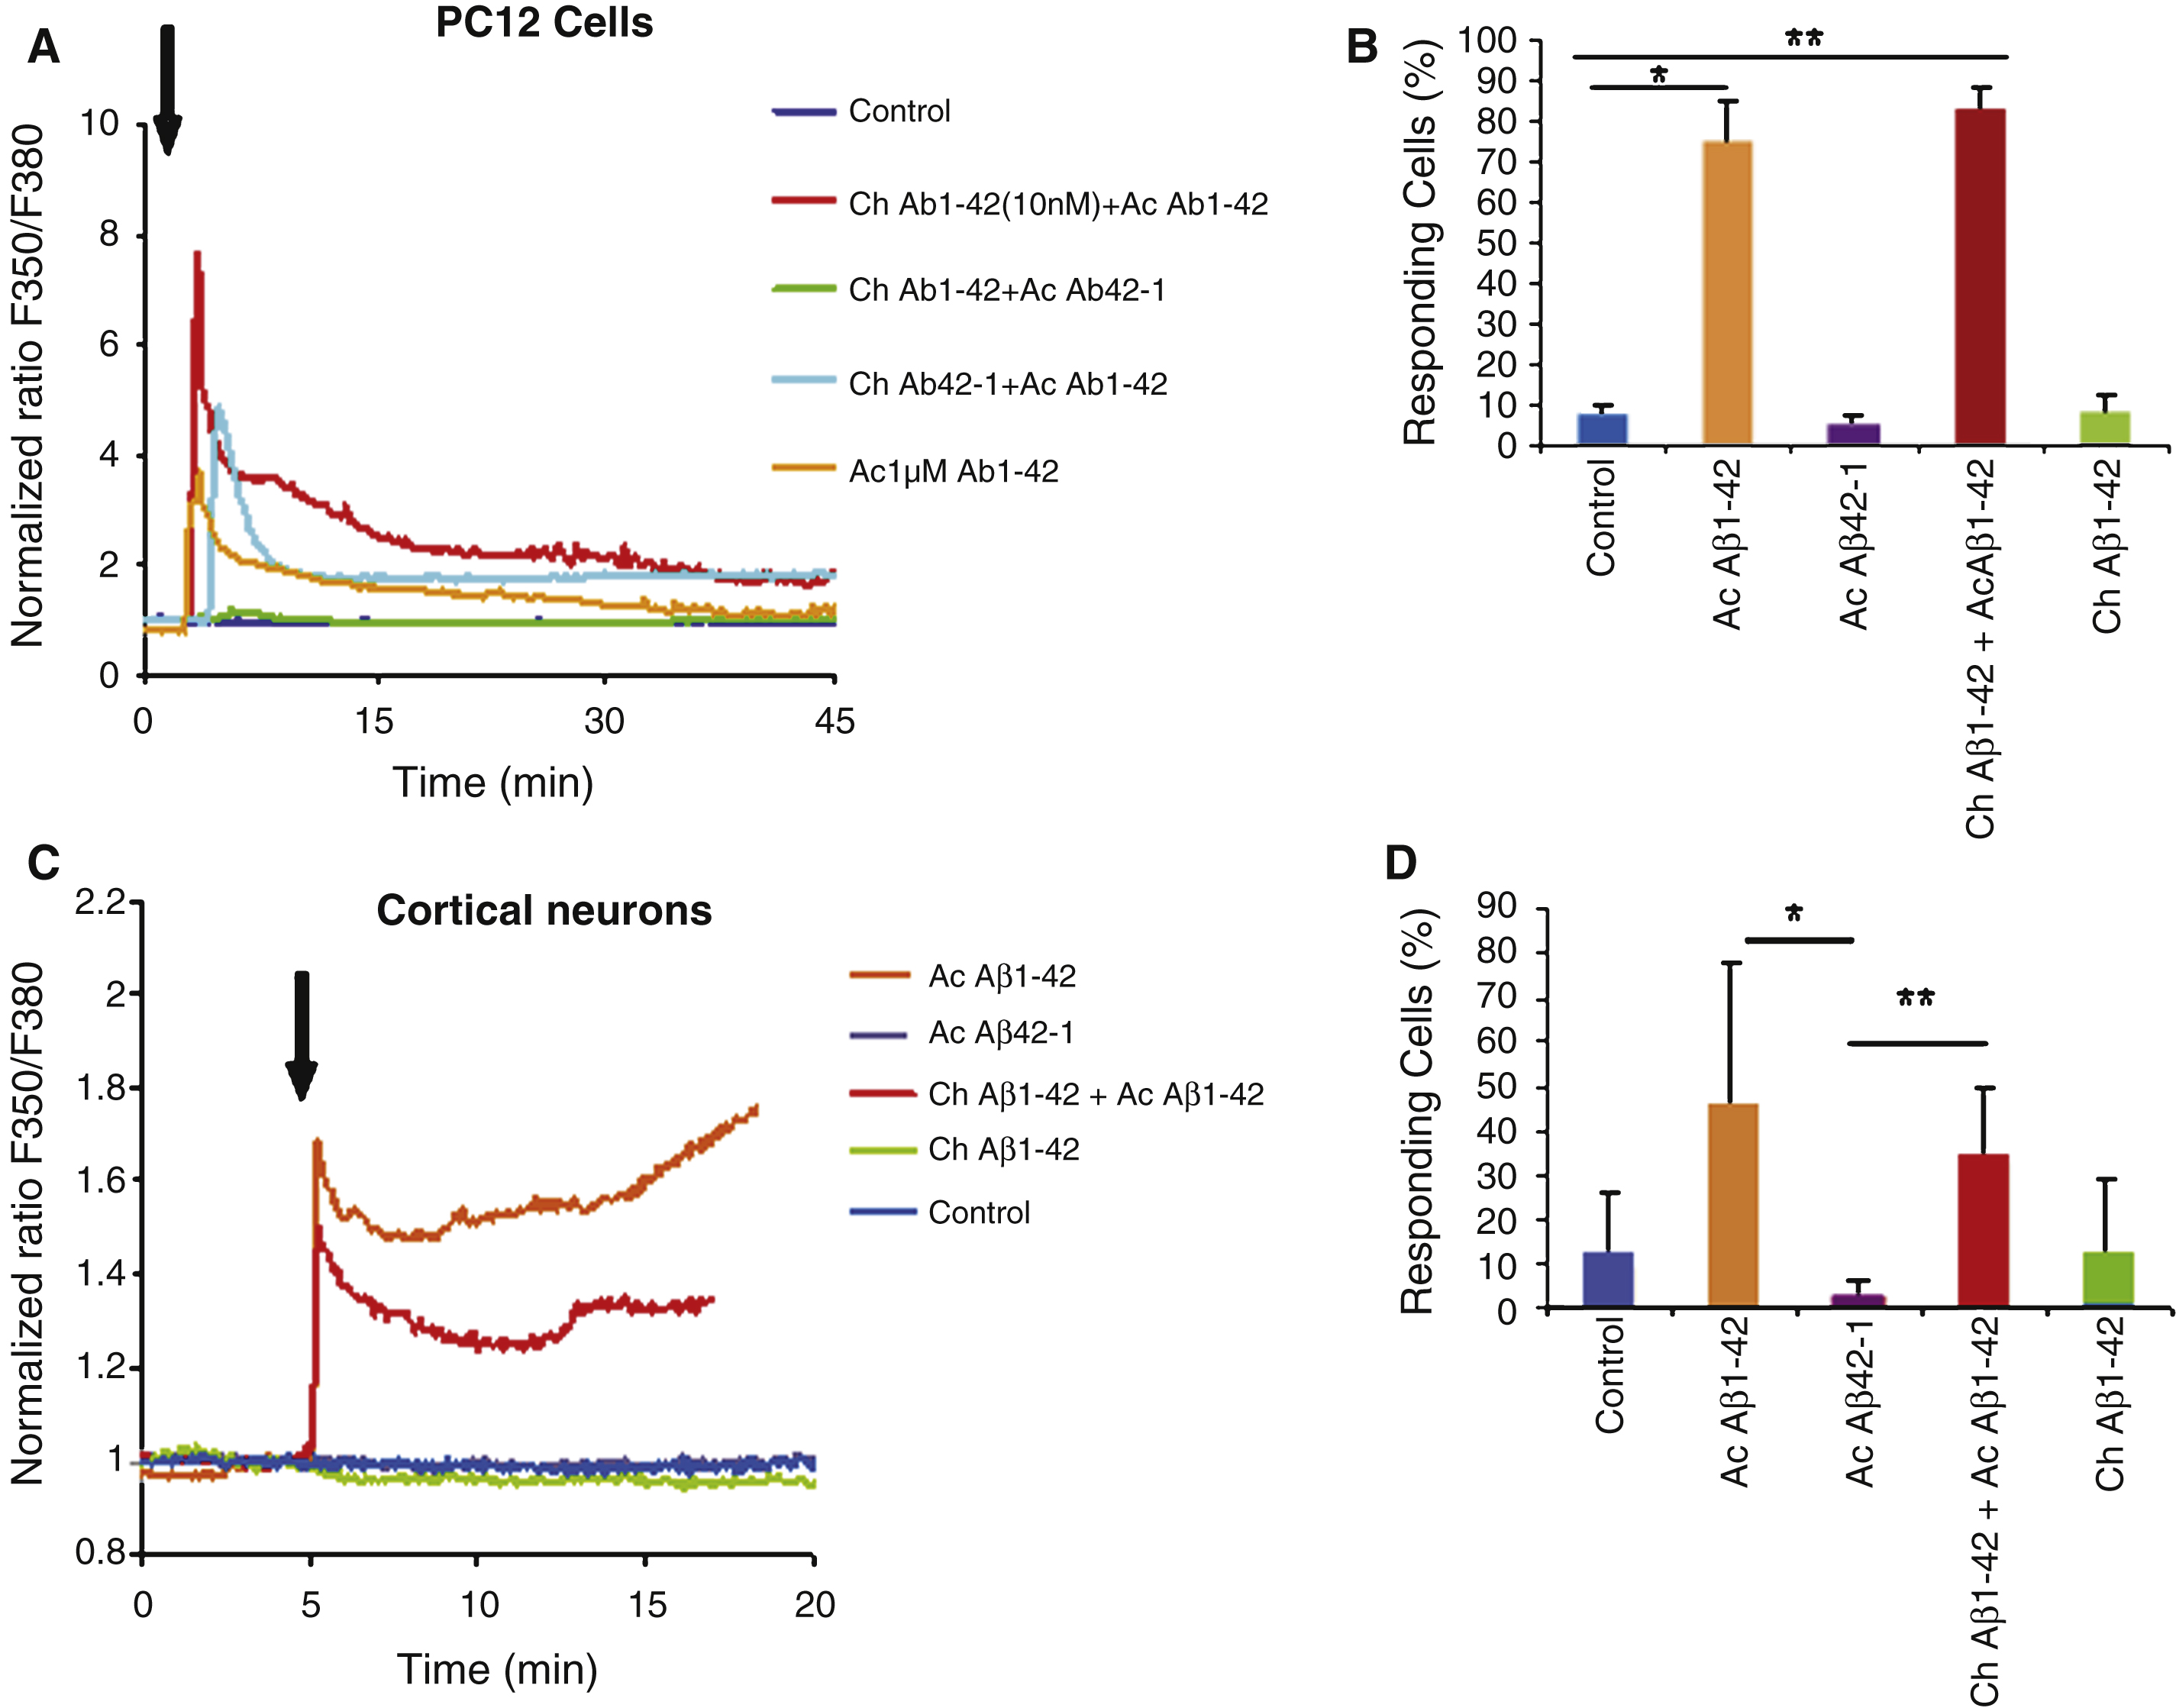
Fig.6
Immunocytochemistry of PC12 cells revealed by the A11 antibody (oligomers specific). Cells were treated with the following conditions: vehicle application as a control (A); acute application of 200 nM Aβ1–42 (B); chronic incubation of 10 nM Aβ1–42 (C); chronic with 10 nM Aβ1–42 incubation followed by acute application of 200 nM Aβ1–42 (D); Chronic application of the reverse peptide Aβ42–1 (10 nM) (E); chronic incubation with 10 nM Aβ42–1 followed by acute application of 200 nM Aβ1–42 (F). Panel G represents the quantification of the labeling of PC12 cells under the various conditions mentioned above. Note the increase in oligomers binding on the cells preteated with a low Aβ1–42 concentration (Statistics: one way ANOVA and subsequent Bonferroni test; **p < 0.01; ***p < 0.001). Calibration bar 20 μm.
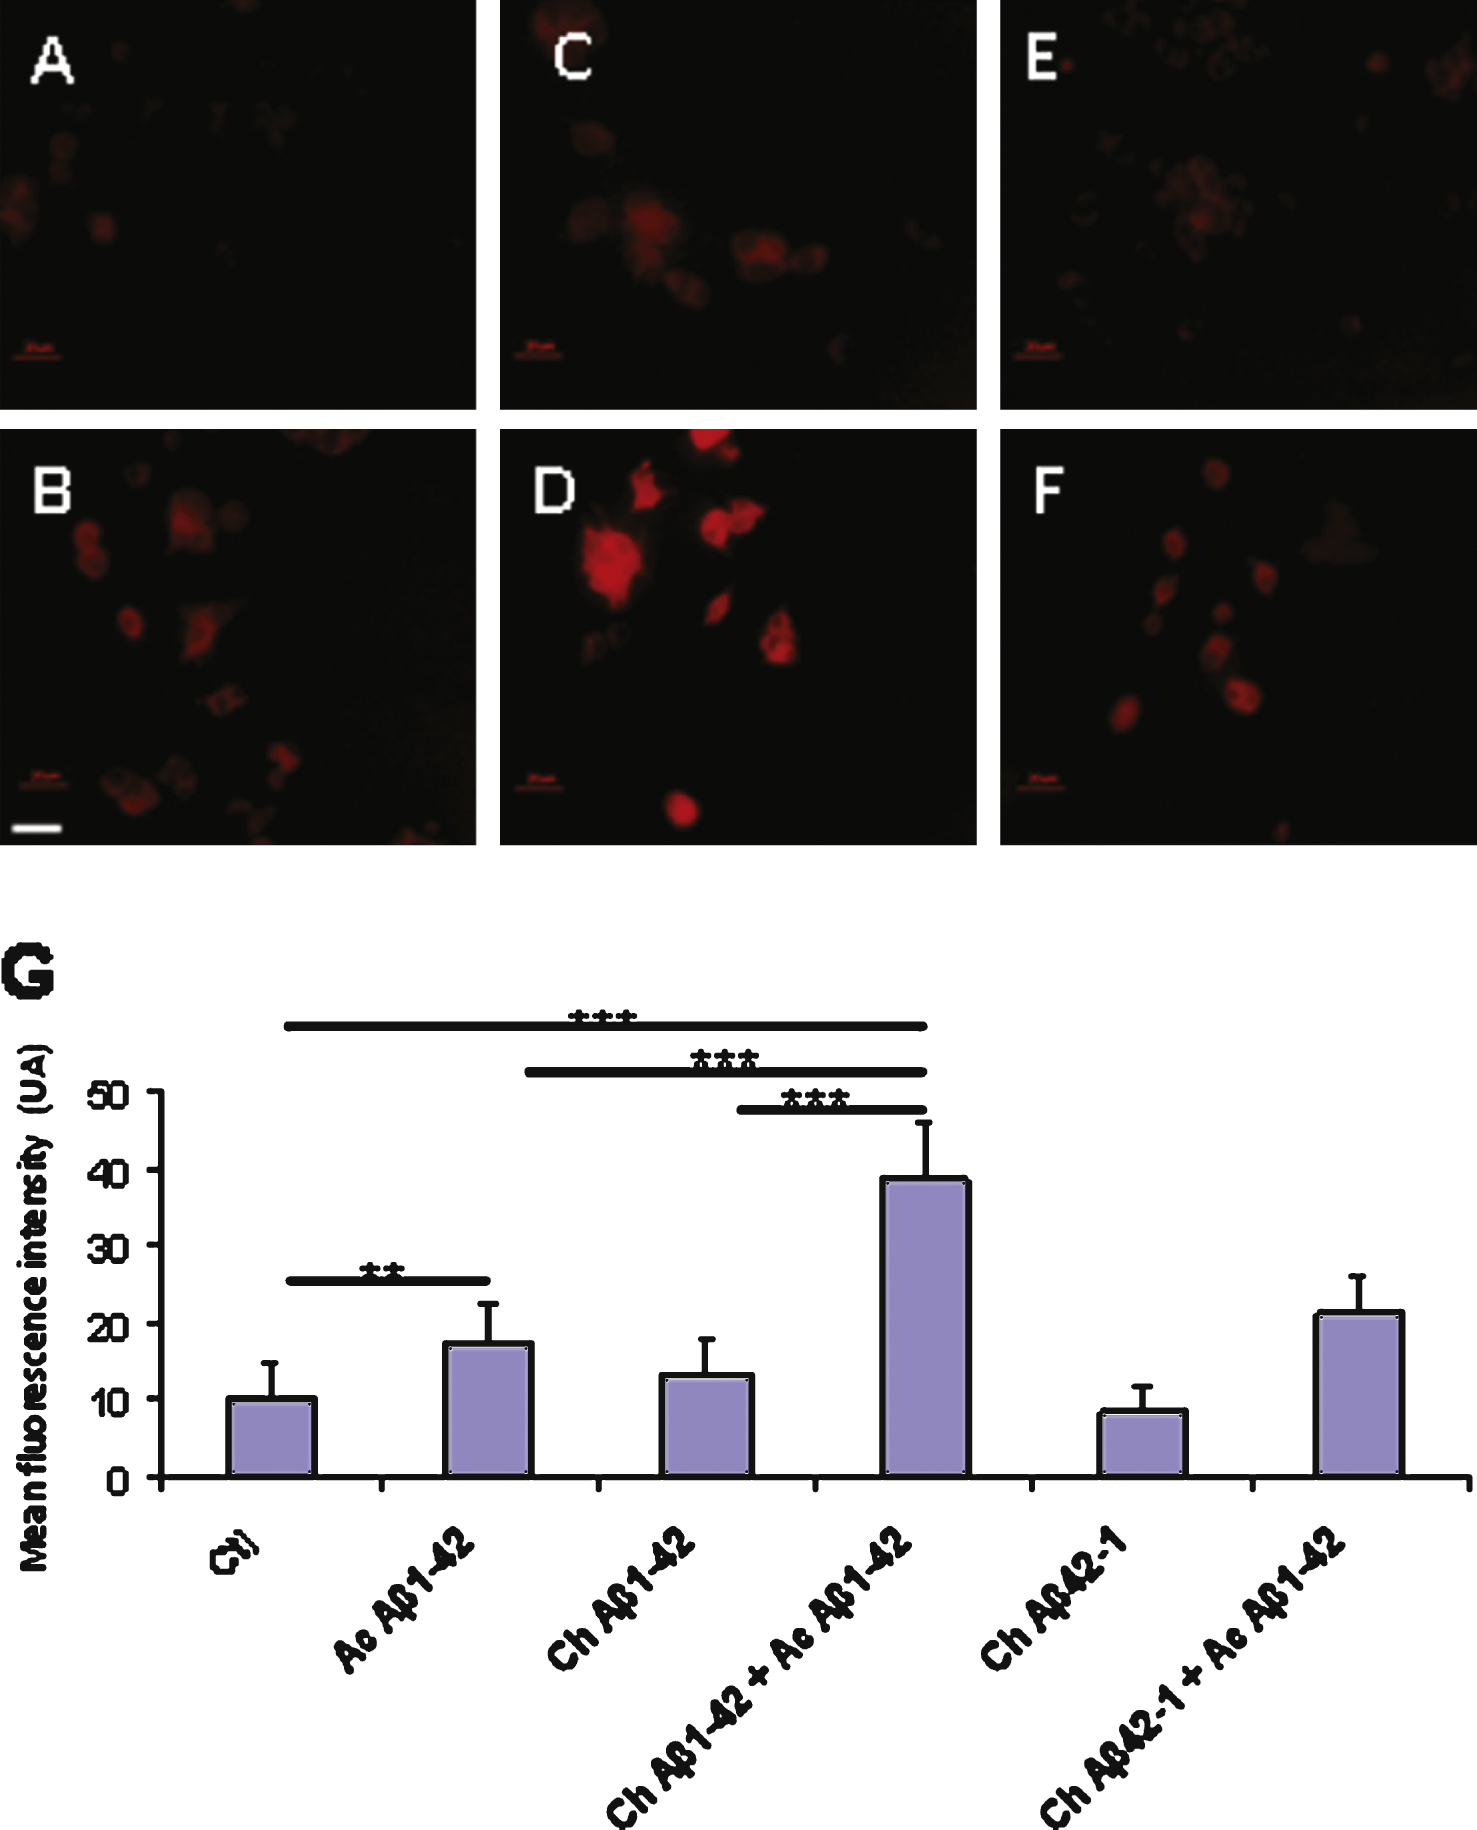
Fig.7
Immunocytochemistry of cultured cortical neurons revealed by the 6E10 antibody directed against Aβ1–42. The cells were treated with the following conditions: vehicle application as a control (A); acute application of 200 nM Aβ1–42 (B); chronic incubation of 10 nM Aβ1–42 (C); chronic incubation with 10 nM Aβ1–42 followed by acute application of 200 nM Aβ1–42 (D); chronic application of the reverse peptide Aβ42–1 (10 nM) (E); chronic incubation with 10nM Aβ42–1 followed by acute application of 200 nM Aβ1–42 (F). Additional antibodies were used to distinguish neurons (anti MAP2, blue) from astrocytes (anti GFAP, green) in the culture dish. Panel G represents the quantification of Aβ1–42 immunofluorescence on neurons in the different experimental conditions. (Statistics: one way ANOVA and subsequent Bonferroni test; ***p < 0.001). Calibration bar 20 μm.
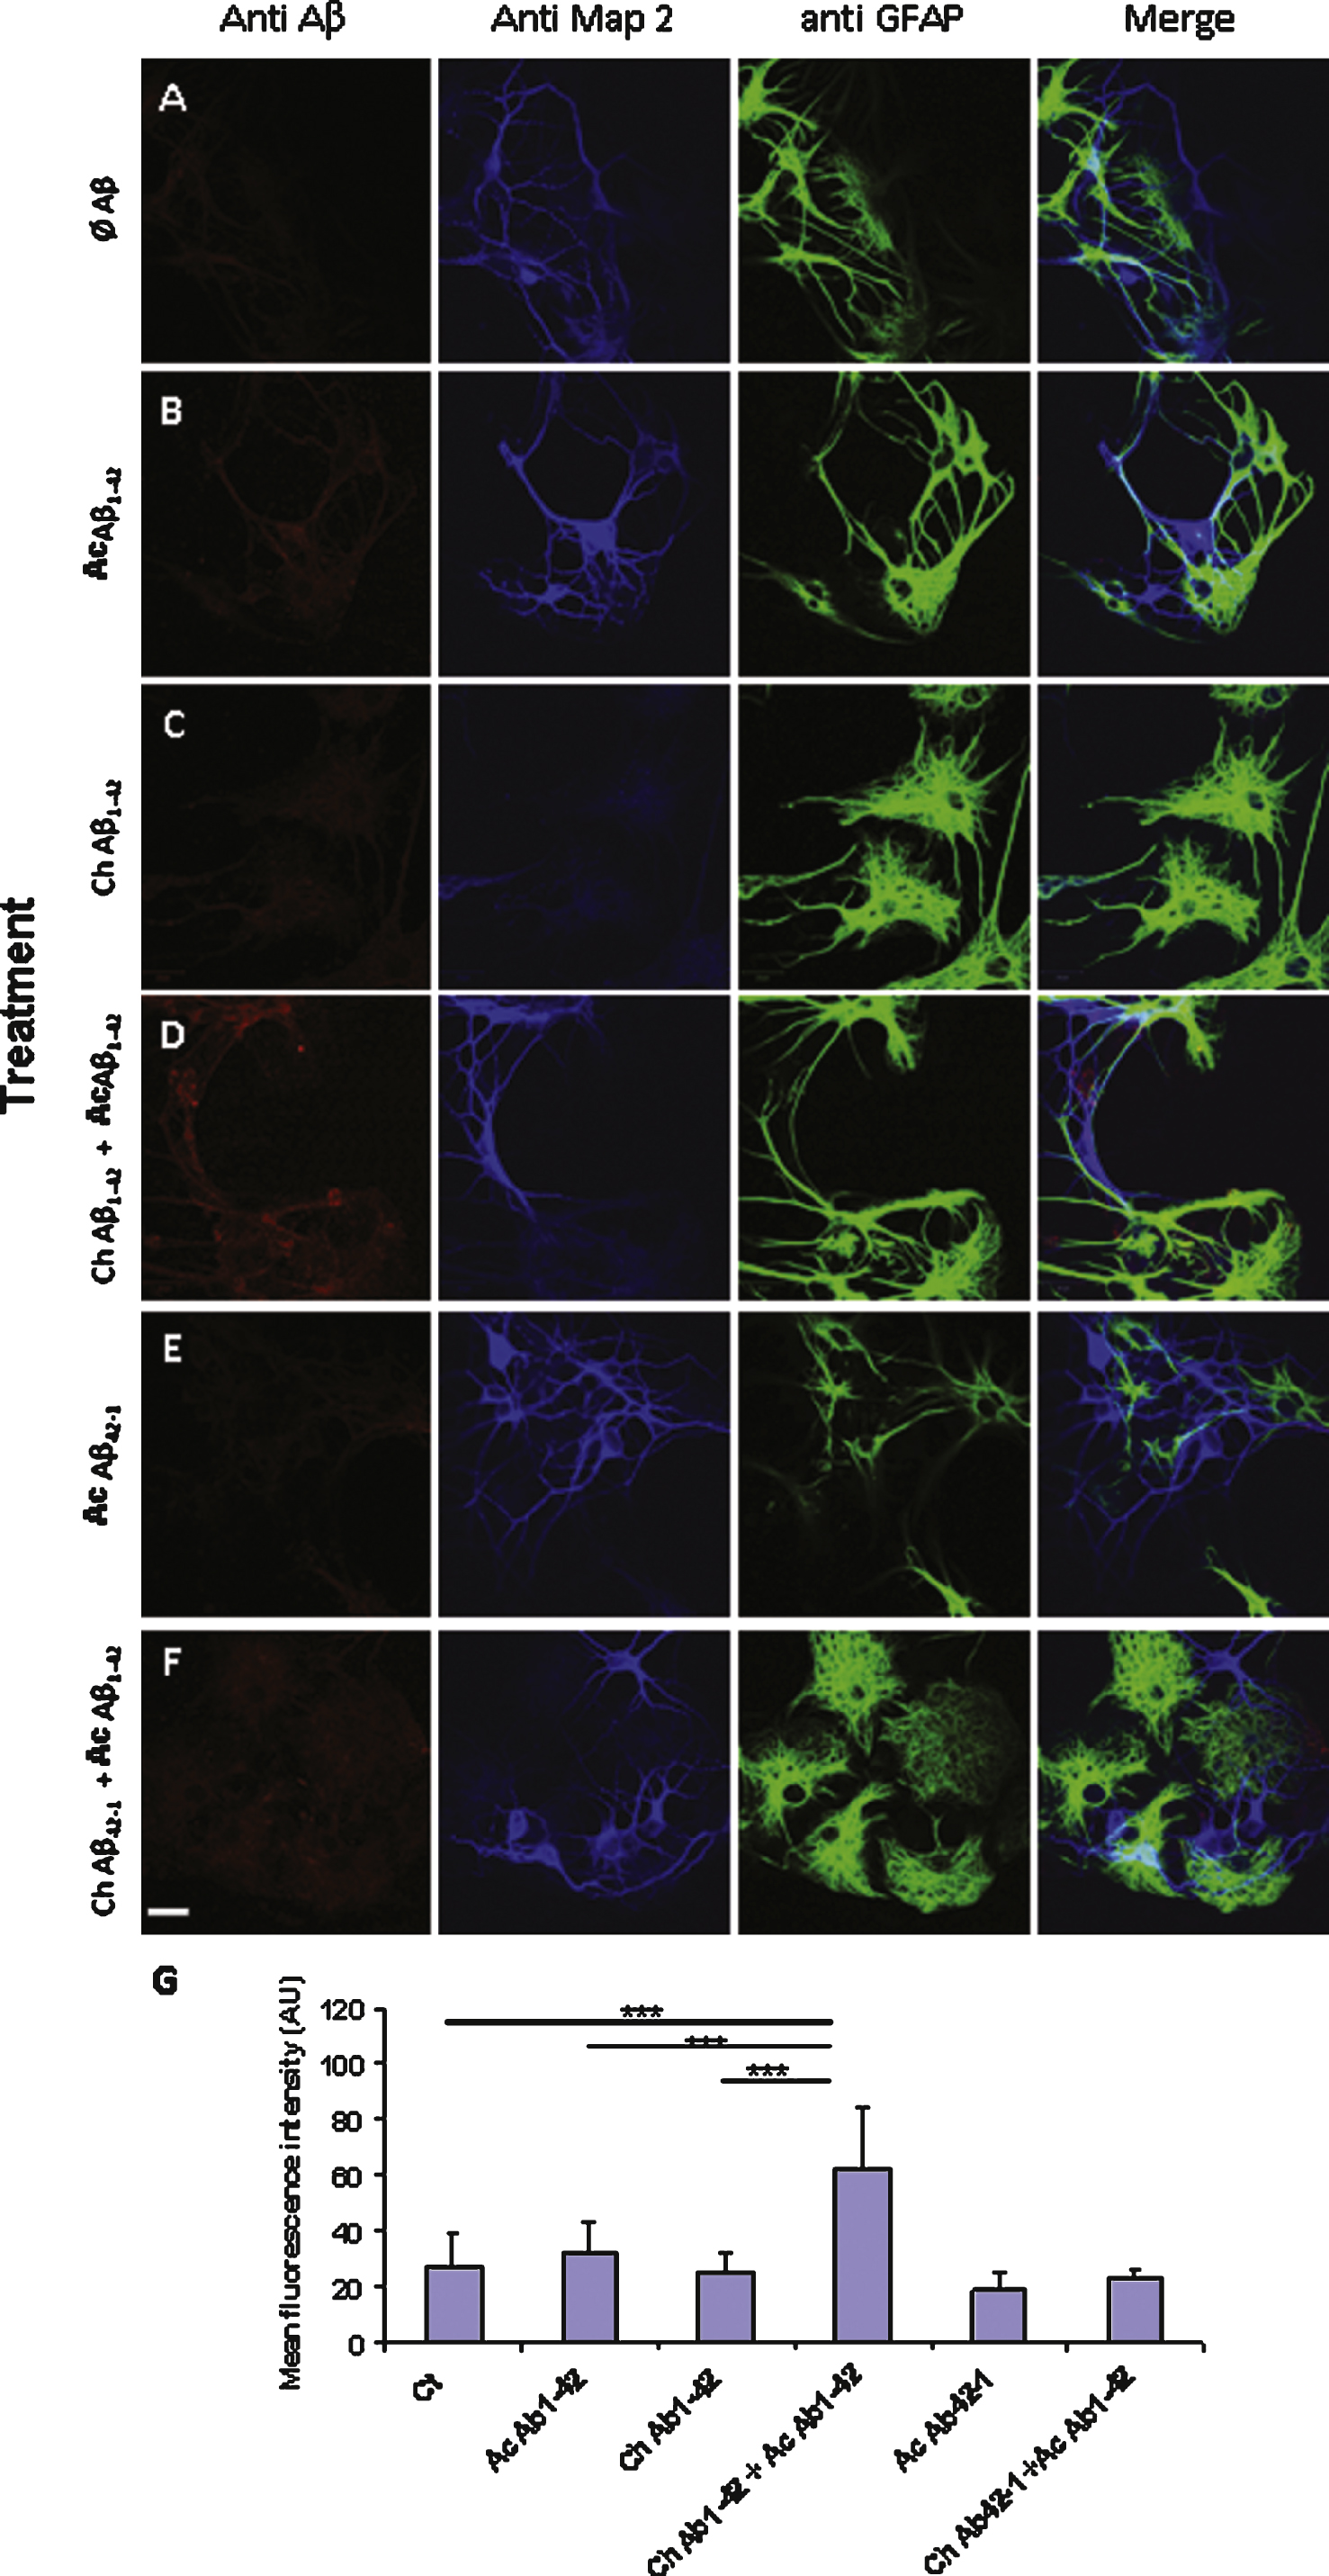
Fig.8
Aβ42 binding to PC12 cells is correlated with an increase in the membrane expression of GluN2B. Fixed PC12 cells were incubated with primary antibodies directed against GluN2B subunit (green) and Aβ42 (red). The chronic treatment with 10 nM Aβ1–42 monomers did not produce a significant increase of GluN2B immunoreactivity. The fluorescence intensity related to GluN2B increased when the cells were incubated with 1 μM oligomeric Aβ1–42 as illustrated by the lower panel. Note that the two antigens are partially colocalized. However in some cells this colocalization appears weak suggesting a heterogeneity among PC12 cells (white arrows). (Crl: vehicle application as control; Ac: acute 1 μM Aβ application; Ch: chronic 10 nM Aβ incubation; Statistics: one way ANOVA and subsequent Bonferroni test; *p < 0.05; **p < 0.01; ***p < 0.001). Calibration bar 20 μm.
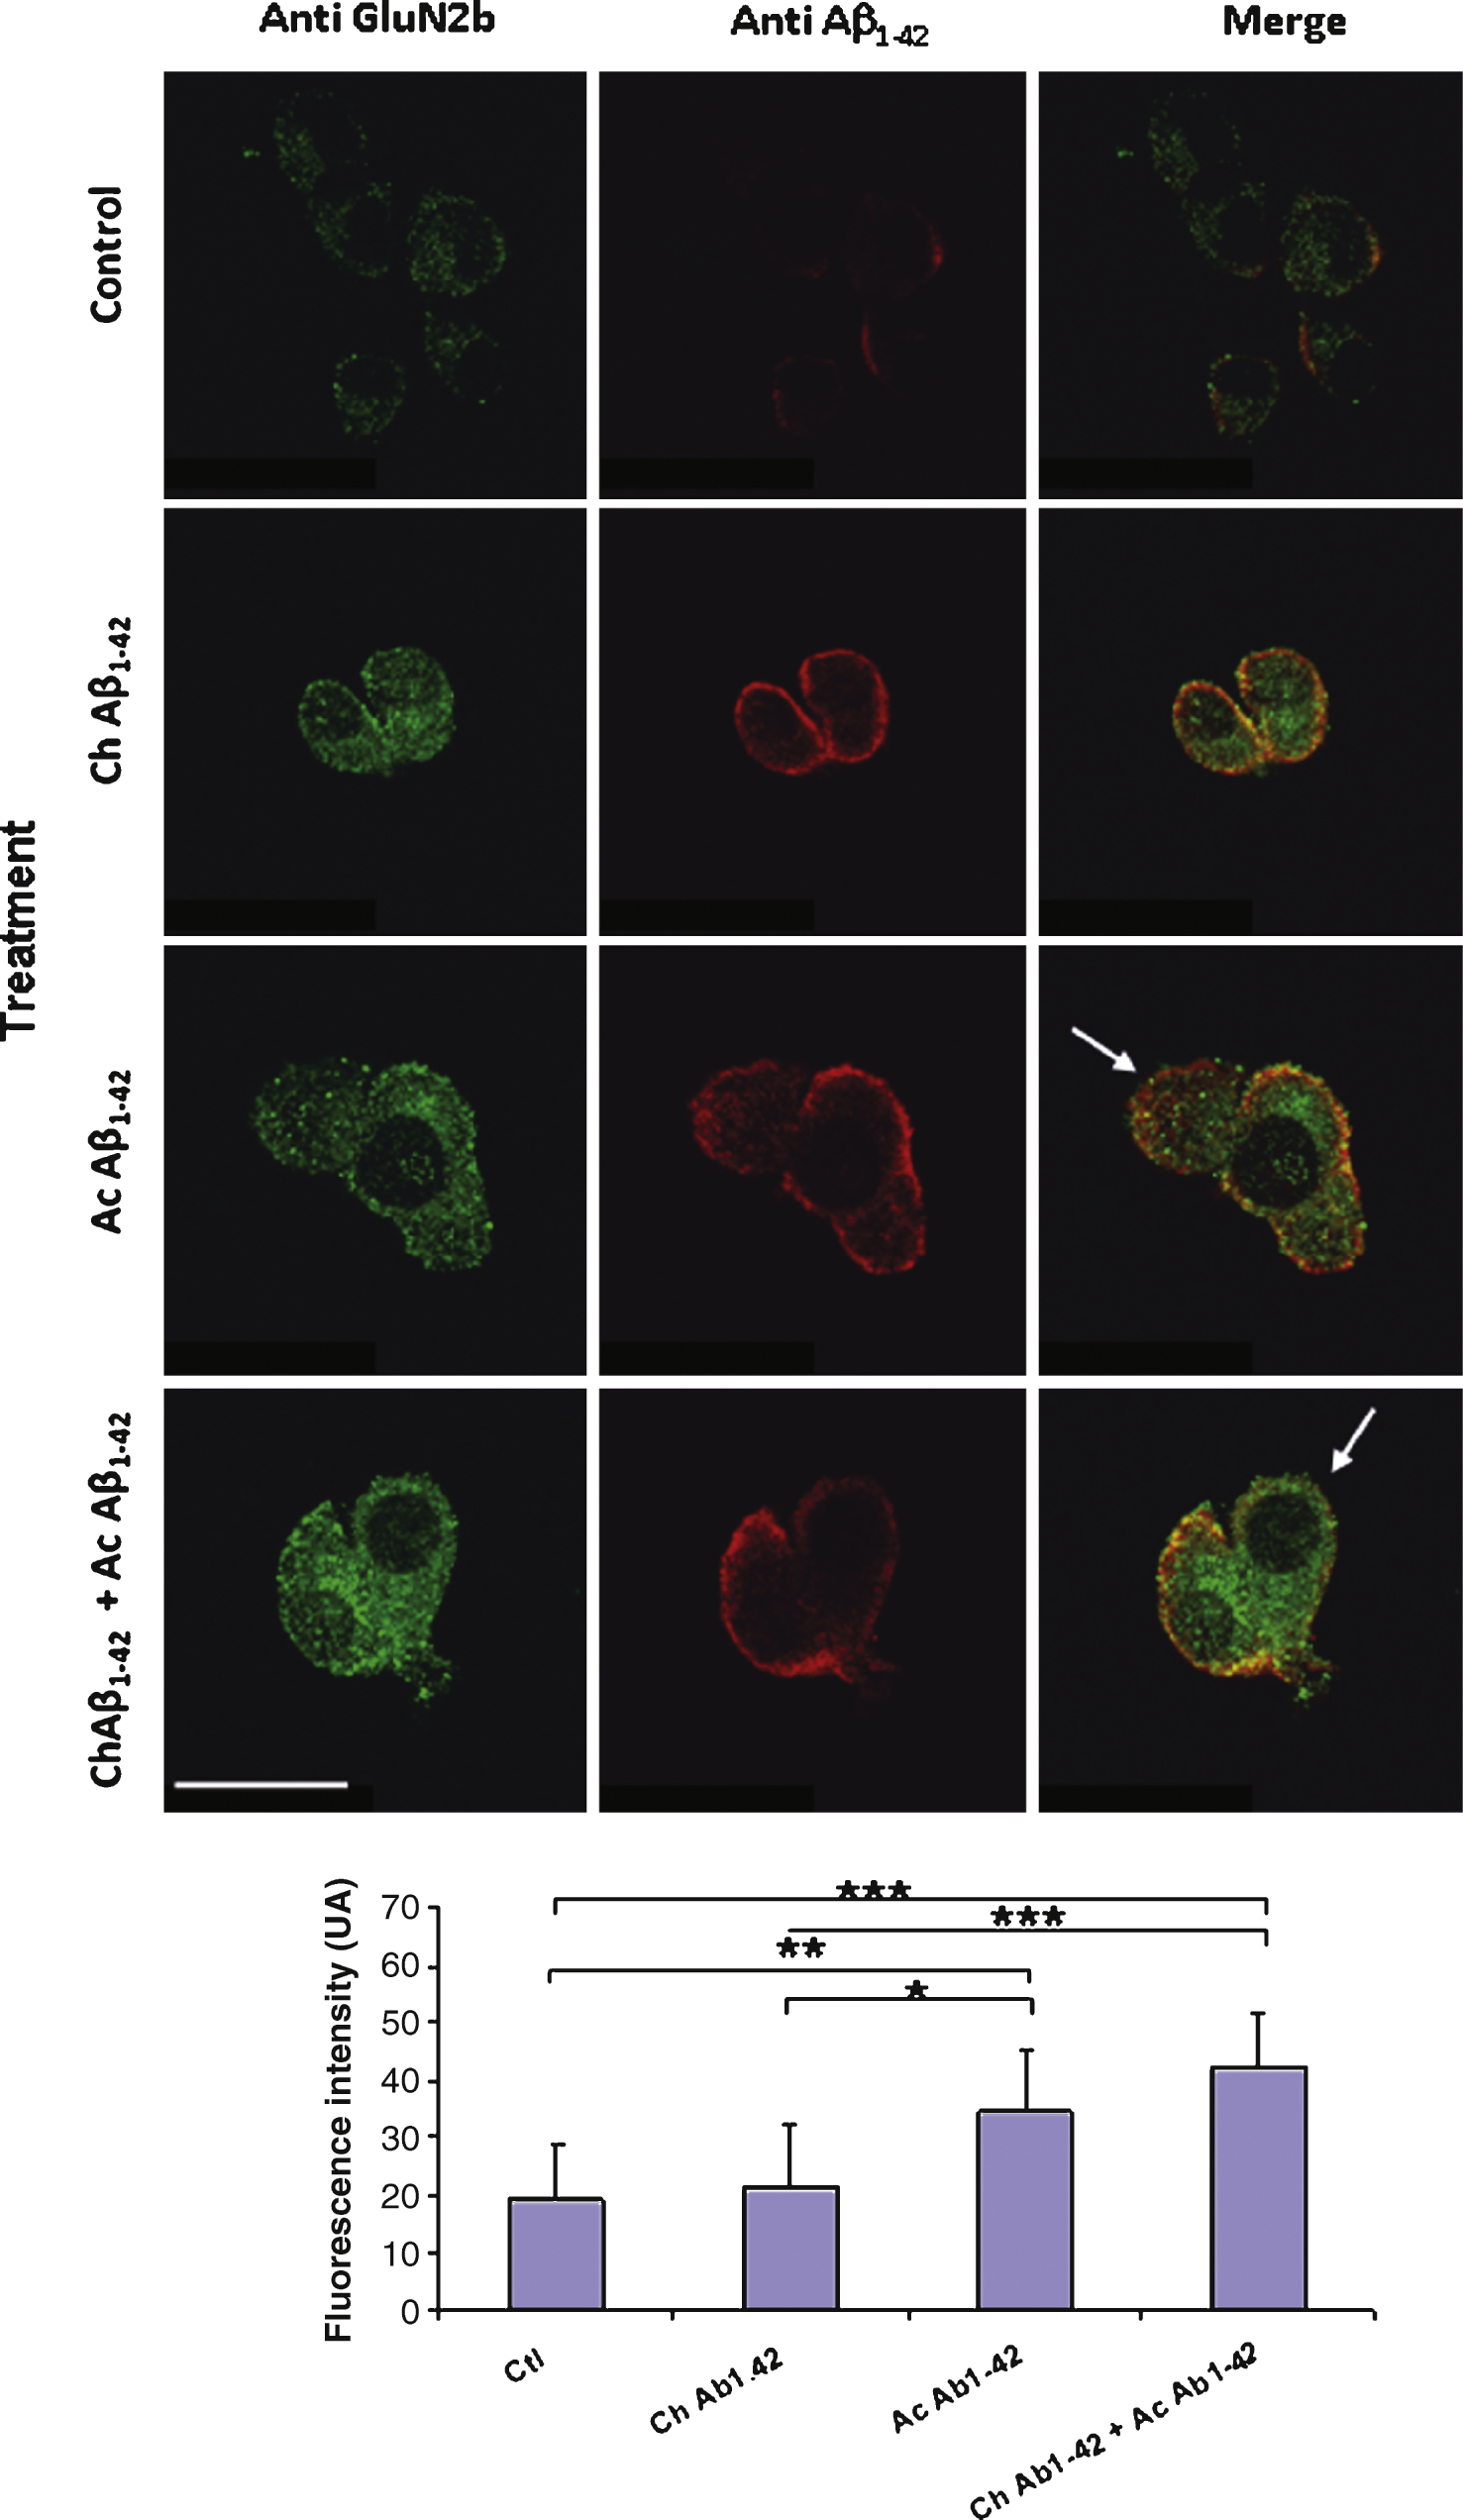
Fig.9
Chronic incubation of cortical mouse neurons with 10 nM monomeric Aβ1–42 induces a significant decrease of GluN2B expression on the plasma membrane of the cells. Fixed non permeabilized cells were revealed by an anti-GluN2B primary antibody (green) and an anti-Thy1.2 antibody (red) to characterize neurons. The immunofluorescence of GluN2B was quantified in Thy1.2-positive cells only (lower graph). (Crl: vehicle application as control; Ac: acute 1 μM Aβ oligomers incubation; Ch: chronic 10 nM Aβ monomers incubation; Statistics: one way ANOVA and subsequent Bonferroni test; **p < 0.01; ***p < 0.001). Calibration bar 20 μm.
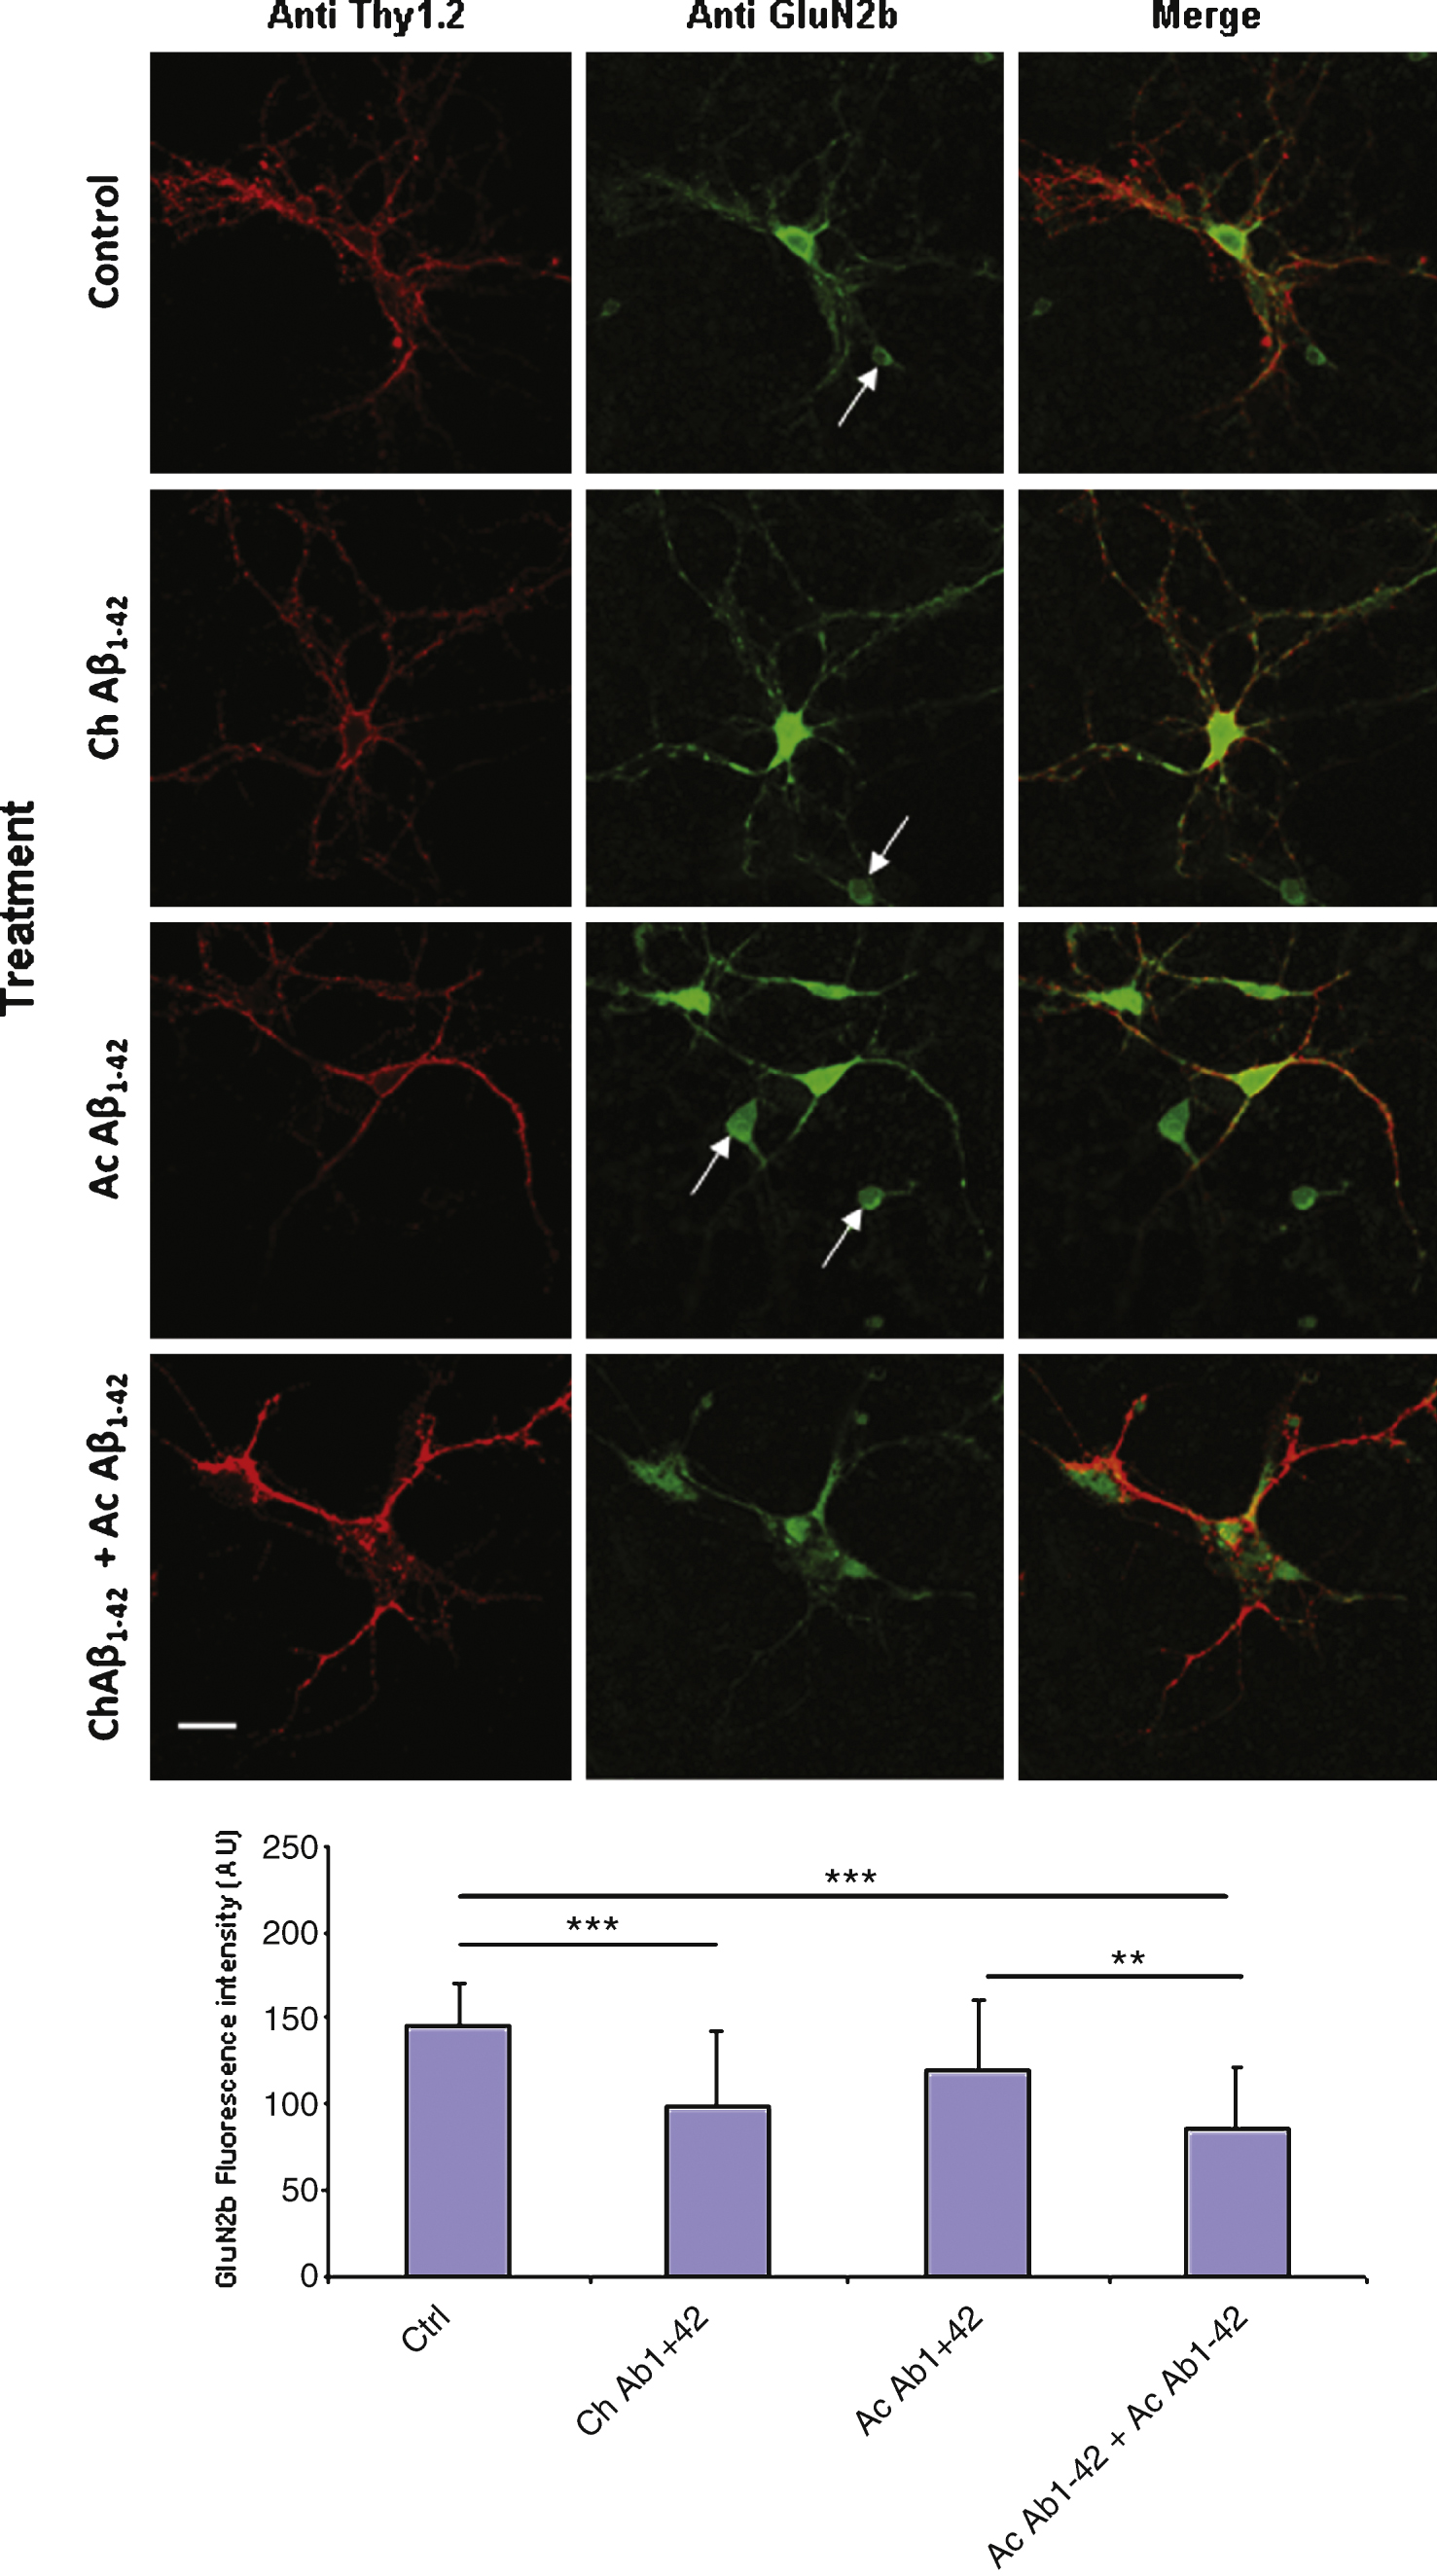
Table 1
Effect of NMDA receptor antagonist D-APV on the intracellular calcium response induced by Aβ1–42 application to PC12 cells
| Ct n = 17 | Aβ1–42 n = 21 | DAPV n = 23 | DAPV + Aβ1–42 n = 21 | |
| Normalized ratio F350/F380 | 0.98 ± 0.02 | 5.18 ± 0.40 *** | 1.02 ± 0.04 | 0.99 ± 0.03 |
| % of responsive cells | 7 ± 1.0 | 73.3 ± 7.6 | 0 | 9 ± 16% |
| % of inhibition | – | – | – | 94% ± 1.5 |
Expressed as mean ± SD; Statistical analysis of the fluorescence ratio: multifactorial ANOVA and post-hoc Bonferroni test. *** p < 0.001 as compared to all other conditions.

