Letter to the Editor
Concerning “Atomic bomb testing and its effects on global male to female ratios at birth” by Victor Grech, International Journal of Risk and Safety in Medicine 27 (2015), 35– 44. DOI 10.3233/JRS-150641
Sir,
In his recent study, Grech claims that a rising male to female ratio at birth (sex ratio) “was found in most regions in temporal association with atomic weapon testing” [1].
However, the received wisdom among radiation scientists is that radiation exposures have little or no effect on the sex ratio of live births: any findings that challenge the prevailing wisdom need to be scrutinized carefully. It would have been helpful if Grech had presented a graph of the temporal trend of sex ratios together with the fallout levels to support his claim of an association.
As data source for live births per sex, Grech cites the WHO Health for All data base (WHO HFA). But for most European countries data are only available from 1970 or even later and for Germany from 1990 to 2012.
To visualize the trend of sex ratios, I downloaded annual live birth numbers per sex from the website www.mortality.org for the US and five large European countries (Germany, United Kingdom, France, Italy, and Spain). I pooled the data from the European countries and plotted the trend of sex ratios together with the respective trend in the U.S. (see Fig. 1, upper panel). The lower panel shows annual cesium-137 concentrations in grass samples at Rothamsted, north of London in the UK [2].
Looking at Fig. 1, it is not easy to see a direct association between sex ratio and fallout level; the sex ratios are even lowest during the period of highest fallout. However there is a broad rise and fall of sex ratios from the late 1960 s through the 1980 s, with a maximum around 1975.
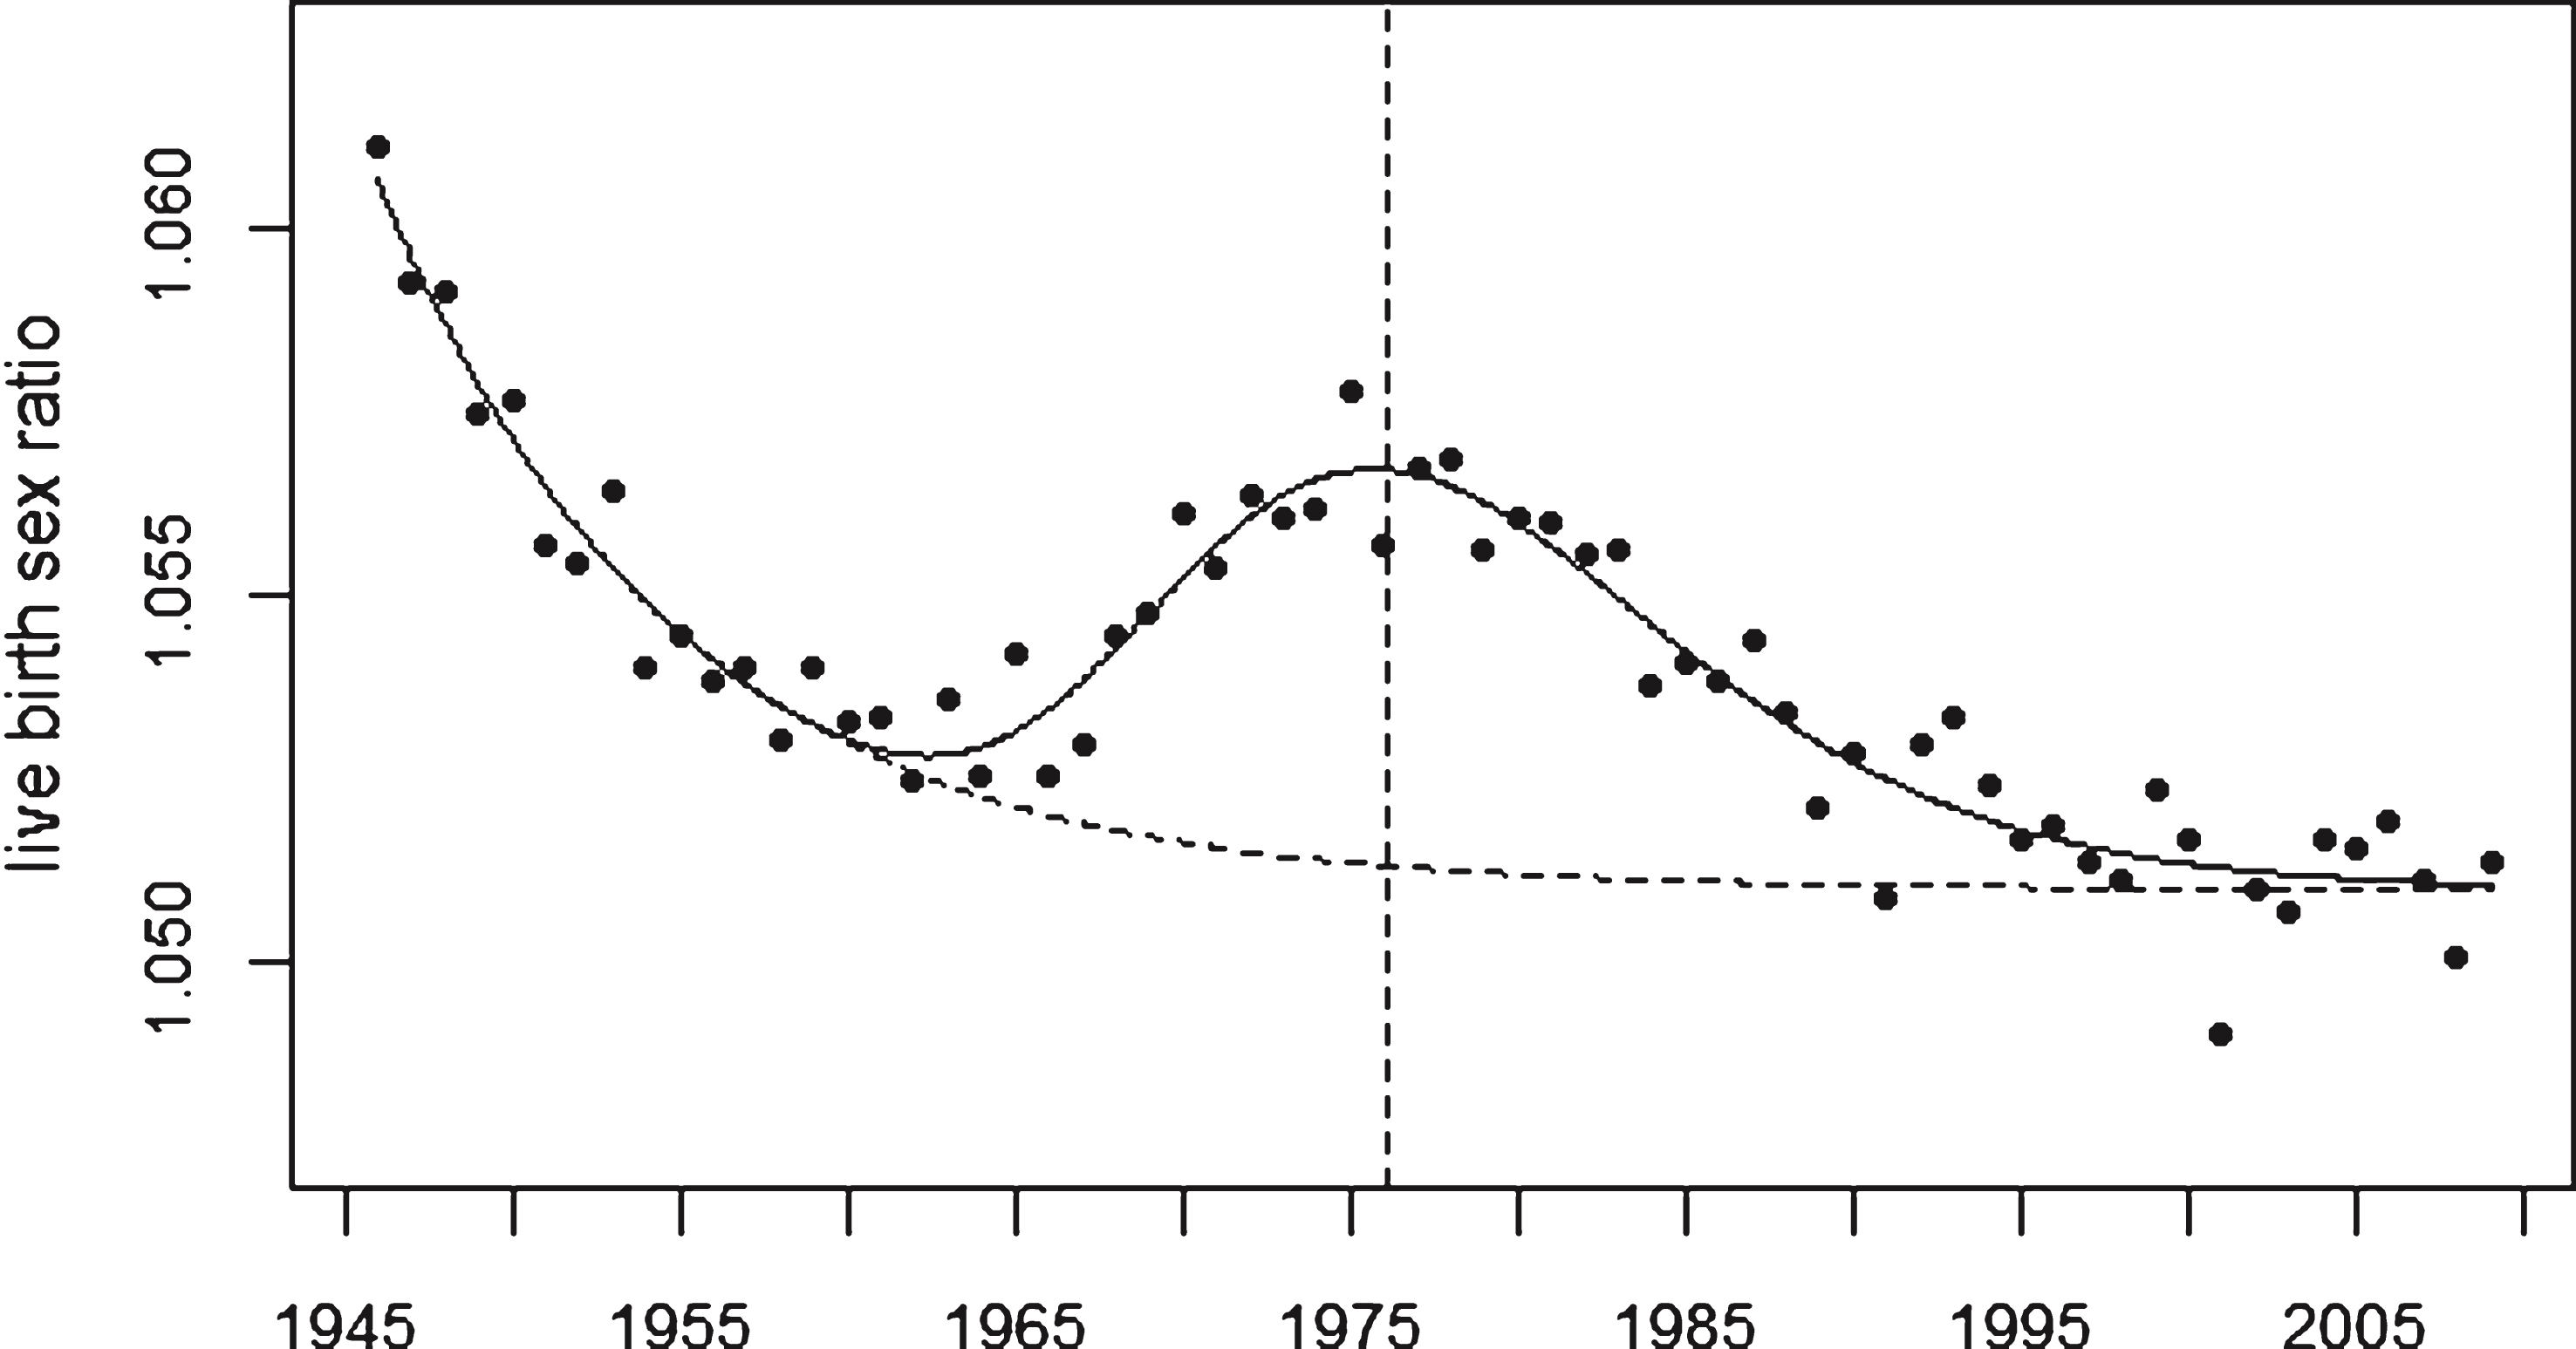
Since the trends of sex odds show a similar time pattern in Europe and the US, I pooled the data to reduce statistical variations. The result is shown in Fig. 2. The solid line represents a regression with an exponential trend plus a constant and a superimposed bell-shaped excess term (lognormal density function) with a maximum in 1976 (see vertical broken line). The model fits the data well (deviance = 49.5 with 58 degrees of freedom, P = 0.78).
Grech fails to offer a possible explanation for this delayed effect of radiation exposure on sex ratios. In my study of perinatal mortality in Germany after the atmospheric nuclear weapons tests I found a similar rise and fall with a relative maximum at the beginning of the 1970 s which is associated with the calculated strontium content in pregnant women [3]. Whether this model could also explain the observed trend of sex ratios could be usefully investigated.
References
1 | Grech V(2015) Atomic bomb testing and its effects on global male to female ratios at birthInt J Risk Saf Med27: 1354410.3233/JRS-150641PubMed PMID: 25766065 |
2 | Warneke Th, Ian W, Croudace IW, Warwick PhE, Taylor RN(2002) A new ground-level fallout record of uranium and plutonium isotopes for northern temperate latitudesEarth and Planetary Science Letters203: 3-410471057 |
3 | Körblein A(2004) Perinatal mortality in West Germany following atmospheric nuclear weapons testsArch Environ Health59: 11604609PubMed PMID: 16599009 |
Figures and Tables
Fig.1
Live birth sex ratio in USA (•) and in 5 European countries (+) (upper panel) and cesium concentration in grass samples at Rothamsted, England (lower panel).
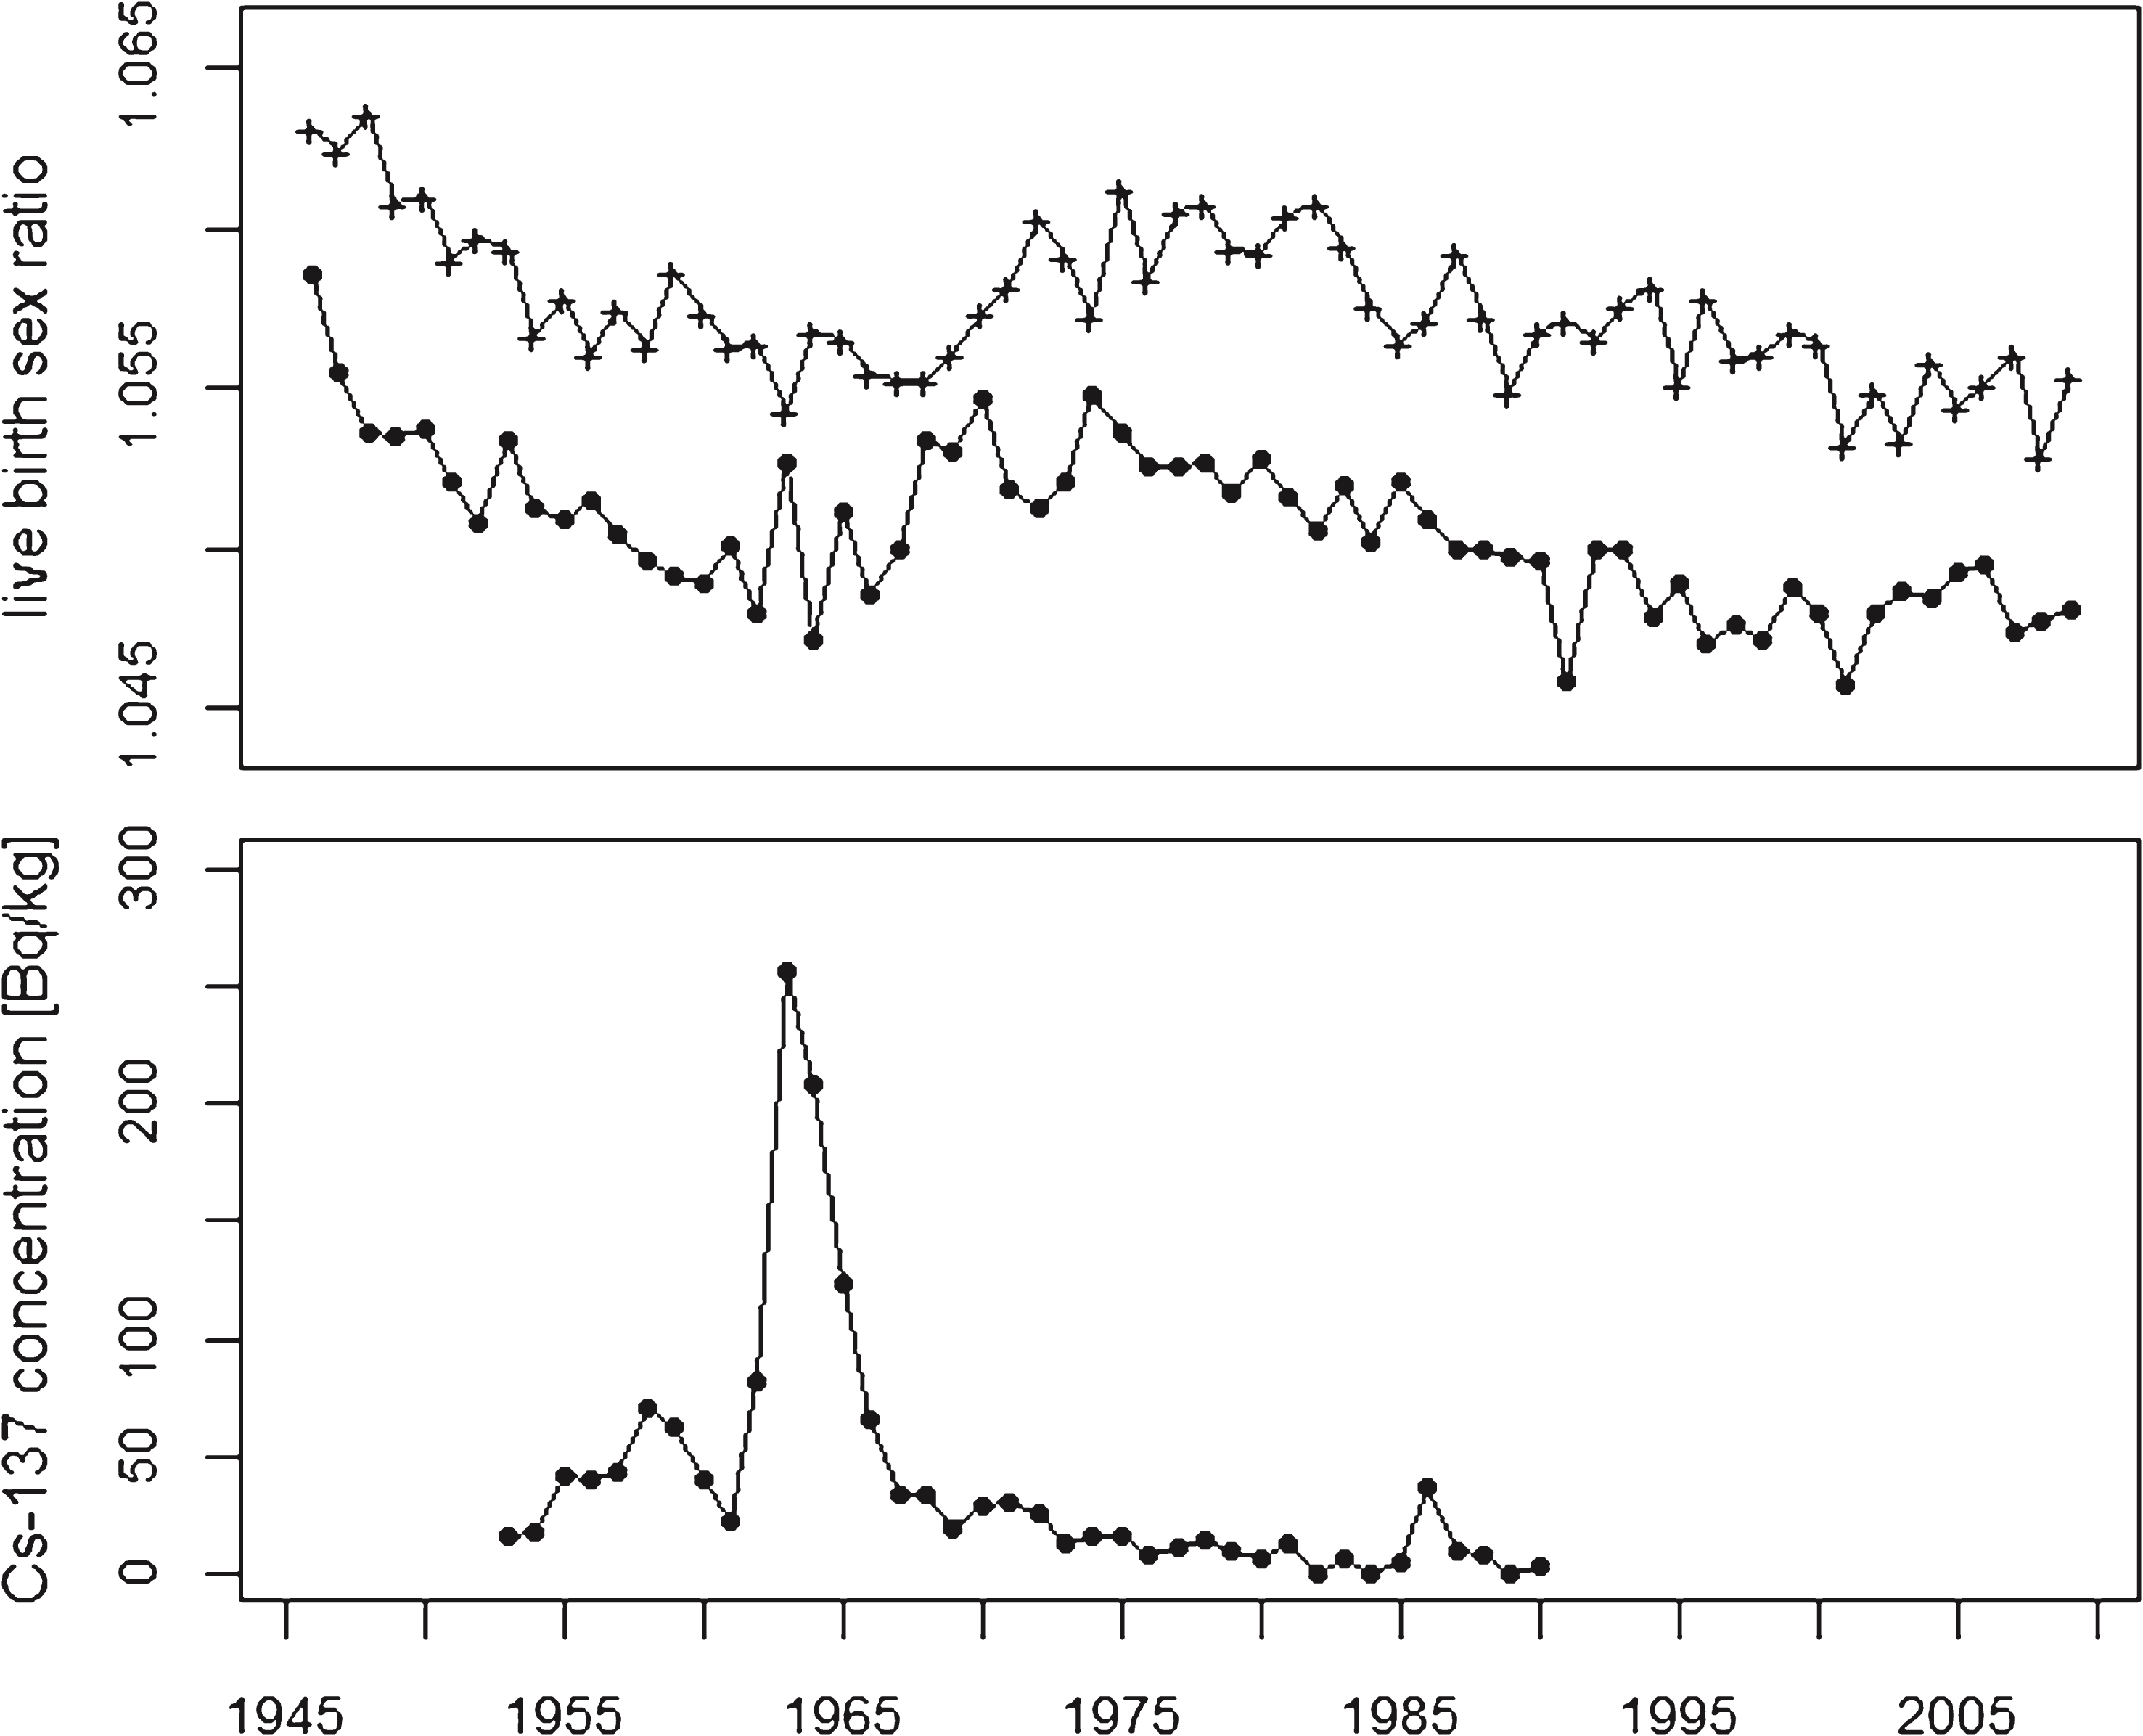
Fig.2
Live birth sex ratio in USA plus 5 European countries and trend line. The broken line shows the undisturbed trend.