
RFID technology for blood tracking: An experimental approach for benchmarking different devices
Abstract
OBJECTIVE: The objective of the paper is to design a testing protocol to measure performances of RFID devices applied to blood supply chain, and to implement an experimental campaign in order to collect performance data. The protocol matches operational conditions in blood supply chain and is particularly tailored to some critical processes, which can benefit from RFID adoption. The paper thus strives at benchmarking performances of inlays, fixed and handheld RFID readers, when deployed in the blood supply chain processes.
DESIGN, METHODOLOGY, APPROACH: The adopted testing protocol enables the assessment of performances of RFID devices in processes of the blood supply chain, since it has been developed peculiarly to emulate critical logistics processes. The testing protocol has been designed jointly with hospital personnel involved in every day operations on blood bags and tubes in order to improve processes, in terms of safety and reliability. The testing protocol has been applied to 3 inlays, 2 fixed readers, 1 mobile handheld in 3 logistics processes, all operating according to UHF EPC class 1 gen 2 protocols and ETSI regulations. We measured and compared read rates, accuracies and read times.
FINDINGS: The results of the test give a direct insight of performances to be expected from different RFID devices when deployed in a real-world environment. Therefore, it is possible to give answers to how a specific piece of hardware — such as an inlay or a reader — performs, and how it can be effectively used to improve security of patients in healthcare. At the same time, researchers focusing on the business process reengineering of blood supply chain can assess the technical feasibility of the RFID-reengineered logistics processes in order to improve the safety of end users.
1Introduction
Healthcare industry is facing many challenges from the increasingly competitive and globalized business environment. New technologies for patients, personnel, and materials management are progressively integrated in healthcare facilities, in order to improve the efficiency and the effectiveness of business functions (Chong & Chan 2012).
Recent studies revealed that manually intensive pre-analytical activities currently represent the leading sources of errors in laboratory and transfusion medicine. Among pre-analytical errors, misidentifications and mistransfusions are still regarded as a considerable problem, posing serious risks for patient health and carrying huge expenses for the healthcare system (Lippi & Plebani 2011). To address this problem, scientific research is working to devise reliable methods for reducing clinical risk related to blood transfusions, e.g. through total control and traceability of transfusion chain (Borelli et al., 2015).
Radio Frequency IDentification (RFID) is a wireless technology that is increasingly deployed for tagging products throughout the supply chain, given the various benefits that this technology can bring to the supply chain players (Bottani et al., 2016). RFID systems can be considered as a natural integration and evolution of barcodes, and they are currently used for asset traceability in different sectors. They are composed of two elements: reader and tag (transponder). The reader is able to broadcast an electromagnetic field and a radio signal to, or either to interrogate and store data on the tag depending on the tag type. The electromagnetic-operated tag picks up the radio signal and transmits its identification, and additional information, if feasible. A tag includes at least an integrated circuit and an antenna operating on a specific frequency, and, depending on the application, tags may be equipped with a limited data storage capacity. Tags can be embedded or printed on different supports (wristband, label etc.).
As indicated by Ngai et al. (2008), RFID technology is deployed in a variety of sectors, from retailing (Bertolini et al., 2015, Bottani & Rizzi 2008) to fashion and apparel (Rizzi et al., 2016), and from construction (Yagi et al., 2005) to logistics and supply chain management (Oztaysi et al., 2007). Typical benefits of RFID include increasing data accuracy resulting in decreasing process times, as well as increased turnover/sales and reduction of shrinkages (Esposito et al., 2015). Several studies have assessed the potential of RFID technology within healthcare environments (e.g. Van der Togt 2011), showing positive effects on patient safety and logistics of patients and medical products. Although RFID technology allows healthcare facilities to gain a competitive advantage over their competitors (Chong & Chan 2012), prior experiences show that RFID systems that have not been designed and tested in response to the particular needs of healthcare settings might introduce new risks (Van der Togt 2011). Data streams generated by the RFID readers must be tested in order to evaluate their reliability and, eventually, cleaned effectively before they are subjected to warehousing (Anny Leema & Hemalatha 2013). Therefore, technical factors that affect the performance of RFID systems must be measured, in order to determine the applicability of currently available RFID technologies in a medical environment (Ohashi et al., 2008).
Even though the main goal of healthcare investments is to increase the quality of service provided to patients, economic analysis is necessary to provide a justification of a proposed investment (Borelli et al., 2012, Bottani & Rizzi 2008). Particularly, a RFID application project has a specific complexity because of a variety of specific components, which can be chosen during the system design. RFID systems differ in operating frequencies, transponder energy supply, complexity of chips mounted on tags, presence of additional components such as sensors, memory capacity etc. that might affect significantly the costs of implementation (Talone & Russo 2006). Nonetheless, transfusion medicine is today one of the most promising sectors for deploying RFID technology, because blood components are assets with high added value, and therefore efficient management could generate important advantages in this area, both from the clinical (i.e. risk reduction) and from the economical (i.e. blood bag waste reduction) point of view (Borelli et al., 2012).
The aim of this paper is to validate the adoption of RFID as an identification and automation technology suitable for blood tracking. Particularly, Ultra-High Frequency (UHF) RFID technology applied to blood bags and tubes was tested, simulating different logistic processes of the pilot wards. The aim of the tests was to assess and validate the suitability of different devices. Tests were performed in a laboratory, and they consisted of several simulations of re-engineered RFID-enabled processes. Main performance parameters were measured and then analysed in order to define which hardware solution shall be used for the pilot plant.
This paper, in fact, describes an experimental work package of a global project called “Logistic Optimization in Healthcare”, developed by Universitá degli Studi di Cagliari, Universitá degli Studi di Parma and Azienda Ospedaliera Brotzu in Cagliari (AOB), and funded by the Regional Government of Sardinia.
The aim of the project is to develop an innovative RFID-based traceability system for transfusion medicine applications. Transfusion medicine is a healthcare area characterized by a very high potential in terms of quality improvement, i.e. clinical risk reduction, patient (and personnel) safety improvements, inventory management efficiency improvements. The Logistic Optimization in Healthcare project was carried out in Sardinia Island, where blood transfusion components need is significantly higher than the Italian average value (about 64 packed red blood cells units every 1,000 inhabitants, versus 42 blood cells units every 1,000 inhabitants as Italian average). Due to the large demand, almost 50,000 units per year are imported from other Italian regions (Istituto Superiore della Sanitá 2008). The pilot wards of the project were AOB Blood Transfusion Centre, AOB Neurosurgery Unit, AOB General Surgery Unit and Adult Thalassemia Unit of the Ospedale Microcitemico di Cagliari.
The main innovation of the project, and its biggest challenge, is the validation of RFID UHF technology for applications of transfusion medicine. The review of the literature, in fact, highlights that this technology is nowadays the accepted standard in worldwide logistic applications, thanks to the high item-processing performances (reading frequency, operating distances), while it is considered as innovative in transfusion medicine field.
Recent studies related to UHF RFID-based inventory management for medical drugs had satisfactory results; however, they revealed problems related to liquid proximity interaction. RFID UHF systems worked quite well for powder-based drugs while significant problems with readability were observed in the case of liquid bottles (Polycarpou et al., 2012).
Since the transfusion process items are containers for liquids (blood bags, test tubes), using High Frequencies (HF) 13.56 MHz is usually privileged because performances of this technology are not affected by liquid proximity. Moreover, recent studies revealed that HF-based passive RFID technology is safe to use with Red Blood Cells (RBC) (Davis et al., 2009) because quality of RBCs is not affected by any known biologic effects of longer exposure of RF energy (Kozma et al., 2011), so that this technology is recognized as the standard according to United States Food and Drug Administration (FDA).
The tests performed in the present study led to an important and innovative target: to define a reliable UHF-based hardware configuration. Particularly hardware components, procedures and operational limits (such as maximum item number that can be processed for each process) related to the specific application, were defined. As for biologic effects due to UHF exposition, the project also includes a testing part in order to confirm biologic compatibility, as discussed in recent scientific literature (Wang et al., 2013).
The paper is organized as follows: in Section 2, the context of the project is described. Section 3 provides materials and methods used for this study, and Section 4 reports and analyses the results achieved. Finally, Section 5 draws the conclusions of the study and suggests possible perspectives.
2Project context
According to the abovementioned premises, this paper aims at assessing the capability of RFID technology to increase the accuracy and efficiency of the critical processes in the transfusion medicine applications.
To this extent, the first project step consists of a transfusion process analysis, in order to identify critical issues related to service efficiency and safety. The AS-IS model was implemented by using three analytical tools:
• Traditional written reports
• Flow charts
• Activity forms
Process analysis involved Blood Transfusion Centre (BTC), two AOB Operative Units (Neurosurgery and General Surgery), BTC’s “Cooley” sub-department, which is dedicated to major thalassemia patients only, whose demand is approximately 25,000 units/year, and “Thalassemia of adult patients” Operative Unit, of Cagliari “Thalassemia Hospital”. The whole transfusion process was analysed: blood donation and collection, blood screening tests and validation, different blood components production, red blood cells transfusion request, blood compatibility tests and bedside transfusion were studied and mapped.
The AS-IS process analysis was followed by a FMECA (Failure Modes, Effects, and Criticality Analysis), in order to point out the main criticalities, and to suggest specific process refinements (see Table 1). This project step selected the “Thalassemia of adult patients” Operative Unit as the ideal ward for a pilot project development and test because of the following specific reasons:
1. FMECA indicated a lower safety profile for processes, compared to those related to AOB Neurosurgery Operative Unit.
2. Thalassemia patients need scheduled, periodic RBC transfusions, so workflow in the ward is quite regular, and urgent transfusions are not processed.
3. No system for patient identification is at present used in any hospital ward; moreover, since thalassemia patients often need multiple blood units within a single transfusion, human error probability grows proportionally to the amount of blood units that are assigned to each patient.
The process analysis and the subsequent process FMECA, revealed several critical issues, which must be taken into account during process reengineering based on appropriate traceability enabled by RFID systems, such as:
• Critical issues related to safety of procedures, such as items and patients’ identification;
• Critical issues related to inventory management and appropriate storage of perishable blood items;
• Critical issues related to process cycle times optimization.
To reduce criticalities and to improve transfusion medicine service we designed a TO-BE scenario based on RFID reengineered processes; moreover, we assessed the suitability of RFID technology by validating the performances of different devices. Technology deployed in the TO-BE scenario has to ensure the impact reduction of critical issues and a smooth integration with current legacy systems, with respect to the continuity of the transfusion service. A requirement of the pilot project is the integration of RFID technology with existing 1D barcode technology, which is currently used for transfusion centre processes traceability. The following RFID technologies were studied and assessed:
• HF technology (13.56 MHz). Currently, it is the RFID standard approved by the FDA for transfusion medicine applications. 13.56 MHz HF frequency is worldwide compatibly allocated and HF system is not affected by proximity of liquids during tag reading phase. Despite the indisputable reliability of the system, reading potentialities at medium-long range and multiple readings are limited.
• UHF technology (865–868 MHz): Currently, it is the RFID standard for worldwide commercial logistic and it is characterized by several advantages compared to HF technology, such as lower cost, higher performance in terms of multiple tag reading and reading distances.
The latter one was chosen for the project implementation because, according to FMECA, we mainly need to improve the accuracy of blood bags logistics processes, and therefore the advantages of UHF technology in terms of multiple tag reading and reading range are paramount. Furthermore, UHF tags can be also read by means of near field antennas, increasing RF reading performances when applied to heavily absorbing liquids (Rizzi et al., 2011). Finally, it is also important to note that UHF passive tags are typically much cheaper than the HF ones (Harrop 2006). The main challenge was to define a proper UHF technology application for transfusion process.
The new TO-BE configuration was analysed using FMECA described for the AS-IS scenario. Concerning Key Performance Indicators (KPIs) reported in Table 2, the impact of RFID technology on processes related to patients and assets recognition causes a significant reduction of the “Average Risk Priority Index (RPI)” and “Peak RPI” values of the MCT Request and MCT Transfusion processes (Fig. 1).
In particular, the management of blood bags is supported by RFID technology in the TO-BE scenario, especially in terms of delivery accuracy (right products in right quantities during inbound and outbound processes) and in terms of identification in the transfusion process (crosscheck between the RFID tag of the blood bag and the patient’s badge). While a single tag manual reading is easily achievable and feasible, bulk identification of blood bags during inventory processes requires a technological assessment. As a matter of fact, the high water content (80%) in blood can deeply affect the readability of UHF tags.
Concerning the pilot test tubes management, adoption of RFID technology in the TO-BE scenario enables higher accuracy and efficiency compared to barcode technology. In fact, in the traditional process, barcodes and hand written papers are used; on the contrary, in the reengineered process, tubes are labelled with a RFID label whose memory is programmed contextually to the recognition of the patient, thanks to the reading of his/her personal RFID-enabled card. This operation (and other single identification processes analysed in the FMECA model) is easily feasible by means of RFID UHF standard reader/writer since it involves one tag at a time (patient’s card for reading data, which is then associated with his/her blood tube tag). Other logistics processes involving blood tubes are different and require a bulk reading of multiple tags; in this case, it is necessary to perform feasibility tests in order to assess the capability of RFID technology to fulfil such requirements. Processes requiring precise and accurate inventory of blood tubes are inbound/outbound inventory check and staging time calculation of tubes on the desktop tube rack (time is related to blood temperature); presented tests simulate such real logistics processes.
As mentioned before, the critical aspect of the RFID processes has been identified in the reliability of simultaneous reading of multiple tags. The presence of blood in the bags and test tubes involves absorption of the electromagnetic field and thus a decrease in the reading capability. It is therefore important to determine, with a very low margin of uncertainty, which system configurations are capable to guarantee the 100% recognition of the logistics assets within the expected time frame.
The following part of the paper describes a quite significant step prior to the design of UHF RFID system, the laboratory simulation tests which were carried out in order to verify the technology reliability during transfusion processes.
3Materials and methods
The testing protocol developed in order to test the performance of RFID devices applied to blood bags and test tubes encompasses two use cases for which fixed and handheld readers, antennas and tags are tested. In every use case, the most suitable devices have been tested, i.e. the kind of hardware which allow the execution of the process minimizing the impact of RFID technology adoption on process execution with respect to the capability of gathering correct data from the field.
It is important to note that, instead of blood, we filled both blood bags and blood tubes with water for the execution of the tests. We made this choice because, as reported by Otin (2011), blood behaviour is rather critical when placed inside a RF field, due to its absorbing capability. This study, in fact, indicates that the main reason of this phenomenon is the relative electric permittivity ɛ’r, that is around 70 for blood at room temperature (25° C). This value is very high, if compared with RF-friendly materials such as oil, cardboard, wood and paper, which score values of ɛ’r below 5 at the same conditions. Water, on the contrary, shows a value of ɛ’r equal to 80 at room temperature (Ellison et al., 1996). Given these premises, we choose to adopt water because (i) it is much more available and not subjected to any regulation, (ii) it gives more conservative results, and thus the RFID reading performances achieved with water can only be increased when blood is used.
We have tested two different RFID tags on the blood tubes, both read by a desktop RFID reader; while blood bags were tagged using one of the best performing RFID inlay, and inventoried by different RFID devices, such as a handheld RFID reader, a desktop reader and a fixed reader. The fixed reader was tested in two different configurations, connecting it to near field and far field antennas. In order to guarantee statistical significance, every RFID device was tested through many replications for each use case. During these replications, we tagged blood bags and tubes with a progressive EPC and numbered them: this progressive unique number assigned to each bag or tube was useful during the data analysis phase, as we will describe below.
We now provide details on the objectives, equipment, procedure, and KPIs for each use case.
Blood bags inventory (fixed): the test aims at assessing the performance of different combinations of RFID readers and antennas during the process of blood bags inventory. Two different reading configurations have been set up, according to the specific hardware adopted.
Test #1: in the first configuration a fixed Ethernet reader was used to perform simultaneous reading of EPC Class 1 Gen 2 tagged blood bags placed into a cardboard case placed on a special reading table made up of a couple of near field antennas. Reference tag #1 was used; we applied tags on 30 blood bags inserted in a 50×35×10 cm sized container; the container was then placed on the radiating surface of a couple of near field antennas, facing upwards. Antenna surface is 60 by 43 cm wide. Each blood bag was filled with approximately 500 ml of water, and equipped with a tag in the upper part, as reported in Fig. 2. The power of the reader was set for all the tests to 100%, corresponding to 2WERP; the reader was connected to a couple of near field antennas mounted according to Fig. 2.
The test was repeated 30 times using 30 blood bags in the cardboard box, 30 times with 25 bags and 30 times with 20 bags in the box. Blood bags were tagged with a progressive EPC and numbered; for example, the first group was made of bags numbered from 1 to 30. The cardboard box filled with 30 blood bags was placed on the wooden table between the RFID reading antennas, and then the RFID reader was set to continuous reading mode for a 60 seconds timeout by means of the dedicated software. After the reading time has elapsed, the reading performance was computed; and the whole test was repeated 30 times. Then the number of bags was decreased to 25 and 20, respectively, and the whole procedure was repeated.
Test #2: in the second configuration, the same fixed Ethernet reader used in the previous test performed simultaneous reading of EPC Class 1 Gen 2 tagged blood bags; the bags were placed into a cardboard box on a table, within the reading zone of a RFID gate. Reference tag #1 was used; tags were applied on 30 blood bags inserted in a 37×25×21 cm sized container, placed on a wooden table between two radiating far field antennas, facing at 68 cm distance. Each blood bag was filled with approximately 500 ml of water, and equipped with a tag in the upper part, as reported in Fig. 2. The power of the reader was set for all the tests to 100%, corresponding to 2WERP; the reader was connected to a couple of far field antennas placed on the sides of the cardboard case according to Fig. 3.
The test was repeated 30 times using 30 blood bags in the container, 30 times with 20 bags and 30 times with 10 bags in the cardboard box. Again, blood bags were tagged with a progressive EPC and numbered. The cardboard box filled with 30 blood bags was placed on the wooden table between the RFID reading antennas, and then the RFID reader was set to continuous reading mode for a 60 seconds timeout by means of the dedicated software. After the reading time has elapsed, the reading performance was computed; and the whole test was repeated 30 times. Then, we decreased the number of bags to 20 and 10, respectively, and repeated the whole procedure.
Blood bags inventory (mobile): the test aims at assessing the performance of a mobile handheld RFID reader during the process of blood bags inventory. One configuration was tested.
Test #3: a mobile RFID reader was used to perform simultaneous reading of EPC Class 1 Gen 2 tagged blood bags placed into a cardboard box on a table, within the reading zone of the device. Reference tag #1 was used; tags were applied on 30 blood bags inserted in a 37×25×21 cm sized container, placed on a wooden table; the RFID read was then activated on the mobile device while it was waved over the container and close to it, in order to increase the reading capability. Each blood bag was filled with approximately 500 ml of water, and equipped with a tag in the upper part, as reported in Fig. 2. The power of the reader was set for all the tests to 100%, corresponding to 1WERP; the reader was connected to an array of internal linear antennas switched and managed by the device itself.
The test was repeated 30 times using 30 blood bags in the container. The cardboard box filled with 30 blood bags was placed on the wooden table; then, the RFID reader was set at continuous reading mode at the maximum transmitting power for a 60 seconds timeout. The inventory of the bags was performed by waving the device close to the sidewalls and the upper face of the cardboard container until all the tags were inventoried or the timeout was done; the relative movement between the reading antenna and the tags improves the reading capability of the device. After the reading time has elapsed, or when all tags have been detected, the reading performance was computed; and the whole test was repeated 30 times.
Blood bags packing (fixed): a fixed USB desktop reader performs the reading of EPC Class 1 Gen 2 tagged blood bags while they are placed into a cardboard case placed on a wooden table. One configuration was tested.
Test #4: tags were applied on 30 blood bags, and the RFID read took place sliding the bag on the radiating antenna of the reader while they were inserted in a 37×25×21 cm sized container, placed close to the reader on the same table. The power of the reader, shown in Fig. 4, has been set for all the tests to 100%, corresponding to 1WERP; the reader was equipped with far field antenna facing upwards, which was exploited mostly for its emissions into the near field range because of the position of the tag on the bags and because of the water filling them. Each blood bag was filled with approximately 500 ml of water, and equipped with a tag #1 in the upper part, as reported in the previous test and in Fig. 2.
The test was repeated 30 times using 30 blood bags in the container, during each test repetition each blood bag is swiped individually on the reader surface in the reading field of the antenna, the bag was then placed into the cardboard box. The test was set up placing the empty bags on the table, respecting the reading zone of the reader so that the antenna could not detect them. The reader and the empty cardboard case were placed on the table as well; once again, the box was far enough from the antenna so that bags contained were not inventoried. During the execution of the test, the operator took every single bag from the pile, swept it on the reading surface of the reader and finally placed it into the container. The reader was configured for continuous reading mode and stopped by means of the dedicated software. After the 30 bags have been processed, the reading performance was computed; and the whole test was repeated 30 times.
During test execution on blood bags (fixed and mobile readers), unused tagged items were kept away from the reading field, so that such items were not included in the RFID reading of the groups surveyed. No other RFID tag was present in the test environment, and therefore there was no need to filter reading data. Data collected by the software was then imported in an Excel spreadsheet to be processed.
The performances were evaluated in terms of accuracy, defined as the percentage of tags successfully read per each test run during the 60 seconds timeout, and computed as the ratio between the number of tags read out of the total amount of tags expected. Also, we considered the time to read x% of tags, defined as the average reading time required to inventory x% of the tags effectively contained in the cardboard box - only test repetitions achieving x% accuracy were considered for the computation of average time, as a function of the number of expected tags.
Blood test tubes inventory: the test aims at assessing the performance of RFID tags during the process of blood tubes inventory; in particular, two different tags have been tested.
Test #5: tag #2 was used to identify tubes, while in Test #6 another tag, tag #3 was used; for both scenarios, a desktop USB reader was used to perform simultaneous reading of EPC Class 1 Gen 2 tagged blood tubes inserted into a table tube rack placed on the integrated antenna of the RFID reader. The power of the reader has been set for all the tests to 100%, corresponding to 1WERP; the reader was equipped with a far field antenna, which was exploited mostly for its emissions into the near field range because of the position of the tag on the tubes and because of the water filling the tubes.
The tags were placed on the side surface of the tubes, close to the spherical edge, so that they were in the bottom part of the tubes, close to the RFID reading antenna with the tubes placed vertically in the rack. Up to 40 tagged tubes were placed in the tube rack, as Fig. 4 shows.
The test was repeated 10 times using 8 groups of 5 test tubes each (Test #5.1 and Test #6.1), and 10 times with just 1 one group composed of 40 test tubes (Test #5.2 and Test #6.2). Tubes were tagged with a progressive EPC and numbered; for example, the first group was made of tubes numbered from 1 to 10. The empty tube rack was placed on the RFID reader antenna, and the RFID reader was set to continuous reading mode by means of the dedicated software. The tubes were then placed in the rack according to their aggregation in groups; the reading performance was computed every time that a new tube was placed on the rack. The procedure was carried out as follows. The five tubes belonging to group 1 were inserted, and then a 60 seconds timeout was given to the reader in order to inventory all the tags and the tubes in the rack. The reading performance was computed and stored. Then the five tubes belonging to group 2 were added on the rack, and again a 60 seconds timeout was given to the reader in order to inventory all the 10 tags, and reading performance was recorded. Then group 3 was added, and so on until 40 tagged tubes were placed on the rack above the reading antenna. The whole test was repeated 10 times.
During test execution, the groups of tubes waiting to be read were kept away from the reading field, so that such items were not included in the RFID reading of the groups surveyed. No other RFID tag was present in the test environment, so no data filtering process was required. Data collected by the software was then imported in an Excel spreadsheet for processing.
The performances were evaluated in terms of average time to read x% of tags (defined as the average reading time required to inventory x% of the readable tags in the RFID reading field - only test repetitions achieving x% accuracy are considered for the computation of average time) and accuracy (defined as the percentage of tags successfully read during each test run during the 60 seconds timeout) as a function of the number of expected tags (total tagged tubes contained in the tray).
Table 4 summarises the hardware configurations for each tested scenario.
4Results and discussion
The results of the experimental studies based on the protocols discussed above are presented in Tables 5–8 and Figs. 5–8. More precisely, the first two Tables 5–6 and Figs. 5–6 report the results obtained applying tags on blood bags, while Tables 7–8 and Figs. 7–8 report the results of RFID tags applied to blood tubes. Before analysing results, the meanings of each indicator will be explained below.
• Test number [#]: consecutive number of the test design conditions;
• Value: the value considered for the specific indicator, could be the minimum value (MIN), the average (AVG) or the maximum one (MAX);
• Expected tags [#]: number of expected tags to be read;
• Read tags [#]: number of tags read;
• Accuracy [% ]: ratio of tags read to the total number of tags expected during the reading time;
• Reading time - x% [s]: time needed to read x% of the tags (it is only possible if accuracy is equal to or greater than x%).
Figures 5 and 6 report the results obtained by identifying blood bags with RFID tags and different readers: in particular, Fig. 5 shows the performances of near field reading antennas, and Fig. 6 specifies the results of far field reading antennas, as described in the test protocol (see subsection 3. Materials and methods). In addition, Table 5 reports the results achievable with a handheld reader, and Table 6 shows results obtained with a desktop reader and far field antenna, but under different test conditions (passage of single blood bags instead of full boxes). These tests were performed with reference tag #1 (a high performing general purpose UHF tag) at a reading power of 100% (2WERP for the fixed reader, 1WERP for the mobile device and the desktop reader).
Every test design condition has been replicated 30 times, to achieve statistical validity of the results, as it will be explained below. The results of Fig. 5 and Fig. 6 were achieved in three different test design conditions, where the numbers of expected tags were decreased in function of the result themselves. In particular, the test conditions with near field antennas (Fig. 5) were decreased from 30 expected tags, to 25 and, eventually, 20. The results show that the average values of accuracy are less than 100% when the expected tags to be read are more than 20. In fact, 30 tagged blood bags in a box were read with an average accuracy of 98.8% (with a minimum value of 93.0%, i.e. 28 tags read out of 30), and 25 bags in a box achieved an average accuracy of 99.2% (with a minimum value of 96.0%). Finally, 20 blood bags in a box show an average accuracy of 100% and an average reading time of 100% of tags in 3.2 seconds. Finally, as expected, average reading times increase with the number of expected tags to 3.6 seconds (25 tags expected) and 7.6 seconds (30 tags expected).
The results of far field antennas (Fig. 6) were decreased from 30 expected tags, to 20 and eventually 10. This choice was made because the accuracy of reading 30 tags in a box never reached 100% with far field antennas (the average accuracy is only 78.4%, with a minimum and maximum accuracy values of 67.0% and 90.0%, respectively). Test conditions with 20 tags saw therefore an expected number of tagged blood bags equal to 20, and also in this case the average accuracy is less than 90% (87.7%), with a minimum accuracy value of 70.0% and a maximum value of 100.0% in short times (less than 2 seconds). Finally, when the expected number of tags was decreased to 10, the average accuracy reached 100% with an average reading time (100% of tags) of 5.0 seconds.
When the reading operation is performed with a handheld reader (Table 5), 30 blood bags in a box can be read with an average accuracy of 100%, to the detriment of reading time: the times to read 30 tags (100% accuracy) range from 9.0 to 33.1 seconds, with an average value of 19.3 seconds.
Finally, the results achieved with far field antennas were replicated with 30 blood bags and a table RFID USB reader (Table 6). As it was widely expected, this test condition gave an average accuracy of 100%, to the detriment of reading times. These results, however, can be attributed to the human factor and not to the RFID technology. In this case, the 100% accuracy is reached with an average reading time (100% of tags) of 99.8 s, with a maximum value of reading time equal to 123.4 s.
Also, Figs. 7, 8, Tables 7 and 8 report the results obtained by identifying test tubes of blood with different RFID tags and a desktop fixed reader with an embedded far field antenna. Figure 7 and Table 7 show the performances of tag #2: in test number 5.1 (Fig. 7), the results were obtained by adding 5 test tubes at a time, from a minimum number of 5 test tubes up to a maximum of 40 test tubes. The difference between Fig. 7 and Table 7 is that the former saw a gradual increase in the test tube number, while the latter was a one shot test with 40 tags to read on the go. Figure 8 and Table 8 report the same results, but with a different tag (tag #3). Together with the mentioned tags, the tests were performed with a reading power of 100% (1WERP), and a desktop USB reader.
The results of Fig. 7 show an average accuracy of 100% when reading 10 tags or less, that decreases to an average accuracy around 99% with 15–20 tags. The average accuracy achieved when more than 20 tags are on the test-tube rack is, however, more than 90%, with a reading time of 60 seconds. In addition, the average accuracy achievable in Table 7 (40 test tubes at a time) is 92.8%. Much better results can be achieved with tag #3. Figure 8 shows that up to 30 test tubes on the rack can be read with an average accuracy of 100.0%, and, when 35 or 40 test tubes are present on the rack, the average accuracy value decreases to 99.7% and 97.7%, respectively. A similar result is also reported in Table 8, where all 40 test tubes were read in a one shot test.
Finally, the statistical analysis of results is reported in Table 9. The table tests two different hypotheses on a Bernoulli population, i.e. accuracy, where read tags are considered as “acceptable” results and missing reads are considered “defects”. Missing reads, therefore, were considered as independent and Bernoulli-distributed, and two different one-tailed null hypotheses H0 were tested on the parameter p, that are (i) p≤1% and (ii) p≤0.01%. Both tests were performed at a significance level of 5%, and the results are reported in Table 9. The table shows that, whenever an accuracy of at least 99% is acceptable, near field antennas, handheld and desktop readers can be used with 30 blood bags, while only 10 blood bags at a time can be read with far field antennas. On the contrary, when a greater accuracy is requested from the process, than only handheld and desktop readers can be used with 30 blood bags at a time, to the detriment of reading times. Near field and far field antennas can achieve similar accuracies only with a maximum of 20 and 10 blood bags at a time, respectively.
Also, concerning blood tubes, tag #3 performs much better than tag #2. Acceptable values of test #6.1, in fact, reach up to 35 or 30 test tubes on a rack, with accuracy values greater than 99% and 99.99%, respectively. Test #5.1, instead, can only respect these values of accuracy with 20 and 10 blood tubes on the rack, respectively. Finally, it is important to note that the null hypothesis p≤1% was accepted in test #6.2, i.e. with 40 test tubes to be read at a time, while the same result was not achieved by test #6.1 (always with 40 test tubes). Test #5.2, as expected, rejected both the null hypothesis.
5Conclusions
In this paper, as a part of a global project called “Logistic Optimization in Healthcare”, a testing protocol to measure performances of RFID devices applied to blood supply chain is presented.
In the first part of the project, an analysis of current (AS-IS) transfusion processes, involving the Blood Transfusion Centre and three wards (Neurosurgery, General Surgery, Cooley Department) was carried out. Criticalities and process error sources were detected using FMECA method (Failure Mode Effects and Criticalities Analysis) and a subsequent analysis of some selected KPIs (Key Performance Indicators), which pointed out the Cooley Department as the most suitable for process reengineering. Since FMECA indicated that the most critical activities are related to hardcopy list management and correct recognition and identification of some logistical assets, such as patients, pilot test tubes and blood bags, a RFID-based TO-BE model has been designed. It was the result of a simulation of re-engineered logistics processes based on the FMECA outcomes. UHF technology was chosen for implementation due to lower tag costs and higher performance in terms of multiple readings and readingdistances.
Process reengineering target was clinical risk reduction: using FMECA and KPI analysis, the impact of RFID implementation, in terms of patient’s safety, was measured. The comparison of the two configurations analysed showed a decrease of the RPI of the reengineered process by about 57.5 % compared to the current one. The introduction of the new technology, however, will result in a slight increase in the number of activities (+4.3 %) of the entire transfusion process. Definitely, process reengineering led to a service quality improvement, in terms of patient safety and healthcare personnel safety, with several managerial benefit as the improvement of process tracking and process real time control, the improvement of inventory management, and the reduction of personnel’s insurance premium.
In order to obtain the expected results, it is crucial to guarantee the reliability of the hardware assigned to simultaneous reading of multiple tags. Hence, it is important to determine, with low uncertainty, which RFID-UHF systems are capable to guarantee affordable recognition of the logistic assets within the reading time expected. Specific RFID tests, simulating the logistics processes involved in the risk reduction, have been designed in order to assess the technical feasibility of such processes.
Regarding bulk inventory of blood bags with fixed reader and antennas, which is a typical scenario for shipping and receiving processes, when near field antennas and tag #1 are used the average accuracy values are less than 100% when the expected tags to be read are more than 20: in such scenario time to read all the bags is below 4 seconds. Performances are a bit lower when far field antennas are used; indeed, the average accuracy reached 100% when the expected number of tags was decreased to 10. When the reading operation is performed with a handheld reader, 30 blood bags in a box can be read with an average accuracy of 100% and a reading time ranging from 9.0 to 33.1 seconds. The results confirm the RFID UHF technology can be profitably adopted in the analysed processes; in fact, it is possible to define a TO-BE process where the maximum number of bags in a case is 20 or 30 according to the RFID technology used (fixed rather than mobile).
Concerning the single bag reading with far field antenna and the desktop RFID USB reader, test condition gave an average accuracy of 100%. This scenario simulates the packing process; in fact, blood bags are checked one-by-one during the insertion phase while the shipping container is filled with them.
Inventory test of blood tubes placed on the desk rack shows great performance when tag #3 is used. In fact, up to 35 test tubes gradually inserted in the rack can be read with an average accuracy close to 100%; when 40 test tubes are present on the rack the average accuracy value is close to 98%. Such performances enable the adoption of RFID technology for tube identification, inventory and monitoring the amount of time the tube waits before being stored in a refrigerated environment. It is possible to adjust the reengineered process considering no more than 35 tubes placed simultaneously on the rack. Conversely, 100% accuracy has never been achieved when placing the rack filled with 40 tubes on the reader.
References
1 | Anny Leema A. , & Hemalatha M. ((2013) ). Proposed prediction algorithms based on hybrid approach to deal with anomalies of RFID data in healthcare. Egyptian Informatics Journal, 14: , 135–145. |
2 | Bertolini M. , Bottani E. , Romagnoli G. , & Vignali G. ((2015) ). The impact of RFID technologies on inventory accuracy in the apparel retailing: Evidence from the field. International Journal of RF Technologies: Research and Application, 6: (4), 225–246. |
3 | Borelli G. , Orrú P.F. , & Zedda F. ((2012) ). Economic assessment for a RFID application in transfusion medicine. 14th International Conference on Harbor, Maritime & Multimodal Logistics Modelling and Simulation, Wien. |
4 | Borelli G. , Orrú P.F. , & Zedda F. ((2015) ). Performance analysis of a healthcare supply chain for RFID-enabled process reengineering. International Journal of Procurement Management, Special Issue on Smart and Sustainable Healthcare Supply Chain, 8: (1/2), 169–181. |
5 | Bottani E. , Montanari R. , & Romagnoli G. ((2016) ). Improving sales turnover in fashion retailing by means of an RFID-based replenishment policy. International Journal of RF Technologies: Research and Application, 7: (1), 65–86. |
6 | Bottani E. , & Rizzi A. ((2008) ). Economical assessment of the impact of RFID technology and EPC system on the Fast Moving Consumer Goods supply chain. International Journal of Production Economics, 112: (2), 548–569. |
7 | Chong A.Y.L. , & Chan F.T.S. ((2012) ). Structural equation modeling for multi-stage analysis on Radio Frequency Identification (RFID) diffusion in the health care industry. Expert Systems with Applications, 39: , 8645–8654. |
8 | Davis R. , Geiger B. , Gutierrez A. , Heaser J. , & Veeramani D. ((2009) ). Tracking blood products in blood centres using radio frequency identification: A comprehensive assessment. Vox Sanguinis, 97: , 50–60. |
9 | Ellison W.J. , Lamkaouchi K. , & Moreau J.M. ((1996) ). Water: A dielectric reference. Journal of Molecular Liquids, 68: , 171–279. |
10 | Esposito E. , Romagnoli G. , Sandri S. , & Villani L. ((2015) ). Deploying RFID in the fashion and apparel sector: An “in the field” analysis to understand where the technology is going to. Proceedings of the 20th Summer School “F. Turco” in Industrial Mechanical Plants, 16–18 September, Naples (Italy). |
11 | Harrop P. ((2006) ). Near field UHF vs. HF for item level tagging. IDTechEx Article, Available at: http://www.libsys.co.in/download/near_field_uhf_vs_hf_for_item_level_tagging.pdf (Accessed March 2nd 2015). |
12 | Istituto Superiore della Sanitá. Centro Nazionale Sangue. ((2008) ). Il Sistema Trasfusionale in Italia: Organizzazione nazionale, nuove politiche e prospettive http://old.centronazionalesangue.it/sites/default/files/Il%20Sistema%20Trasfusionale%20in%20Italia-%20organizzazione%20nazionale,%20nuove%20politiche%20e%20prospettive.pdf (accessed March 2nd 2015). |
13 | Kozma N. , Speletz H. , Reiter H. , Lanzer G. , & Wagner T. ((2011) ). Impact of 13.56-MHz radiofrequency identification systems on the quality of stored red blood cells. Transfusion, 51: , 2384–2390. |
14 | Lippi G. , & Plebani M. ((2011) ). Identification errors in the blood transfusion laboratory: A still relevant issue for patient safety. Transfusion and Apheresis Science, 44: , 231–233. |
15 | Ngai E.W.T. , Moon K.K.L. , Riggins F.J. , & Yi C.Y. ((2008) ). RFID research: An academic literature review (1995–2005) and future research directions. International Journal of Production Economics, 112: (2), 510–520. |
16 | Ohashi K. , Ota S. , Ohno-Machado L. , & Tanaka H. ((2008) ). Comparison of RFID Systems for Tracking Clinical Interventions at the Bedside. AMIA 2008 Symposium Proceedings, 529. |
17 | Otin R. ((2011) ). Numerical study of the thermal effects induced by a RFID antenna in vials of blood plasma. Progress in Electromagnetics Research Letters, 22: , 129–138. |
18 | Oztaysi B. , Baysan S. , & Dursun P. ((2007) ). A novel approach for economic-justification of RFID technology in courier sector: A real-life case study. Proceedings of the 1st Annual RFID Eurasia, 5-6 September, Istanbul (Turkey). |
19 | Polycarpou A.C. , Dimitriou A. , Bletsas A. , Polycarpou P.C. , Papaloizou L. , Gregoriou G. , & Sahalos J.N. ((2012) ). On the Design, Installation, and Evaluation of a Radio-Frequency Identification System for Healthcare Applications. IEEE Antennas and Propagation Magazine, 54: (4), 255–271. |
20 | Rizzi A. , Montanari R. , Bertolini M. , Bottani E. , & Volpi A. ((2011) ). Logistica e tecnologia RFID. Springer-Verlag, Milano (Italy). |
21 | Rizzi A. , Romagnoli G. , & Thiesse F. ((2016) ). A new framework for RFID use cases in fashion and apparel retailing. International Journal of RF Technologies: Research and Application, Paper in Press. |
22 | Talone P. , & Russo G. ((2006) ). RFID Tecnologie e Applicazioni, White Paper. |
23 | Van der Togt, R. , Bakker P.J.M. , & Jaspers M.W.M. ((2011) ). Framework for performance and data quality assessment of Radio Frequency IDentification (RFID) systems in health care settings. Journal of Biomedical Informatics, 44: , 372–383. |
24 | Wang Q. , Wang X.W. , Zhuo H.L. , Shao C.Y. , Wang J. , & Wang H.P. ((2013) ). Impact on storage quality of red blood cells and platelets by ultrahigh-frequency radiofrequency identification tags. Transfusion, 53: , 871. |
25 | Yagi J. , Arai E. , & Arai T. ((2005) ). Parts and packets unification radio frequency identification (RFID) application for construction. Automation in Construction, 14: (4), 477–490. |
Figures and Tables
Fig.1
Normal probability density (NPD) function curves comparison between AS-IS and TO-BE configuration.
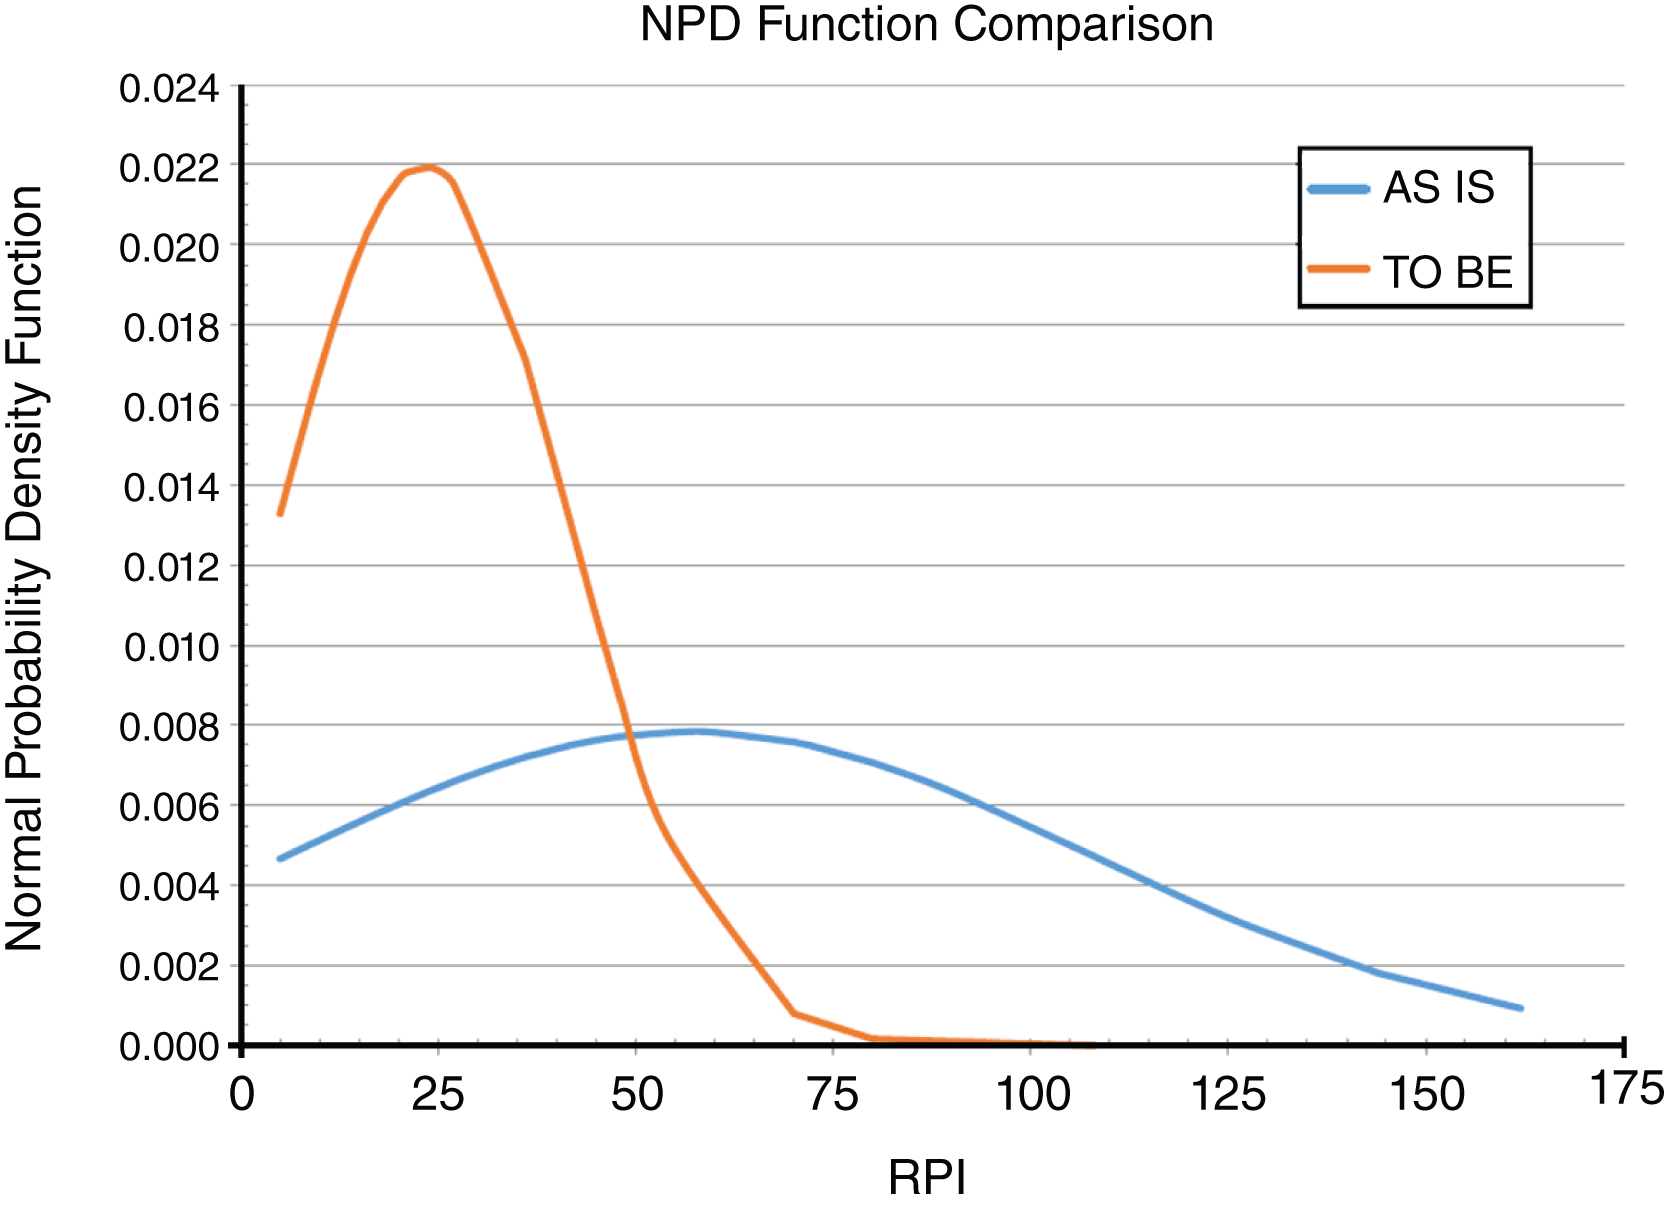
Fig.2
Tagged blood bag (a); cardboard container used for the tests (b); near field antennas setup (c).
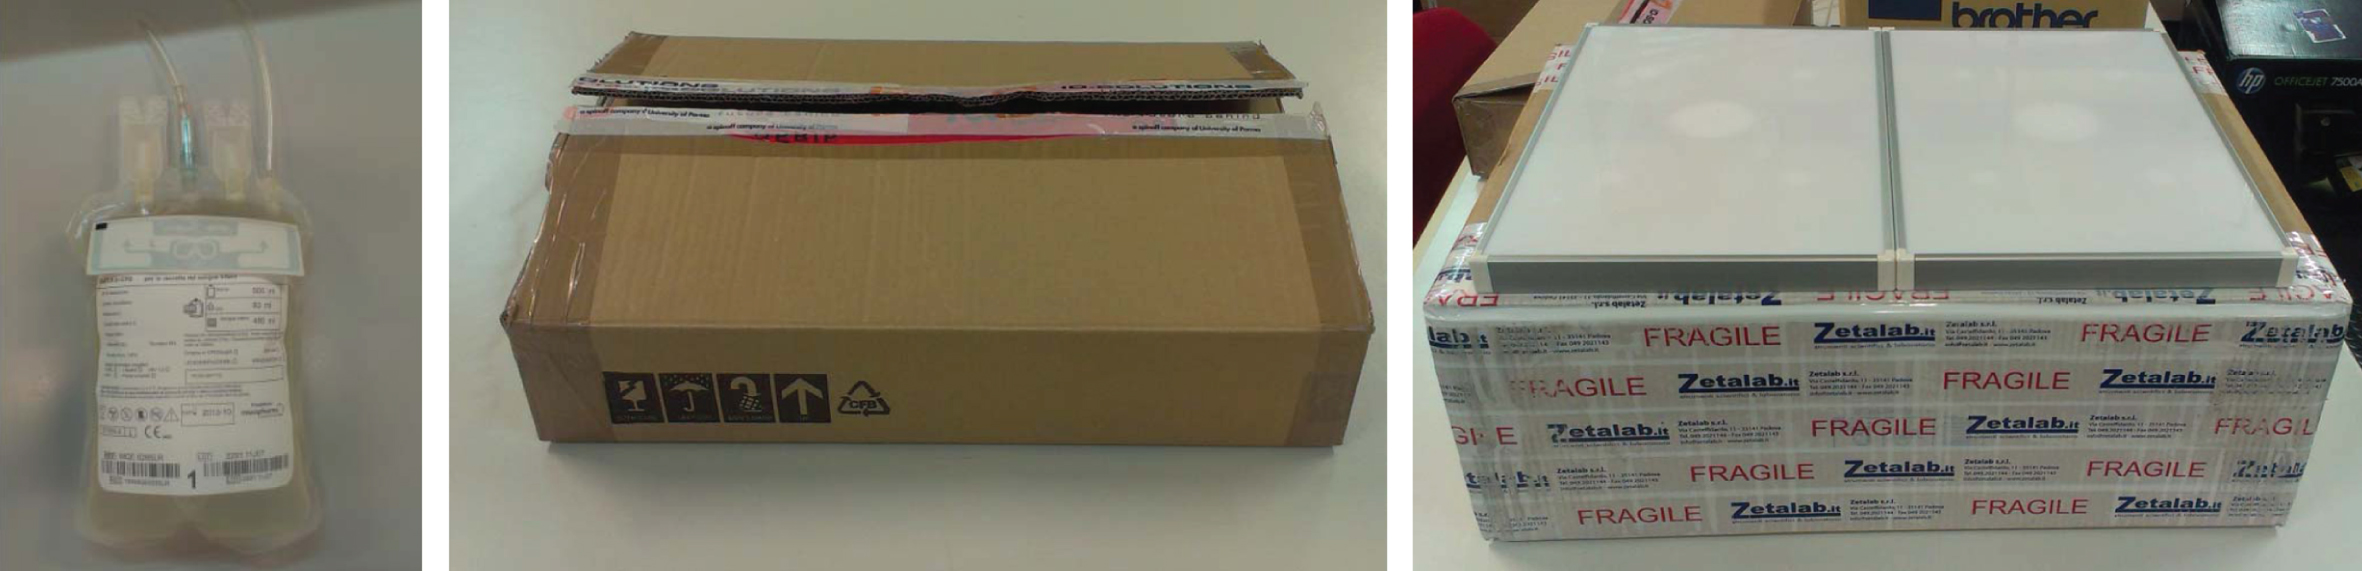
Fig.3
Tagged blood bags in the cardboard container used for the tests (a); container and far field antennas setup on the wooden table.
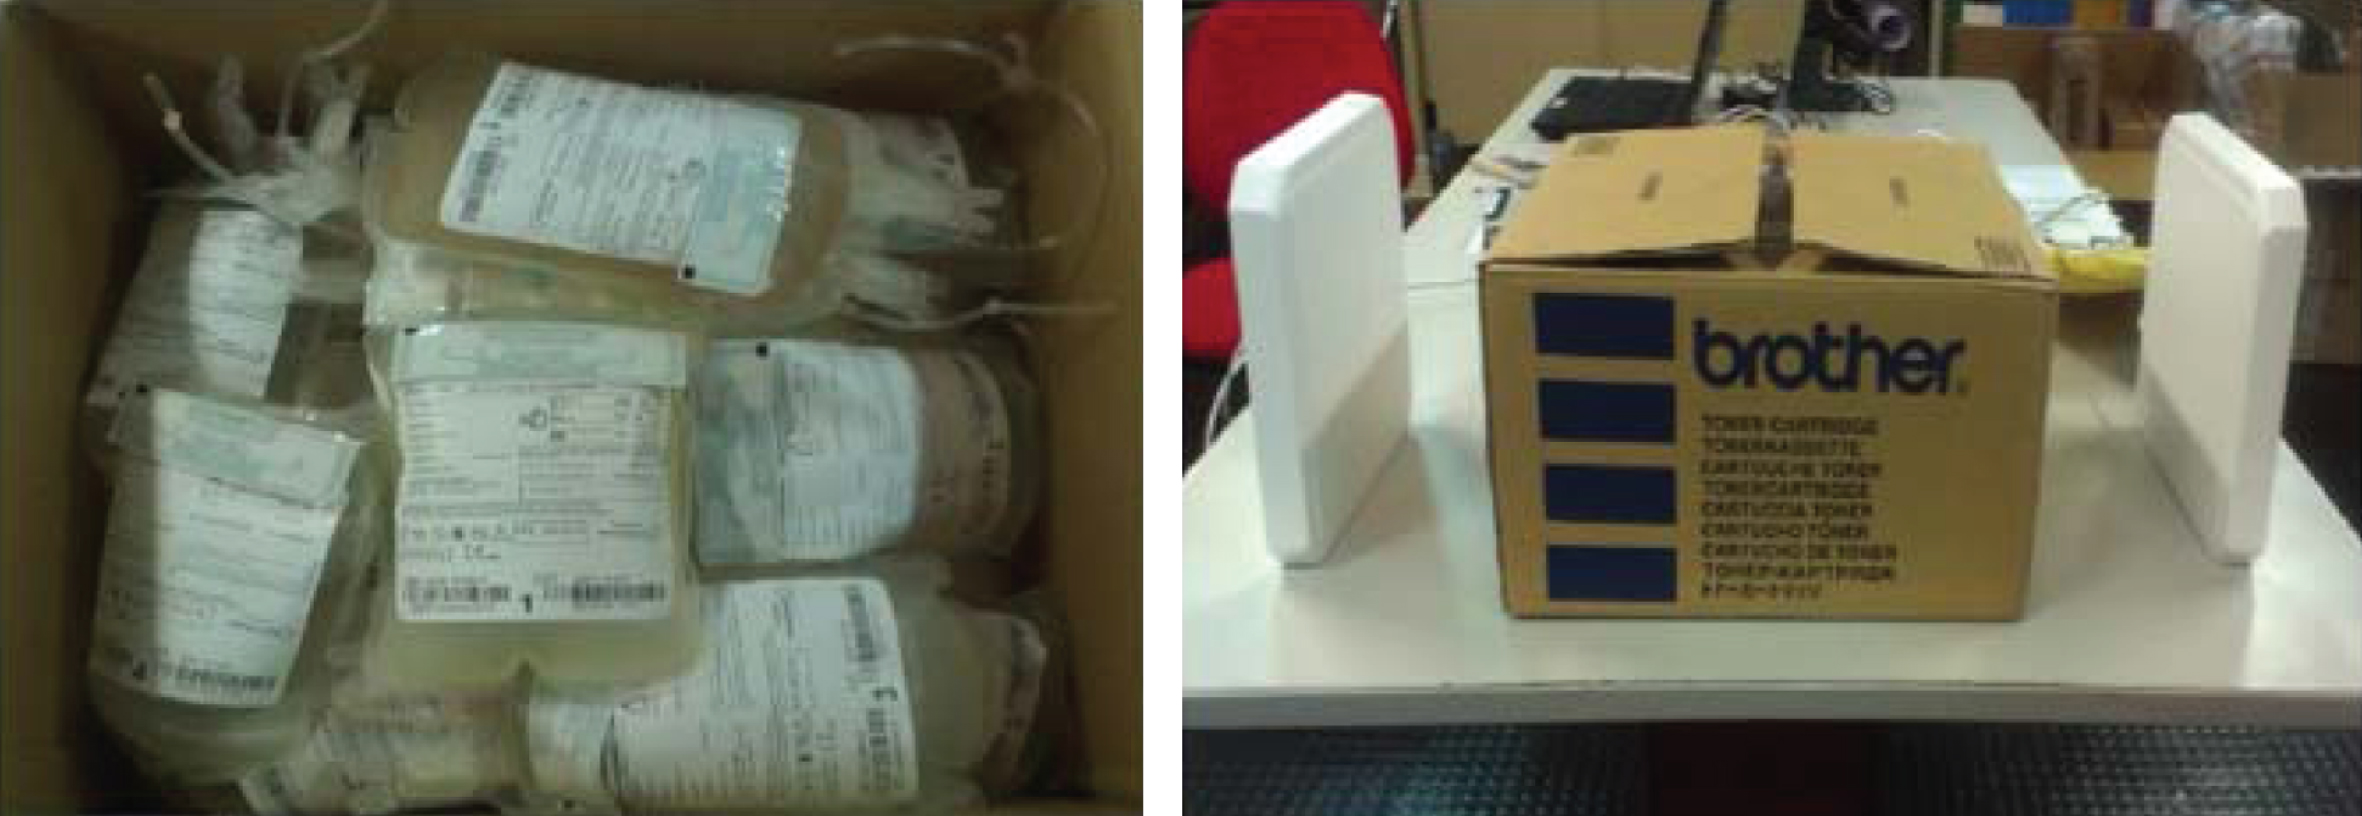
Fig.4
Blood tube tagged close to the curved edge (a); tube rack ready to be placed on the reading antenna (b); USB fixed desktop reader (c).
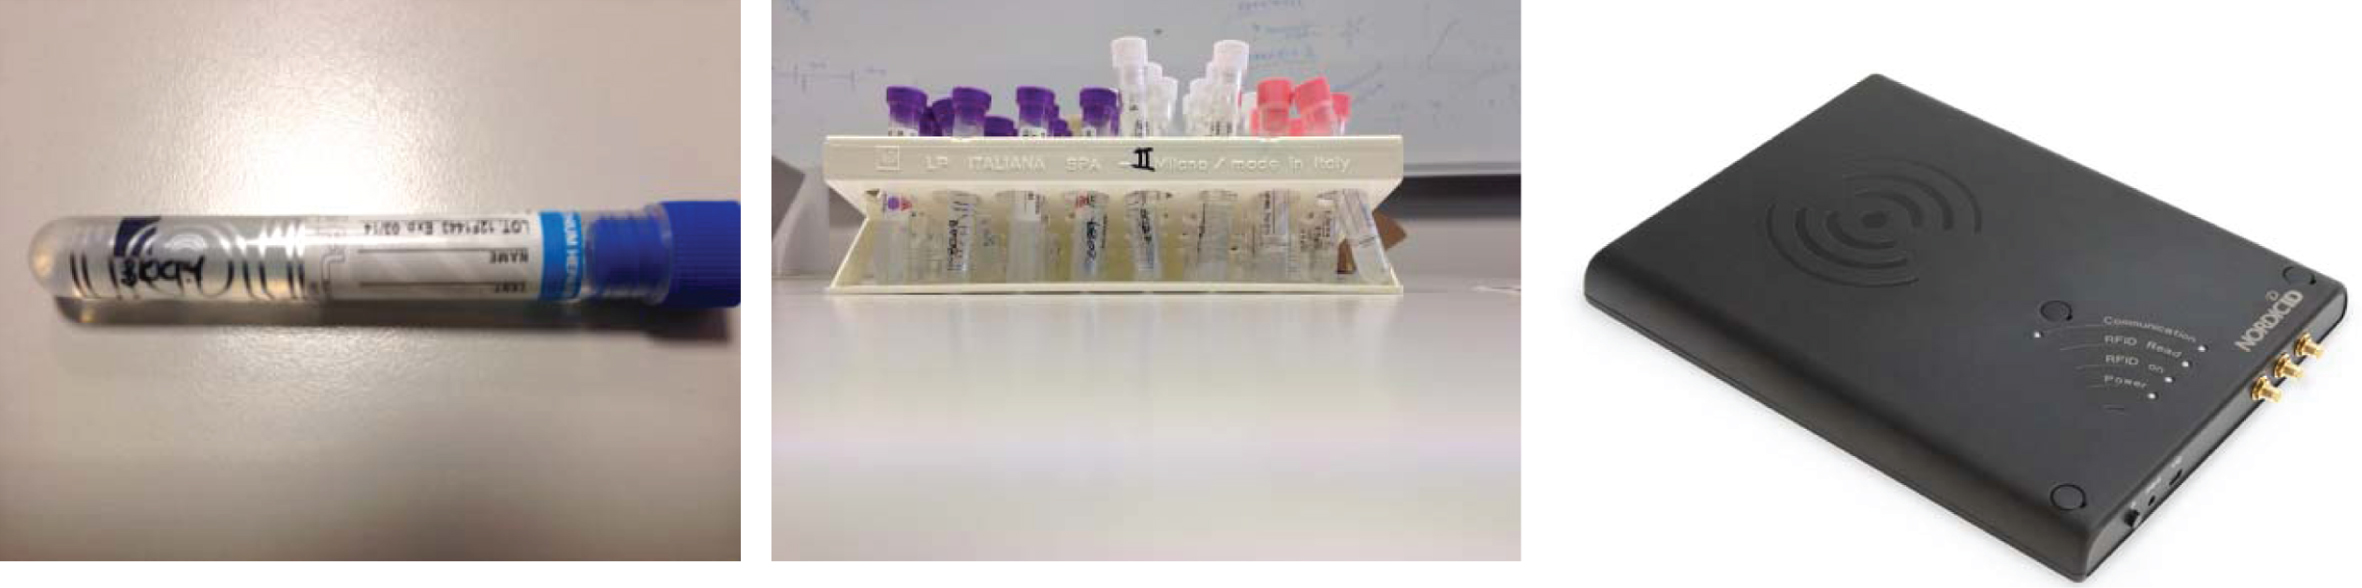
Fig.5
Results obtained for Test #1, i.e. blood bags inventory and near field antennas.
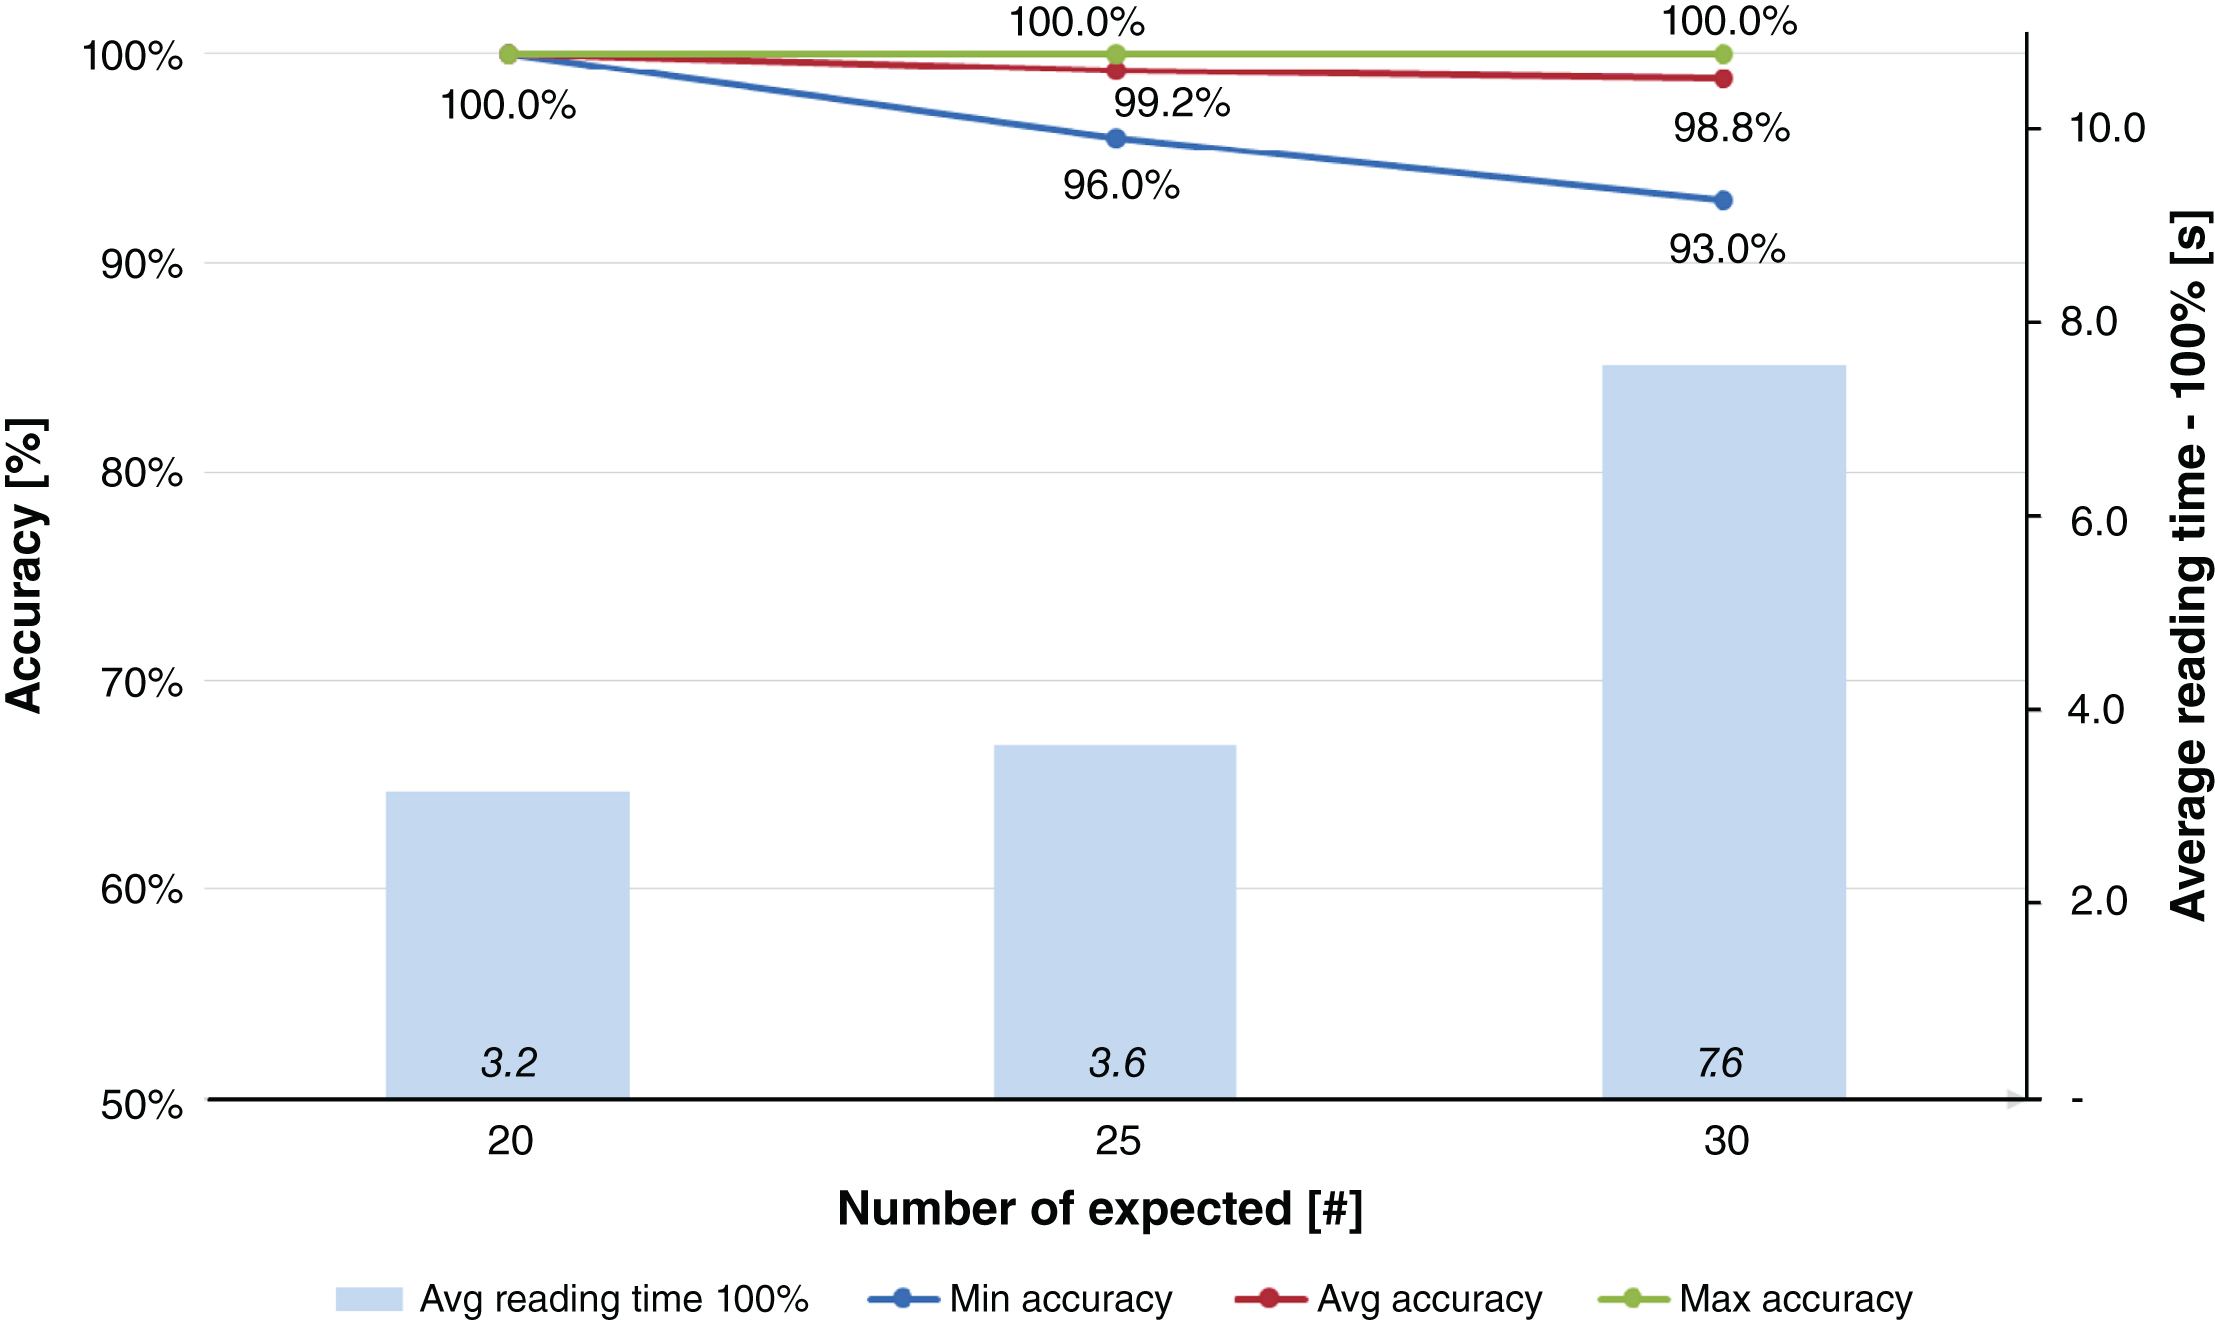
Fig.6
Results obtained for Test #2, i.e. blood bags inventory and far field antennas.
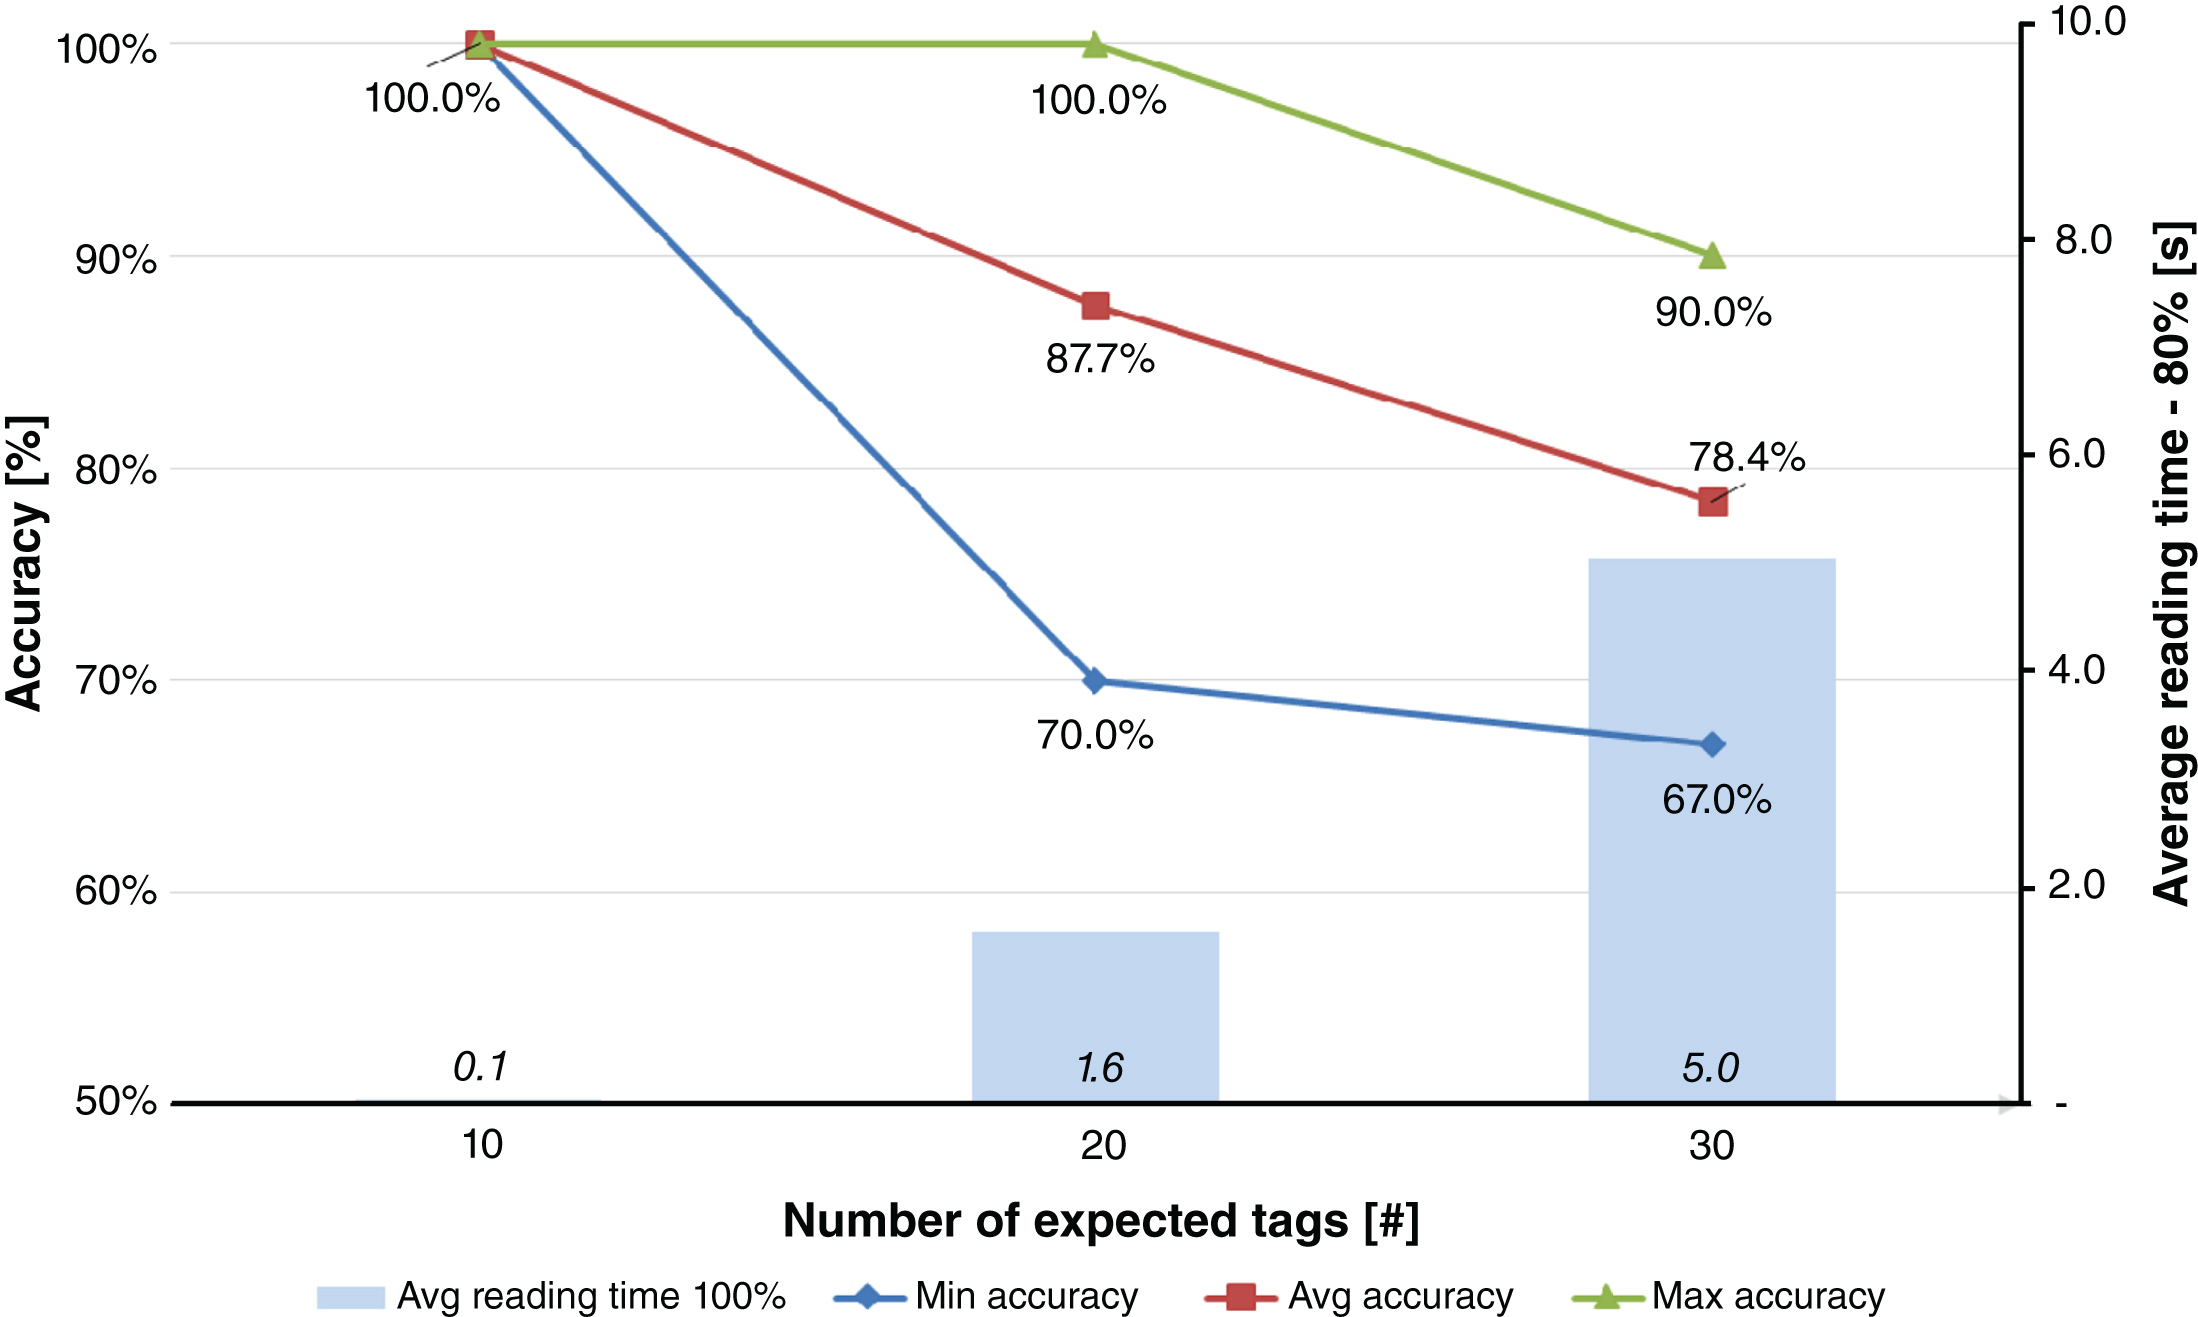
Fig.7
Results obtained for Test #5.1, i.e. blood tubes inventory (tag #2 - one group at a time).
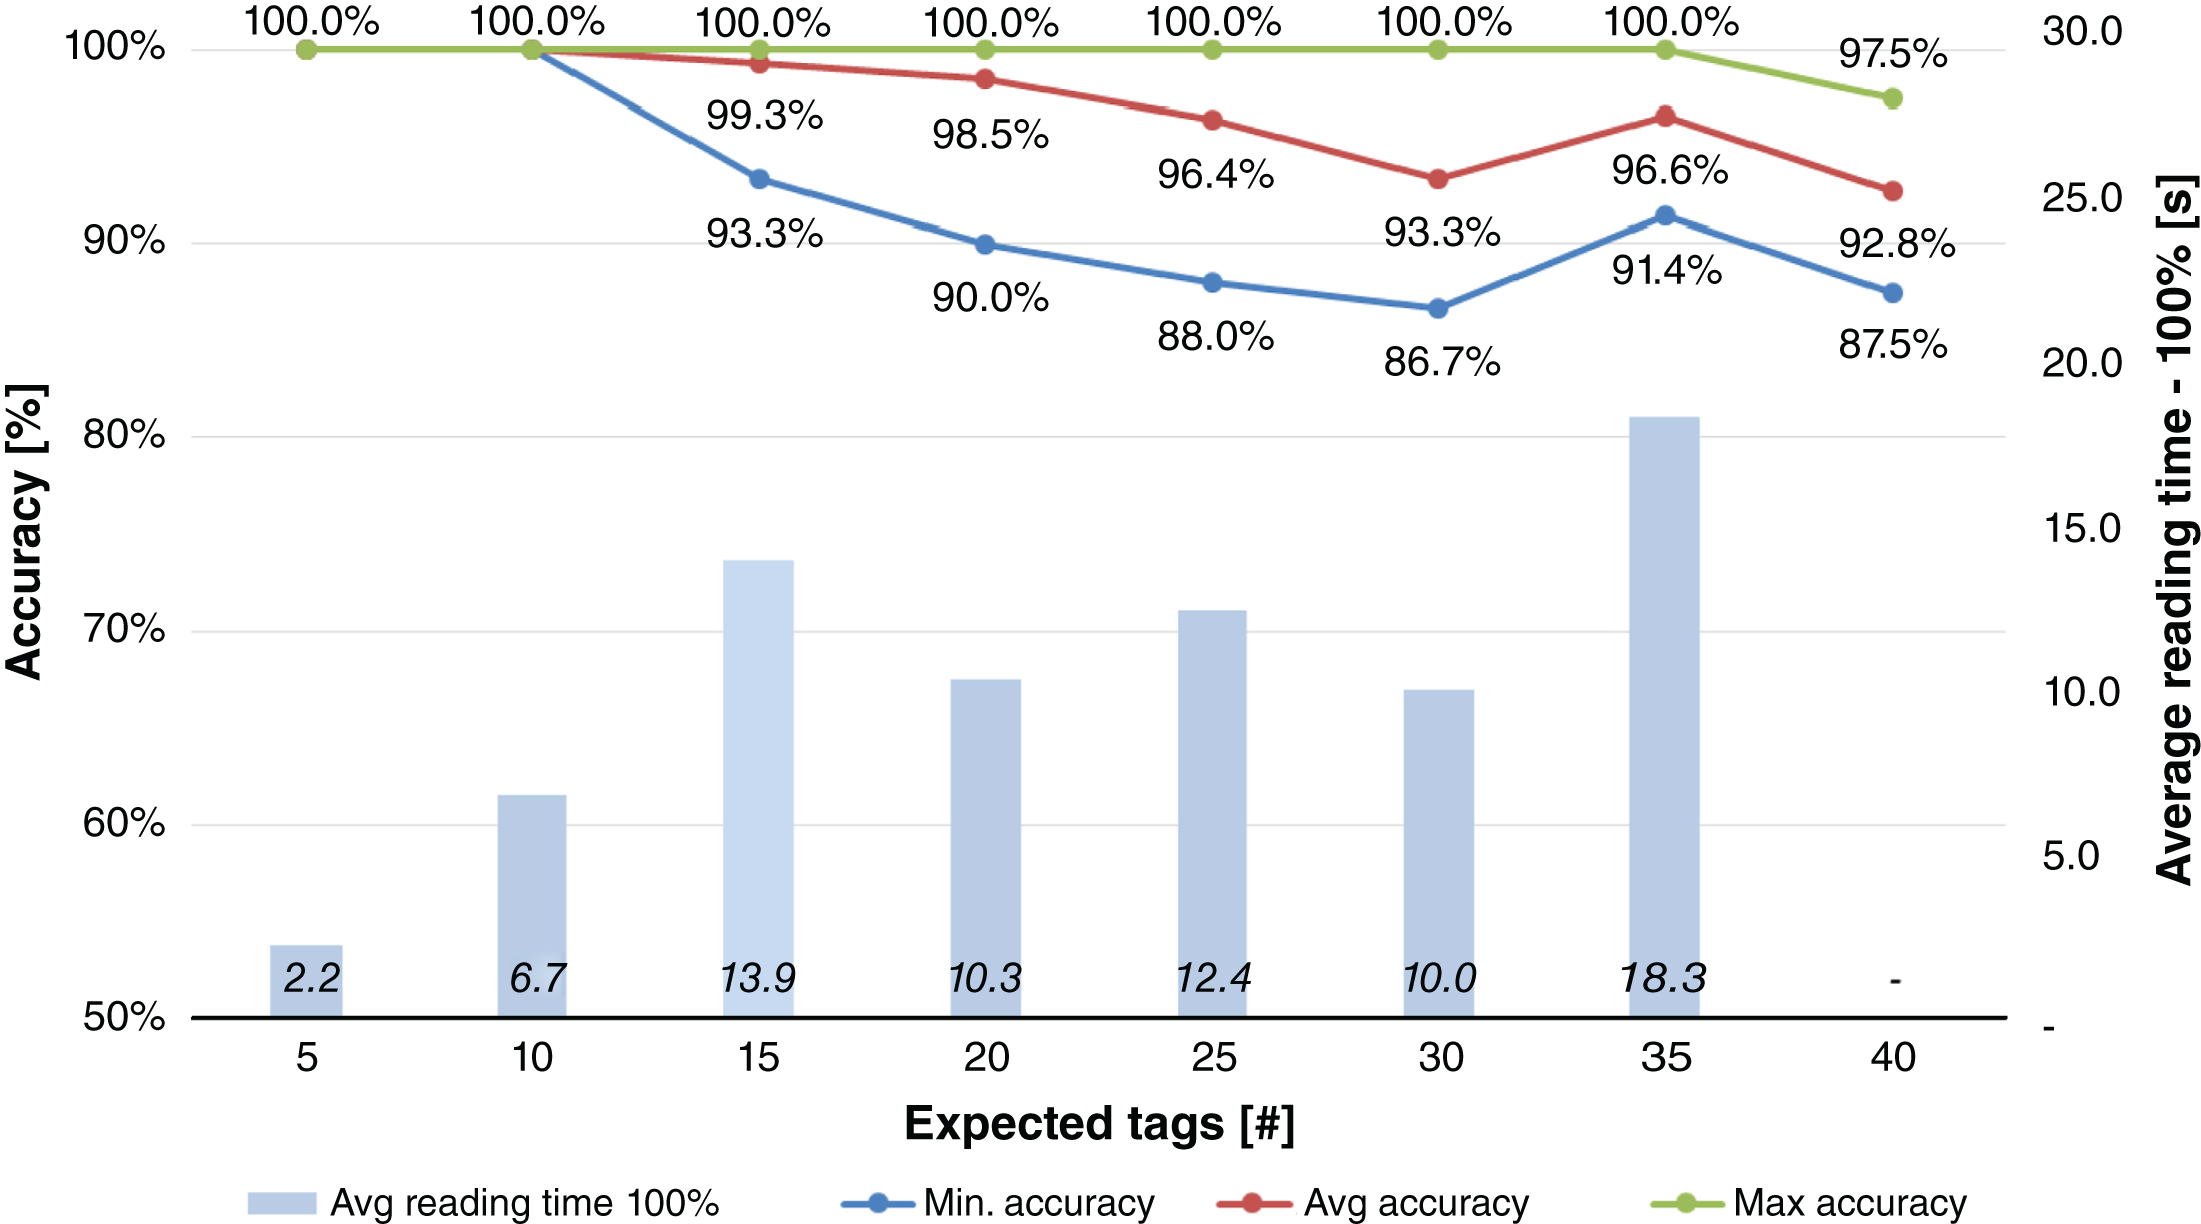
Fig.8
Results obtained for Test #6.1, i.e. blood tubes inventory (tag #3 - one group at a time).

Table 1
KPI results, AS-IS process
| Activity | Average weighted RPI | Peak RPI | Activity amount |
| Donation | 33.9 | 80 | 16 |
| BTC | 31.2 | 108 | 17 |
| Cooley | 39.7 | 144 | 45 |
| MCT request | 45.2 | 144 | 22 |
| MCT transfusion | 114.0 | 162 | 15 |
| Blood chain | 56.3 | 162 | 115 |
Table 2
KPI results, TO-BE process
| Activity | Average weighted RPI | Peak RPI | Activity amount |
| Donation | 33.9 | 80 | 16 |
| BTC | 31.2 | 108 | 17 |
| Cooley | 24.8 | 70 | 48 |
| MCT request | 16.9 | 36 | 23 |
| MCT transfusion | 17.6 | 20 | 16 |
| Blood chain | 23.9 | 108 | 120 |
Table 3
KPI comparison, AS-IS vs. TO-BE processes
| Activity | Average weighted RPI | Peak RPI | Activity amount |
| Donation | 0.0% | 0.0% | 0.0% |
| BTC | 0.0% | 0.0% | 0.0% |
| Cooley | –37.5% | –51.4% | +6.7% |
| MCT request | –62.6% | –75.0% | +4.5% |
| MCT transfusion | –84.6% | –87.7% | +6.7% |
| Blood chain | –57.5% | –33.3% | +4.3% |
Table 4
Tests scenarios
| Test ID | Reader | Antenna(s) | Power | Tag | Process | Items |
| Test #1 | Fixed Ethernet UHF reader | 2× near field | 2WERP | Tag #1 | Inventory (bulk reading) | Blood bags |
| Test #2 | Fixed Ethernet UHF reader | 2× far field (circular polarised) | 2WERP | Tag #1 | Inventory (bulk reading) | Blood bags |
| Test #3 | Mobile handheld UHF reader | 2× internal far field (linear polarised) | 1WERP | Tag #1 | Inventory (bulk reading) | Blood bags |
| Test #4 | Desktop USB UHF reader | 1× internal far field (circular polarised) | 1WERP | Tag #1 | Packing (individual item reading) | Blood bags |
| Test #5 | Desktop USB UHF reader | 1× internal far field (circular polarised) | 1WERP | Tag #2 | Inventory (bulk reading) | Blood tubes |
| Test #6 | Desktop USB UHF reader | 1× internal far field (circular polarised) | 1WERP | Tag #3 | Inventory (bulk reading) | Blood tubes |
Table 5
Results obtained for Test #3: blood bags inventory and mobile reader
| Test n. | Value | Expected tags [#] | Read tags [#] | Accuracy [% ] | Reading time - 100% [s] |
| 3 | MIN | 30 | 30 | 100.0% | 9.0 |
| AVG | 30 | 30 | 100.0% | 19.3 | |
| MAX | 30 | 30 | 100.0% | 33.1 |
Table 6
Results obtained for Test #4: blood bags packing
| Test n. | Value | Expected tags [#] | Read tags [#] | Accuracy [% ] | Reading time - 100% [s] |
| 4 | MIN | 30 | 30 | 100.0% | 84.6 |
| AVG | 30 | 30 | 100.0% | 99.8 | |
| MAX | 30 | 30 | 100.0% | 123.4 |
Table 7
Results obtained for Test #5.2: blood tubes inventory (tag #2 – all together)
| Test n. | Value | Exp. tags [#] | Read tags [#] | Accuracy [% ] | Reading time - 100% [s] |
| 5.2 | MIN | 40 | 35 | 87.5% | – |
| AVG | 40 | 37.1 | 92.8% | – | |
| MAX | 40 | 39 | 97.5% | – |
Table 8
Results obtained for Test #6.2: blood tubes inventory (tag #3 – all together)
| Test n. | Value | Exp. tags [#] | Read tags [#] | Accuracy [% ] | Reading time - 100% [s] |
| 6.2 | MIN | 40 | 38 | 95.0% | 5.3 |
| AVG | 40 | 39.5 | 98.8% | 21.0 | |
| MAX | 40 | 40 | 100.0% | 32.0 |
Table 9
Testing hypotheses on accuracies of RFID processes
| Test n. | Expected tags [#] | Average reading times [s] | H0: accuracy > = 99% | H0: accuracy > = 99.99% |
| 1 | 20 | 3.2 | Accepted | Accepted |
| 25 | 3.6 | Accepted | Rejected | |
| 30 | 7.6 | Accepted | Rejected | |
| 2 | 10 | 0.1 | Accepted | Accepted |
| 20 | – | Rejected | Rejected | |
| 30 | – | Rejected | Rejected | |
| 3 | 30 | 19.3 | Accepted | Accepted |
| 4 | 30 | 99.8 | Accepted | Accepted |
| 5.1 | 5 | 2.2 | Accepted | Accepted |
| 10 | 6.7 | Accepted | Accepted | |
| 15 | 13.9 | Accepted | Rejected | |
| 20 | 10.3 | Accepted | Rejected | |
| 25 | 12.4 | Rejected | Rejected | |
| 30 | 10.0 | Rejected | Rejected | |
| 35 | 18.3 | Rejected | Rejected | |
| 40 | – | Rejected | Rejected | |
| 5.2 | 40 | – | Rejected | Rejected |
| 6.1 | 5 | 1.1 | Accepted | Accepted |
| 10 | 3.0 | Accepted | Accepted | |
| 15 | 3.1 | Accepted | Accepted | |
| 20 | 2.4 | Accepted | Accepted | |
| 25 | 6.3 | Accepted | Accepted | |
| 30 | 6.3 | Accepted | Accepted | |
| 35 | 5.2 | Accepted | Rejected | |
| 40 | 25.7 | Rejected | Rejected | |
| 6.2 | 40 | 21.0 | Accepted | Rejected |

