
The Acute Effects of Aerobic Exercise on the Functional Connectivity of Human Brain Networks
Abstract
Although there is promising evidence that regular physical activity could counteract age-related decline in cognitive and brain function, the mechanisms for this neuroprotection remain unclear. The acute effects of exercise can provide insight into the mechanisms by which the brain adapts to habitual exercise by reflecting transient modulations of systems that would subsequently accumulate long-term adaptations through repeated training sessions. However, methodological limitations have hindered the mechanistic insight gained from previous studies examining acute exercise effects on the human brain. In the current study, we tested the plasticity of functional brain networks in response to a single stimulus of aerobic exercise using resting-state functional connectivity analyses. In a sample of healthy younger (N = 12; age = 23.2 years; 6 females) and older adults (N = 13; age = 66.3 years; 6 females), we found that 30 minutes of moderate-intensity aerobic cycling selectively increased synchrony among brain regions associated with affect and reward processing, learning and memory, and in regions important for attention and executive control. Importantly, these changes did not occur when the same participants completed a passive, motor-driven control condition. Our results suggest that these transient increases in synchrony serve as a possible avenue for systematically investigating the effects of various exercise parameters on specific brain systems, which may accelerate mechanistic discoveries about the benefits of exercise on brain and cognitive function.
INTRODUCTION
Increasing physical activity and exercise are non-pharmacological strategies for improving cognitive and brain health across the lifespan and across species, highlighting the brain’s inherent plasticity [1–3]. Despite the abundance of empirical research demonstrating that aerobic exercise training is associated with functional and structural changes throughout the brain, mechanistic knowledge about the direct effects of exercise remains unclear, especially in humans. Effects on the brain from long-term exercise training studies are potentially obscured by confounds that co-occur with long-term aerobic training (e.g., sleep or diet changes). Given that animal studies have shown effects within minutes to days of exercise in the same regions that show long-term changes [4–6], we tested whether functional magnetic resonance imaging (fMRI) could detect rapid changes following a single exercise session. We predicted that acute moderate-intensity exercise would selectively modulate the same brain systems that benefit from habitual moderate-intensity exercise training and its long-term physiological outcome, e.g., cardiorespiratory fitness (CRF).
Indeed, prior studies have demonstrated that cognitive performance is enhanced during the acute phase spanning 5 to 45 minutes following aerobic exercise in both younger and older adults [7–9]. Like long-term training, acute exercise effects are most pronounced in task conditions that demand greater attention and executive control [10–12]. The overlap of exercise effects at both acute and long-term timescales supports the hypothesis that acute aerobic exercise produces regional and systems-level changes in the brain that are transient but overlap where long-term training studies have observed stable adaptations.
Methodological limitations have hindered the extent to which previous studies could address this hypothesis. Recent efforts have utilized such techniques as measuring global cerebral blood flow with arterial spin labeling (ASL) [13], event-related brain potentials (ERP) [8, 14], and task-based activation studies using functional MRI or optical neuroimaging [15–17]. However, global blood flow measures and ERPs do not provide information about regionally specific changes throughout the brain, and task-based approaches are vulnerable to confounds such as practice effects and task design. Furthermore, these methods are unable to appreciate the full scope of thebrain’s network architecture, which is regarded as a fundamental characteristic of human cognition [18]. Given these constraints, our understanding remains limited regarding acute exercise effects on brain regions and their cooperation as functional networks that support cognitive functions.
Resting-state functional connectivity (FC) provides a valuable opportunity to test the plasticity of human brain networks in response to acute moderate-intensity exercise. This technique probes multiple brain networks simultaneously with good spatial resolution by measuring fluctuations of brain activity across dispersed regions during a period of wakeful rest without any explicit task [19]. Several large meta-analyses have shown that spatially distributed sets of brain regions that are modulated together during task states also reliably maintain synchrony during the resting state despite the absence of experimental demands [20–22]. The degree of FC during rest, which declines with age [23, 24], is thought to reflect the integrity of functional brain systems that are important for optimal cognitive performance [25]. Furthermore, several studies have demonstrated that acute changes in resting-state FC reflect experience-dependent plasticity following experimental manipulations of learning and memory [26–28]. Thus, resting-state FC is ideal for detecting acute exercise-induced plasticity of functional brain networks.
In the current study, our main objective was to test the hypothesis that acute exercise modulates the FC of resting-state brain networks. Our secondary objective was to determine whether the effects of acute exercise on FC differ between younger and older adults. Two lines of previous work guided our key predictions about acute exercise effects on functional brain networks. First, experimental studies in both animal and human populations support that exercise transiently increases the release of catecholamines in the brain (e.g., norepinephrine and dopamine) [29–31], providing a basis for enhanced neurotransmission and cognitive performance in conditions that demand greater attention and executive control. Based on this catecholamines hypothesis, we predicted that acute exercise would preferentially target noradrenergic and dopaminergic brain systems.
The second line of evidence stems from research that has focused on exercise effects in the hippocampus, a region in the brain that is vulnerable to aging-related decline but responsive to exercise-induced plasticity throughout the lifespan [32]. Although the precise mechanisms remain unclear, many animal and a growing number of human studies have established that the hippocampus is particularly sensitive to local changes following both repeated and single bouts of physical exercise [33, 34]. At the systems level, the hippocampus is functionally connected to the entorhinal cortex and a broadly distributed cortical network known as the Default Mode Network (DMN). In addition to the hippocampus, the DMN is anchored by functional connections among the retrosplenial and posterior cingulate cortices, and the ventral and anterior medial prefrontal cortex [35, 36]. Indeed, we have shown that long-term exercise and greater CRF are both related to greater hippocampal-cortical connectivity in healthy older adults [37, 38]. Additionally, Vivar et al. reported that, in rodents, running-induced neurogenesis in the dentate gyrus, a region within the hippocampus, is related to structural and functional connectivity changes in hippocampal-cortical circuitry which is known to deteriorate with aging [39]. We therefore predicted that a single exercise bout would produce transient changes to hippocampal-cortical connectivity.
We tested these predictions by measuring acute FC changes induced by 30 minutes of active exercise, relative to a passive exercise control performed by the same participants, and assessing the interaction with age group. During the active exercise, participants cycled at 65% of their maximum heart rate (i.e., moderate-intensity), and during the passive exercise, participants’ legs were moved by motorized pedals on the same bike andat the same pedal rate as in the active condition. Unlike previous studies of acute exercise effects on brain and cognition, the passive exercise condition accounts for confounds that arise when comparing acute aerobic exercise to seated rest conditions. Our within-subjects repeated measures design enabled us to assess changes in FC of brain networks that are directly related to active aerobic exercise after controlling for leg movement. Given the evidence outlined above, we focused our analyses on specific functional brain networks that are a) sensitive to acute changes in dopamine and norepinephrine (affect and reward processing, attention and executive control) and b) functionally connected to the hippocampus (DMN and hippocampal-cortical networks). With respect to age interactions, we anticipated that older adults would show greater increase in age-sensitive systems (hippocampal and executive control networks) due to a greater potential for adaptations with further exercise training [38].
MATERIALS AND METHODS
Participants
Twelve healthy younger adults (6 females; mean age = 23.2±2.3 years) and 13 healthy older adults (6 females; mean age = 66.3±3.6 years) participated after providing written consent to the study approved by the University of Iowa Institutional Review Board. All participants were right handed and reported no history of neurological or psychiatric disorders, cardiovascular disease, or diabetes. Additionally, they indicated no medications that would influence central nervous or cardiovascular systems, exhibited no contraindications to aerobic exercise participation or to the MRI environment, and scored ≥ 28 on the Mini-Mental Status Examination. Participant demographics and basic health variables are summarized in Table 1.
Fitness assessment
Before their experimental sessions, all participants performed a graded maximal exercise test on a cycling ergometer (ergoselect 200; ergoline GmbH, Bitz, Germany) in order to determine their maximal oxygen uptake (VO2max in mL/kg/min) and maximum heart rate (HRmax), which we then used for calibrating their acute exercise sessions. We measured heart rate and rhythm using a 12-lead electrocardiogram (ECG) while expiredair was continuously sampled on a breath-to-breath basis and averaged for 30-second intervals. The VO2max test began with a 5-minute warm-up period at a minimal workload and then incrementally increased. The rate at which the work load increased was determined by a predicted maximum work load that was estimated based on Wasserman’s equation [40]. Briefly, the predicted maximum work load was divided by 10 in order to determine a work rate (Watts/min) that would be suitable for the participant to complete the max test at a target test time of 10 minutes. The work rate was adjusted by±5 Watts/min depending on the participant’s physical activity history. The test ended when the participant reached volitional fatigue and when at least two of the following criteria were met: (1) a plateau in VO2 after increasing workload; (2) a respiratory exchange ratio >1.10, and (3) a HRmax within 10 bpm of their age-predicted maximum. Older participants were supervised by a cardiologist who monitored the ECG readings during the exercise test and approved their eligibility for the study’s experimental phase. We excluded individuals who exhibited evidence of cardiovascular disease at baseline or cardiac abnormalities during the exercise test. One older participant was found to have an abnormal ECG and was not included in the present sample.
Procedures
The study consisted of 3 pre-experimental sessions followed by 2 within-subjects experimental sessions that were separated by at least 1 week. During the pre-experimental sessions, participants completed a mock MRI session, a maximal aerobic fitness assessment, and an orientation session that familiarized participants with the experimental materials and procedures. During the orientation session, we informed participants that they would engage in two 30-minute conditions of exercise on separate testing days. Importantly, we minimized demand characteristics by refraining from using terms such as “active” or “passive.” We also conducted an exercise calibration protocol in order to match pedal rate between the two exercise conditions during experimental testing.
An overview of the experimental sessions is provided in Fig. 1. For each experimental session, participants began by first sitting comfortably in a waiting room for 30 minutes in order to establish a common baseline between the two visits. Following the waiting period, participants received their pre-exercise scans. Participants then completed a 30-minute exercise session on a motor-driven stationary bicycle (Theracycle 200; Franklin, MA) located directly outside of the MRI scanner. The active exercise condition required participants to elevate their HR to 65% of their HRmax by pedaling against the machine’s resistance, and the passive condition required their legs to be moved by the motorized pedals with a minimal effect on HR. We matched the pedal rate between both exercise conditions as determined during each participant’s orientation session, and we recorded HR continuously. Additionally, participants provided several ratings of their subjective experience: perceived exertion (RPE [41]: 7 = no exertion, 20 = maximal exertion), perceived feelings of arousal(Felt Arousal Scale [42]; FAS: 1 = low arousal, 5 = high arousal), and perceived enjoyment (Feeling Scale [43]; FS: –5 = very bad, +5 = very good). These subjective reports were collected at 3-minute intervals throughout the exercise, and they supplemented HR measures as exercise manipulation checks. Following exercise cessation, a 5-min cool-down was administered before participants were immediately escorted back to the scanner for post-exercise scanning. After a minimum of 1 week following their first experimental session, participants returned to the laboratory to complete their second exercise condition. The order of exercise conditions was counterbalanced across participants.
Imaging data acquisition
All neuroimaging scans were acquired using a Siemens (Erlangen, Germany) 3T TIM Trio scanner with a 12-channel head coil. For purposes of image registration, we acquired high-resolution (1 mm3) anatomical scans before each participant’s first exercise session as T1-weighted brain images collected in the coronal plane using a 3D MPRAGE (Magnetization Prepared Rapid Gradient-Echo) sequence with the following parameters: inversion time = 900 ms, echo time (TE) = 3 ms, repetition time (TR) = 2530 ms, flip angle = 10°, matrix = 256×256×240 mm, field of view (FOV) = 256×256×240 mm. Resting-state fMRI(rs-fMRI) data were collected using a T2*-weighted gradient-echo, echo-planar imaging (EPI) protocol sensitive to the blood oxygenation level-dependent (BOLD) contrast: TR = 2000 ms, TE = 30 ms, FOV = 220×220×124 mm, image matrix = 64×64, flip angle = 80°, 3.4×3.4×4.0 mm voxels, ascending acquisition of 31 contiguous axial slices of 4 mm thickness. These images were obtained parallel to the anterior-posterior commissure plane with no inter-slice gap. For all rs-fMRI scans, we instructed participants to lay still with their eyes closed and to stay awake without thinking about anything in particular for 6 minutes. In order to account for acute exercise-related changes in HR, we measured participants’ HRs during each rs-fMRI scan using BIOPAC MP150 data acquisition hardware and software.
Data pre-processing
All image processing and analyses were carried out with an in-house script library containing tools from FSL 5.0.4 (Functional Magnetic Resonance Imaging of the Brain’s Software Library, http://www.fmrib.ox.ac.uk/fsl), AFNI (http://afni.nimh.nih.gov/afni), FreeSurfer (http://surfer.nmr.mgh.harvard.edu), and MATLAB (The MathWorks, Natick, MA, USA). Please refer to Fig. 2 for a schematic of the data analysis. Voxels containing non-brain tissue were stripped from the T1 structural images using FSL’s BET (Brain Extraction Technique) algorithm [44]. We then manually inspected each skull-stripped anatomical image and corrected any errors that resulted from the BET algorithm. For the rs-fMRI EPI data, we corrected for head motion using a 6 degree-of-freedom rigid-body transformation in AFNI’s 3dvolreg function, which produced six parameters of head motion (root-mean-squares of translational and rotational movement: X, Y, Z, pitch, roll, and yaw directions) for subsequent nuisance regression. The rs-fMRI data were further processed by removing non-brain tissue using BET and spatially smoothing using a 6 mm three-dimensional Gaussian kernel of full-width at half-maximum. Then, all functional EPI images were registered to the MNI152 template through a multi-stage procedure using the high-resolution T1 image as an intermediate step: First, the participant’s T1 image was transformed to standard MNI space using FNIRT nonlinear registration with the default 10 mm warp resolution [45]. Then, using a boundary-based affine registration (BBR) algorithm [46], all functional images for each participant were registered their respective T1 image. The two resulting transform matrices (T1 to MNI and EPI toT1) were concatenated and inverted to create a single transform for aligning all functional images in native space to standard MNI space (EPI to MNI), and these were applied in the analyses described below.
We performed several additional pre-processing techniques to the EPI data that are specific to FC analyses. First, the pre-processed time series data were temporally filtered with AFNI’s 3dBandpass, ensuring that fMRI data fell within the frequency band of 0.008 < f < 0.08 Hz, which reduces unwanted noise such as high frequency physiological signals (e.g., cardiac pulse) and low frequency scanner drift. The frequency band was chosen to best represent the spontaneous, low frequency fluctuation of the BOLD fMRI signal in the brain [47]. Following temporal filtering, the mean time series was then extracted from three sources of non-neuronal variance: 1) white matter signal from the retrolenticular portion of the left internal capsule, 2) cerebrospinal fluid (CSF) signal from a region in the lateral ventricle, and 3) the global signal derived from a whole-brain mask. The six head motion parameters obtained from the motion correction were also temporally filtered to match the frequency band ofthe fMRI data [48]. Altogether, the ninebandpassed nuisance regressors (white matter, CSF, global, and motion parameters) were then entered into a multiple regression (using FSL’s FEAT tool) as independent variables predicting the observed fMRI data. The residual time series data were then normalized using z standardization and re-centered to a mean of 1000. Finally, we removed motion-contaminated volumes in which frame-wise displacements above 0.5 mm that coincided with spikes in BOLD signal [49]. Overall, this approach affected only 3 scans, from which an average of 5.3 volumes (3% of total scan duration) were removed.
Analysis of acute exercise effects on FC
We first derived a set of study-specific regions of interest (ROIs) from a group-level independent components analysis (gICA). This data-driven, multivariate analysis decomposed the data from every participant’s first pre-exercise rs-fMRI scan into fourteen independent spatiotemporal components (ICs) common across the study sample. The number of independent components (i.e., model dimensionality) was automatically estimated as implemented in FSL’s MELODIC v 3.13 [50]. Guided by our predictions about acute exercise effects on brain function, we identified six ICs that are established in the literature as networks that service higher-level cognition: 1) affect and reward network (ARN), 2) default-mode network (DMN), 3) dorsal attention network (DAN), 4) left and 5) right executive control networks (L ECN, R ECN), and 6) salience network (SAL) (Fig. 3). Figure S1 shows the spatial configuration and overlap of these cognitive networksas compared to reference resting-state networks derived from 1,000 participants [51]. To test the specificity of acute exercise effects, we also identified two ICs as networks limited to lower-level sensory and motor processing: an auditory-visual network (AUD-VIS) and a somatomotor network (MOT). The remaining six ICs, which were excluded from our analyses, were deemed as nuisance artifacts or components not directly relevant to our hypotheses (Figure S2). Then, guided by theoretical grounds, we selected a core set of ROIs that most strongly anchored each network and constructed 14-mm diameter spheres centered on each ROI’speak coordinates in standard MNI (2 mm3) space (Fig. 3, Table 2). Specifically, we parcellated each IC into distinct functional-anatomical clusters by performing a stepwise thresholding procedure beginning at Z > 2.33. Briefly, for each IC, we increased the threshold until noncontiguous clusters emergedthat reflected distinct regions known to comprise each network across studies in the existing literature. For example, for the left and right ECNs, this procedure fractionated the large prefrontal swath into the dorsolateral prefrontal cortex, inferior frontal gyrus, and ventrolateral prefrontal cortex. Then, from these clusters, we located the peak statistical voxel in regions known to anchor each network [22, 35, 37, 38]. In addition to the gICA-derived ROIs, we selected additional literature-based ROIs to test our predictions about acute exercise effects on hippocampal and catecholaminergic connectivity: anteromedial hippocampus (R: x = 20, y = –16, z = –20; L: x = –22, y = –16, z = –18) [36] and amygdala (R: x = 24, y = –2, z = –20 L: x = –24, y = –2, z = –20) [52, 53]. We included the bilateral amygdala mask as part of the ARN because of its theoretical importance in affect and reward processing, and the bilateral hippocampal mask served as its own seed for anchoring a hippocampal-cortical network (HCN). Then, we merged the anchoring ROIs for each network into a single mask (i.e., “multi-seed”) for subsequent seed-based FC analyses. For example, the DMN core is comprised of four spheres located bilaterally at the posterior cingulate cortex and the medial prefrontal cortex (see Fig. 3, Table 2) [54]. We performed this procedure in order to reduce noise from any one seed and to limit multiple comparisons across multiple seeds within each network in the voxelwise analyses. Finally, prior to calculating FC for each rs-fMRI scan, we applied the corresponding transform matrix to convert all ROIs from MNI to the scan’s native EPI space.
Whole-brain FC analysis
Our primary aim was to characterize changes in FC between each network and voxels throughout the entire brain. To this end, we conducted seed-based voxelwise analyses with the six network core masks, the hippocampal ROI, and the two sensory-motor network cores serving as initiating seeds. We then computed Pearson’s correlations between each seed’s mean time series and the time series at each voxel throughout the brain in native EPI space, resulting in a correlation map in which each voxel was designated a Pearson’s correlation coefficient representing the strength of correlation with the initiating seed. These whole-brain correlation maps were converted into z-score maps using a Fisher’s r-to-z transformation, resulting in subject-level Fisher’s z maps displaying voxels throughout the brain that are correlated with each ROI’s resting BOLD signal. Finally, in preparation for group-level analyses, we registered all subject-level voxelwise maps from native EPI space to the MNI152 template (2 mm3 resolution) by applying the previously computed EPI-to-MNI transform matrices.
Prior to assessing acute exercise-related FC changes at the group level, we created within-subject difference maps (post minus pre) for both exercise conditions. Then, the subject-specific difference maps (Activediff and Passivediff) were submitted as a dependent variable in a mixed-effects ANCOVA (within-subjects factors: condition, between-subjects factor: age group). For both exercise conditions, we modeled pre to post changes in HR (HRdiff) during the rs-fMRI scans as a covariate of no interest. In the resulting group-level statistical maps, we accounted for multiple comparisons with joint height and cluster-based thresholding (z > 1.96 height; cluster significance of p < 0.05, corrected). This analysis produced thresholded Z-statistic maps representing FC changes that were significantly greater following active exercise than passive exercise for each network of interest, including the hippocampal seed. The same approach was used for determining where there was greater change for passive compared to active exercise.
RESULTS
Participant demographics and health variables
Table 1 summarizes basic demographic and health information for younger and older adults. In addition to age, the younger and older adults differed significantly on resting blood pressure and aerobic fitness scores (HRmax, Wattmax, and VO2max) (all p’s < 0.05), which is consistent with normal age-related differences in physiological function. Although VO2max was significantly different between age groups, the fitness of our participants were considered to be “fair” with no significant differences in normed VO2max percentiles based on sex and age [55]. Finally, the age groups did not differ on body mass index, sex composition, self-reported physical activity levels, resting HR, or self-reported years of education (all p’s >0.05).
Acute exercise manipulation
During the active exercise, the younger participants increased their heart rates (HR) to 64.1±0.5% of their HRmax (118.14±0.93 bpm), and the older participants increased their heart rates to 64.1±0.7% of their HRmax (101.85±3.3 bpm). These HRs correspond to moderate-intensity aerobic exercise intensity as defined by the American College of Sports Medicine [55]. In comparison, during the passive exercise, the younger participants’ HRs were 37.7±1.8% of their HRmax (69.7±3.5 bpm) and the older participants’ HRs were 42.8±1.8% of their HRmax (67.3±2.1 bpm), which corresponds to very-light exercise intensity. HR data during each rs-fMRI scan is summarized in Table 3 for both age groups. Although the changes in HR between the pre and post exercise scans were relatively minimal (ranging from +2.4 bpm to –5.8 bpm), they were statistically significant for both exercise conditions (p’s < 0.01). Therefore, we modeled HR during the scan as a covariate in all FC analyses. We also found a main effect of exercise condition on RPE ratings and FAS ratings (p’s < 0.001), but not for ratings on the Feeling Scale (p > 0.05). Across both age groups, the average time elapsed between exercise cessation and the beginning of each rs-fMRI scan was 23.5±0.59 minutes for the active exercise and 24.1±1.17 minutes for the passive exercise. There was no significant difference in the timing between the two exercise conditions or between the two age groups (p > 0.05). Both physiological and subjective measures indicate that our experimental design was successful in isolating the effects of aerobic engagement in the active condition, while controlling for perceived enjoyment, leg movement, and timing of post-exercise scanning. All exercise measures are reported in Table 3.
Acute exercise-induced changes in the functional connectivity of resting state networks
To examine whole-brain changes in FC, we focused on two statistical effects for each network of interest: 1) a main effect of exercise condition (Figs. 4A and 5A), and 2) an interaction between exercise condition and age group (younger vs older; Figs. 4B, 4C, 5B and 5C). In Figures 4A and 5A, we present results where FC changes are greater following active compared to passive exercise, whereas in Fig. 6, we illustrate voxels where increases in FC are greater following passive compared to active exercise. Regarding the interaction with age group, Figs. 4B and 5B depict cases where the effect of exercise condition (i.e., Activediff >Passivediff) is greater for younger adults compared to older adults (i.e., FC change for active exercise, compared to passive exercise, is greater in older adults than in younger adults). In contrast, Figs. 4C and 5C show cases where the effect of exercise condition is greater for the older adults compared to the younger adults. We further examined connectivity changes from both exercise conditions and for both age groups at voxels exhibiting peak statistical scores (bar graphs in Figs. 4D, 5D and 6). The bar graphs illustrate the nature of change for each condition and age group that generated the main effects and interactions. Table 4 (Active >Passive) and Table 5 (Passive >Active) summarize the statistical peaks for each network and their corresponding anatomical locations.
Overall, we observed significant main effects of exercise condition in favor of active exercise in clusters within the affect-reward, hippocampal, and right executive control networks; whereas in other networks, the clusters were outside of the network’s baseline map (Figs. 4A and 5A). In the ARN, the voxelwise results revealed significant within-network FC increases among the left amygdala, left vmPFC, and both medial temporal lobes following active exercise (Table 4). Additionally, we observed a significant effect in the right anterior insula (aIns), a key region that anchors the SAL. To investigate the nature of the right aIns cluster, we performed a post-hoc seed-based FC analysis by using a spherical mask centered on the voxel in the right aIns with the peak statistical effect (x = 40, y = 12, z = 4; Z-score = 3.63) to create a FC map based on participants’ first pre-exercise rs-fMRI scans. The resulting FC map exhibited a high spatial correlation with the SAL that was identified by gICA (r = 0.54; Figure S3), indicating that acute exercise induced cross-network integration between the SAL and ARN. The bar graphs in Fig. 4D illustrate that, for both age groups, active exercise increases FC between these regions and the ARN, relative to the passive exercise. We also found that FC increases between the temporal pole and the ARN are greater for the older adults compared to the younger adults.
Within the hippocampal-cortical network (HCN), we found several interaction effects that were consistent with our predictions. Specifically, across both age groups, active exercise increased FC between the hippocampus and the mPFC, temporal pole, and intracalcarine cortex, relative to passive exercise. Based on the interactions with age group, we found that, compared to the younger adults, the older adults exhibited greater FC increases between the hippocampus and the mPFC (Fig. 4C, HCN). Similarly, acute exercise produced greater FC increases for the older adults, compared to younger adults, in the right ECN, which is a network reported to disconnect throughout normal aging [56] (Fig. 5C, R ECN). This finding supports the notion that, in older compared to younger adults, acute moderate-intensity exercise targets regions that become isolated from their parent network with aging [57–59].
For both the R and L ECN, we found significant time by condition effects in frontal and parietal clusters that overlap with core regions from the DAN. To demonstrate that the acute exercise effect for the R ECN overlaps with the DAN, we constructed a spherical mask centered on the parietal cluster’s statistical peak (x = 26, y = –60, z = 50; Z-score = 2.80) and performed a seed-based FC analysis on the first pre-exercise rs-fMRI scans. In this post-hoc analysis, we found that the resulting FC map shared a high spatial correlation with the DAN (r = 0.61) as compared to the R ECN (r = 0.17) (Figure S4). In comparison, using the same approach, seeding the right dorsolateral prefrontal cluster within the R ECN produced an FC map that shared a high spatial correlation with the R ECN (r = 0.57). The LECN also exhibited a significant increase in FC with parietal clusters following active exercise, relative to passive exercise. Although the parietal clusters overlap with the parietal regions of the DAN, seeding the peak cluster produced a FC map that did not resemble a particular network of interest, unlike the R ECN results. These results suggest that acute exercise integrates right-lateralized fronto-parietal networks that support attention and executive control, and this benefits older adults more than younger adults.
Contrary to the findings for the HCN, when collapsed across both age groups, we did not find statistically significant within-network effects with the DMN core; instead, the DMN changed FC primarily with somatosensory regions. However, the interaction with age group revealed greater FC changes between the DMN core and mPFC for the older adults compared to the younger adults, similar to the hippocampal seed. In addition, we found significant interaction effects both within the SAL and in regions linking the SAL with the DAN. The voxelwise GLM revealed a significant time by condition interaction in the right temporoparietal junction (TPJ) of the SAL. Targeted post-hoc t-tests in the right TPJ revealed significant decreases in FC following passive exercise (t(24) = 2.52, p < 0.05) and no change in active exercise (t(24) = 0.58, p > 0.05). Similar to the ECNs, we observed that in older adults, acute exercise effects in the SAL are greater in parietal regions that overlap with the DAN, compared to younger adults. However, post-hoc t-tests revealed that the age interactions in the SAL were marked by decreased FC in the young during the active condition (t’s < –2.41, p’s < 0.05).
Next, we identified clusters in which the passive exercise condition drives the time by condition interaction (Fig. 6). Note that for example the interaction effects for Active >Passive, Young >Old would mirror the effects for Passive >Active, Old >Young. Thus, for the Passive >Active contrast, we present only the effects of exercise condition collapsed across age groups. Unlike the results from the Active >Passive analysis, the Passive >Active contrast produced results in voxels that were primarily outside of the mean network map for the ARN, HCN, and the R ECN. However, in a few cases, passive exercise resulted in relatively large increases in FC. For example, with the ARN, the left precuneus and right inferior parietal lobule both increased in FC following passive exercise. Overall, the observations from the Passive >Active contrast highlight the selective nature of acute exercise effects on FC regarding within-network changes.
Finally, we examined acute exercise effects for the MOT and AUD-VIS networks. Although we had anticipated the acute exercise effects to be specific to higher-level cognitive networks, we observed several clusters with greater change in FC following active exercise relative to passive exercise across both age groups (Fig. 7; Table 4). Across both age groups, we found an increase in FC between the MOT network and the right and left posterior cingulate cortices. Additionally, FC increases between MOT and the right dorsal anterior cingulate and the right dorsolateral prefrontal cortex were significantly greater in younger adults than in older adults. For the AUD-VIS, we found significant effects of exercise condition in the right posterior insula and in the right hippocampus, which were characterized by decreases in FC during passive exercise. Significant interactions of age and condition were found in the visual cortex (Young >Old) and left dorsolateral prefrontal cortex (Old >Young).
DISCUSSION
The goal of the present study was totest the hypothesis that a single session of moderate-intensity aerobic exercise modulates cognitively and clinically relevant functional brain networks in both younger and older adults. We found that acute exercise increases the integration of attention and executive control networks, which is in agreement with a common behavioral finding reported in the acute exercise-cognition literature [8, 10, 60]. We also observed that acute exercise preferentially targets affect and hippocampal networks, which is consistent with the hypothesis that acute exercise effects stem from catecholaminergic modulations in limbic regions. Our findings add to a growing body of literature that is investigating the acute effects of exercise on brain and cognitive outcomes by providing insights into the functional network connections that are particularly sensitive to moderate-intensity aerobic exercise.
One key observation from our study is that acute aerobic exercise enhances the brain’s attention reorienting functions through the integration of the dorsal and ventral attention networks. The R ECN in our study corresponds to the right-lateralized “ventral attention network” (VAN) proposed by Corbetta and Schulman [26], and this network increased FC with the DAN following active exercise. Specifically, we found that the right intraparietal sulcus (IPS), a core region of the DAN, increased FC with the R ECN (Fig. 5; Figure S4). The DAN, which is anchored by the IPS, is thought to be the primary driver of goal-driven attention [61]. Thus, coordinated activity between the R ECN/VAN and the DAN serves as an attention reorienting system that reconfigures brain networks in the service of goal-driven tasks [61]. Our finding that the R ECN and the DAN become more integrated following our active exercise manipulation is consistent with previous findings in both young and old adults revealing that acute moderate-intensity aerobic exercise enhances the P300ERP in response to target detection tasks [8, 10, 60]. Indeed, the P300, which is a scalp-recorded index of attention allocation and orienting, is generated by anchors of the R ECN/VAN (IPL and dlPFC), supported by both intracranial recordings and lesion studies in humans [62]. Together, our findings are in agreement with previous acute exercise studies indicating that a single session of aerobic exercise enhances the interaction of executive function and attention networks in the brain [8, 60, 63]. Future studies should aim to relate these acute exercise-related changes in brain networks to performance changes on attention demanding tasks.
We also found evidence supporting our hypothesis that acute exercise effects stem from catecholaminergic modulations in limbic regions. Specifically, active exercise selectively increased FC within the ARN, consistent with the body of literature reporting that acute moderate-intensity exercise influences self-reported positive affect ratings and reward processing [64–66]. We also found that the ARN increased FC with the right anterior insula (aIns), which is known to integrate afferent signals containing homeostatic information about bodily changes (i.e., interoception) for the purposes of affective processing [67–69]. These “somatic markers” are proposed to initiate attentional control capacities of the dorsal anterior cingulate (dACC) to which the aIns is structurally and functionally connected [68, 70]. Together, the dACC and aIns anchor the SAL network, and they are thought tooptimize behavior by sending behaviorally-relevant control signals that coordinate activity among other functional brain networks [68]. Although we did not find significant acute exercise effects within the SAL network when seeding the core SAL regions together as one mask, post-hoc analyses indicated that active exercise increased FC between the ARN and the SAL, consistent with the proposal that the SAL integrates interoceptionand reward processing [71] (Figure S3). Our findings reveal a possible neural mechanism underlying the subjective experiences of exercise that are reported in the literature. Additionally, they support the hypothesis that physical exercise is a potent affective stimulus, offering insight into improving the design of exercise interventions (e.g., by emphasizing positive affective qualities).
Additionally, active exercise increased FC between anteromedial hippocampus and the medial prefrontal cortex (mPFC), which overlaps with the ARN [36, 54]. Given the positive relationship between individual differences in aerobic fitness and hippocampal-cortical FC with the mPFC [37, 59], our results suggest that measuring acute exercise effects with rs-fMRI may be accessing transient effects thatlead to stable adaptations in the brain from regular moderate-intensity exercise. Moreover, within the DMN, older adults showed greater FC increases between the DMN core and the mPFC, which supports the hypothesis that the mechanisms instantiated by acute exercise act to restore functional connections that decrease with normal aging [57, 58]. Although we cannot point to a commonly reported effect of a single exercise session on cognitive processing that is consistent with changes in hippocampal-mPFC FC, these results may suggest that context-learning is sensitive to acute exercise. Context, which has been proposed to be acquired through hippocampal-mPFC interaction, has been conceptualized as a representation of a set of connected experiences such as a task set of ongoing task rules or generalized schemas that govern how to respond to different environmental cues [72–74]. As proposed by Preston and Eichenbaum [73], the hippocampus rapidly binds episodic details (e.g., cue-response contingencies or other elements of experience) and the mPFC integrates newly acquired details with existing internal models that guide behavior. Thus, future studies could directly test these theoretical predictions by manipulating hippocampal-mPFC FC with exercise and assessing changes in context acquisition. Our hippocampal-mPFC results, together with the acute effects on the ARN and attention reorienting networks, also lead to the prediction that moderate-intensity exercise would selectively enhance learning in tasks that require goal-driven attention, acquiring complex task sets, and incorporating reward-based feedback mechanisms. Effects on the ARN and HCN may also provide mechanistic insight to how exercise following learning improves longer-term consolidation of learning [75–78]. Given the implications of this research for exercise to improve learning and memory in settings such as schools or physical therapy, it will be important for future studies to investigate how changes in network connectivity mediate changes in behavior and task performance.
What might give rise to these acute exercise-induced changes in FC? Both animal and human studies have reported that single exercise sessions acutely modulate the transmission of norepinephrine and dopamine, potentially through feedback mechanisms in the brain related to exercise-induced sympathetic activation [79]. Although the exercise neuroscience literature has heavily implicated brain-derived neurotrophic factor (BDNF), the time course of catecholamines is more consistent with the time course of acute exercise effects. Given that sympathetic activation is a critical distinction between the active and passive exercise manipulations, it is plausible that transient increases in catecholiminergic activity provide a basis for our results. For instance, the locus coeruleus-norepinephrine (LC-NE) system is activated by the sympathetic nervous system via the nucleus of the solitary to produce distributed cortical release of NE [80]. The widespread projections of the LC-NE system throughout the brain could provide a basis for enhanced connectivity by amplifying the signal-to-noise ratio in behaviorally-relevant brain regions in order to optimize task performance [81]. Moreover, Grenhoff et al. [82, 83] reported that the LC-NE system directly modulates activity in the ventral tegmental area (VTA), which is the primary source of dopaminergic projection to the ARN. The distributed nature of catecholamine transmission could also account for our finding that acute exercise produced cross-network FC increases with the sensory and motor networks. Together, these findings support the hypothesis that the effects of moderate-intensity exercise on the LC-NE system can be detected at a broad systems-level scale by examining exercise effects on large-scale resting-state networks. Future studies could more directly investigate the mechanisms of the results observed in the current study with pharmacological manipulations that either block or augment different neurotransmitter systems (e.g., propranolol to block NE activity) during exercise and evaluating its effects on exercise-induced changes in brain function and task performance. Future studies could also simultaneously measure FC changes in ARN connectivity with changes in dopamine binding measured with positron emission tomography [84].
In closing, the relatively short duration of an acute exercise paradigm, as compared to long-term exercise trials, afforded us the ability to utilize a highly controlled laboratory comparison of acute exercise effects on the brain, including a passive, motor-driven control condition that controls for leg movement and cadence within subjects. This experimental design also offered methodological advantages over prior studies that have either only collected post-experimental testing, or assign seated-rest as the within-subjects control condition [e.g., 49]. However, the interpretation of our findings should be contextualized by several limitations. First, our voxelwise analyses were dependent upon the set of spherical ROIs derived from a data-driven analysis. Although this resolution of analysis provides insight into regional FC changes with the mean time course of a network as a whole, it precludes the possibility that sub-systems within or across brain networks are more responsive to acute exercise than the larger network. However, given our a priori predictions based on the existing literature, our approach allowed us to test targeted questions about the effects of exercise on cognitively- and clinically-relevant functional networks. Secondly, the spatial resolution of our neuroimaging data is unable to test hypotheses about acute exercise effects on the brainstemregions that are known to drive dopamine and norepinephrine (e.g., ventral tegmental area and locus coeruleus, respectively). Given that our results indicate that the cortical targets of these catecholiminergic systems are sensitive to acute exercise, follow-up studies could directly assess these brainstem regions with high-resolution functional human imaging. Thirdly, several of the effects in favor of moderate-intensity active exercise in networks of interest, such as the HCN, reflected both increases in FC for the active condition and decreases in FC following the passive condition. Although it was unexpected that the active and passive conditions would drive opposing effects in some regions, the results of the current study provide a starting point for testing alternative control conditions (e.g., participants volitionally cycling at a light intensity) or additional manipulations to further understand this pattern of effects. Additionally, future studies could test whether this also translates to decrements in performance following passive cycling. Lastly, from an experimental design standpoint, our sample size was relatively small; however, our novel within-subjects exercise conditions allowed for a well-controlled analysis of FC changes that are specific to actively engaging cardiovascular systems.
Despite these limitations, our study provides valuable insight into understanding how moderate-intensity exercise directly affects brain function and enhances the FC of networks that degrade with aging. Furthermore, the partial overlap between acute exercise effects observed in our study and long-term exercise effects reported by others provides a basis for future pursuits of acute exercise paradigms to gain mechanistic insight into the protective effects of habitual aerobic exercise on the aging brain. This observation is particularly significant given that the overlap occurred in hippocampal-cortical FC, which declines with aging and neurodegenerative diseases. For example, our results suggest that the highly controlled acute exercise paradigm may provide a framework for determining the critical ingredients that enable exercise to modulate networks that would otherwise decline with aging, or for identifying key moderators for why some people respond to exercise better than others for improved cognitive and brain function. Accordingly, combining acute and long-term exercise manipulations in the same individuals would provide a model for extending our results to further test these predictions. Thus, overall, our results contribute toward advancing scientific knowledge supporting evidence-based exercise recommendations for improving cognitive and brain function across the lifespan.
ACKNOWLEDGMENTS
This work was supported by the University of Iowa Biological Sciences Funding Program pilot grant, start-up funds for MV, NIH R21 AG048170-01 to MV, and NIH R21 AG043722-01 to GLP. We thank Merry Mani and Joel Bruss for their contributions in developing imaging processing scripts.
Appendices
Supplementary material can be found here: http://dx.doi.org/10.3233/BPL-160039
REFERENCES
[1] | Voss MW , Vivar C , Kramer AF , van Praag H . Bridging animal and human models of exercise-induced brain plasticity. Trends Cogn Sci Elsevier Ltd. (2013) ;17: (10):525–44. |
[2] | Voss MW , Nagamatsu LS , Liu-Ambrose T , Kramer AF . Exercise, brain, and cognition across the life span. J Appl Physiol. (2011) ;111: (5):1505–13. |
[3] | Hillman CH , Erickson KI , Kramer AF . Be smart, exercise your heart: Exercise effects on brain and cognition. Nat Rev Neurosci. (2008) ;9: :58–65. |
[4] | Neeper SA , Gómez-Pinilla F , Choi J , Cotman CW . Exercise and brain neurotrophins. Nature. (1995) ;373: :109. |
[5] | Soya H , Nakamura T , Deocaris CC , Kimpara A , Iimura M , Fujikawa T , et al. BDNF induction with mild exercise in the rat hippocampus. Biochem Biophys Res Commun. (2007) ;358: (4):961–7. |
[6] | Meeusen R , Fontenelle V . The Monoaminergic System in Animal Models of Exercise. In: Boecker H, Hillman CH, Scheef L, Strüder HK, editors. Functional Neuroimaging in Exercise and Sport Sciences. New York, NY, Springer New York. (2012) ; pp. 59–76. |
[7] | Chang YK , Labban JD , Gapin JI , Etnier JL . The effects of acute exercise on cognitive performance: A meta-analysis. Brain Res Elsevier BV. (2012) ;1453: (250):87–101. |
[8] | Kamijo K , Hayashi Y , Sakai T , Yahiro T , Tanaka K , Nishihira Y . Acute effects of aerobic exercise on cognitive function in older adults. J Gerontol B Psychol Sci Soc Sci. (2009) ;64: (3):356–63. |
[9] | Joyce J , Smyth PJ , Donnelly AE , Davranche K . The simon task and aging: Does acute moderate exercise influence cognitive control? Med Sci Sports Exerc. (2014) ;46: (3):630–9. |
[10] | Hillman CH , Snook EM , Jerome GJ . Acute cardiovascular exercise and executive control function. Int J Psychophysiol. (2003) ;48: (3):307–14. |
[11] | Weng TB , Pierce GL , Darling WG , Voss MW . Differential Effects of Acute Exercise on Distinct Aspects of Executive Function. Med Sci Sport Exerc. (2015) ;47: (7):1460–9. |
[12] | Basso JC , Shang A , Elman M , Karmouta R , Suzuki WA . Acute Exercise Improves Prefrontal Cortex but not Hippocampal Function in Healthy Adults. J Int Neuropsychol Soc. (2015) ;21: (10):791–801. |
[13] | Smith JC , Paulson ES , Cook DB , Verber MD , Tian Q . Detecting changes in human cerebral blood flow after acute exercise using arterial spin labeling: Implications for fMRI. J Neurosci Methods Elsevier BV. (2010) ;191: (2):258–62. |
[14] | Drollette ES , Scudder MR , Raine LB , Moore RD , Saliba BJ , Pontifex MB , et al. Acute exercise facilitates brain function and cognition in children who need it most: An ERP study of individual differences in inhibitory control capacity. Dev Cogn Neurosci Elsevier Ltd. (2014) ;7: :53–64. |
[15] | Li L , Men W-W , Chang Y-K , Fan M-X , Ji L , Wei G-X . Acute aerobic exercise increases cortical activity during working memory: A functional MRI study in female college students. PLoS One. (2014) ;9: (6):e99222. |
[16] | Yanagisawa H , Dan I , Tsuzuki D , Kato M , Okamoto M , Kyutoku Y , et al. Acute moderate exercise elicits increased dorsolateral prefrontal activation and improves cognitive performance with Stroop test. Neuroimage Elsevier Inc. (2010) ;50: (4):1702–10. |
[17] | Byun K , Hyodo K , Suwabe K , Ochi G , Sakairi Y , Kato M , et al. Positive effect of acute mild exercise on executive function via arousal-related prefrontal activations: An fNIRS study. Neuroimage Elsevier Inc. (2014) ;98: :336–45. |
[18] | Petersen SE , Sporns O . Brain Networks and Cognitive Architectures. Neuron Elsevier Inc. (2015) ;88: (1):207–19. |
[19] | Biswal BB , Mennes M , Zuo X-N , Gohel S , Kelly C , Smith SM , et al. Toward discovery science of human brain function. Proc Natl Acad Sci U S A. (2010) ;107: (10):4734–9. |
[20] | Smith SM , Fox PT , Miller KL , Glahn DC , Fox PM , Mackay CE , et al. Correspondence of the brain’s functional architecture during activation and rest. Proc Natl Acad Sci U S A. (2009) ;106: (31):13040–5. |
[21] | Laird AR , Fox PM , Eickhoff SB , Turner J , a , Ray KL , McKay DR , et al. Behavioral interpretations of intrinsic connectivity networks. J Cogn Neurosci. (2011) ;23: (12):4022–37. |
[22] | Yeo BTT , Krienen FM , Eickhoff SB , Yaakub SN , Fox PT , Buckner RL , et al. Functional specialization and flexibility in human association cortex. Cereb Cortex. (2014) )1–19. |
[23] | Ferreira LK , Busatto GF . Resting-state functional connectivity in normal brain aging. Neurosci Biobehav Rev Elsevier Ltd. (2013) ;37: (3):384–400. |
[24] | Voss MW , Wong CN , Baniqued PL , Burdette JH , Erickson KI , Prakash RS , et al. Aging brain from a network science perspective: Something to be positive about? Sathian K, editor. PLoS One. (2013) ;8: (11):e78345. |
[25] | Shaw EE , Schultz AP , Sperling RA , Hedden T . Functional connectivity in multiple cortical networks is associated with performance across cognitive domains in older adults. Brain Connect. (2015) ; In Press:150623112237006. |
[26] | Lewis CM , Baldassarre A , Committeri G , Romani GL , Corbetta M . Learning sculpts the spontaneous activity of the resting human brain. Proc Natl Acad Sci U S A. (2009) ;106: (41):17558–63. |
[27] | Albert NB , Robertson EM , Miall RC . The resting human brain and motor learning. Curr Biol Elsevier Ltd;. (2009) ;19: (12):1023–7. |
[28] | Tambini A , Ketz N , Davachi L . Enhanced Brain Correlations during Rest Are Related to Memory for Recent Experiences. Neuron Elsevier Ltd. (2010) ;65: (2):280–90. |
[29] | McMorris T . Re-appraisal of the acute, moderate intensity exercise-catecholamines interaction effect on speed of cognition: Role of the vagal/NTS afferent pathway. J Appl Physiol. (2015) ;17:jap.00749.2015. |
[30] | Dunn AL , Reigle TG , Youngstedt SD , Armstrong RB , Dishman RK . Brain norepinephrine and metabolites after treadmill training and wheel running in rats. Med Sci Sports Exerc. (1996) ;28: (2):204–9. |
[31] | Dishman RK . The norepinephrine hypothesis. In: Morgan WP, editor. Physical activity and mental health. Philadelphia, PA, US: Taylor & Francis, (1997) ; pp. 199–212. |
[32] | Erickson KI , Miller DL , Roecklein KA . The aging hippocampus: Interactions between exercise, depression, and BDNF. Neuroscientist. (2012) ;18: (1):82–97. |
[33] | Voss MW , Vivar C , Kramer AF , van Praag H . Bridging animal and human models of exercise-induced brain plasticity. Trends Cogn Sci Elsevier Ltd. (2013) ;1–20. |
[34] | van Praag H . Exercise and the brain: Something to chew on. Trends Neurosci. (2009) ;32: (5):283–90. |
[35] | Buckner RL , Andrews-Hanna JR , Schacter DL . The brain’s default network: Anatomy, function, and relevance to disease. Ann N Y Acad Sci. (2008) ;1124: :1–38. |
[36] | Blessing EM , Beissner F , Schumann A , Brünner F , Bär KJ . A data-driven approach to mapping cortical and subcortical intrinsic functional connectivity along the longitudinal hippocampal axis. Hum Brain Mapp. (2015) ;476: (2015):462–76. |
[37] | Voss MW , Weng TB , Burzynska AZ , Wong CN , Cooke GE , Clark R , et al. Fitness, but not physical activity, is related to functional integrity of brain networks associated with aging. Neuroimage Elsevier Inc. (2016) ;131: :113–25. |
[38] | Voss MW , Prakash RS , Erickson KI , Basak C , Chaddock L , Kim JS , et al. Plasticity of brain networks in a randomized intervention trial of exercise training in older adults. Front Aging Neurosci. (2010) ;2: (August):1–17. |
[39] | Vivar C , Peterson BD , van Praag H . Running rewires the neuronal network of adult-born dentate granule cells. NeuroImage Elsevier BV. (2015) ;29–41. |
[40] | Wasserman K , Hansen J , Sue D , Stringer W , Whipp B ((2005) ) Principles exercise testing and interpretation. 4th ed. Philadelphia, PA, US: Lippincott Williams & Wilkins; 80–81, 160-167p. |
[41] | Borg GAV . Psychophysical bases of perceived exertion. Med Sci Sports Exerc. (1982) ;14: (5):377–81. |
[42] | Svebak S , Murgatroyd S . Metamotivational dominance: A multimethod validation of reveral theory constructs. J Pers Soc Psychol. (1985) ;48: :107–16. |
[43] | Hardy CJ , Rejeski WJ . Not what, but how one feels: The measurement of affect during exercise. J Sport Exerc Psychol. (1989) ;11: :304–17. |
[44] | Smith SM . Fast robust automated brain extraction. Hum Brain Mapp. (2002) ;17: (3):143–55. |
[45] | Andersson JLR , Jenkinson M , Smith SM ((2007) ) Non-linear registration. aka spatial normalisation. FMRIB Analysis Group Technical Reports. |
[46] | Greve DN , Fischl B . Accurate and robust brain image alignment using boundary-based registration. Neuroimage. (2009) ;48: (1):63–72. |
[47] | Leopold DA , Murayama Y , Logothetis NK . Very slow activity fluctuations in monkey visual cortex: Implications for functional brain imaging. Cereb Cortex. (2003) ;13: (4):422–33. |
[48] | Hallquist MN , Hwang K , Luna B . The nuisance of nuisance regression: Spectral misspecification in a common approach to resting-state fMRI preprocessing reintroduces noise and obscures functional connectivity. Neuroimage Elsevier Inc. (2013) ;82: :208–25. |
[49] | Power JD , Mitra A , Laumann TO , Snyder AZ , Schlaggar BL , Petersen SE . Methods to detect, characterize, and remove motion artifact in resting state fMRI. Neuroimage Elsevier Inc. (2014) ;84: :320–41. |
[50] | Beckmann CF , Smith SM . Probabilistic independent component analysis for functional magnetic resonance imaging. IEEE Trans Med Imaging. (2004) ;23: :137–52. |
[51] | Yeo BT , Krienen FM , Sepulcre J , Sabuncu MR , Lashkari D , Hollinshead M , et al. The organization of the human cerebral cortex estimated by intrinsic functional connectivity. J Neurophysiol. (2011) ;106: (3):1125–65. |
[52] | Veer IM , Oei NYL , Spinhoven P , van Buchem MA , Elzinga BM , Rombouts SARB . Beyond acute social stress: Increased functional connectivity between amygdala and cortical midline structures. Neuroimage Elsevier Inc. (2011) ;57: (4):1534–41. |
[53] | Desikan RS , Ségonne F , Fischl B , Quinn BT , Dickerson BC , Blacker D , et al. An automated labeling system for subdividing the human cerebral cortex on MRI scans into gyral based regions of interest. Neuroimage. (2006) ;31: (3):968–80. |
[54] | Andrews-Hanna JR , Reidler JS , Sepulcre J , Poulin R , Buckner RL . Functional-anatomic fractionation of the brain’s default network. Neuron. Elsevier Ltd. (2010) ;65: (4):550–62. |
[55] | American College of Sports Medicine (2014) ACSM’s Guidelines for Exercise Testing and Prescription. Ninth. |
[56] | Ng KK , Lo JC , Lim JKW , Chee MWL , Zhou J . Reduced functional segregation between the default mode network and the executive control network in healthy older adults: A longitudinal study. Neuroimage Elsevier Inc. (2016) ;133: :321–30. |
[57] | Damoiseaux JS , Viviano RP , Yuan P , Raz N . Differential effect of age on posterior and anterior hippocampal functional connectivity. Neuroimage. Elsevier Inc. (2016) ;133: :468–76. |
[58] | Andrews-Hanna JR , Snyder AZ , Vincent JL , Lustig C , Head D , Raichle ME , et al. Disruption of large-scale brain systems in advanced aging. Neuron. (2007) ;56: (5):924–35. |
[59] | Voss MW , Erickson KI , Prakash RS , Chaddock L , Malkowski E , Alves H , et al. Functional connectivity: A source of variance in the association between cardiorespiratory fitness and cognition? Neuropsychologia. (2010) ;48: (5):1394–406. |
[60] | Pontifex MB , Parks AC , Henning DA , Kamijo K . Single bouts of exercise selectively sustain attentional processes. Psychophysiology. (2015) ;52: (5):618–25. |
[61] | Corbetta M , Patel G , Shulman GL . The reorienting system of the human brain: From environment to theory of mind. Neuron. (2008) ;58: (3):306–24. |
[62] | Nieuwenhuis S , Aston-Jones G , Cohen JD . Decision making, the P3, and the locus coeruleus-norepinephrine system. Psychol Bull. (2005) ;131: (4):510–32. |
[63] | Hillman CH , Snook EM , Jerome GJ . Acute cardiovascular exercise and executive control function. Int J Psychophysiol. (2003) ;48: (3):307–14. |
[64] | Bothe N , Zschucke E , Dimeo F , Heinz A , Wüstenberg T , Ströhle A . Acute exercise influences reward processing in highly trained and untrained men. Med Sci Sports Exerc. (2013) ;45: (3):583–91. |
[65] | Ekkekakis P , Hargreaves EA , Parfitt G . Invited Guest Editorial: Envisioning the next fifty years of research on the exercise–affect relationship. Psychol Sport Exerc. (2013) ;14: (5):751–8. |
[66] | Hogan CL , Mata J , Carstensen LL . Exercise holds immediate benefits for affect and cognition in younger and older adults. Psychol Aging. (2013) ;28: (2):587–94. |
[67] | Critchley HD , Wiens S , Rotshtein P , Ohman A , Dolan RJ . Neural systems supporting interoceptive awareness. Nat Neurosci. (2004) ;7: (2):189–95. |
[68] | Menon V , Uddin LQ . Saliency, switching, attention and control: A network model of insula function. Brain Struct Funct. (2010) ;214: (5-6):655–67. |
[69] | Uddin LQ . Salience processing and insular cortical function and dysfunction. Nat Rev Neurosci Nature Publishing Group. (2014) ;16: (1):55–61. |
[70] | Craig ADB . The sentient self. Brain Struct Funct. (2010) ;214: (5-6):563–77. |
[71] | Seeley WW , Menon V , Schatzberg AF , Keller J , Glover GH , Kenna H , et al. Dissociable intrinsic connectivity networks for salience processing and executive control. J Neurosci. (2007) ;27: (9):2349–56. |
[72] | Braver TS , Barch DM . A theory of cognitive control, aging cognition, and neuromodulation. Neurosci Biobehav Rev. (2002) ;26: (7):809–17. |
[73] | Preston AR , Eichenbaum H . Interplay of hippocampus and prefrontal cortex in memory. Curr Biol Elsevier. (2013) ;23: (17):R764–73. |
[74] | Gluck MA , Meeter M , Myers CE . Computational models of the hippocampal region: Linking incremental learning and episodic memory. Trends Cogn Sci. (2003) ;7: (6):269–76. |
[75] | Roig M , Skriver K , Lundbye-Jensen J , Kiens B , Nielsen JB . A single bout of exercise improves motor memory. PLoS One. (2012) ;7: (9):e44594. |
[76] | Segal SK , Cotman CW , Cahill LF . Exercise-induced noradrenergic activation enhances memory consolidation in both normal aging and patients with amnestic mild cognitive impairment. J Alzheimers Dis. (2012) ;32: (4):1011–8. |
[77] | van Dongen EV , Kersten IHP , Wagner IC , Morris RGM , Fernández G . Physical Exercise Performed Four Hours after Learning Improves Memory Retention and Increases Hippocampal Pattern Similarity during Retrieval. Curr Biol. (2016) ;1–6. |
[78] | Snigdha S , de Rivera C , Milgram NW , Cotman CW . Exercise enhances memory consolidation in the aging brain. Front Aging Neurosci. (2014) ;6: (FEB):1–14. |
[79] | Hattori S , Naoi M , Nishino H . Striatal dopamine turnover during treadmill running in the rat: Relation to the speed of running. Brain Res Bull. (1994) ;35: (1):41–9. |
[80] | Critchley HD , Harrison NA . Visceral Influences on Brain and Behavior. Neuron Elsevier Inc. (2013) ;77: (4):624–38. |
[81] | Aston-Jones G , Cohen JD . An integrative theory of locus coeruleus-norepinephrine function: Adaptive gain and optimal performance. Annu Rev Neurosci. (2005) ;28: :403–50. |
[82] | Grenhoff J , Nisell M , Ferré S , Aston-Jones G , Svensson TH . Noradrenergic modulation of midbrain dopamine cell firing elicited by stimulation of the locus coeruleus in the rat. J Neural Transm Gen Sect. (1993) ;93: (1):11–25. |
[83] | Grenhoff J , Svensson TH . Prazosin modulates the firing pattern of dopamine neurons in rat ventral tegmental area. Eur J Pharmacol. (1993) ;233: (1):79–84. |
[84] | Judenhofer MS , Wehrl HF , Newport DF , Catana C , Siegel SB , Becker M , et al. Simultaneous PET-MRI: A new approach for functional and morphological imaging. Nat Med. (2008) ;14: (4):459–65. |
Figures and Tables
Fig.1
Overview of experimental sessions. Participants performed two conditions of acute exercise across two separate sessions: (1) active exercise at moderate intensity (65% of maximum heart rate) and (2) passive, motor-driven exercise. The order of exercise condition was counterbalanced across subjects. Prior to each pre-exercise scan, participants rested quietly in a waiting room for 30 minutes in order to establish a common baseline between the two visits.

Fig.2
Overview of data analysis at both individual and group levels.
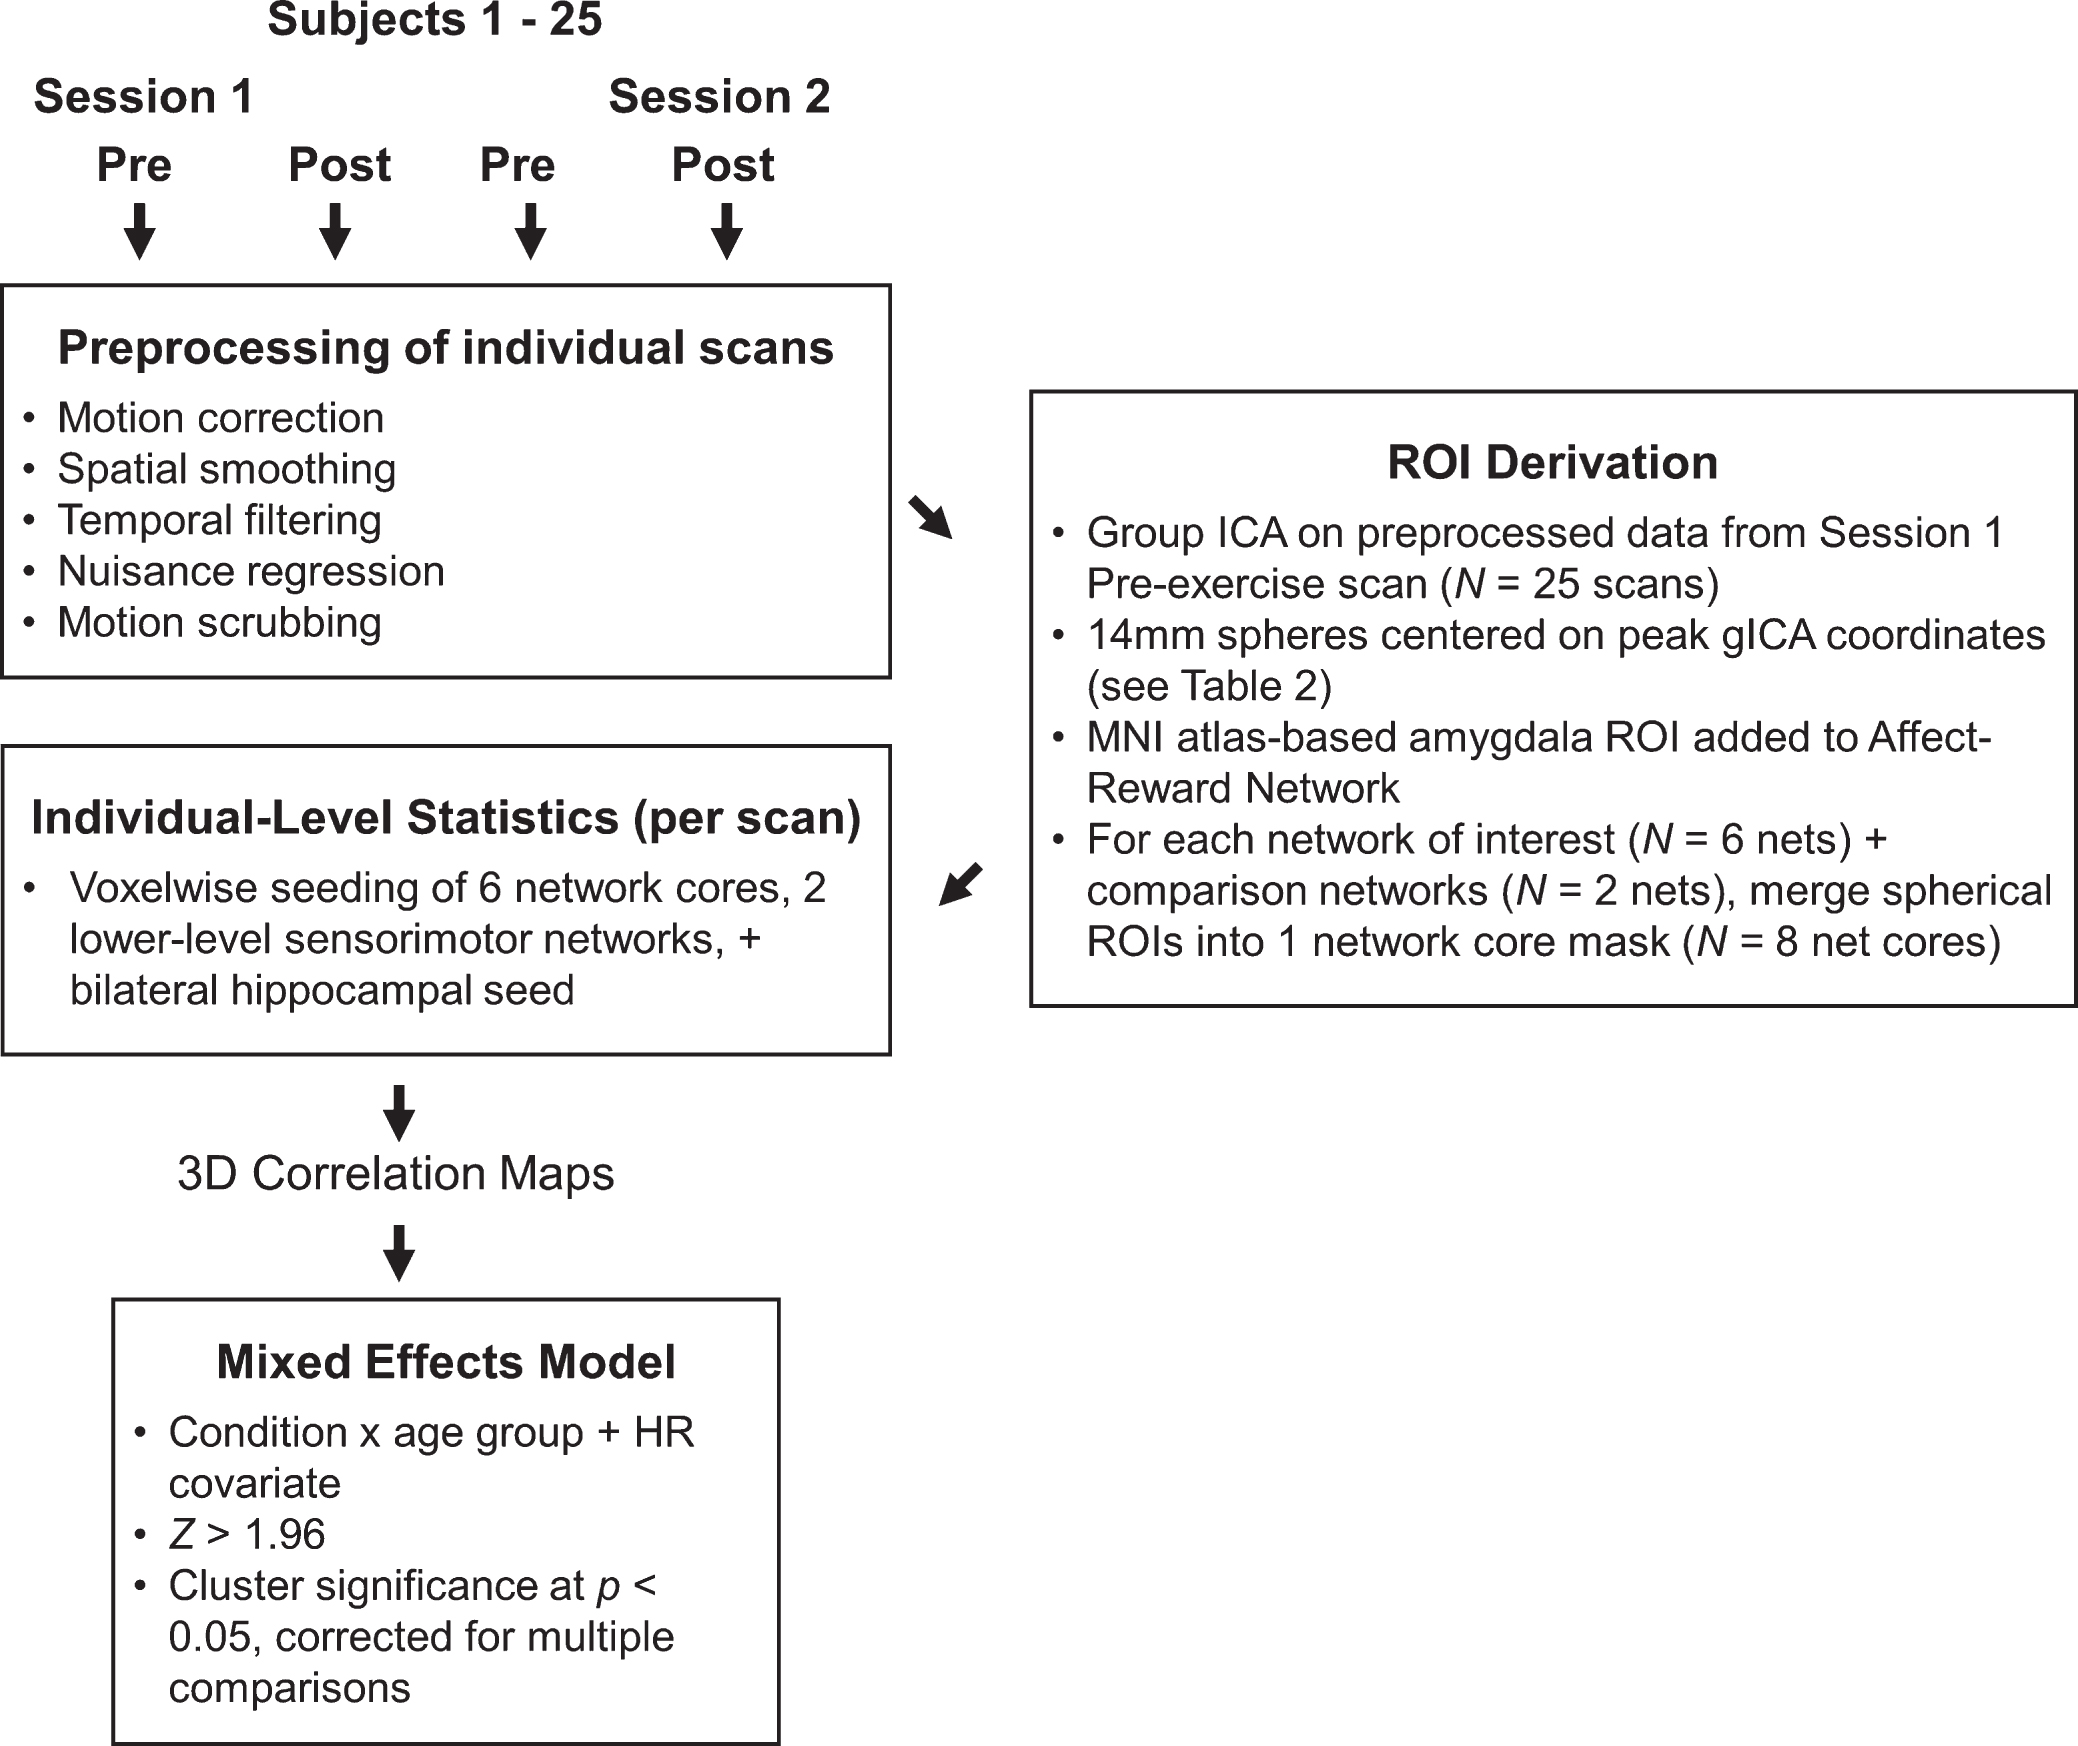
Fig.3
Networks derived from group ICA decomposition. Spherical ROIs representing each network were centered on the peak coordinates and are projected onto surfaces as black spheres for each network. For visualization purposes, the network maps are presented at a threshold of Z > 2.33 based on the group ICA. Here, the three sensory-motor networks are shown on one montage and colored in white. Montages feature lateral (top brains), medial (bottom brains), and dorsal (center brain) views of both hemispheres (left brains = left hemisphere, right brain = right hemisphere.) Refer to Table 2 for anatomical descriptions and MNI coordinates.
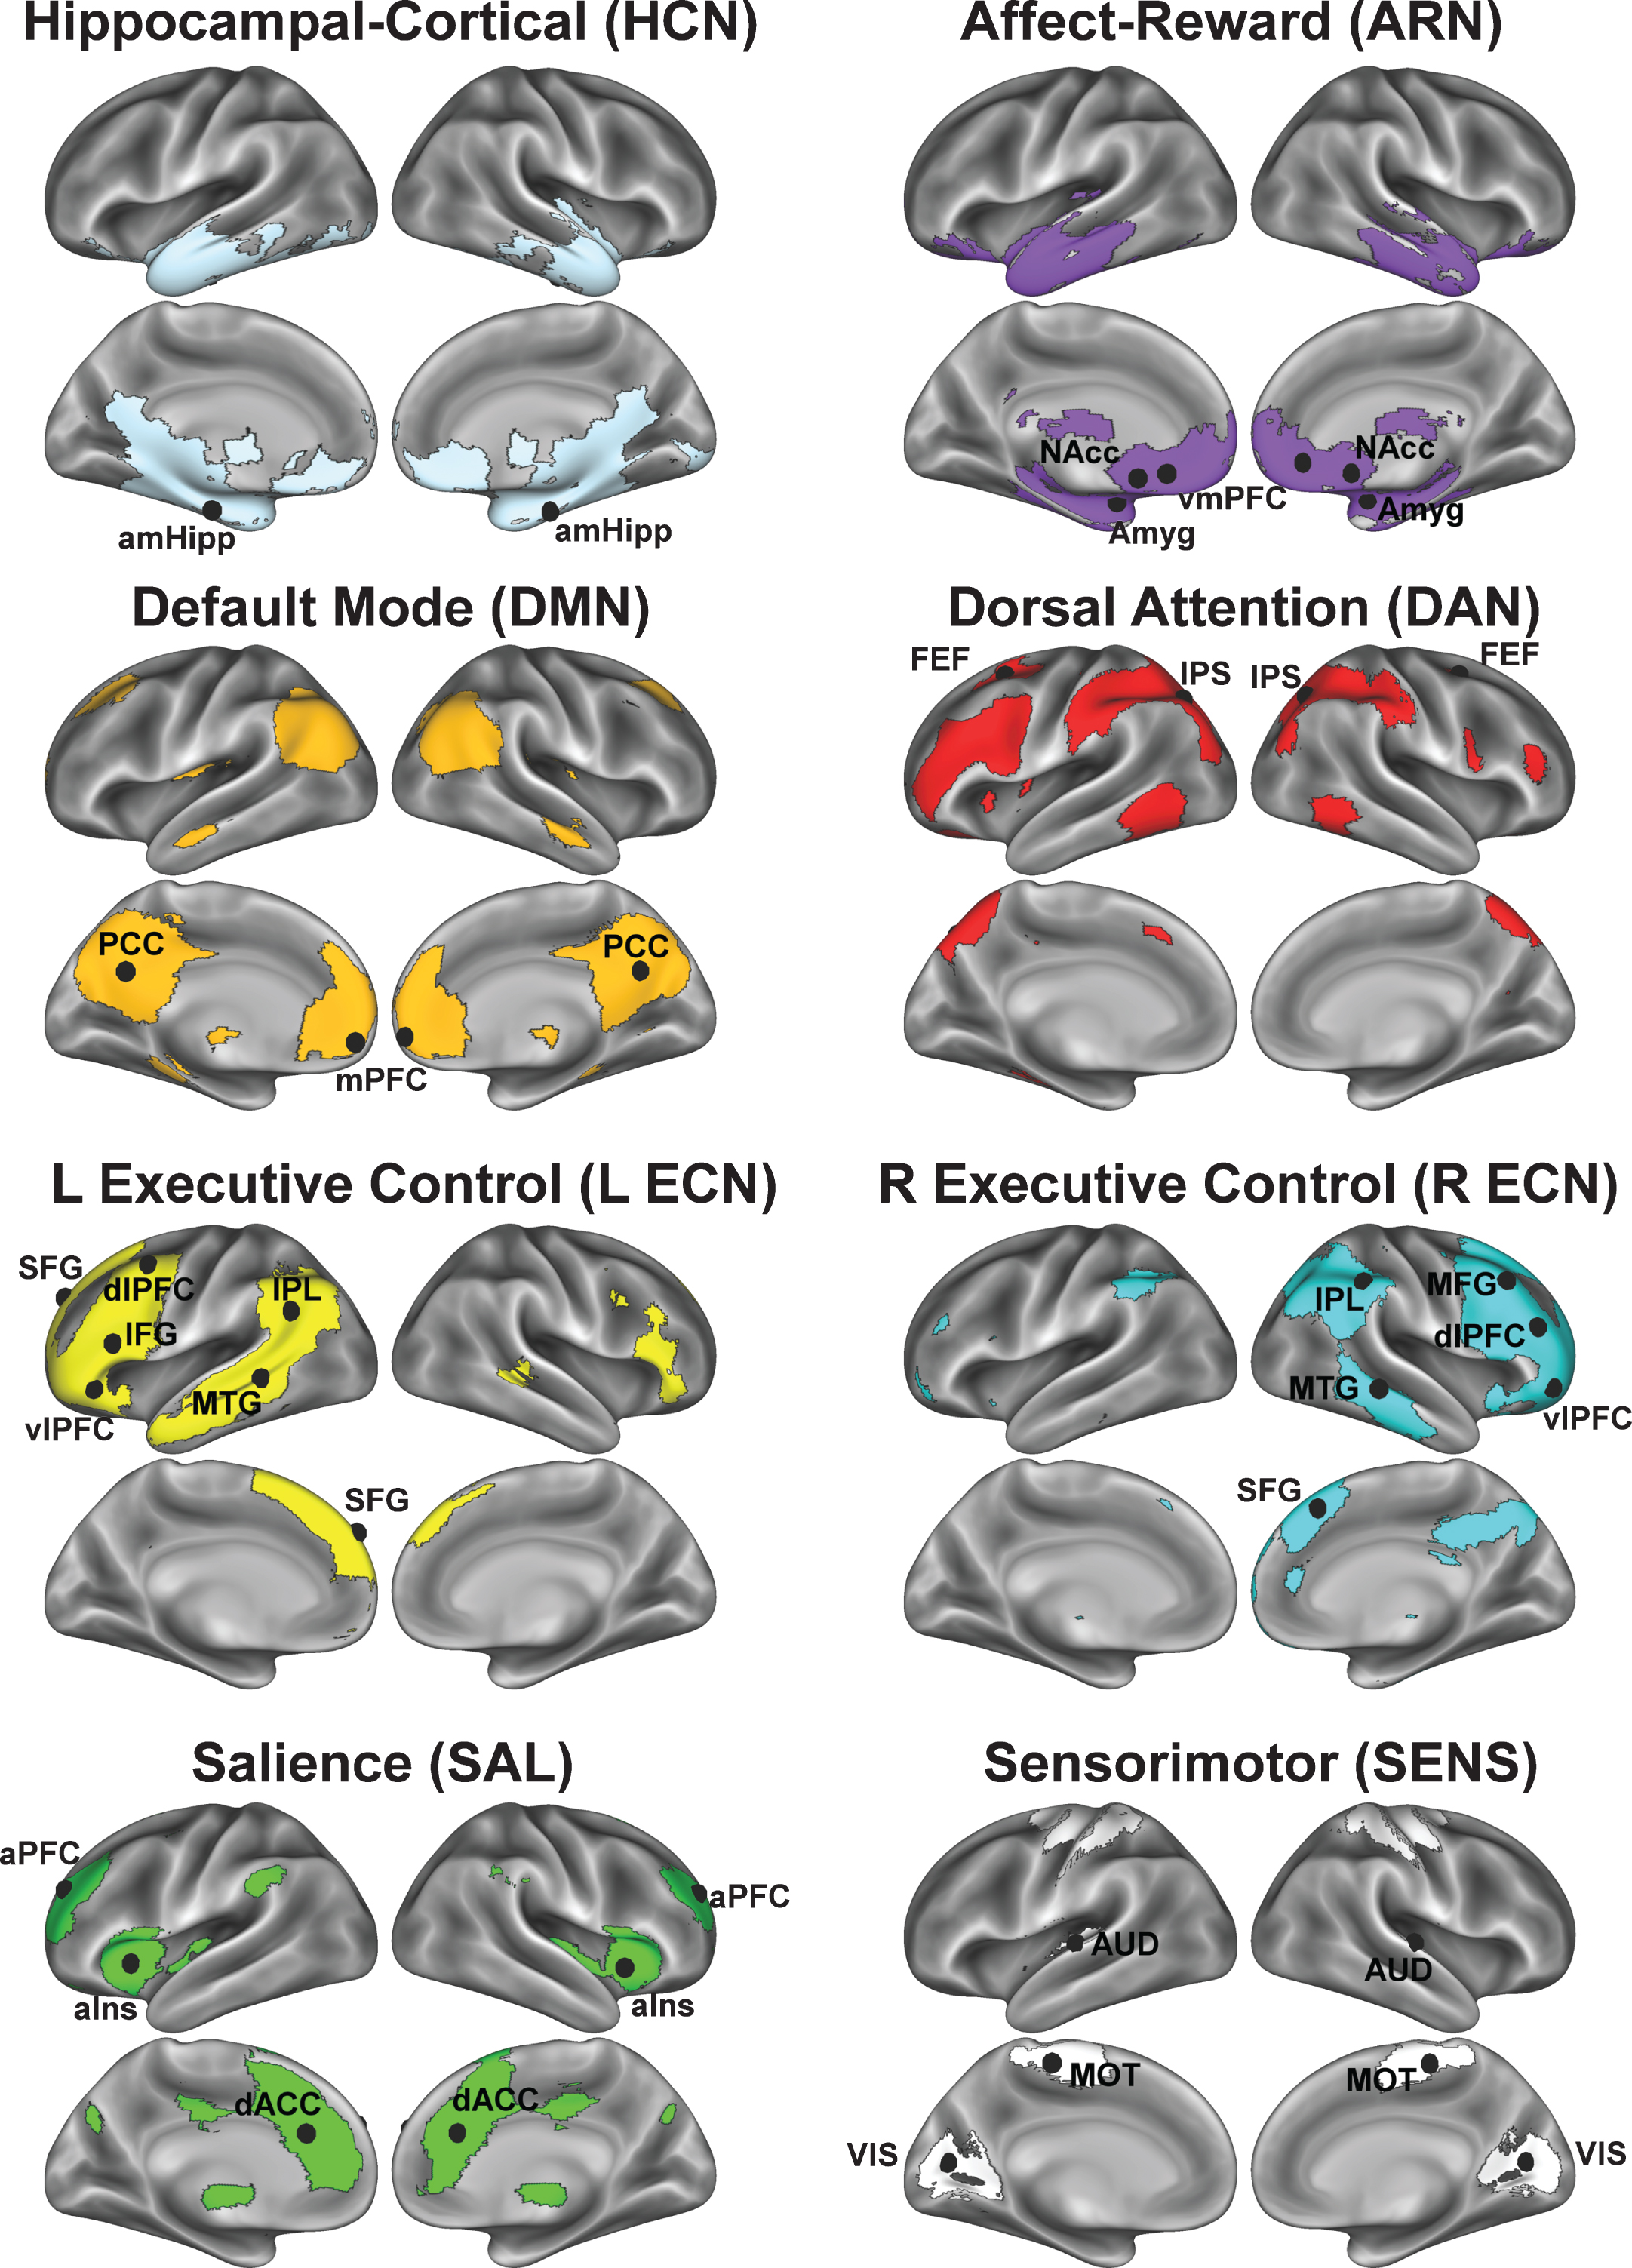
Fig.4
Seed-based voxelwise correlation maps resulting from a significant interaction between time (post-exercise >pre-exercise), exercise condition (active exercise >passive exercise), and age group (younger vs older). For each network, column A illustrates voxels in red-yellow where the active exercise significantly increased FC with the network’s core seed, relative to passive exercise. Columns B-C show voxels where the condition-dependent FC increase interacts with age group. Network templates are shown for reference and the colors correspond to Fig. 3. Imaging results are significant at Z > 1.96 and p < 0.05, corrected for multiple comparisons. The bar graphs in column D show, for each network, mean FC changes (±SEM) at various statistical peaks (differentiated by the colored arrows) for both exercise conditions and for both age groups. The colored arrows in column D correspond to the arrows in columns A-C. The asterisks (*) in column D indicate which regions exhibited a significant change from the pre-exercise FC for each condition based on a two-tailed, one-sample t-test, p < 0.05, uncorrected. Refer to Table 4 for anatomical descriptions of significant clusters, MNI coordinates, and statistical scores.
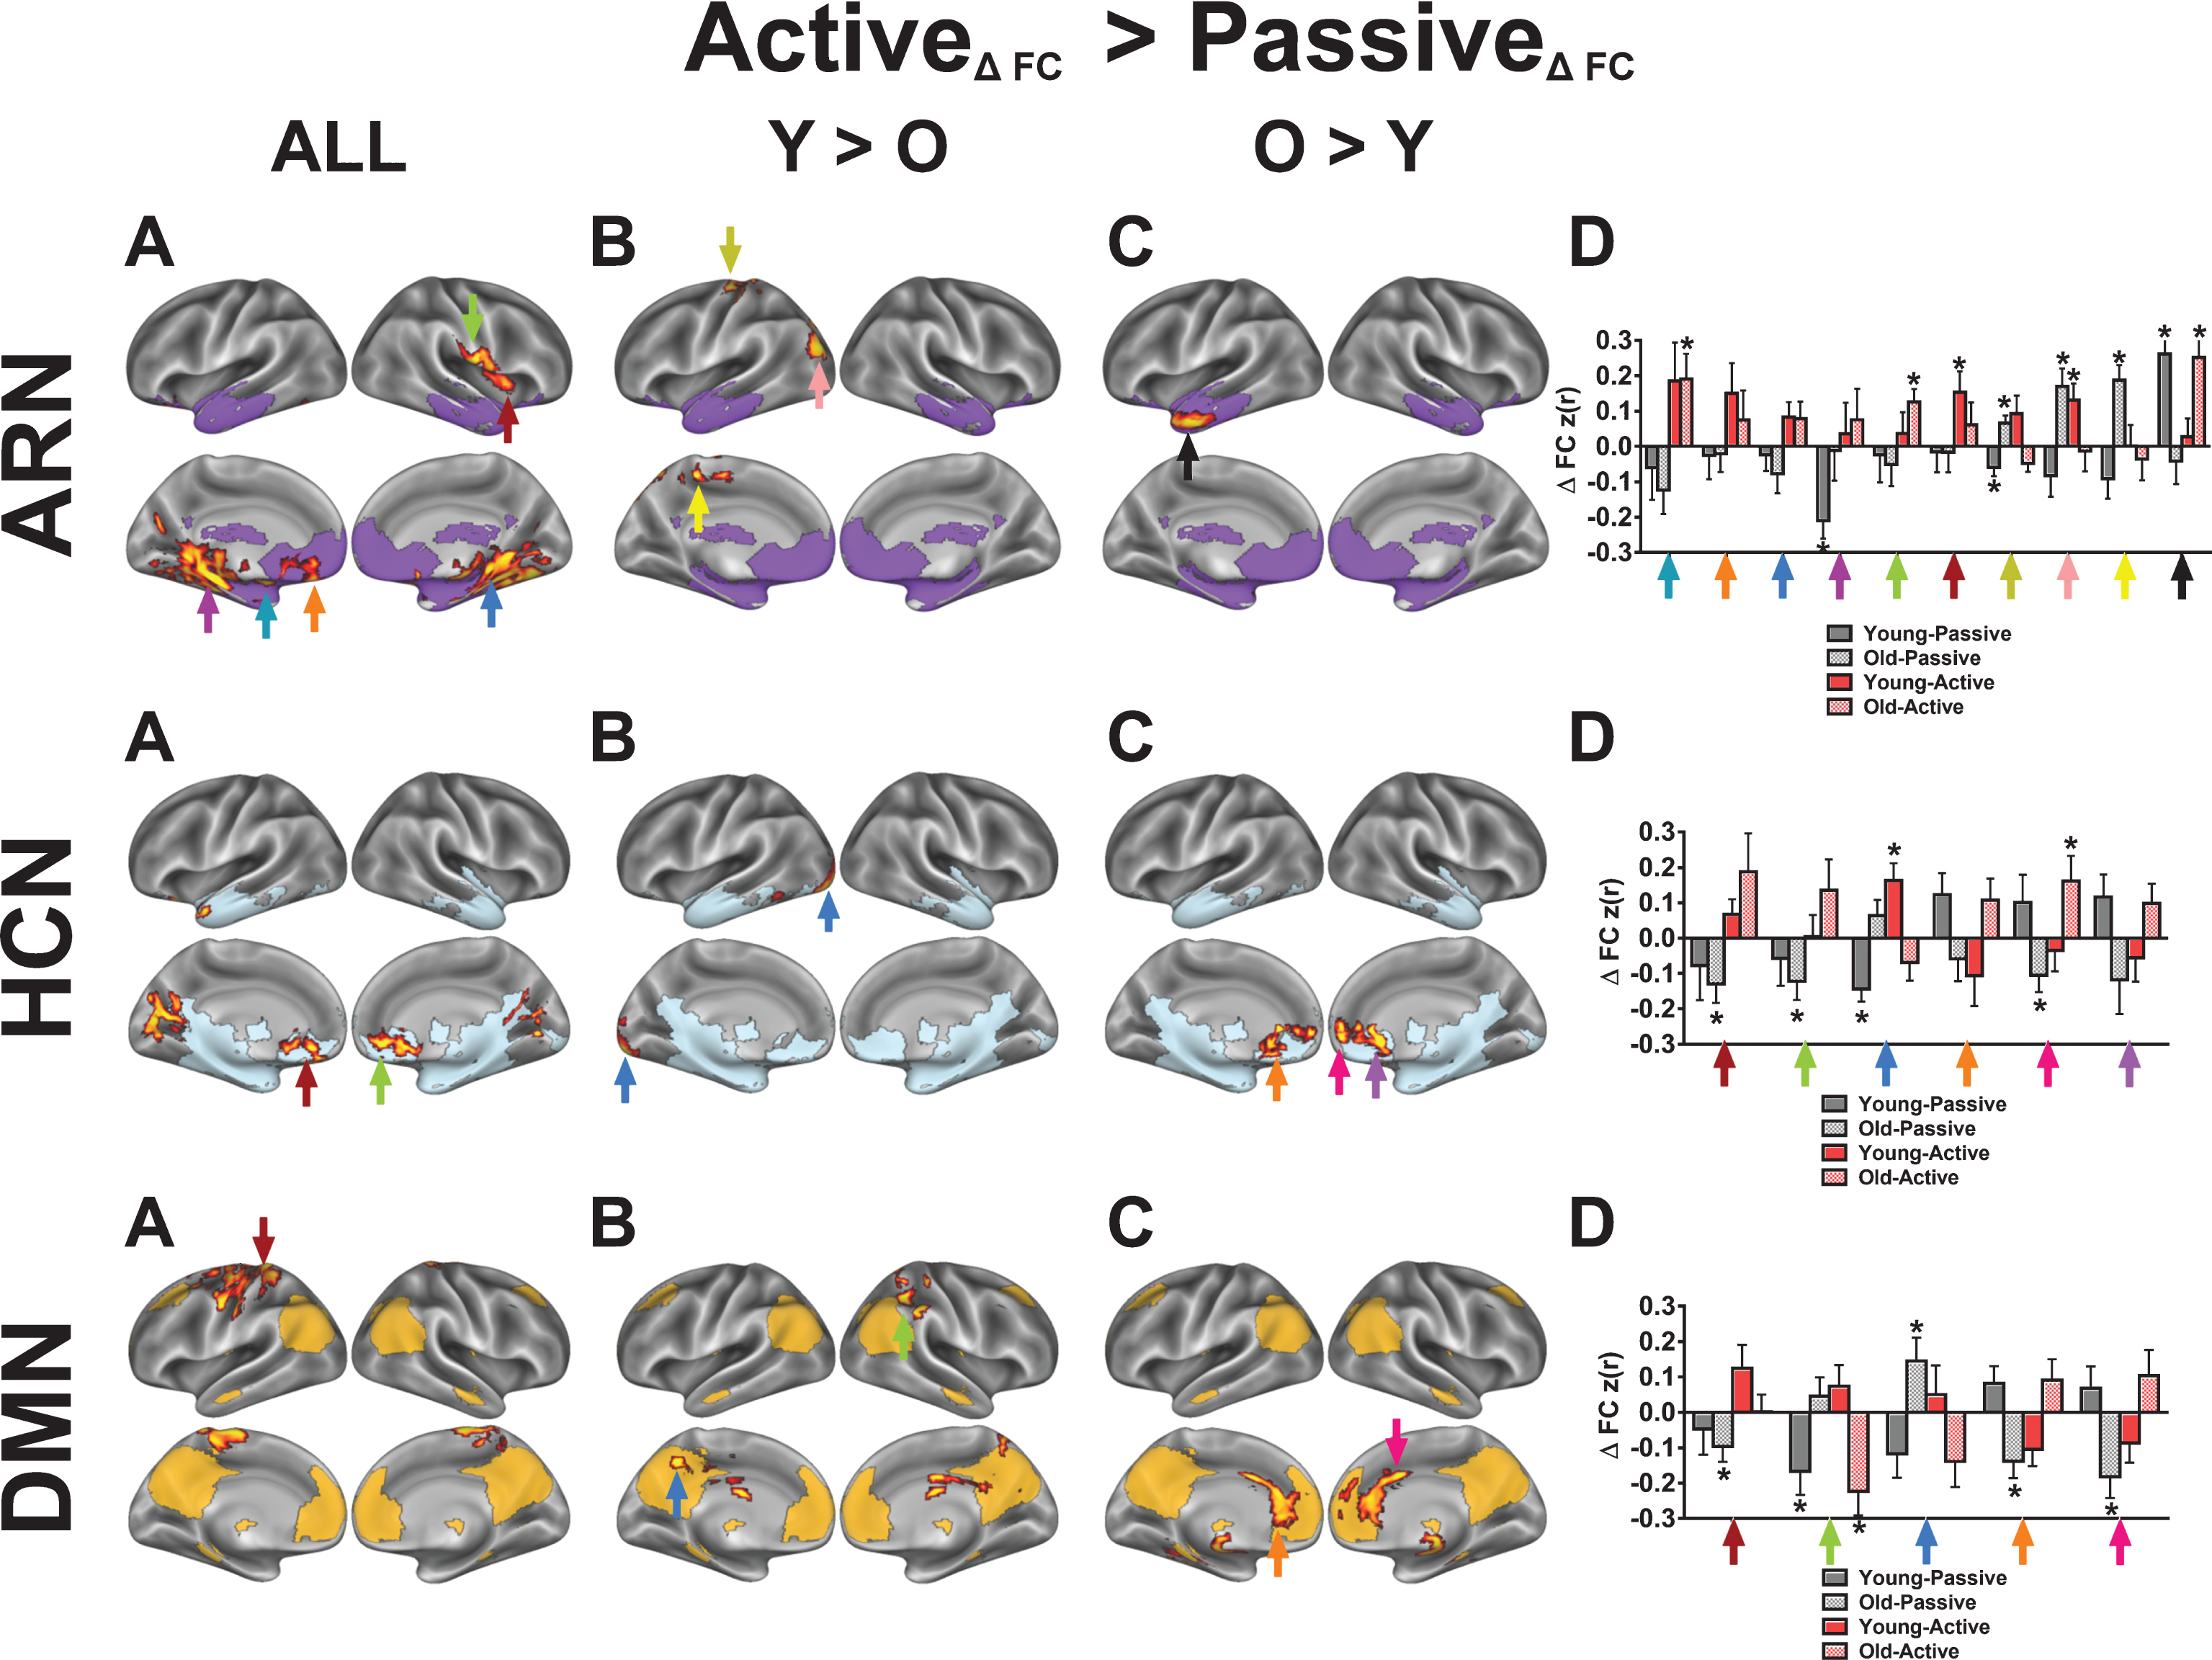
Fig.5
Seed-based voxelwise correlation maps resulting from a significant interaction between time (post-exercise >pre-exercise), exercise condition (active exercise >passive exercise), and age group (younger vs older). For each network, column A illustrates voxels in red-yellow where the active exercise significantly increased FC with the network’s core seed, relative to passive exercise. Columns B-C show voxels where the condition-dependent FC increase interacts with age group. Network templates are shown for reference and the colors correspond to Fig. 3. Imaging results are significant at Z > 1.96 and p < 0.05, corrected for multiple comparisons. The bar graphs in column D show, for each network, mean FC changes (±SEM) at various statistical peaks (differentiated by the colored arrows) for both exercise conditions and for both age groups. The colored arrows in column D correspond to the arrows in columns A-C. The asterisks (*) in column D indicate which regions exhibited a significant change from the pre-exercise FC for each condition based on a two-tailed, one-sample t-test, p < 0.05, uncorrected. Refer to Table 4 for anatomical descriptions of significant clusters, MNI coordinates, and statistical scores.
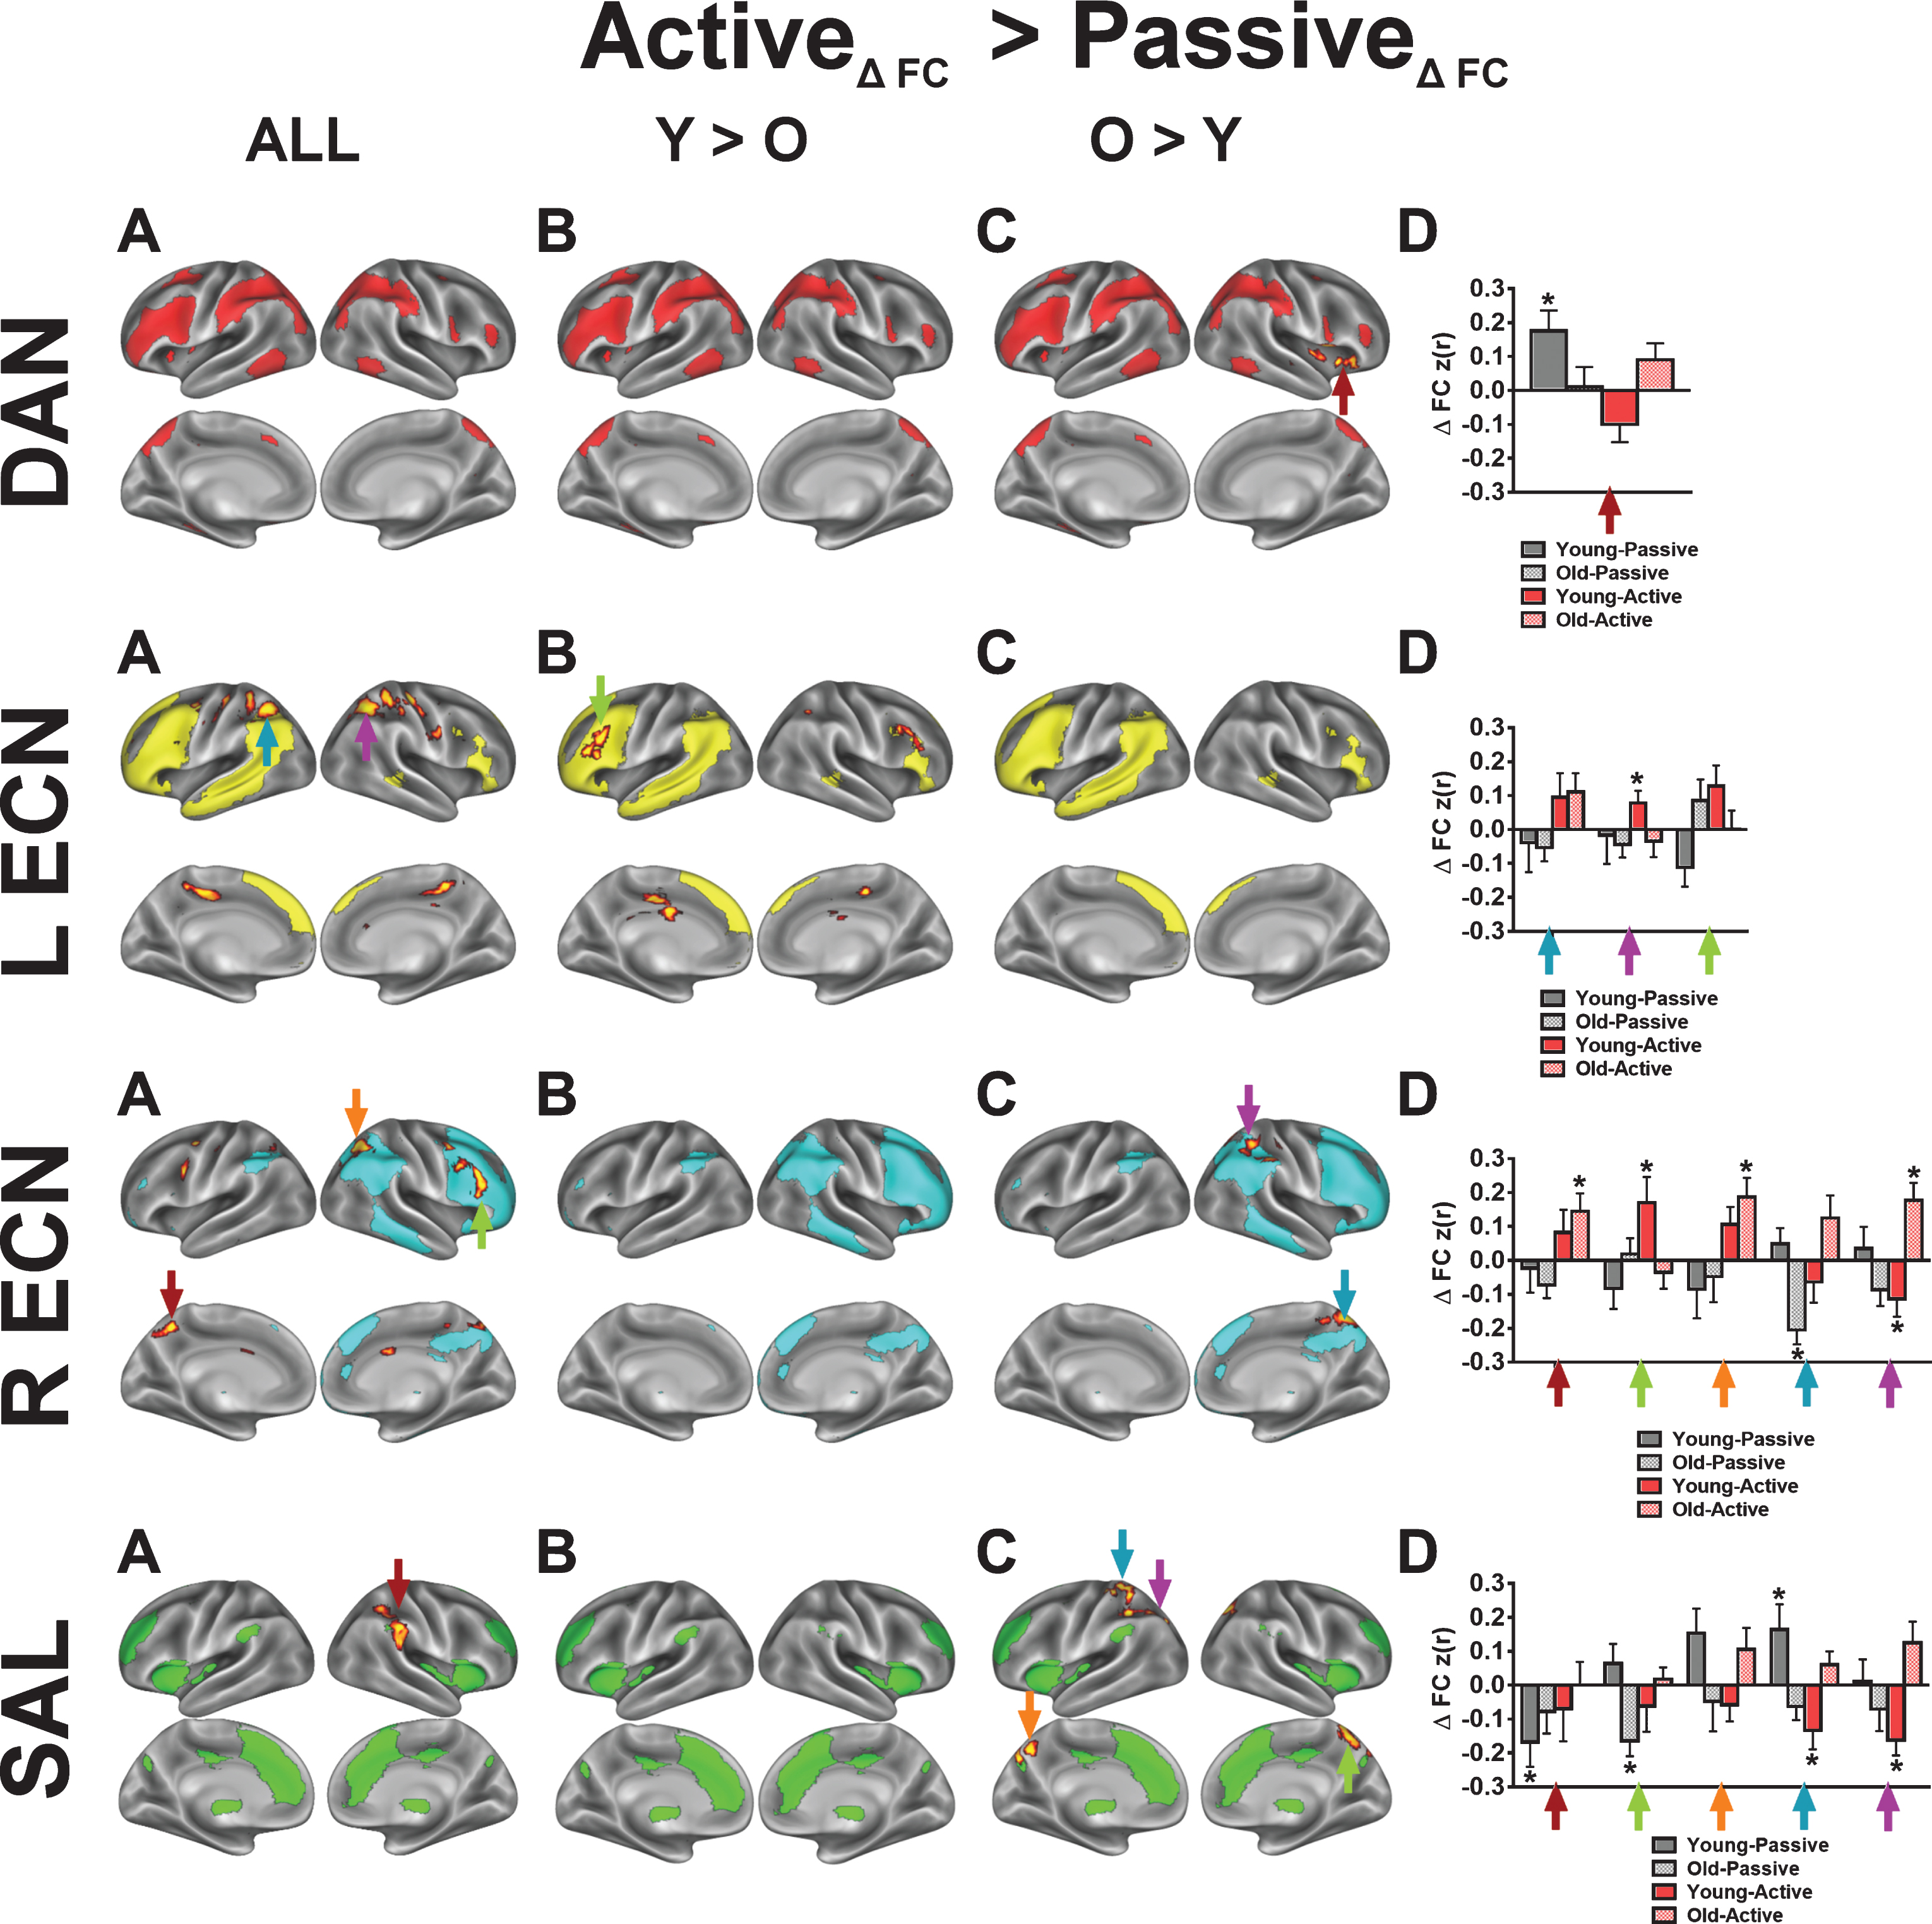
Fig.6
Seed-based voxelwise correlation maps resulting from a significant interaction between time (post-exercise >pre-exercise), exercise condition (passive exercise >active exercise). Imaging results are significant at Z > 1.96 and p < 0.05, corrected for multiple comparisons. Network templates are shown for reference, and the colors correspond to Fig. 3. The colored arrows in the bar graphs correspond to the arrows in the brain surface. The asterisks (*) in indicate regions exhibited a significant change from the pre-exercise FC for each condition based on a two-tailed, one-sample t-test, p < 0.05, uncorrected. Refer to Table 5 for anatomical descriptions of significant clusters, MNI coordinates, and statistical scores.
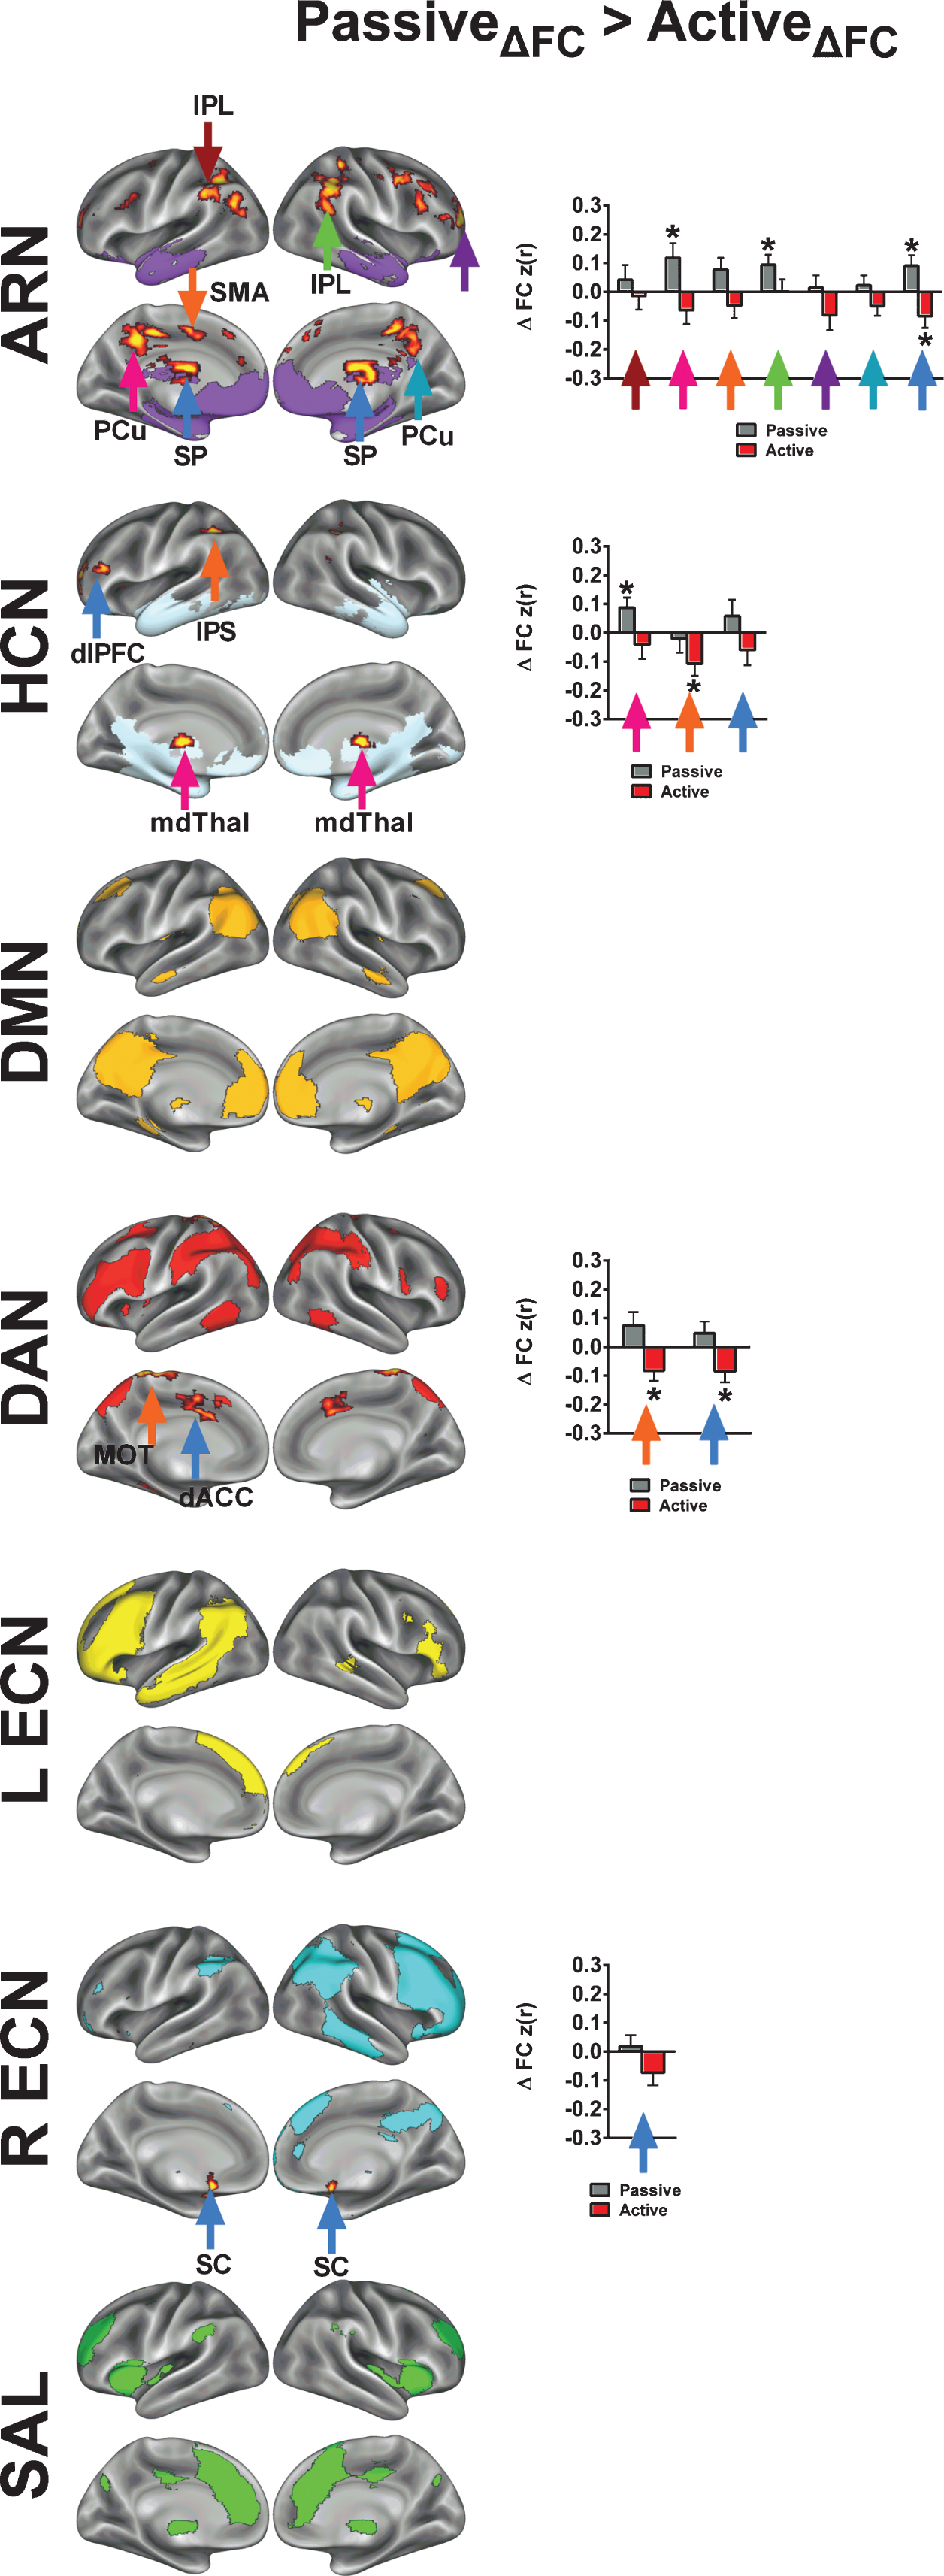
Fig.7
Control analysis for demonstrating the specificity of acute exercise effects toward higher-level cognitive networks. In this control analysis, we examined acute exercise effects on two networks related to sensory and motorprocesses. The colored arrows in the bar graphs correspond to the arrows in the brain surface. The asterisks (*) in indicate regions exhibited a significant change from the pre-exercise FC for each condition based on a two-tailed, one-sample t-test, p < 0.05, uncorrected. Refer to Tables 4 and 5 for anatomical descriptions of significant clusters, MNI coordinates, and statistical scores. Network templates are shown for reference, and the colors correspond to Fig. 3. All results are significant at Z > 1.96 and p < 0.05, corrected for multiple comparisons.
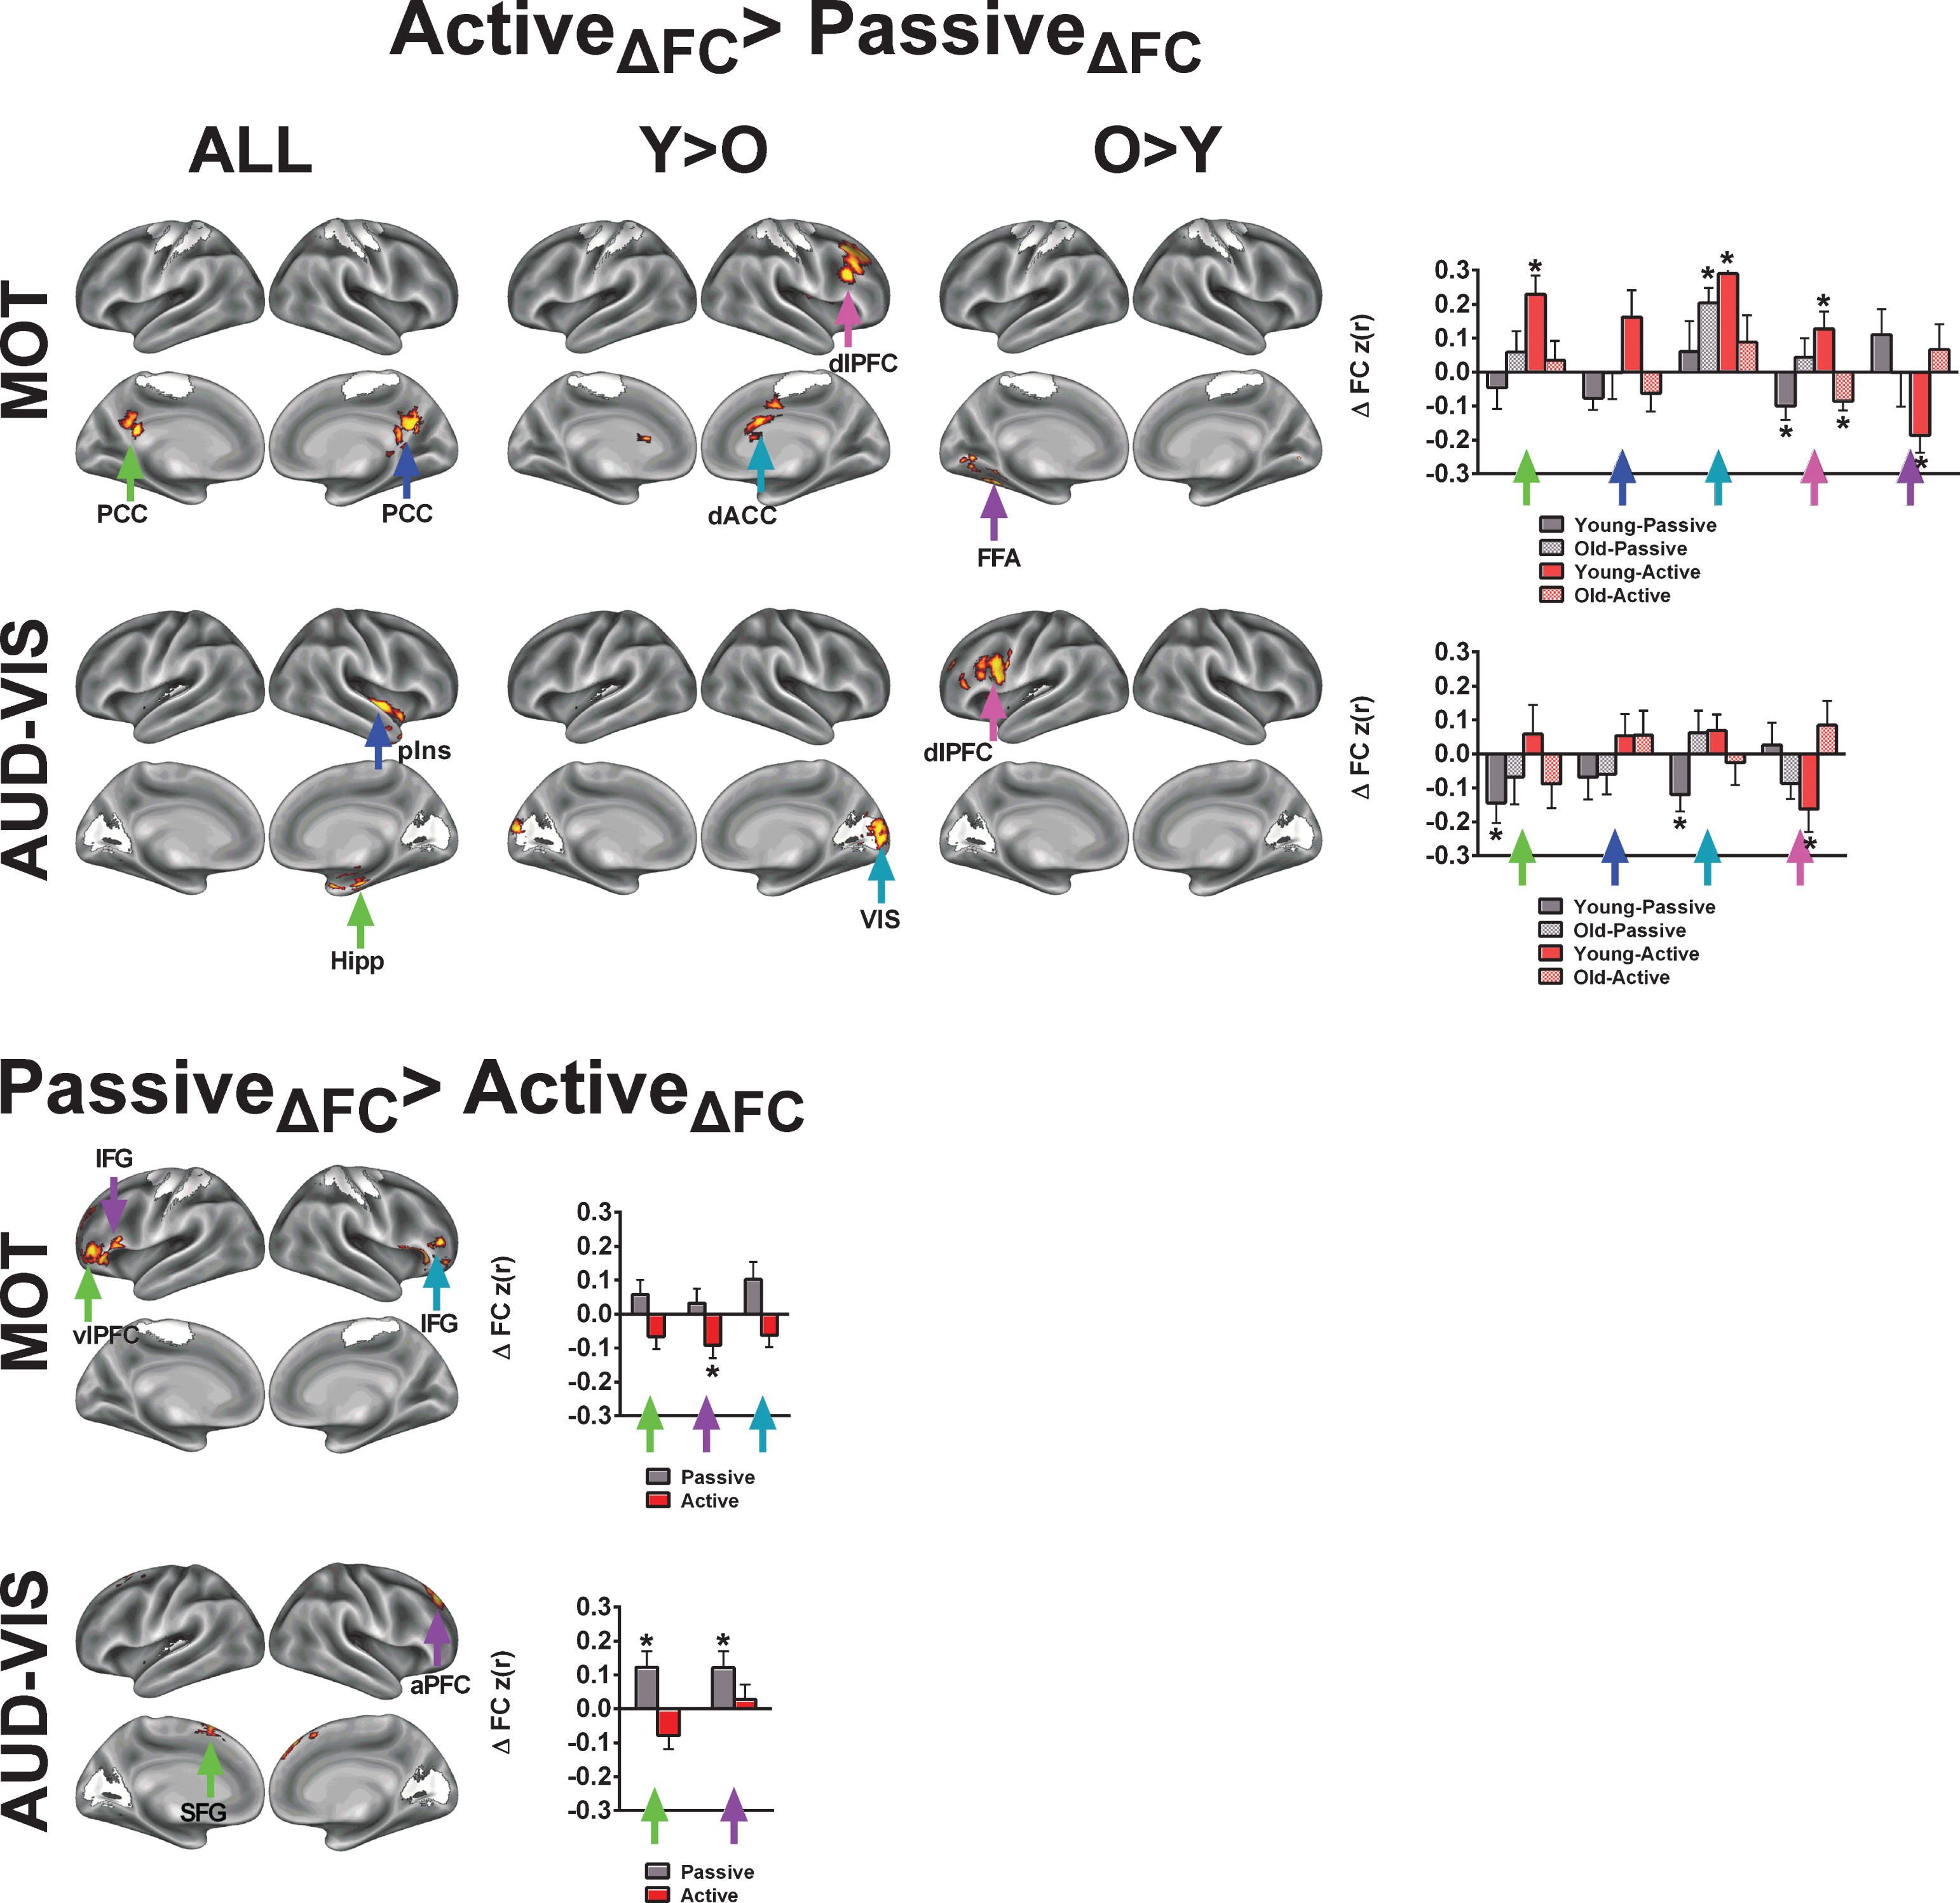
Table 1
Participant demographics
| Variable | Younger (N = 12; 6 females) | Older (N = 13; 6 females) | Y vs. O |
| Age (years) | 23.2 (0.7) | 66.3 (1.0) | p < 0.001 |
| Education (years) | 16.0 (0.5) | 17.2 (1.1) | NS |
| BMI (kg m–2) | 23.3 (1.3) | 25.7 (1.01) | NS |
| Resting HR | 69.0 (3.0) | 65.8 (2.2) | NS |
| Resting SBP | 110.4 (4.5) | 127.2 (4.1) | p < 0.05 |
| Resting DBP | 69.2 (1.6) | 75.5 (1.9) | p < 0.05 |
| Total Godin leisure activity score | 64.2 (6.65) | 57.1 (5.9) | NS |
| HRmax(bpm) | 184.4 (1.4) | 158.9 (4.8) | p < 0.001 |
| Wattmax | 234.0 (18.8) | 170.2 (10.9) | p < 0.01 |
| VO2max(mL/kg/min) | 43.4 (3.01) | 29.5 (1.6) | p < 0.001 |
| VO2maxPercentile(%) | 55.2 (9.2) | 41.5 (9.2) | NS |
Note: Data are presented as Mean (±SE). BMI = body mass index; HR = heart rate; SBP = systolic blood pressure; DPB = diastolic blood pressure. p-values are based on two-tailed independent samples t-tests between age groups. VO2max percentile reflects percentile rank relative to other individuals of the same age and gender.
Table 2
ROIs derived from group ICA
| Regions | ROI label | x | y | z |
| Affect-Reward Network (ARN) | ||||
| Left nucleus accumbens | L NAcc | –10 | 12 | –8 |
| Right nucleus accumbens | R NAcc | 8 | 12 | –6 |
| Left ventromedial prefrontal cortex | L vmPFC | –10 | 30 | –12 |
| Right ventromedial prefrontal cortex | R vmPFC | 10 | 38 | –8 |
| Left amygdala* | R Amyg | –24 | –2 | –20 |
| Right amygdala* | L Amyg | 24 | –2 | –20 |
| Dorsal Attention Network (DAN) | ||||
| Left frontal eye fields | L FEF | –22 | 6 | 48 |
| Right frontal eye fields | R FEF | 28 | –2 | 50 |
| Left intraparietal sulcus | L IPS | –26 | –66 | 44 |
| Right intraparietal sulcus | R IPS | 30 | –62 | 44 |
| Default-mode Network (DMN) | ||||
| Left medial prefrontal cortex | L mPFC | –6 | 54 | –6 |
| Right medial prefrontal cortex | R mPFC | 6 | 58 | –4 |
| Left posterior cingulate cortex | L PCC | –6 | –58 | 28 |
| Right posterior cingulate cortex | R PCC | 6 | –58 | 28 |
| Left Executive Control Network (L ECN) | ||||
| Left dorsolateral prefrontal cortex | L dlPFC | –42 | 6 | 52 |
| Left inferior frontal gyrus | L IFG | –50 | 22 | 20 |
| Left inferior parietal lobule | L IPL | –54 | –58 | 28 |
| Left middle temporal gyrus | L MTG | –58 | –42 | 0 |
| Left superior frontal gyrus | L SFG | –10 | 50 | 36 |
| Left ventral lateral prefrontal cortex | L vlPFC | –46 | 34 | –8 |
| Right Executive Control Network (R ECN) | ||||
| Right dorsolateral prefrontal cortex | R dlPFC | 46 | 38 | 20 |
| Right middle frontal gyrus | R MFG | 42 | 24 | 44 |
| Right inferior parietal lobule | R IPL | 50 | –42 | 48 |
| Right middle temporal gyrus | R MTG | 66 | –34 | –8 |
| Right superior frontal gyrus | R SFG | 6 | 28 | 48 |
| Right ventral lateral prefrontal cortex | R vlPFC | 42 | 50 | –8 |
| Salience Network (SAL) | ||||
| Left anterior insula | L aIns | –34 | 18 | 4 |
| Right anterior insula | R aIns | 38 | 14 | 0 |
| Left anterior prefrontal cortex | L aPFC | –26 | 46 | 28 |
| Right anterior prefrontal cortex | R aPFC | 26 | 46 | 28 |
| Left dorsal anterior cingulate cortex | L dACC | –6 | 26 | 28 |
| Right dorsal anterior cingulate cortex | R dACC | 6 | 30 | 28 |
| Sensory Networks (SENS) | ||||
| Left primary auditory cortex | L AUD | –56 | –18 | 8 |
| Right primary auditory cortex | R AUD | 58 | –14 | 6 |
| Left somatomotor cortex (leg region) | L MOT | –6 | –28 | 58 |
| Right somatomotor cortex (leg region) | R MOT | 6 | –26 | 58 |
| Left primary visual cortex | L VIS | –10 | –70 | 10 |
| Right primary visual cortex | R VIS | 16 | –66 | 10 |
Note: The amygdala coordinates were not derived from the gICA; however, they were included in the network because of their theoretical importance in affect and reward processing. Spherical masks for the amygdala were created from the Harvard–Oxford Subcortical Atlas and added to the ARN.
Table 3
Mean (±SE) values for exercise measures and scan measures following active and passive exercise
| Passive Exercise | Active Exercise | |||
| YA | OA | YA | OA | |
| Exercise heart rate (HR; bpm) | 69.7 (3.5) | 67.3 (2.1) | 118.1 (0.9) | 101.9 (3.3) |
| % HRmax | 37.7 (1.8) | 42.8 (1.8) | 64.1 (0.5) | 64.1 (0.7) |
| RPE | 8.0 (0.5) | 9.3 (0.5) | 12.3 (0.4) | 12.0 (0.3) |
| FAS | 1.8 (0.3) | 1.9 (0.2) | 2.7 (0.2) | 3.0 (0.2) |
| FS | 3.4 (0.5) | 3.2 (0.4) | 2.9 (0.5) | 3.1 (0.2) |
| Post-exercise scan details | ||||
| Time elapsed between exercise cessation and | 23.6 (2.2) | 24.6 (1.02) | 23.2 (1.04) | 23.9 (0.6) |
| start of rs-fMRIscan (min) | ||||
| HR | 57.6 (2.9) | 56.4 (1.04) | 63.1 (2.2) | 62.3 (1.2) |
| % HRmax | 34.3 (1.3) | 35.8 (1.4) | 31.2 (1.5) | 39.5 (1.1) |
| HRpost – HRpre | –5.8 (1.3) | –4.7 (0.7) | 0.3 (1.8) | 2.4 (0.8) |
Table 4
Acute exercise-related increases in functional connectivity
| con | ROI | x | y | z | Z Value |
| ARN | |||||
| c1 | Left amygdala (Amyg) | –16 | –4 | –12 | 4.38 |
| c1 | Right parahippocampal gyrus (PHG) | 26 | –40 | –6 | 4.34 |
| c1 | Left parahippocampul gyrus (PHG) | –32 | –34 | –8 | 4.29 |
| c1 | Right precentral gyrus (MOT) | 66 | –12 | 16 | 3.96 |
| c1 | Left ventromedial prefrontal cortex (vmPFC) | –12 | 40 | –14 | 3.66 |
| c1 | Right anterior insula (aIns) | 40 | 12 | 4 | 3.63 |
| c2 | Left supplementary motor area (SMA) | –14 | –36 | 52 | 3.77 |
| c2 | Left superior parietal lobule (SPL) | –12 | –74 | 60 | 3.56 |
| c2 | Left lateral occipital cortex (LOC) | –38 | –82 | 26 | 3.26 |
| c3 | Left temporal pole (TP) | –54 | 0 | –30 | 4.85 |
| amHippo | |||||
| c1 | Left medial prefrontal cortex (mPFC) | –10 | 40 | –14 | 3.34 |
| c1 | Right medial prefrontal cortex (mPFC) | 8 | 42 | –10 | 3.25 |
| c2 | Left visual cortex (VIS) | –18 | –94 | –12 | 4.49 |
| c3 | Right medial prefrontal cortex (mPFC) | 6 | 50 | 6 | 3.85 |
| c3 | Medial prefrontal cortex (mPFC) | 0 | 30 | 0 | 3.39 |
| c3 | Medial prefrontal cortex (mPFC) | 0 | 24 | –18 | 2.99 |
| DMN | |||||
| c1 | Left postcentral cortex (MOT) | –22 | –36 | 74 | 3.55 |
| c2 | Right superior parietal lobule (SPL) | 44 | –44 | 58 | 3.74 |
| c2 | Left precuneus (PCu) | –8 | –52 | 42 | 2.62 |
| c3 | Dorsal anterior cingulate cortex (dACC) | 2 | 10 | 36 | 3.67 |
| c3 | Medial prefrontal cortex (mPFC) | 2 | 44 | 20 | 3.19 |
| DAN | |||||
| c3 | Right anterior insula/frontal operculum (aIns/FO) | 40 | 18 | 0 | 3.43 |
| L ECN | |||||
| c1 | Left superior parietal lobule (SPL) | –24 | –46 | 50 | 3.94 |
| c1 | Right superior parietal lobule (SPL) | 24 | –38 | 50 | 3.86 |
| c2 | Right dorsolateral prefrontal cortex (dlPFC) | 44 | 26 | 28 | 3.02 |
| c2 | Left dorsolateral prefrontal cortex (dlPFC) | –42 | 32 | 20 | 2.89 |
| R ECN | |||||
| c1 | Right dorsolateral prefrontal cortex (dlPFC) | 46 | 20 | 34 | 3.17 |
| c1 | Right intraparietal sulcus (IPS) | 26 | –60 | 50 | 2.8 |
| c1 | Left precuneus (PCu) | –4 | –56 | 52 | 2.72 |
| c3 | Right intraparietal sulcus (IPS) | 46 | –40 | 54 | 3.93 |
| c3 | Right precuneus (PCu) | 10 | –64 | 62 | 3.36 |
| SAL | |||||
| c1 | Right temporoparietal junction (TPJ) | 60 | –34 | 42 | 3.8 |
| c3 | Right precuneus (PCu) | 18 | –66 | 44 | 3.23 |
| c3 | Left intraparietal sulcus (IPS) | –42 | –42 | 58 | 3.14 |
| c3 | Left intraparietal sulcus (IPS) | –30 | –68 | 36 | 2.97 |
| c3 | Left precuneus (PCu) | –6 | –66 | 44 | 2.44 |
| MOT | |||||
| c1 | Left posterior cingulate cortex (PCC) | –10 | –44 | 24 | 3.35 |
| c1 | Right posterior cingulate cortex (PCC) | 8 | –54 | 22 | 2.99 |
| c2 | Right dorsolateral prefrontal cortex (dlPFC) | 30 | 30 | 50 | 3.41 |
| c2 | Right dorsal anterior cingulate cortex (dACC) | 4 | –6 | 44 | 2.85 |
| c3 | Left fusiform face area (FFA) | –24 | –44 | –14 | 3.05 |
| AUD-VIS | |||||
| c1 | Right posterior insula (pIns) | 36 | –14 | –6 | 3.76 |
| c1 | Right hippocampus (Hipp) | 24 | –16 | –22 | 3 |
| c2 | Right visual cortex (VIS) | 16 | –76 | 20 | 3.24 |
| c3 | Left dorsolateral prefrontal cortex (dlPFC) | –46 | 16 | 30 | 3.05 |
Note: Coordinates of the peak voxels that are displayed in Fig. 3. C1: time (post >pre) × condition (active >passive) interaction; C2: age (young <old) × time (post >pre) × condition (active >passive) interaction; C3: age (old >young) × time (post >pre) × condition (active >passive) interaction.
Table 5
FC increases following Passive Exercise
| ROI | x | y | z | Z Value |
| ARN | ||||
| Right inferior parietal lobule (IPL) | 48 | –48 | 44 | 5.11 |
| Right anterior PFC (aPFC) | 24 | 54 | 16 | 3.9 |
| Septum pallucidum (SP) | 2 | –8 | 18 | 4.17 |
| Right precuneus (PCu) | 16 | –38 | 40 | 4.1 |
| Left precuneus (PCu) | –16 | –44 | 38 | 4.02 |
| Left supplemental motor area (SMA) | –12 | –8 | 50 | 3.24 |
| Left inferior parietal lobule (IPL) | –54 | –44 | 42 | 3.2 |
| amHippo | ||||
| Right dorsolateral PFC (dlPFC) | –44 | 32 | 18 | 2.82 |
| Right intraparietal sulcus (IPS) | –34 | –44 | 38 | 3 |
| Medial dorsal thalamus (mdThal) | 0 | –12 | 10 | 3.01 |
| DAN | ||||
| Right postcentral gyrus (MOT) | 8 | –42 | 74 | 4.19 |
| Right dorsal ACC (dACC) | 6 | 12 | 40 | 3.63 |
| R ECN | ||||
| Subcallosal cortex (SC) | –4 | 12 | –12 | 3.79 |
| MOT | ||||
| Left inferior frontal gyrus (IFG) | –54 | 20 | 28 | 3.24 |
| Left ventrolateral prefrontal cortex | –42 | 44 | 4 | 3.14 |
| (vlPFC) | ||||
| Right inferior frontal gyrus (IFG) | 44 | 32 | 0 | 3.07 |
| AUD-VIS | ||||
| Left superior frontal gyrus (SFG) | 18 | 42 | 44 | 3.4 |
| Right anterior prefrontal cortex | –10 | 16 | 60 | 3.33 |
| (aPFC) | ||||

