Magnetic Resonance of Myelin Water: An in vivo Marker for Myelin
Abstract
Myelin is critical for healthy brain function. An accurate in vivo measure of myelin content has important implications for understanding brain plasticity and neurodegenerative diseases. Myelin water imaging is a magnetic resonance imaging method which can be used to visualize myelination in the brain and spinal cord in vivo. This review presents an overview of myelin water imaging data acquisition and analysis, post-mortem validation work, findings in both animal and human studies and a brief discussion about other MR techniques purported to provide in vivo myelin content. Multi-echo T2 relaxation approaches continue to undergo development and whole-brain imaging time now takes less than 10 minutes; the standard analysis method for this type of data acquisition is a non-negative least squares approach. Alternate methods including the multi-flip angle gradient echo mcDESPOT are also being used for myelin water imaging. Histological validation studies in animal and human brain and spinal cord tissue demonstrate high specificity of myelin water imaging for myelin. Potential confounding factors for in vivo myelin water fraction measurement include the presence of myelin debris and magnetization exchange processes. Myelin water imaging has successfully been used to study animal models of injury, applied in healthy human controls and can be used to assess damage and injury in conditions such as multiple sclerosis, neuromyelitis optica, schizophrenia, phenylketonuria, neurofibromatosis, niemann pick’s disease, stroke and concussion. Other quantitative magnetic resonance approaches that are sensitive to, but not specific for, myelin exist including magnetization transfer, diffusion tensor imaging and T1 weighted imaging.
INTRODUCTION
Myelin is critical for healthy brain function. It plays a fundamental role in determining the speed of action potentials; when myelin integrity is compromised, brain function is affected. Alternatively, when new brain functions are learned or compensatory pathways are formed following neuronal damage, one expects to see increased myelination in the involved nerve tracts. Therefore, an accurate in vivo measure of myelin content has important implications for understanding brain plasticity and neurodegenerative diseases.
Magnetic resonance (MR) imaging provides exquisite contrast and detail in images of the brain. While conventional MR is a highly sensitive but notoriously unspecific technique for imaging brain, more advanced MR techniques have the promise to provide us with much more specific information. In particular in recent years many MR techniques have been developed and implemented for imaging myelination. In this review we shall focus primarily on one of these techniques - myelin water imaging.
It is an interesting time to review myelin water imaging because, while considerable progress has been made over the last 2 decades, the field is still not mature and fundamental questions remain to be explored. There are several reviews on measuring myelin with MR which we encourage the reader to also peruse, for example [1, 2], and on myelin water imaging [3, 4]. This review will cover the basic principles of the myelin water imaging technique and its validation, applications to humans and animal models. We will also briefly review other magnetic resonance approaches developed for monitoring myelination in vivo. Our goal is to present an up-to-date overview of myelin water imaging that includes a comprehensive summary of how this technique has been applied to study development, healthy controls and disease.
Central Nervous System (CNS) tissue
From the point of view of an MR imaging scientist, CNS tissue contains two fundamentally different kinds of cells (myelinated and unmyelinated) and four different locations for water (intracellular, extracellular, between myelin bilayers and cerebrospinal fluid). While the non-aqueous components of CNS tissue, i.e. lipids, proteins and nucleic acids, have complex dynamic structures, 70–85% of brain mass is simply H2O. Unmyelinated neurons and glial cells have single bilayer membranes while myelinated neurons contain multi-bilayer membranes for which approximately 40% of the mass is compartmentalized water (Fig. 1). Note that this highly simplified description of CNS tissue ignores microstructure geometry and blood, both of which have been studied extensively by MRI and other techniques.
MR of CNS tissue
The most common type of MR is known as ‘proton’ MR which is sensitive to signal from all of the hydrogen atoms or protons in CNS tissue. Practically speaking, the majority of the signal measured by MR of brain emanates from hydrogen in water molecules and the reason for this is as follows. The signals from larger, slowly tumbling, molecules such as lipids and proteins decay rapidly to zero because they possess a very wide distribution of MR frequencies. This broad range of frequencies arises from the dipolar fields that hydrogen’s produce at neighbouring hydrogen sites. However, when molecules undergo isotropic tumbling at rapid rates, the aforementioned broad range of signal frequencies is replaced by a much narrower frequency distribution about the average proton MR frequency. This phenomenon, which is known as motional narrowing, occurs for small molecules in CNS tissue. Water makes up 100.0% of such small molecules in CNS tissue [5]. Conventional MR techniques cannot access the rapidly decaying signal from the larger non-aqueous molecules; hence MR images from CNS tissue arise from water. Also, it has been shown that all of the water in CNS tissue has a MR signal which can be detected by MRI [5, 6].
Conventional MR of CNS tissue
There are three fundamental contrast mechanisms in MR: proton density, T1 relaxation and T2 relaxation. Proton density is proportional to water content [7]. T1 relaxation, often called spin-lattice relaxation, is influenced by water content as well as the presence of other tissue constituents such as iron and myelin, and factors including field strength, temperature and MR magnetization exchange processes [8–11]. T2 relaxation, often called spin-spin relaxation, is also related to water content, the nature of the tissue microstructure, iron, pH and MR magnetization exchange. While the detailed mechanisms of T1 and T2 relaxation in CNS tissue are not well understood, these processes provide qualitative contrast weightings that yield superb in vivo visualization of CNS tissue and have proved invaluable as a diagnostic and patient management tool in medicine.
More quantitative MR measurements in CNS tissue
While conventional MR techniques play a crucial role in medical MRI, more quantitative approaches have focused on measuring specific tissue properties [7]. Highly successful examples include measurements of blood flow [12] and of tissue water diffusion [13, 14]. Another type of MR imaging, which has profound applications in the study of brain function and plasticity, is functional MRI [15], which measures the haemodynamic response, or oxygenated blood flow which occurs when brain regions are activated. A number of MR techniques have been developed for in vivo measurement of myelin content. This review will focus mainly on one of these techniques - myelin water imaging.
MYELIN WATER IMAGING: DATA ACQUISITION AND ANALYSIS
The myelin water fraction
It is commonplace to assume that an MRI voxel (i.e. volume element of an image, typically 1–5 mm3) consists of homogeneous tissue. This is an oversimplification and particularly not true when imaging myelinated CNS tissue. While the entire MR signal is from protons on water molecules, as mentioned earlier, individual water molecules can experience very different microscopic environments. For a homogeneous sample (for example a bottle of pure water or CSF fluid), the T2 decay curve, a plot of MR signal vs time from excitation (TE), gives rise to an exponentially decaying signal with rate constant 1/T2. The original myelin water imaging measurements [16, 17] took advantage of the fact that the T2 time of water is determined by its local environment. Myelin water has a T2 time between 10 and 20 ms, while intra- and extra-cellular water has a T2 time longer than 60 ms. If the imaging voxel contains water in several different non-exchanging environments, the resulting T2 decay curve from that voxel is the sum of exponential decays with amplitudes proportional to the relative amounts of water in each environment. In myelin water imaging, the T2 decay curve is separated into its exponential components and expressed as a T2 distribution [18], which is a plot of signal amplitude vs T2 time (Fig. 2). The myelin water fraction (MWF) is generally defined as the ratio of the area in the T2 distribution arising from myelin water (between 10 and 40 ms for humans in vivo) to the area of the entire T2 distribution. MWF can be visually presented as a myelin water image (Fig. 3).
Variants of myelin water imaging
The original in vivo myelin water measurements implemented in the mid 1990s were slow to acquire and produced only a single brain slice in 25 minutes; today it is possible to collect whole brain MWF images in less than 10 minutes. At least four markedly different approaches to myelin water imaging have been explored.
Carr-Purcell-Meiboom-Gill (CPMG) T2
The most common approach, known as the Carr-Purcell-Meiboom-Gill (CPMG) or spin echo method, (e.g. [16, 19, 20] relies on acquisition of the T2 decay curve by application of a 90 pulse followed by a train of 180 pulses. The CPMG approach typically collects images from 32 echoes with spacing between the echoes of 10 ms; i.e. images at 10 ms, 20 ms, ... 320 ms. The CPMG approach can be sped up by a factor of 3 by collecting three images at each echo time [20]. At least two groups, [21–23], implemented a more rapid acquisition by collecting brain volumes for a limited number of echo times using a fast imaging approach (spiral acquisitions) rather than collecting images for each echo time. This approach has been shown to collect full brain myelin water imaging results in as little as 4 minutes [24].
As explained above, for these multiple TE time approaches to MWI, the analysis involves extracting the myelin water signal with the shorter T2 time from the total T2 distribution. Traditionally, this has involved non-negative least squares (NNLS) analysis [18] incorporating regularization by minimizing the square of the solution. For data acquired at 3T, transmitter radio frequency (B1+) inhomogeneity has mandated inclusion of a correction for stimulated echo artifacts due to sub-optimal refocusing pulses [25]. The NNLS analysis makes minimal a priori assumptions about the nature of the T2 distribution. Another approach has been to simplify the analysis by decomposing the T2 decay curves into three log-Gaussian components which are defined to be myelin water, intra/extra cellular water and CSF [26, 27]. While the latter approach may be more robust, problems could arise if the tissue actually contains more than three T2 components. Other approaches to analysis include a multivoxel Bayesian algorithm using spatial prior information which takes into account the expectation that volume fractions and T2 relaxation times of tissue compartments change smoothly within coherent brain regions [28], or a two-Gaussian model to approximate the T2 distribution followed by an expectation-maximization framework with an edge-preserving prior which imposes spatial consistency and smoothness constraints [29]. A mixture of three Wald distributions with unknown mixture weights, mean and shape parameters to represent the distribution of the relative amount of water in between myelin sheets, tissue water, and cerebrospinal fluid has also been employed [30]. As mentioned above, models which underestimate, or overestimate, the number of T2 components may give misleading results. A novel post processing method with an efficient multi-slice acquisition scheme, called T2 spectrum analysis uses a weighted regularized NNLS algorithm and nonlocal mean filter (T2SPARC) [31].
Gradient echo decay curve T2*
While T2 data is acquired from an echo train produced by 180 degree refocusing pulses, T2* decay arises from an echo train derived by magnetic field gradient reversals. T2* decay curves are steeper than T2 decay curves because they are susceptible to inhomogeneous magnetic fields and to local differences in magnetic resonance frequency. Several groups have obtained myelin water images from T2* decay curve measurement [32–35]. These myelin water images are substantially improved when the analysis includes individual resonance frequencies for each of the water pools [33, 34] and when signal loss due to inherent magnetic field gradients is recovered [36]. Another approach uses weighted combinations of measured decay signals in a spatially independent neighborhood to combine tissues with similar relaxation parameters. To determine optimal weighting factors, the authors define a spatially independent neighborhood for each pixel and a distance with respect to decay rates that effectively includes pixels with similar decay characteristics, and which therefore have similar relaxationparameters [37].
T1 Acquisitions
It has been found that measurement of T1 relaxation in CNS tissue yields two components with T1’s of 150–200 ms and 1.0 to 1.5 s [38]. Just as for T2, the shorter T1 component has been associated with myelin water. By making an image of only the shorter T1 components in CNS tissue, images which look much like myelin water images have been created [39]. A disadvantage of T1 approaches for measuring myelin water is that they are vulnerable to magnetization exchange effects [40].
mcDESPOT
The mcDESPOT technique [41] is fundamentally different from myelin water imaging techniques which are derived from T2 or T2* decay curves. mcDESPOT makes use of the flip angle dependence of two fast gradient echo imaging sequences (a spoiled gradient sequence and a balanced free precession sequence) to enable extraction the myelin water and intra/extracellular water components in CNS tissue. An advantage of mcDESPOT is that it enables whole brain myelin water fraction imaging with high spatial resolution in a relativelyshort time.
VALIDATION OF MYELIN WATER IMAGING
Animal studies
Peripheral nervous system
The first observations of a short T2 component in myelinated tissue were reported in frog sciatic nerve in the 1960’s and 70’s [42, 43]. Several decades later the effect of peripheral nerve injury was examined in a number of rat models. In a study of injured rat sciatic nerve, Webb et al. demonstrated that MWF reflected myelin loss and remyelination, due to Wallerian degeneration and regeneration [44]. Using tumor necrosis factor-alpha to induce inflammation with little demyelination and axonal loss in rat sciatic nerve, Stanisz et al. found that multicomponent T2 was the best at distinguishing between inflammation and demyelination [45], while other MR methods (magnetization transfer) were more likely to be influenced by both changes in myelin and pH. Pun et al. and Odrobina et al. examined the effect of demyelination induced by tellurium on the sciatic nerve of rats, with both MR and histology [46, 47]. Tellurium treated animals showed a decrease in healthy myelin in the sciatic nerve and a decrease in the area of the short T2 component; a strong correlation was observed between the degree of myelin staining and the size of the short T2 component (R2 = 0.59). In comparison to other MR methods (T1 relaxation) also used in these studies, the MWF was the best measure of demyelination. Finally, demyelination mediated by dithiocarbamate revealed a decreased contribution from the shortest T2 component in multicomponent T2 spectra, consistent withdemyelination [48].
Central nervous system
Myelin water in CNS white matter was first observed in a cat model in 1991[49]. Shortly there afterwards, guinea pigs with experimental autoimmune encephalomyelitis (EAE) demonstrated reduced MWF consistent with histologically confirmed myelin loss in both the brain and spinal cord [6, 50]. More recently, a strong correlation between MWF in rat spinal cord and histological staining for myelin was observed [51], and a remyelinating mouse model found that MWF increased with remyelination [52]. Longitudinal assessment of MWF in vivo correlates with myelin staining to accurately characterize white matter damage in a dorsal column transection model of rat spinal cord injury [53].
Human studies
Several studies using human tissue have examined the relationship between MWF and histological staining for myelin. Evidence to date suggests that there is minimal change of the myelin water signal post mortem, both shortly after death in-situ and upon tissue fixation with formalin [54], making such correlative studies possible. The T2 distribution of formalin fixed CNS tissue is qualitatively similar in shape to that from in vivo, although the T2 s are shifted to shorter times. A good qualitative correspondence was first observed between MWF in formalin fixed brain and the anatomical distribution of myelin by Moore et al. [55] as indicated by the myelin phospholipid stain Luxol Fast Blue (LFB) [56–59]. Follow-up brain sample studies demonstrated an excellent quantitative correlation between MWF and LFB optical density at both 1.5T and 7T (Fig. 4) [54, 60]. Similarly, comparisons between MWF and myelin staining in human spinal cord also show excellent correspondence between the MR and histology markers formyelin [61].
MYELIN WATER IMAGING IN HUMANS
Development
Myelination in humans begins in the fifth fetal month. Rapid myelin growth occurs during the first two years and continues throughout life until the 6th decade [62, 63]. The onset of myelination is marked by a rapid increase in brain lipid and protein content and a corresponding decrease in brain water content [64]. Conventional T1 and T2 weighted imaging show changes in contrast in both white and grey matter due to these rapid changes in brain tissue and water content [65]. However, conventional imaging is not specific to myelination.
Myelin water imaging can provide more quantitative information about myelin content in the developing brain. Applying this method in pre-term infants is feasible, and demonstrates variation in brain MWF for different brain structures [66, 67]. Using the mcDESPOT technique, several studies have reported the pattern of normal myelin development from 2.5 months to 5.5 years of age (Fig. 5) [68–71]. These studies demonstrate a spatial temporal pattern of myelination beginning in the cerebellum, pons, and internal capsule; proceeding caudocranially from the splenium of the corpus callosum and optic radiations (3–4 months) to the occipital and parietal lobes (4–6 months) and then to the genu of the corpus callosum and frontal and temporal lobes (6 –8 months). This pattern of myelination is consistent with reports of myelination begining in posterior regions before anterior regions of the brain [72]. Distinct male and female developmental patterns were observed, and significant relationships between myelin content and measures of cognitive function were demonstrated [70]. Examining slightly older children with a multi-echo approach, Whitaker et al. [73] found that the number of highly myelinated voxels in the corpus callosum was strongly correlated with verbal IQ tests in a study of preadolescent children (9–12 yrs). However, the number of highly myelinated voxels did not correlate with age. Based on myelination trajectory observations in healthy infants, toddlers and young children, Deoni et al. developed a model that may be useful for identifying developmentalabnormalities [69].
One factor which may influence development is breastfeeding. The prevailing consensus suggests that breastfeeding is associated with higher IQ and improved cognitive functioning. Using mcDEPOST myelin water imaging, it was demonstrated that breastfed children exhibited increased white matter development in later maturing frontal and association brain regions [74]. Positive relationships between white matter microstructure and breastfeeding duration were also observed in several brain regions anatomically consistent with improvements in cognitive and behavioural performance measures [74]. A commentary on this study raises the possibility that the premature introduction of cow’s milk in the second year of life may also negatively influence cognitive development [75].
A second factor which may be linked to cognitive performance is the presence of the apolipoprotein E (APOE) ɛ4 allele, a major susceptibility gene for late-onset Alzheimer’s disease. The presence of this gene may influence brain development already in infancy, as demonstrated by a recent myelin water MRI study where it was found that infant ɛ4 carriers had a lower myelin water fraction than noncarriers in areas of the brain preferentially affected in Alzheimer’sdisease [76].
Healthy adults
Brain
In healthy adults, white matter has substantially larger MWF than grey matter. Myelin water in the brain varies between different white matter areas by more than a factor of 2 [17, 22, 77–80]. Reproducibility and reliability of MWF in healthy controls, both at a single site and multiple sites is very good [81–84]. Regional MWF differences are believed to reflect differing regional myelin concentrations (Fig. 3). One study found that MWF in males was significantly greater than females for the rostral body (p < 0.05) and posterior midbody (p < 0.005) while splenium MWF in males was significantly less than that in females (p < 0.05) [85]. Frontal lobe MWF is correlated with age, as well as years of education, in normal adults (Fig. 6) [86], and a second study by the same authors found significant positive relationships between regional MWF and age, North American Adult Reading Test (NAART) IQ, and years of completed education in healthy volunteers [87]. Recent work using mcDESPOT found a positive correlation between activity level and MWF in the right parahippocampal cingula [88].
Spinal Cord
Myelin water techniques applied in the brain can also be used to study spinal cord myelination. However, imaging the spinal cord is difficult for a number of reasons including magnetic field inhomogeneties, the presence of flow from CSF and the small diameter of the cord. Nevertheless, several T2 studies have shown the feasibility of measuring MWF in spinal cord in vivo. MWF has been found to be approximately 50% higher in spinal cord than normal brain white matter and is reported to vary along the length of the cord [19, 89–92]. Younger adults (20–30 years old) are reported to have a lower cervical cord MWF compared to older (50–75 yr) study participants [91]. An indepth review of myelin water in the cord can be found elsewhere [93].
Multiple sclerosis
Multiple sclerosis (MS) is an autoimmune disease of the CNS that is characterized by edema, inflammation, demyelination and axonal loss [94]. Given that myelin damage is a key component of MS pathogenesis, much of the pioneering work in myelin water imaging began in the field of MS.
Lesions, or focal plaques, which appear bright on proton density and T2 weighted imaging were the initial focus for imaging myelin in MS (Fig. 7). MWF has been shown to be variably decreased in MS lesions [16, 21, 77, 78, 84, 95–99]. On average, lesions show ∼50% less MWF than normal appearing white matter (NAWM) [77], however, myelin loss in MS lesions is extremely heterogeneous with some lesions having no myelin, and others having normal, or near normal, white matter levels [77, 95, 99]. Lesion variability likely reflects different lesion pathologies, as MWF does differ between T2 weighted lesions, contrast enhancing lesions and T1 black holes [99, 100]. Using discriminant function analysis, Vavasour et al. found that myelin water was most important in separating lesions based on their age, clearly delineating lesions less than one year old from lesions older than one year. This suggests there is a time dependence to demyelination in new lesions; on average, lesions less than a year old had only slightly reduced myelin water, whereas lesions at least one year old had a larger reduction in myelin water [100]. However, whether lesions less than a year old have a higher myelin water because of an absence of demyelination or due to the presence of a cycle of demyelination and remyelination is notclear.
Longitudinal assessment of MWF in MS can provide insight into the processes of demyelination and remyelination. Several studies have demonstrated reductions and subsequent increases in MWF as lesions develop and resolve over the time scale of months [84, 101, 102]. A serial study examining larger lesions showed low myelin water in the core of the lesion upon first appearance, which suggests demyelination may be present in the early stages of lesion development [101]. Several months later, one lesion showed a reduction in low MWF volume, reflecting remyelination, whereas the volume of low myelin water in the second lesion remained low and constant, suggestive of a failure to repair.
Normal appearing white matter (NAWM) are areas of brain and spinal cord which appear ‘normal’ on standard clinical imaging. Much effort has also been put into studying NAWM in MS, which is known from post-mortem histological studies to demonstrate myelin abnormalities demyelination [103–107]. MWF of NAWM was found to be diffusely reduced in both brain (by 6–37%) [21, 77, 96, 99, 102] and spinal cord (by 11–25%) [19, 90] when compared to healthy controls. NAWM MWF can distinguish between different subtypes of MS [108] and reduced brain MWF is also related to increased disability [96, 108], suggested that more global disease process can influence clinicalstatus.
Longitudinal changes in MWF can also be measured in NAWM, for example examining the cervical cord in primary progressive multiple sclerosis found a 10% decrease in MWF over 2 years, suggesting ongoing demyelination may be contributing to the disease process in this subgroup of patients [90]. Of course, such diffuse myelin loss could be due to concomitant loss of axons in Wallerian degeneration as reported in NAWM [109–111].
Diffusely abnormal white matter (DAWM) is a third subtype of white matter observed in MS brain [112]. DAWM is typically periventricular and consists of regions of mild hyperintensity with a poorly defined boundary on proton density and T2 weighted imaging. Since DAWM is only now becoming more recognized, it is possible some of the previous studies on NAWM may have included DAWM in their assessments. MWF is reduced in areas of DAWM by approximately 23% in vivo and 30% in post mortem tissue relative to adjacent NAWM, and appears to be a very sensitive indicator of pathology [113, 114]. Post mortem work correlating MWF with histological staining for different components of the myelin bilayer finds a selective loss of myelin lipids with relative preservation of myelinproteins [115].
Because MS is a characterized by a variety of pathological processes, it is important to consider other possible sources for changes in MR markers claiming to be specific for myelin. Changes in water content (WC) arising from inflammation or edema can influence MWF as this measure is a ratio of the myelin water signal to the total signal from all water, hence decreases in MWF could arise from increases in WC. However, modeling shows that the observed increases in WC in MS of about 2% should only result in about a 2% decrease in MWF, while the observed MWF decrease is about 15%. If the MWF decreases observed in lesions and NAWM were to have occurred purely due to increases in WC, the volume increases would have to have been larger than 15% making this scenario unrealistic [77]. Nevertheless, it is important to keep in mind that small changes in MWF can certainly, at least in part, arise from an increase in water content.
Neuromyelitis Optica (NMO)
Neuromyelitis Optica is a rare relapsing autoimmune disorder that preferentially causes damage to the optic nerve and spinal. Several studies have examined differences in MWF between MS and NMO. One report indicates that myelin water fraction in MS lesions is more greatly reduced [98], thereby suggesting that myelin loss is more severe in MS than in NMO. In contrast, in a combined transcranial magnetic stimulation / myelin water fraction study, the degree of damage was found to be greater in NMO than MS: NMO showed larger reductions in corticospinal tract recruitment curves and lower MWF than MS and controls [116]. The differing results between the Jeong and Manogaran studies may reflect differences in patient populations, especially considering that MS is such a heterogeneousdisease.
Schizophrenia and first episode psychosis
Schizophrenia is characterised by disorganized thinking, hallucinations, delusions, changes in behaviour and changes in emotions. Schizophrenia often develops during the late teens or early 20’s, during the time of myelination in frontal brain regions. The cause of schizophrenia is unknown, but there is growing evidence of neuronal and oligodendrocyte-related abnormalities, including myelin and fatty-acid biosynthesis dysfunction based on post-mortem brain studies [117], abnormal expression of myelin-related genes [118] and damage to the myelin sheath due to the formation of concentric lamellar bodies and decreased volume density of mitochondria in oligodendrocytes [119]. Myelin water imaging studies support evidence of myelin-related abnormalities in the white matter of people with schizophrenia. Flynn et al. found a 12% decrease in global white matter MWF and a 36% reduction in left genu MWF in schizophrenia subjects when compared to controls [86]. Furthermore, the relationship between white matter MWF with both age and years of education observed in healthy controls is absent in schizophrenia (Fig. 6) [86]. A second, more recent study, found altered patterns of association between age, years of education, and MWF in people with first episodes of psychosis, suggesting that subtle disturbances in myelination may be present early in the course of their disease [87].
Phenylketonuria
Phenylketonuria (PKU) is a metabolic disorder whereby people lack the ability to metabolize the amino acid phenylalanine (PHE). Most affected individuals who are not treated with a diet restricted in PHE develop severe mental retardation. Several studies have described myelin abnormalities in the brain and spinal cord of people with PKU [120–124]. Using myelin water imaging, Sirrs et al. found the MWF to be reduced in PKU by up to 56% in normal appearing white matter; a reduction in MWF was also reported in diffuse white matter lesions [125].
Autism
Autism continues to increase in prevalence and some evidence suggests abnormal white matter anatomy and impaired brain connectivity may play an important role in this disease’s symptomology. To study the role of myelin in autism Deoni et al. employed the mcDESPOT method to compare 14 individuals with autism and 14 age- and IQ-matched controls [126]. Individuals with autism showed widespread MWF differences compared to controls. In particular, worse current social interaction skills were related to reduced MWF.
Stroke
At least one study has examined myelin water in ischemic stroke [83]. Borich et al. examined 20 individuals with ischemic stroke and 12 matched healthy controls. Reduced MWF was observed in whole-cerebrum white matter (p < 0.001) and in the ipsilesional (p = 0.017) and contralesional (p = 0.037) posterior limb of internal capsule (PLIC) after stroke compared to whole-cerebrum and bilateral PLIC MWF in healthy controls (Fig. 8). These observations provide novel insight into myelin specific tissue changes that occur in stroke, and may have important consequences for understanding neuropathology of stroke.
Neurofibromatosis
Unidentified bright objects (UBOs) are often observed in neurofibromatosis-1 (NF1), a genetic disease which causes tumors along the nervous system. The histopathological basis of these UBOs is not clear. Billiet et al. examined 17 patients with NF1 and found no significant alterations in MWF (Fig. 9), which suggests demyelination is unlikely to be present in UBOs which appear to be mainly caused by a shift towards a higher T2-value of the intra- and extracellular water pool [127]. The authors suggest the appearance of UBOs may arise from altered microstructural compartmentalization, and an increase in ‘extracellular-like’, intracellular water, possibly due to intramyelinic edema.
Niemann-Pick disease
Niemann-Pick disease is a rare progressive genetic disorder characterized by an inability of the body to transport cholesterol and other fatty substances (lipids) inside of cells. This leads to the abnormal accumulation of these substances within various tissues of the body, including white matter. In a small case study, Davies-Thompson et al. used myelin water imaging to examine demyelination in 2 patients with Niemann-Pick disease type C [128]. The results suggest that this technique may be useful for identifying regional changes in myelination in thiscondition.
Primary lateral sclerosis (PLS) and Amyotrophic lateral sclerosis (ALS)
Both PLS and ALS are progressive demyelinating diseases which targets the motor neurons of the CNS. Diagnosis of PLS and ALS is clinical, and it may be difficult to distinguish the two diseases at the early stages. Kolind et al. studied 23 ALS, 7 PLS and 12 controls using mcDESPOT and found that PLS patients were distinguished by widespread cerebral MWF reductions, independent of disease duration and clinical upper motor neuron burden, while ALS patients showed a significant increase in intra- and extra-cellular water, indirectly linked to neuroinflammatory activity [129]. Furthermore, cognitive impairment in the ALS group was associated with myelin changes within the anterior corpus callosum and frontal lobe projections, and longitudinal changes in MWF were only significant in the PLS group. Given their observations, the authors conclude that myelin water imaging may have the potential to distinguish PLS from ALS, and may have value as a marker of extramotor involvement.
Concussion
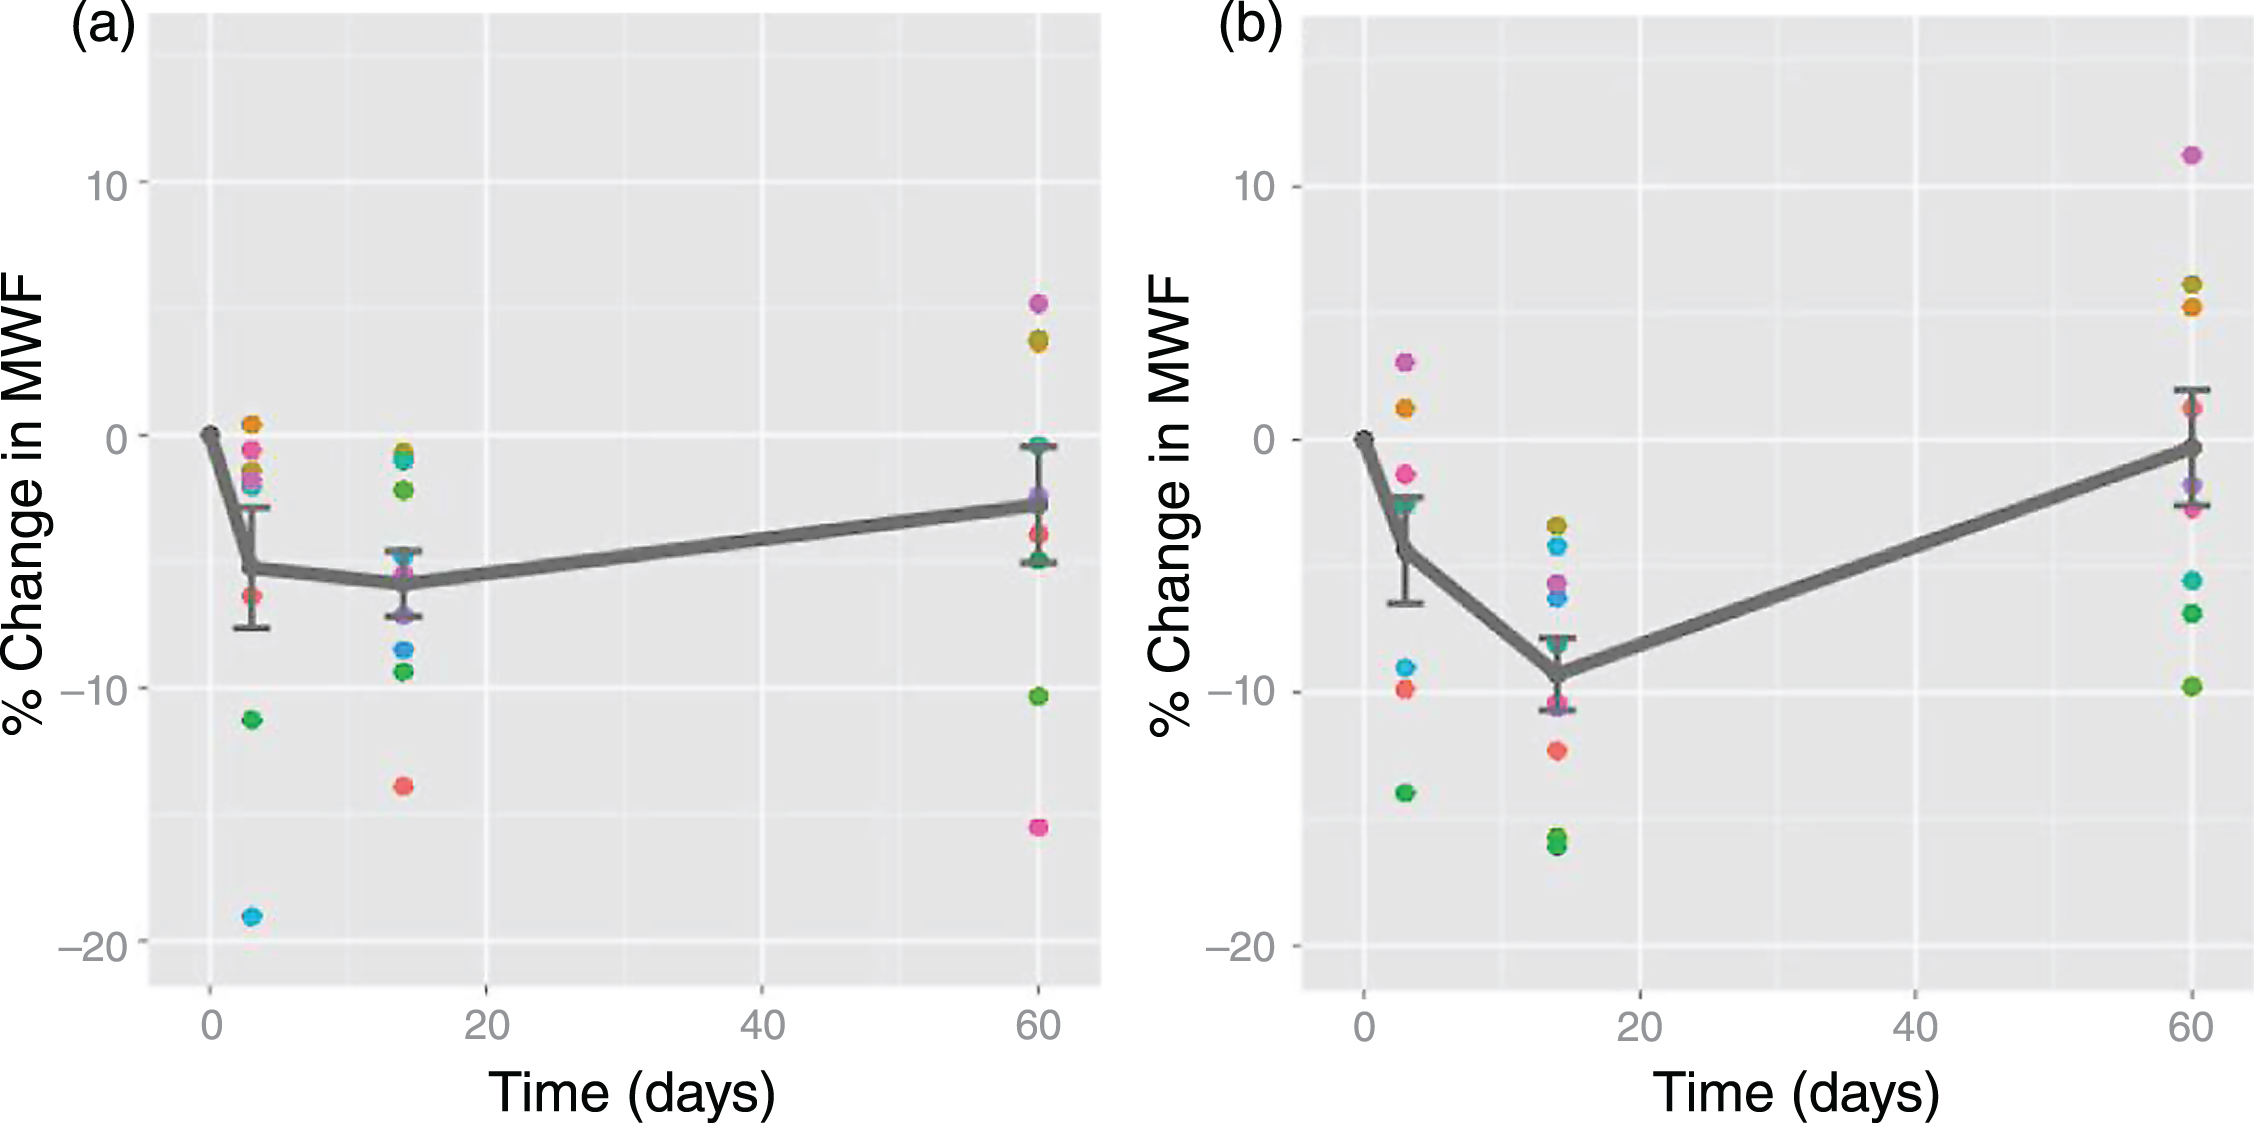
Traumatic brain injury and concussion are a major public health concern but continue to be poorly understood. Evidence for myelin damage in mild traumatic brain injury (TBI) comes from one prospective study that examined two varsity hockey teams (45 players) over one season of athletic competition [130]. 11 players sustained a concussion, and were scanned at 72 hours, 2 weeks, and 2 months post-injury. At 2 weeks post-injury, MWF was reduced in several brain areas relative to preseason; values recovered to pre-season values by 2 months post-injury (Figs. 10, 11). These results could indicate a transient myelin disruption following a single mTBI, with subsequent remyelination of affected neurons.
LIMITATIONS OF MYELIN WATER IMAGING
While MWF has shown strong qualitative and quantitative correspondence with histological markers for myelin (as described earlier), it is important to be aware of several potential confounding factors that may influence in vivo measurement of myelin water.
Exchange
T2 decay curve approaches to measurement of myelin water fraction assume that water molecules stay in the myelin bilayers for times long compared to the decay curve measurement time. Evidence from studies of rodent spine [131, 132] suggested that movement of water from myelin during the measurement can occur at rates sufficiently fast to cause the measured myelin water fraction to be artificially low, an observation which has also been characterized using a 4 pool model of white matter [133]. However, other animal studies involving bovine brain and optic nerve suggest exchange does not play a large role in MWF measurements [134, 135]. The effect of exchange in human brain has not yet been accurately characterized; however, it seems likely that measured myelin water fractions are slight underestimates of the true myelin water fraction [136].
Magnetization exchange with non-aqueous tissue
It has been demonstrated that when measuring T1 in CNS tissue, magnetization exchange between non-aqueous tissue and water in CNS tissue can give rise to relatively short T1 components [40, 137–139]. It may be difficult to separate these components from myelin water T1 components, which are themselves altered by exchange. Hence exchange between the multiple components of CNS tissue makes it challenging to extract an accurate myelin water fraction from T1 measurements.
Myelin debris
Damage to myelin, whether from an acute event (i.e. trauma) or chronic condition (i.e. multiple sclerosis) will result in myelin debris. Eventually macrophages will clear debris from the injury site, but until that occurs the presence of myelin debris may influence the measured myelin water fraction. Several animal studies have investigated how myelin debris impacts MWF. Using a rat sciatic nerve cut/crush injury model it was shown that myelin water was unable to distinguish between intact myelin, degenerating myelin and myelin debris [44]. In a longitudinal study of rat spinal cord injury via dorsal column transection, MWF increased 3 weeks post injury due to reduced extracellular space filled with myelin debris [140]. Finally, a lysolecithin induced injury in mouse spinal cord found that demyelination shown by myelin water lagged behind the histological evidence of demyelination by 1 week [52]. Although no such work has been completed in human tissue, given these observations it is possible that presence of myelin debris would impact MWF measurement of recent demyelination in humans in vivo.
mcDESPOT
The mcDESPOT approach for measurement of MWF offers many advantages over the decay curve approaches, including accommodation for exchange effects; however, it also brings several challenges. The analysis involves a two component model (plus CSF) which may not be applicable to all situations in CNS tissue, in particular pathology which frequently contains pools of water (e.g. edema) with intermediate T2 times [141, 142]. The analysis also requires estimation of a large number of parameters from a limited amount of relatively noisy data points. Consequently, the accuracy of mcDESPOT derived myelin water fraction is presently an active area of research [143–148]. Finally, it has been clearly demonstrated that the mcDESPOT curves are affected appreciably by magnetization transfer [149, 150]; original analyses do not account for this possibility although more recent work [150] is attempting to address this.
OTHER MR TECHNIQUES SENSITIVE TO MYELINATION
A large literature exists on the imaging of myelin using magnetic resonance. It is possible to subdivide this literature into three areas: 1) imaging myelin in subjects under 2 years old, 2) imaging myelin in white matter in subjects more than 2 years old and 3) imaging myelin in the cortex. Perhaps surprisingly, these three applications have very little overlap in the literature.
Imaging myelin in subjects under 2 years old
Because the microstructure of human brain changes so extensively over the first two years, it has, so far, been impossible to define a specific MR technique for measuring myelin content in this subject group. In the context of radiological imaging, it has been noted that 1) myelin causes signal increase on T1 weighting [65], 2) myelin causes signal decrease on T2 weighting [65] and 3) myelin causes an increase on diffusion anisotropy [151]. However the extent of these effects change with the age of the child [151]. Therefore, it may be quite difficult to quantitatively characterize plasticity in childhood brain. A number of studies are in the literature that use the mcDESPOT approach to myelin water imaging, however, interpretation of findings from these studies should also keep in mind the potential confounding factor of the large water content changes that occur in the brain from 0–2 years.
Imaging myelin in white matter in subjects more than 2 years old
In adults it is much easier to image myelin in white matter than in grey matter because the concentration of myelin is much higher in white matter. The largest literature on myelin imaging comes from the white matter field and the largest application has been the characterization of neuronal degeneration in diseases like MS.
Magnetization transfer (MT)
MT techniques measure decreases in MR signal following off resonance excitations. The premise of the MT approach is that (1) compared to hydrogens attached to water, hydrogens attached to non-aqueous molecules (i.e. all lipids and proteins in myelin and glial cells) have a much broader range of MR frequencies and that (2) hydrogens within myelin preferentially exchange magnetization with water molecules [134, 152]. There is an extensive literature on the use of MT to characterize myelination in MS [2]. Data collection and analysis is straightforward and readily available on MR scanners and the method is sensitive to small differences between groups. Several studies [153, 154] have showed correlation between MT parameters and histological measures of myelin. However, not all studies support the use of MT as a surrogate for myelin [52, 155]. A distinct advantage of MT techniques is their relative robustness compared to many other putative myelin sensitive techniques. A disadvantage of the use of MT to monitor myelin is that while a change in myelin will cause a change in MT, a change in MT is not necessarily due to a change in myelin; for example, changes in water content which could be caused by inflammation or edema will result in changes in MT [156]. Examining the magnetization transfer ratio (MTR) [157] and T2 relaxation measures in an EAE guinea pig model, Gareau et al. showed both measures were reduced in the NAWM. However, MTR and myelin water appeared to be influenced by different aspects of EAE, as modulating the inflammation strongly influenced MTR but had minimal effect on myelin water. This result suggests that the short T2 component is specific for myelin while pathological features other than myelin content may also be important in the interpretation of MTR [158]. McCreary et al. examined a murine model of spinal cord damage induced by lysolecithin whereby demyelination is followed by spontaneous remyelination and found that MWF increased with remyelination while MTR did not [52].
An exciting new approach to MT and myelin is the inhomogeneus MT technique [159, 160]. Initial work on this technique suggests that it is preferentially sensitive to the signal from hydrogens on lipids in CNS tissue. Given that myelin is 70–80% lipid, more research is warranted on this variant of MT.
Diffusion
Diffusion MR takes advantage of the fact that the anisotropic nature of cellular microstructure influences the thermally induced random motions of water molecules in brain and spinal cord. Particularly in white matter, tissue water travels preferentially along the local axonal orientations. In diffusion tractography, local diffusion directions are combined to produce maps of nerve tracts [13, 14]. In diffusion tensor imaging (DTI), measures of diffusion and anisotropy of diffusion are acquired at each imaging voxel. DTI has been used to show evidence on plasticity in both preclinical [161, 162] and human learning tasks [163]. While there is a growing literature on MR diffusion techniques and plasticity, caution is warranted and one should be careful about interpreting diffusion anisotropy changes as myelin changes [164]. The perpendicular component of the diffusion tensor (often called radial diffusivity or lamda perp) has been demonstrated to be inversely related to myelination in animal models [165, 166]. This latter approach to measuring myelination is complicated by the fact that simplistic DTI measures of the perpendicular component of the diffusion tensor are confounded by water contentchanges [166].
Ultrashort Echo Time (UTE)
Water protons in brain have T2s greater than 10 ms and can be easily imaged by conventional MR techniques with conventional echo times. However, CNS tissue also contains non-aqueous sources of protons, including, but not limited to, the lipids and proteins that make up myelin. The T2 of non-aqueous protons is very short (∼50 μs) [167] and cannot be directly measured with conventional MRI. To access the dipolar broadened, non-aqueous signal from CNS tissue, ultrashort TE (UTE) techniques must be used [168]. Visualization of UTE signal is improved by using long-T2 suppression RF pulses that improve the contrast of short-T species by removal of contaminating signal from tissue with longer T2 values [169]. A number of studies have used these methods to study brain tissue [170–174]. Two of the studies which used UTE for myelin measurement [167, 171] employed smaller bore magnets and short excitation pulses which yielded signals from non-aqueous brain with T2 times which were in agreement with previous NMR spectrometer measurements of brain samples [135]. In vivo, white matter demonstrates short-T2 components [170, 172, 173] and reduced signal in areas of pathology [170, 174]. However, in vivo UTE characterizations of brain using whole body MR systems have reported unrealistically long myelin T2 times, suggesting that it may be very difficult to use UTE techniques on whole body MRs to measure myelin content in humans in vivo. UTE methods are available on most newer MR systems [173, 174] and it is expected this area of research will continue to expand.
Imaging myelin in the cortex
Myelin concentrations are substantially less in the cortex than in white matter; hence it is much more difficult, and perhaps even impossible, to accurately measure cortical myelin content. Thus far cortical myelin measurement has been largely qualitative. Several groups [9, 175] have made the assumption that changes in T1 relaxation time are proportional to changes in myelin. Then, a T1 map is presumed to be a qualitative cortical myelin map. A problem with these T1 approaches is that in CNS tissue T1 is also correlated with water content and with iron content [9, 10]. Yet another qualitative approach to measuring myelin content in brain is to assume that the ratio of T1 weighted signal intensity to T2 weighted signal intensity is related to cortical myelin content [176, 177]. Remarkably, these two approaches result in images which look like what one might expect for a myelin image in cortex. However, the lack of a solid theoretical background for these contrasts as myelin measures and the fact that, the assumption of myelin specificity is likely to break down in abnormal brain, make it unlikely that these approaches could be generally specific for myelin. Unfortunately, due to the low concentrations of myelin in grey matter, more quantitative myelin measurement techniques fail; hence such qualitative approaches might be the only means available to monitor myelination in greymatter.
CONCLUDING REMARKS
Imaging myelin in vivo is a challenging research area and, as described above, many approaches are being explored. Based upon theoretical specificity and strong correspondence with histology, this review makes the case for myelin water imaging as the technique of choice for monitoring myelination in white matter. It is an exciting time to be in this field, since it is clear that obtaining a better understanding of brain plasticity through myelination changes will have profound influences on medicine and neuroscience.
ACKNOWLEDGMENTS
Research by ALM is supported by a Discovery Grant from the Natural Sciences and Engineering and Research Council (NSERC) of Canada. CL is supported by operating grants from the MS Society of Canada and by a Discovery Grant from NSERC. The authors would like to acknowledge the collaborations of our colleagues at the University of British Columbia (UBC) MRI Research Centre, the UBC MS/MRI Research Group and the UBC Hospital MS Clinic.
REFERENCES
[1] | Laule C , Vavasour IM , Kolind SH , Li DK , Traboulsee TL , Moore GR , et al. Magnetic resonance imaging of myelin. Neurotherapeutics. (2007) ;4: (3):460–84. |
[2] | Arnold DL , Dalton CM , Schmierer K , Pike GB , Miller DH . Imaging of Demyelination and Remyelination in Multiple Sclerosis. In: Duncan ID , Franklin RJ , editors. Myelin Repair and Neuroprotection in Multiple Sclerosis: Springer; (2013) :233–53. |
[3] | MacKay A , Laule C , Vavasour I , Bjarnason T , Kolind S , Madler B . Insights into brain microstructure from the T2 distribution. Magn Reson Imaging. (2006) ;24: (4):515–25. |
[4] | Alonso-Ortiz E , Levesque IR , Pike GB . MRI-based myelin water imaging: A technical review. Magn Reson Med. (2015) ;73: (1):70–81. |
[5] | Fischer HW , Rinck PA , Van Haverbeke Y , Muller RN . Nuclear relaxation of human brain gray and white matter: Analysis of field dependence and implications for MRI. Magn Reson Med. (1990) ;16: (2):317–34. |
[6] | Stewart WA , MacKay AL , Whittall KP , Moore GR , Paty DW . Spin-spin relaxation in experimental allergic encephalomyelitis. Analysis of CPMG data using a non-linear least squares method and linear inverse theory. Magn Reson Med. (1993) ;29: (6):767–75. |
[7] | Tofts PS , editor. Quantitative MRI of the brain: Measuring changes caused by disease. Chichester, West Sussex; Hoboken, NJ: Wiley; (2003) . |
[8] | Rooney WD , Johnson G , Li X , Cohen ER , Kim SG , Ugurbil K , et al. Magnetic field and tissue dependencies of human brain longitudinal 1H2O relaxation in vivo. Magn Reson Med. (2007) ;57: (2):308–18. |
[9] | Stüber C , Morawski M , Schafer A , Labadie C , Wahnert M , Leuze C , et al. Myelin and iron concentration in the human brain: A quantitative study of MRI contrast. Neuroimage. (2014) ;93: (Pt 1):95–106. |
[10] | Fatouros PP , Marmarou A . Use of magnetic resonance imaging for in vivo measurements of water content in human brain: Method and normal values. Journal of Neurosurgery. (1999) ;90: (1):109–15 . |
[11] | Gelman N , Ewing JR , Gorell JM , Spickler EM , Solomon EG . Interregional variation of longitudinal relaxation rates in human brain at 3.0 T: Relation to estimated iron and water contents. Magn Reson Med. (2001) ;45: (1):71–9. |
[12] | Carr JC , Carroll TJ . Magnetic Resonance Angiography, Principles and Applications: Springer; (2012) :412. |
[13] | Jones D . Diffusion MRI: Theory, Methods and Applications: Oxford University Press; (2010) . |
[14] | Johansen-Berg H , Behrens TE . Diffusion MRI from quantitative measurement to in vivo neuroanatomy: Academic Press, Elsevier; (2013) . |
[15] | Huettel SA , Song AW , McCarthy G . Functional Magnetic Resonance Imaging, Sinauer Associates; (2014) . |
[16] | MacKay A , Whittall K , Adler J , Li D , Paty D , Graeb D . In vivo visualization of myelin water in brain by magnetic resonance. Magn Reson Med. (1994) ;31: (6):673–7. |
[17] | Whittall KP , MacKay AL , Graeb DA , Nugent RA , Li DK , Paty DW . In vivo measurement of T2 distributions and water contents in normal human brain. Magn Reson Med. (1997) ;37: (1):34–43. |
[18] | Whittall KP , MacKay AL . Quantitative interpretation of nmr relaxation data. J Magn Reson. (1989) ;84: :134–52. |
[19] | Wu Y , Alexander AL , Fleming JO , Duncan ID , Field AS . Myelin water fraction in human cervical spinal cord in vivo. J Comput Assist Tomogr. (2006) ;30: (2):304–6. |
[20] | Prasloski T , Rauscher A , MacKay AL , Hodgson M , Vavasour IM , Laule C , et al. Rapid whole cerebrum myelin water imaging using a 3D GRASE sequence. Neuroimage. (2012) ;63: (1):533–9. |
[21] | Oh J , Han ET , Lee MC , Nelson SJ , Pelletier D . Multislice brain myelin water fractions at 3T in multiple sclerosis. J Neuroimaging. (2007) ;17: (2):156–63. |
[22] | Oh J , Han ET , Pelletier D , Nelson SJ . Measurement of in vivo multi-component T2 relaxation times for brain tissue using multi-slice T2 prep at 1.5 and 3 T. Magn Reson Imaging. (2005) ;24: (1):33–43. |
[23] | Nguyen TD , Wisnieff C , Cooper MA , Kumar D , Raj A , Spincemaille P , et al. T(2) prep three-dimensional spiral imaging with efficient whole brain coverage for myelin water quantification at 1.5 tesla. Magn Reson Med. (2012) ;67: (3):614–21. |
[24] | Nguyen TD , Deh K , Monohan E , Pandya S , Spincemaille P , Raj A , et al. Feasibility and reproducibility of whole brain myelin water mapping in 4 minutes using fast acquisition with spiral trajectory and adiabatic T2prep (FAST-T2) at 3T. Magn Reson Med. (2015) . |
[25] | Prasloski T , Madler B , Xiang QS , MacKay A , Jones C . Applications of stimulated echo correction to multicomponent T2 analysis. Magn Reson Med. (2012) ;67: (6):1803–14. |
[26] | Stanisz GJ , Henkelman RM . Diffusional anisotropy of T2 components in bovine optic nerve. Magn Reson Med. (1998) ;40: (3):405–10. |
[27] | Raj A , Pandya S , Shen X , LoCastro E , Nguyen TD , Gauthier SA . Multi-compartment T2 relaxometry using a spatially constrained multi-Gaussian model. PLoS ONE. (2014) ;9: (6):e98391. |
[28] | Kumar D , Nguyen TD , Gauthier SA , Raj A . Bayesian algorithm using spatial priors for multiexponential T(2) relaxometry from multiecho spin echo MRI. Magn Reson Med. (2012) ;68: (5):1536–43. |
[29] | Shen X , Nguyen TD , Gauthier SA , Raj A . Robust myelin quantitative imaging from multi-echo T2 MRI using edge preserving spatial priors. Medical image computing and computer-assisted intervention: MICCAI International Conference on Medical Image Computing and Computer-Assisted Intervention. (2013) ;16: (Pt 1):622–30. |
[30] | Akhondi-Asl A , Afacan O , Mulkern RV , Warfield SK . T(2)-relaxometry for myelin water fraction extraction using wald distribution and extended phase graph. Medical image computing and computer-assisted intervention: MICCAI International Conference on Medical Image Computing and Computer-Assisted Intervention. (2014) ;17: (Pt 3):145–52. |
[31] | Guo J , Ji Q , Reddick WE . Multi-slice myelin water imaging for practical clinical applications at 3.0 T.. Magn Reson Med. (2013) ;70: (3):813–22. |
[32] | Du YP , Chu R , Hwang D , Brown MS , Kleinschmidt-DeMasters BK , Singel D , et al. Fast multislice mapping of the myelin water fraction using multicompartment analysis of T2* decay at 3T: A preliminary postmortem study. Magn Reson Med. (2007) ;58: (5):865–70. |
[33] | Sati P , van Gelderen P , Silva AC , Reich DS , Merkle H , de Zwart JA , et al. Micro-compartment specific T2* relaxation in the brain. Neuroimage. (2013) ;77: :268–78. |
[34] | Nam Y , Lee J , Hwang D , Kim DH . Improved estimation of myelin water fraction using complex model fitting. Neuroimage. (2015) ;116: :214–21. |
[35] | Lenz C , Klarhofer M , Scheffler K . Feasibility of in vivo myelin water imaging using 3D multigradient-echo pulse sequences. Magn Reson Med. (2012) ;68: (2):523–8. |
[36] | Fernandez-Seara MA , Wehrli FW . Postprocessing technique to correct for background gradients in image-based R*(2) measurements. Magn Reson Med. (2000) ;44: (3):358–66. |
[37] | Kwon OI , Woo EJ , Du YP , Hwang D . A tissue-relaxation-dependent neighboring method for robust mapping of the myelin water fraction. Neuroimage. (2013) ;74: :12–21. |
[38] | Labadie C , Lee JH , Rooney WD , Jarchow S , Aubert-Frecon M , Springer CS Jr , et al. Myelin water mapping by spatially regularized longitudinal relaxographic imaging at high magnetic fields. Magn Reson Med. (2014) ;71: (1):375–87. |
[39] | Oh SH , Bilello M , Schindler M , Markowitz CE , Detre JA , Lee J . Direct visualization of short transverse relaxation time component (ViSTa). Neuroimage. (2013) ;83: :485–92. |
[40] | Barta R , Kalantari S , Laule C , Vavasour IM , MacKay AL , Michal CA . Modeling T(1) and T(2) relaxation in bovine white matter. J Magn Reson. (2015) ;259: :56–67. |
[41] | Deoni SC , Rutt BK , Arun T , Pierpaoli C , Jones DK . Gleaning multicomponent T1 and T2 information from steady-state imaging data. Magn Reson Med. (2008) ;60: (6):1372–87. |
[42] | Swift TJ , Fritz OG Jr . A proton spin-echo study of the state of water in frog nerves. Biophys J. (1969) ;9: (1):54–9. |
[43] | Vasilescu V , Katona E , Simplaceanu V , Demco D . Water compartments in the myelinated nerve. III. Pulsed NMR results. Experientia. (1978) ;34: (11):1443–4. |
[44] | Webb S , Munro CA , Midha R , Stanisz GJ . Is multicomponent T2 a good measure of myelin content in peripheral nerve? Magn Reson Med. (2003) ;49: (4):638–45. |
[45] | Stanisz GJ , Webb S , Munro CA , Pun T , Midha R . MR properties of excised neural tissue following experimentally induced neuroinflammation. Magn Reson Med. (2004) ;51: :473–9. |
[46] | Pun TW , Odrobina E , Xu QG , Lam TY , Munro CA , Midha R , et al. Histological and magnetic resonance analysis of sciatic nerves in the tellurium model of neuropathy. J Peripher Nerv Syst. (2005) ;10: (1):38–46. |
[47] | Odrobina EE , Lam TY , Pun T , Midha R , Stanisz GJ . MR properties of excised neural tissue following experimentally induced demyelination. NMR Biomed. (2005) ;18: (5):277–84. |
[48] | Valentine HL , Does MD , Marshall V , Tonkin EG , Valentine WM . Multicomponent T2 analysis of dithiocarbamate-mediated peripheral nerve demyelination. Neurotoxicology. (2007) ;28: (3):645–54. |
[49] | Menon RS , Allen PS . Application of continuous relaxation time distributions to the fitting of data from model systems and excised tissue. Magn Reson Med. (1991) ;20: (2):214–27. |
[50] | Gareau PJ , Rutt BK , Bowen CV , Karlik SJ , Mitchell JR . In vivo measurements of multi-component T2 relaxation behaviour in guinea pig brain. Magn Reson Imaging. (1999) ;17: (9):1319–25. |
[51] | Kozlowski P , Liu J , Yung AC , Tetzlaff W . High-resolution myelin water measurements in rat spinal cord. Magn Reson Med. (2008) ;59: (4):796–802. |
[52] | McCreary CR , Bjarnason TA , Skihar V , Mitchell JR , Yong VW , Dunn JF . Multiexponential T2 and magnetization transfer MRI of demyelination and remyelination in murine spinal cord. Neuroimage. (2009) ;45: (4):1173–82. |
[53] | Kozlowski P , Rosicka P , Liu J , Yung AC , Tetzlaff W . In vivo longitudinal Myelin Water Imaging in rat spinal cord following dorsal column transection injury. Magn Reson Imaging. (2014) ;32: (3):250–8. |
[54] | Laule C , Leung E , Lis DK , Traboulsee AL , Paty DW , MacKay AL , et al. Myelin water imaging in multiple sclerosis: Quantitative correlations with histopathology. Mult Scler. (2006) ;12: (6):747–53. |
[55] | Moore GRW , Leung E , MacKay AL , Vavasour IM , Whittall KP , Cover KS , et al. A pathology-MRI study of the short-T2 component in formalin-fixed multiple sclerosis brain. Neurology. (2000) ;55: (10):1506–10. |
[56] | Klüver H , Barrera E . A method for the combined staining of cells and fibres in the nervous system. J Neuropathol Exp Neurol. (1953) ;12: :400–3. |
[57] | Segarra J . Histological and Histochemical Staining Methods. In: Teduchi C , editor. Neuropathology Methods and Diagnosis. Boston: Little, Brown and Company; (1970) :233–69 . |
[58] | Salthouse T . Luxol fast blue ARN: A new solvent azo dye with improved staining qualities for myelin and phospholipids. Staining Technology. (1962) ;37: :313–6. |
[59] | Lycette R , Danforth J , Koppel J , Olwin J . The binding of lusol fast blur ARN by various biological lipids. Staining Techology. (1970) ;45: (4):155–60. |
[60] | Laule C , Kozlowski P , Leung E , Li DK , Mackay AL , Moore GR . Myelin water imaging of multiple sclerosis at 7 T: Correlations with histopathology. Neuroimage. (2008) ;40: :1575–80. |
[61] | Laule C , Yung A , Pavolva V , Bohnet B , Kozlowski P , Hashimoto SA , et al. High-resolution myelin water imaging in post-mortem multiple sclerosis spinal cord: A case report. Mult Scler. (2016) ;22: (11):1485–89. |
[62] | Yakovlev P , Lecours A . The myelogenic cycles of regional maturation of the brain. In: Minkowski A , editor. Regional Development of the Brain in Early Life. Oxford: Blackwell; (1967) :3–70. |
[63] | Filley C . The behavioural neurology of white matter. Oxford, NY: Oxford University Press. (2001) . |
[64] | Dobbing J , Sands J . Quantitative growth and development of human brain. Arch Dis Child. (1973) ;48: (10):757–67. |
[65] | van der Knaap MS , Valk J . MR imaging of the various stages of normal myelination during the first year of life. Neuroradiology. (1990) ;31: (6):459–70. |
[66] | Melbourne A , Eaton-Rosen Z , Bainbridge A , Kendall GS , Cardoso MJ , Robertson NJ , et al. Measurement of myelin in the preterm brain: Multi-compartment diffusion imaging and multi-component T2 relaxometry. Medical image computing and computer-assisted intervention: MICCAI International Conference on Medical Image Computing and Computer-Assisted Intervention. (2013) ;16: (Pt 2):336–44. |
[67] | Melbourne A , Eaton-Rosen Z , Orasanu E , Price D , Bainbridge A , Cardoso MJ , et al. Longitudinal development in the preterm thalamus and posterior white matter: MRI correlations between diffusion weighted imaging and T2 relaxometry. Hum Brain Mapp. (2016) ;37: (7):2479–92. |
[68] | Deoni SC , Mercure E , Blasi A , Gasston D , Thomson A , Johnson M , et al. Mapping infant brain myelination with magnetic resonance imaging. J Neurosci. (2011) ;31: (2):784–91. |
[69] | Dean DC 3rd , O’Muircheartaigh J , Dirks H , Waskiewicz N , Lehman K , Walker L , et al. Modeling healthy male white matter and myelin development: 3 through 60months of age. Neuroimage. (2014) ;84: :742–52. |
[70] | Dean DC 3rd , O’Muircheartaigh J , Dirks H , Waskiewicz N , Walker L , Doernberg E , et al. Characterizing longitudinal white matter development during early childhood. Brain Struct Funct. (2015) ;220: (4):1921–33. |
[71] | Deoni SC , Dean DC 3rd , O’Muircheartaigh J , Dirks H , Jerskey BA . Investigating white matter development in infancy and early childhood using myelin water faction and relaxation time mapping. Neuroimage. (2012) ;63: (3):1038–53. |
[72] | Kinney HC , Brody BA , Kloman AS , Gilles FH . Sequence of central nervous system myelination in human infancy. II. Patterns of myelination in autopsied infants. J Neuropathol Exp Neurol. (1988) ;47: (3):217–34. |
[73] | Whitaker KJ , Kolind SH , Mackay AL , Clark CM . Quantifying development: Investigating highly myelinated voxels in preadolescent corpus callosum. Neuroimage. (2008) ;43: (4):731–5. |
[74] | Deoni SC , Dean DC 3rd , Piryatinsky I , O’Muircheartaigh J , Waskiewicz N , Lehman K , et al. Breastfeeding and early white matter development: A cross-sectional study. Neuroimage. (2013) ;82: :77–86. |
[75] | Anderson A , Burggren A . Cognitive and neurodevelopmental benefits of extended formula-feeding in infants: re: Deoni et al. Neuroimage. (2014) ;100: :706–9. |
[76] | Dean DC 3rd , Jerskey BA , Chen K , Protas H , Thiyyagura P , Roontiva A , et al. Brain differences in infants at differential genetic risk for late-onset Alzheimer disease: A cross-sectional imaging study. JAMA Neurology. (2014) ;71: (1):11–22. |
[77] | Laule C , Vavasour IM , Moore GRW , Oger J , Li DKB , Paty DW , et al. Water content and myelin water fraction in multiple sclerosis: A T2 relaxation study. J Neurol. (2004) ;251: (3):284–93. |
[78] | Vavasour IM , Whittall KP , MacKay AL , Li DK , Vorobeychik G , Paty DW . A comparison between magnetization transfer ratios and myelin water percentages in normals and multiple sclerosis patients. Magn Reson Med. (1998) ;40: (5):763–8. |
[79] | Chia CLL , Bjarnason TA , Mackay AL , Pike GB , editors. Cross-site reproducibility of myelin water estimates. 14th Annual Meeting of the International Society of Magnetic Resonance in Medicine; (2006) ; Seattle, USA. |
[80] | Billiet T , Vandenbulcke M , Madler B , Peeters R , Dhollander T , Zhang H , et al. Age-related microstructural differences quantified using myelin water imaging and advanced diffusion MRI. Neurobiol Aging. (2015) ;36: (6):2107–21. |
[81] | Vavasour IM , Clark CM , Li DK , Mackay AL . Reproducibility and reliability of MR measurements in white matter: Clinical implications. Neuroimage. (2006) ;32: (2):637–42. |
[82] | Meyers SM , Vavasour IM , Madler B , Harris T , Fu E , Li DK , et al. Multicenter measurements of myelin water fraction and geometric mean T Intra- and intersite reproducibility. J Magn Reson Imaging. (2013) ;38: (6):1445–53. |
[83] | Borich MR , Mackay AL , Vavasour IM , Rauscher A , Boyd LA . Evaluation of white matter myelin water fraction in chronic stroke. Neuroimage Clin. (2013) ;2: :569–80. |
[84] | Vargas WS , Monohan E , Pandya S , Raj A , Vartanian T , Nguyen TD , et al. Measuring longitudinal myelin water fraction in new multiple sclerosis lesions. Neuroimage Clin. (2015) ;9: :369–75. |
[85] | Liu F , Vidarsson L , Winter JD , Tran H , Kassner A . Sex differences in the human corpus callosum microstructure: A combined T2 myelin-water and diffusion tensor magnetic resonance imaging study. Brain Res. (1343) :37–45. |
[86] | Flynn SW , Lang DJ , Mackay AL , Goghari V , Vavasour IM , Whittall KP , et al. Abnormalities of myelination in schizophrenia detected in vivo with MRI, and post-mortem with analysis of oligodendrocyte proteins. Mol Psychiatry. (2003) ;8: (9):811–20. |
[87] | Lang DJ , Yip E , MacKay AL , Thornton AE , Vila-Rodriguez F , MacEwan GW , et al. 48 echo T(2) myelin imaging of white matter in first-episode schizophrenia: Evidence for aberrant myelination. Neuroimage Clin. (2014) ;6: :408–14. |
[88] | Bracht T , Jones DK , Bells S , Walther S , Drakesmith M , Linden D . Myelination of the right parahippocampal cingulum is associated with physical activity in young healthy adults. Brain Struct Funct. (2016) ;221: (9):4537–48. |
[89] | Minty EP , Bjarnason TA , Laule C , Mackay AL . Myelin water measurement in the spinal cord. Magn Reson Med. (2009) ;61: (4):883–92. |
[90] | Laule C , Vavasour IM , Zhao Y , Traboulsee AL , Oger J , Vavasour JD , et al. Two-year study of cervical cord volume and myelin water in primary progressive multiple sclerosis. Mult Scler. (2010) ;16: (6):670–7. |
[91] | MacMillan EL , Madler B , Fichtner N , Dvorak MF , Li DK , Curt A , et al. Myelin water and T(2) relaxation measurements in the healthy cervical spinal cord at 3.0T: Repeatability and changes with age. Neuroimage. (2011) ;54: (2):1083–90. |
[92] | Kolind SH , Deoni SC . Rapid three-dimensional multicomponent relaxation imaging of the cervical spinal cord. Magn Reson Med. (2011) ;65: (2):551–6. |
[93] | Laule C , MacKay AL . T2 Relaxation. In: Cohen-Adad J , Wheeler-Kingshott CA , editors. Quantitative MRI of the spinal cord: Elsevier; (2014) :179–204. |
[94] | Keegan BM , Noseworthy JH . Multiple sclerosis. Annu Rev Med. (2002) ;53: :285–302. |
[95] | Tozer DJ , Davies GR , Altmann DR , Miller DH , Tofts PS . Correlation of apparent myelin measures obtained in multiple sclerosis patients and controls from magnetization transfer and multicompartmental T2 analysis. Magn Reson Med. (2005) ;53: (6):1415–22. |
[96] | Kolind S , Matthews L , Johansen-Berg H , Leite MI , Williams SC , Deoni S , et al. Myelin water imaging reflects clinical variability in multiple sclerosis. Neuroimage. (2012) ;60: (1):263–70. |
[97] | Llufriu S , Kornak J , Ratiney H , Oh J , Brenneman D , Cree BA , et al. Magnetic resonance spectroscopy markers of disease progression in multiple sclerosis. JAMA Neurology. (2014) ;71: (7):840–7. |
[98] | Jeong IH , Choi JY , Kim SH , Hyun JW , Joung A , Lee J , et al. Comparison of myelin water fraction values in periventricular white matter lesions between multiple sclerosis and neuromyelitis optica spectrum disorder. Mult Scler. (2016) ;22: (12):1616–20. |
[99] | Faizy TD , Thaler C , Kumar D , Sedlacik J , Broocks G , Grosser M , et al. Heterogeneity of Multiple Sclerosis Lesions in Multislice Myelin Water Imaging. PLoS One. (2016) ;11: (3):e0151496. |
[100] | Vavasour IM , Li DK , Laule C , Traboulsee AL , Moore GR , Mackay AL . Multi-parametric MR assessment of T(1) black holes in multiple sclerosis: Evidence that myelin loss is not greater in hypointense versus isointense T(1) lesions. J Neurol. (2007) ;254: (12):1653–9. |
[101] | Vavasour IM , Laule C , Li DK , Oger J , Moore GR , Traboulsee A , et al. Longitudinal changes in myelin water fraction in two MS patients with active disease. J Neurol Sci. (2009) ;276: (1-2):49–53. |
[102] | Levesque IR , Giacomini PS , Narayanan S , Ribeiro LT , Sled JG , Arnold DL , et al. Quantitative magnetization transfer and myelin water imaging of the evolution of acute multiple sclerosis lesions. Magn Reson Med. (2010) ;63: (3):633–40. |
[103] | Allen IV , Glover G , Anderson R . Abnormalities in the macroscopically normal white matter in cases of mild or spinal multiple sclerosis (MS). Acta Neuropathologica - Supplementum. (1981) ;7: :176–8. |
[104] | Itoyama Y , Sternberger NH , Webster HD , Quarles RH , Cohen SR , Richardson EP Jr . Immunocytochemical observations on the distribution of myelin-associated glycoprotein and myelin basic protein in multiple sclerosis lesions. Ann Neurol. (1980) ;7: (2):167–77. |
[105] | Tourtellotte W , Parker J . Some spaces and barriers in postmortem multiple sclerosis. Prog Brain Res. (1968) ;29: :493–525. |
[106] | Alling C , Vanier MT , Svennerholm L . Lipid alterations in apparently normal white matter in multiple sclerosis. Brain Research. (1971) ;35: (2):325–36. |
[107] | Fewster ME , Hirono H , Mead JF . Lipid composition of myelin in multiple sclerosis. Journal of Neurology. (1976) ;213: (2):119–31. |
[108] | Kitzler HH , Su J , Zeineh M , Harper-Little C , Leung A , Kremenchutzky M , et al. Deficient MWF mapping in multiple sclerosis using 3D whole-brain multi-component relaxation MRI. Neuroimage. (2012) ;59: (3):2670–7. |
[109] | Evangelou N , Esiri MM , Smith S , Palace J , Matthews PM . Quantitative pathological evidence for axonal loss in normal appearing white matter in multiple sclerosis. Annals of Neurology. (2000) ;47: (3):391–5. |
[110] | Evangelou N , Konz D , Esiri MM , Smith S , Palace J , Matthews PM . Regional axonal loss in the corpus callosum correlates with cerebral white matter lesion volume and distribution in multiple sclerosis. Brain. (2000) ;123: (Pt 9):1845–9. |
[111] | Simon JH , Kinkel RP , Jacobs L , Bub L , Simonian N . A Wallerian degeneration pattern in patients at risk for MS. Neurology. (2000) ;54: (5):1155–60. |
[112] | Zhao GJ , Li DKB , Cheng Y , Wang XY , Paty DW , The UBC MS/MRI Research Group, et al. MRI dirty-appearing white matter in MS. Neurology. (2000) ;54: (suppl 3):A121. |
[113] | Laule C , Vavasour IM , Leung E , Li DK , Kozlowski P , Traboulsee AL , et al. Pathological basis of diffusely abnormal white matter: Insights from magnetic resonance imaging and histology. Mult Scler. (2011) ;17: (2):144–50. |
[114] | Moore GR , Laule C , Mackay A , Leung E , Li DK , Zhao G , et al. Dirty-appearing white matter in multiple sclerosis: Preliminary observations of myelin phospholipid and axonal loss. J Neurol. (2008) ;255: (11):1802–11. |
[115] | Laule C , Pavlova V , Leung E , Zhao G , MacKay AL , Kozlowski P , et al. Diffusely abnormal white matter in multiple sclerosis: Further histologic studies provide evidence for a primary lipid abnormality with neurodegeneration. J Neuropathol Exp Neurol. (2013) ;72: (1):42–52. |
[116] | Manogaran P , Vavasour I , Borich M , Kolind SH , Lange AP , Rauscher A , et al. Corticospinal tract integrity measured using transcranial magnetic stimulation and magnetic resonance imaging in neuromyelitis optica and multiple sclerosis. Mult Scler. (2016) ;22: (1):43–50. |
[117] | Tkachev D , Mimmack ML , Huffaker SJ , Ryan M , Bahn S . Further evidence for altered myelin biosynthesis and glutamatergic dysfunction in schizophrenia. Int J Neuropsychopharmacol. (2007) :1–7. |
[118] | Hakak Y , Walker JR , Li C , Wong WH , Davis KL , Buxbaum JD , et al. Genome-wide expression analysis reveals dysregulation of myelination-related genes in chronic schizophrenia. Proc Natl Acad Sci U S A. (2001) ;98: (8):4746–51. |
[119] | Uranova N , Orlovskaya D , Vikhreva O , Zimina I , Kolomeets N , Vostrikov V , et al. Electron microscopy of oligodendroglia in severe mental illness. Brain Res Bull. (2001) ;55: (5):597–610. |
[120] | Poser CM , Van Bogaert L . Neuro-pathologic observations in phenylketonuria. Brain. (1959) ;82: (1):1–9. |
[121] | Bechar M , Bornstein B , Elian M , Sandbank U . Phenylketonuria presenting an intermittent progressive course. J Neurol Neurosurg Psychiatry. (1965) ;28: :165–70. |
[122] | Malamud N . Neuropathology of phenylketonuria. J Neuropathol Exp Neurol. (1966) ;25: (2):254–68. |
[123] | Bauman ML , Kemper TL . Morphologic and histoanatomic observations of the brain in untreated human phenylketonuria. Acta Neuropathol (Berl). (1982) ;58: (1):55–63. |
[124] | Shah SN , Peterson NA , McKean CM . Lipid composition of human cerebral white matter and myelin in phenylketonuria. Journal of Neurochemistry. (1972) ;19: (10):2369–76. |
[125] | Sirrs SM , Laule C , Maedler B , Brief EE , Tahir SA , Bishop C , et al. Normal appearing white matter in subjects with phenylketonuria: Water content, myelin water fraction, and metabolite concentrations. Radiology. (2007) ;242: (1):236–43. |
[126] | Deoni SC , Zinkstok JR , Daly E , Ecker C , Williams SC , Murphy DG . White-matter relaxation time and myelin water fraction differences in young adults with autism. Psychol Med. (2015) ;45: (4):795–805. |
[127] | Billiet T , Madler B , D’Arco F , Peeters R , Deprez S , Plasschaert E , et al. Characterizing the microstructural basis of “unidentified bright objects” in neurofibromatosis type A combined in vivo multicomponent T2 relaxation and multi-shell diffusion MRI analysis. Neuroimage Clin. (2014) ;4: :649–58. |
[128] | Davies-Thompson J , Vavasour I , Scheel M , Rauscher A , Barton JJ . Reduced Myelin Water in the White Matter Tracts of Patients with Niemann-Pick Disease Type C. AJNR Am J Neuroradiol. (2016) ;37: (8):1487–9. |
[129] | Kolind S , Sharma R , Knight S , Johansen-Berg H , Talbot K , Turner MR . Myelin imaging in amyotrophic and primary lateral sclerosis. Amyotrophic lateral sclerosis & frontotemporal degeneration. (2013) ;14: (7-8):562–73. |
[130] | Wright AD , Jarrett M , Vavasour I , Shahinfard E , Kolind S , van Donkelaar P , et al. Myelin Water Fraction Is Transiently Reduced after a Single Mild Traumatic Brain Injury - A Prospective Cohort Study in Collegiate Hockey Players. PLoS One. (2016) ;11: (2):e0150215. |
[131] | Dula AN , Gochberg DF , Valentine HL , Valentine WM , Does MD . Multiexponential T2, magnetization transfer, and quantitative histology in white matter tracts of rat spinal cord. Magn Reson Med. (2010) ;63: (4):902–9. |
[132] | Harkins KD , Dula AN , Does MD . Effect of intercompartmental water exchange on the apparent myelin water fraction in multiexponential T2 measurements of rat spinal cord. Magn Reson Med. (2012) ;67: (3):793–800. |
[133] | Levesque IR , Pike GB . Characterizing healthy and diseased white matter using quantitative magnetization transfer and multicomponent T(2) relaxometry: A unified view via a four-pool model. Magn Reson Med. (2009) ;62: (6):1487–96. |
[134] | Stanisz GJ , Kecojevic A , Bronskill MJ , Henkelman RM . Characterizing white matter with magnetization transfer and T(2). Magn Reson Med. (1999) ;42: (6):1128–36. |
[135] | Bjarnason T , Vavasour I , Chia C , MacKay A . Characterization of the NMR Behaviour of White Matter in Bovine Brain. Magn Reson Med. (2005) ;54: :1072–81. |
[136] | Kalantari S , Laule C , Bjarnason TA , Vavasour IM , Mackay AL . Insight into in vivo magnetization exchange in human white matter regions. Magn Reson Med. (2011) ;66: (4):1142–51. |
[137] | Gochberg DF , Gore JC . Quantitative imaging of magnetization transfer using an inversion recovery sequence. Magn Reson Med. (2003) ;49: (3):501–5. |
[138] | Prantner AM , Bretthorst GL , Neil JJ , Garbow JR , Ackerman JJ . Magnetization transfer induced biexponential longitudinal relaxation. Magn Reson Med. (2008) ;60: (3):555–63. |
[139] | Rioux JA , Levesque IR , Rutt BK . Biexponential longitudinal relaxation in white matter: Characterization and impact on T mapping with IR-FSE and MP2RAGE. Magn Reson Med. (2016) ;75: (6):2265–77. |
[140] | Kozlowski P , Raj D , Liu J , Lam C , Yung AC , Tetzlaff W . Characterizing white matter damage in rat spinal cord with quantitative MRI and histology. J Neurotrauma. (2008) ;25: (6):653–76. |
[141] | Laule C , Vavasour IM , Kolind SH , Traboulsee AL , Moore GRW , Li DKB , et al. Long T2 Water in Multiple Sclerosis: What else can we learn from multi-echo T2 Relaxation? J Neurol. (2007) ;254: (11):1579–87. |
[142] | Laule C , Vavasour IM , Madler B , Kolind SH , Sirrs SM , Brief EE , et al. MR evidence of long T(2) water in pathological white matter. J Magn Reson Imaging. (2007) ;26: (4):1117–21. |
[143] | Lankford CL , Does MD . On the inherent precision of mcDESPOT. Magn Reson Med. (2013) ;69: (1):127–36. |
[144] | Zhang J , Kolind SH , Laule C , MacKay AL . Comparison of myelin water fraction from multiecho T2 decay curve and steady-state methods. Magn Reson Med. (2015) ;73: (1):223–32. |
[145] | Deoni SC , Kolind SH . Investigating the stability of mcDESPOT myelin water fraction values derived using a stochastic region contraction approach. Magn Reson Med. (2015) ;73: (1):161–9. |
[146] | Bouhrara M , Reiter DA , Celik H , Fishbein KW , Kijowski R , Spencer RG . Analysis of mcDESPOT- and CPMG-derived parameter estimates for two-component nonexchanging systems. Magn Reson Med. (2016) ;75: (6):2406–20. |
[147] | Bouhrara M , Spencer RG . Improved determination of the myelin water fraction in human brain using magnetic resonance imaging through Bayesian analysis of mcDESPOT. Neuroimage. (2016) ;127: :456–71. |
[148] | Deoni SC , Matthews L , Kolind SH . One component? Two components? Three? The effect of including a nonexchanging “free” water component in multicomponent driven equilibrium single pulse observation of T1 and T2. Magn Reson Med. (2013) ;70: (1):147–54. |
[149] | Zhang J , Kolind SH , Laule C , MacKay AL . How does magnetization transfer influence mcDESPOT results? Magn Reson Med. (2015) ;74: (5):1327–35. |
[150] | Liu F , Block WF , Kijowski R , Samsonov A . Rapid multicomponent relaxometry in steady state with correction of magnetization transfer effects. Magn Reson Med. (2016) ;75: (4):1423–33. |
[151] | Welker KM , Patton A . Assessment of normal myelination with magnetic resonance imaging. Semin Neurol. (2012) ;32: (1):15–28. |
[152] | Henkelman RM , Stanisz GJ , Graham SJ . Magnetization transfer in MRI: A review. NMR Biomed. (2001) ;14: (2):57–64. |
[153] | Schmierer K , Scaravilli F , Altmann DR , Barker GJ , Miller DH . Magnetization transfer ratio and myelin in postmortem multiple sclerosis brain. Ann Neurol. (2004) ;56: (3):407–15. |
[154] | Chen JT , Collins DL , Freedman MS , Atkins HL , Arnold DL , The Canadian MSBMTSG. Local magnetization transfer ratio signal inhomogeneity is related to subsequent change in MTR in lesions and normal-appearing white-matter of multiple sclerosis patients. Neuroimage. (2005) ;25: (4):1272–8. |
[155] | Fjaer S , Bo L , Myhr KM , Torkildsen O , Wergeland S . Magnetization transfer ratio does not correlate to myelin content in the brain in the MOG-EAE mouse model. Neurochem Int. (2015) ;83-84: :28–40. |
[156] | Vavasour IM , Laule C , Li DK , Traboulsee AL , MacKay AL . Is the magnetization transfer ratio a marker for myelin in multiple sclerosis? J Magn Reson Imaging. (2011) ;33: (3):713–8. |
[157] | Wolff SD , Balaban RS . Magnetization transfer contrast (MTC) and tissue water proton relaxation in vivo. Magn Reson Med. (1989) ;10: (1):135–44. |
[158] | Gareau PJ , Rutt BK , Karlik SJ , Mitchell JR . Magnetization transfer and multicomponent T2 relaxation measurements with histopathologic correlation in an experimental model of MS. J Magn Reson Imaging. (2000) ;11: (6):586–95. |
[159] | Varma G , Girard OM , Prevost VH , Grant AK , Duhamel G , Alsop DC . Interpretation of magnetization transfer from inhomogeneously broadened lines (ihMT) in tissues as a dipolar order effect within motion restricted molecules. J Magn Reson. (2015) ;260: :67–76. |
[160] | Varma G , Duhamel G , de Bazelaire C , Alsop DC . Magnetization transfer from inhomogeneously broadened lines: A potential marker for myelin. Magn Reson Med. (2015) ;73: (2):614–22. |
[161] | Blumenfeld-Katzir T , Pasternak O , Dagan M , Assaf Y . Diffusion MRI of structural brain plasticity induced by a learning and memory task. PLoS One. (2011) ;6: (6):e20678. |
[162] | Hofstetter S , Tavor I , Tzur Moryosef S , Assaf Y . Short-term learning induces white matter plasticity in the fornix. J Neurosci. (2013) ;33: (31):12844–50. |
[163] | Scholz J , Klein MC , Behrens TE , Johansen-Berg H . Training induces changes in white-matter architecture. Nat Neurosci. (2009) ;12: (11):1370–1. |
[164] | Hill RA . Do short-term changes in white matter structure indicate learning-induced myelin plasticity? J Neurosci. (2013) ;33: (50):19393–5. |
[165] | Song SK , Yoshino J , Le TQ , Lin SJ , Sun SW , Cross AH , et al. Demyelination increases radial diffusivity in corpus callosum of mouse brain. Neuroimage. (2005) ;26: (1):132–40. |
[166] | Wang X , Cusick MF , Wang Y , Sun P , Libbey JE , Trinkaus K , et al. Diffusion basis spectrum imaging detects and distinguishes coexisting subclinical inflammation, demyelination and axonal injury in experimental autoimmune encephalomyelitis mice. NMR Biomed. (2014) ;27: (7):843–52. |
[167] | Horch RA , Gore JC , Does MD . Origins of the ultrashort-T2 1H NMR signals in myelinated nerve: A direct measure of myelin content? Magn Reson Med (2011) ;66: (1):24–31. |
[168] | Robson MD , Gatehouse PD , Bydder M , Bydder GM . Magnetic resonance: An introduction to ultrashort TE (UTE) imaging. J Comput Assist Tomogr. (2003) ;27: (6):825–46. |
[169] | Larson PE , Gurney PT , Nayak K , Gold GE , Pauly JM , Nishimura DG . Designing long-T2 suppression pulses for ultrashort echo time imaging. Magn Reson Med. (2006) ;56: (1):94–103. |
[170] | Waldman A , Rees JH , Brock CS , Robson MD , Gatehouse PD , Bydder GM . MRI of the brain with ultra-short echo-time pulse sequences. Neuroradiology. (2003) ;45: (12):887–92. |
[171] | Wilhelm MJ , Ong HH , Wehrli SL , Li C , Tsai PH , Hackney DB , et al. Direct magnetic resonance detection of myelin and prospects for quantitative imaging of myelin density. Proc Natl Acad Sci U S A. (2012) ;109: (24):9605–10. |
[172] | Du J , Sheth V , He Q , Carl M , Chen J , Corey-Bloom J , et al. Measurement of T1 of the ultrashort T2* components in white matter of the brain at 3T. PLoS ONE. (2014) ;9: (8):e103296. |
[173] | Du J , Ma G , Li S , Carl M , Szeverenyi NM , VandenBerg S , et al. Ultrashort echo time (UTE) magnetic resonance imaging of the short T2 components in white matter of the brain using a clinical 3T scanner. Neuroimage. (2014) ;87: :32–41. |
[174] | Sheth V , Shao H , Chen J , Vandenberg S , Corey-Bloom J , Bydder GM , et al. Magnetic resonance imaging of myelin using ultrashort Echo time (UTE) pulse sequences: Phantom, specimen, volunteer and multiple sclerosis patient studies. Neuroimage. (2016) ;136: :37–44. |
[175] | Bock NA , Hashim E , Janik R , Konyer NB , Weiss M , Stanisz GJ , et al. Optimizing T1-weighted imaging of cortical myelin content at 3.0 T. Neuroimage. (2013) ;65: :1–12. |
[176] | Glasser MF , Van Essen DC . Mapping human cortical areas in vivo based on myelin content as revealed by T1- and T2-weighted MRI. J Neurosci. (2011) ;31: (32):11597–616. |
[177] | Ganzetti M , Wenderoth N , Mantini D . Whole brain myelin mapping using T1- and T2-weighted MR imaging data. Frontiers in Human Neuroscience. (2014) ;8: :671. |
Figures and Tables
Fig.1
Electron Micrograph of myelinated CNS tissue (Figs. 4–7 in Basic Neurochemistry: Molecular, Cellular and Medical Aspects. 6th edition. Siegel GJ, Agranoff BW, Albers RW, et al., editors. Philadelphia: Lippincott-Raven; 1999. ISBN 0-397-51820-X).
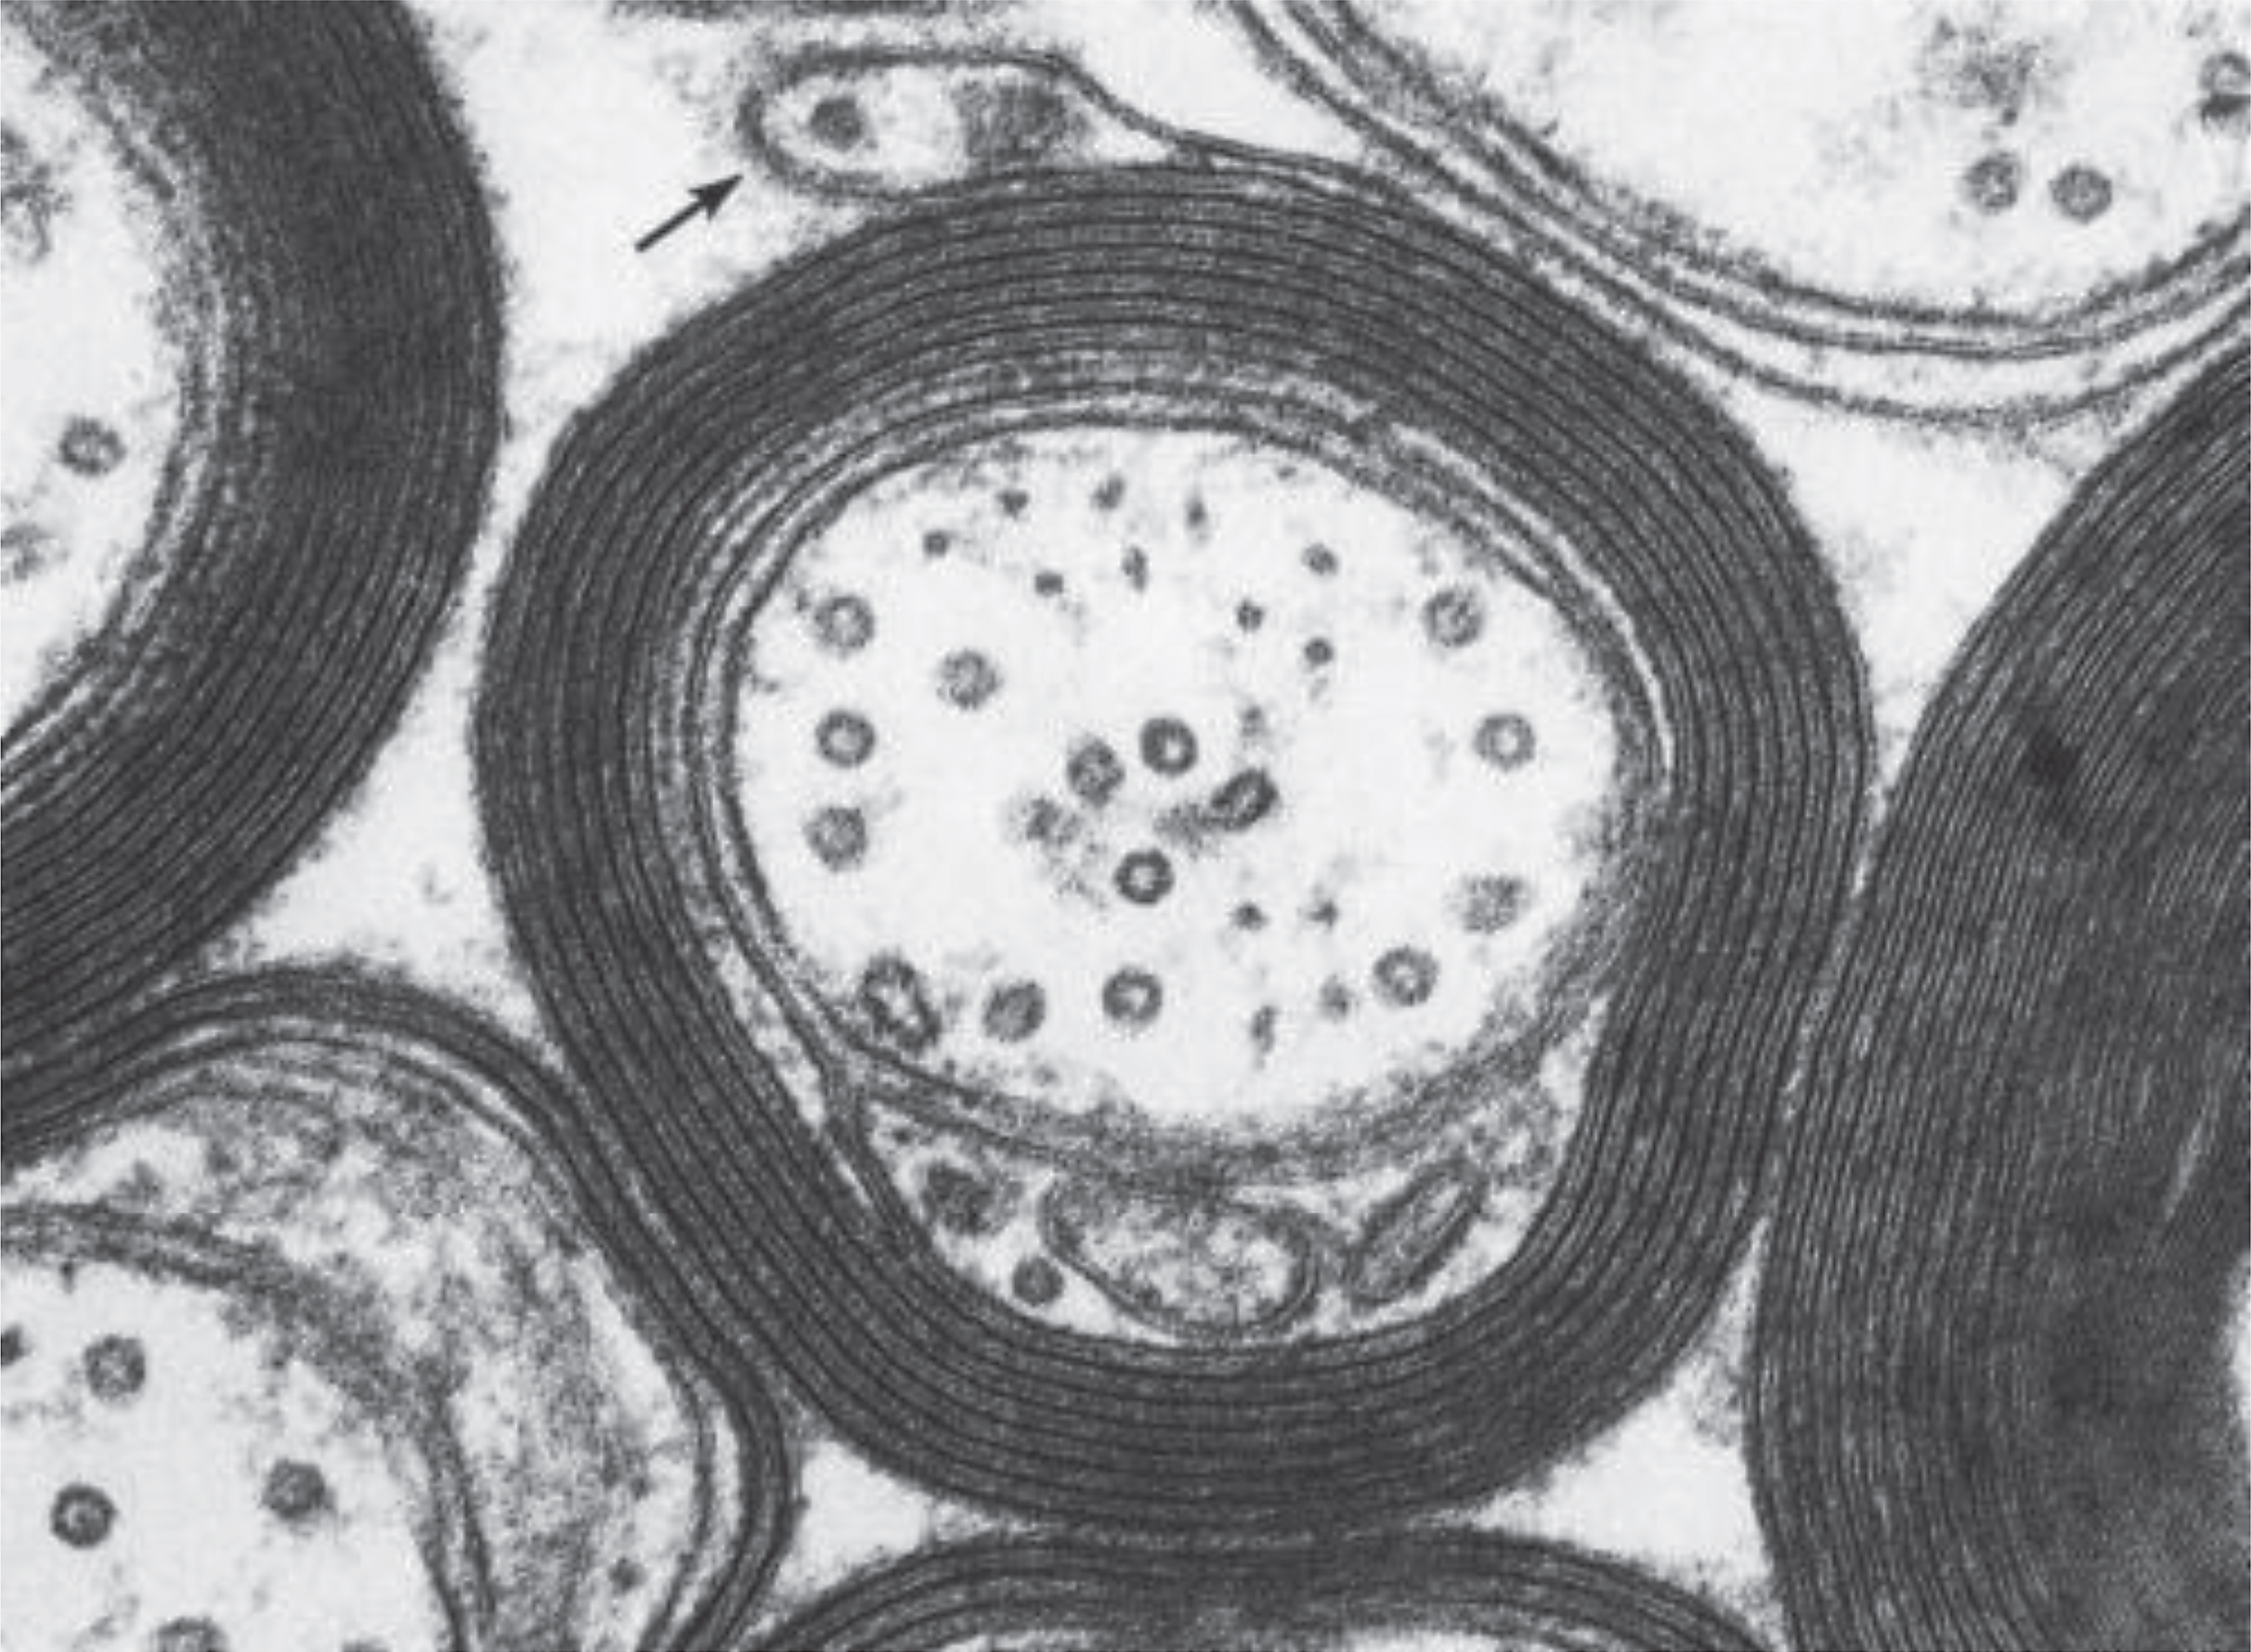
Fig.2
T2 Distribution from human white matter. The insert shows locations of myelin water and intra/extracellar water.
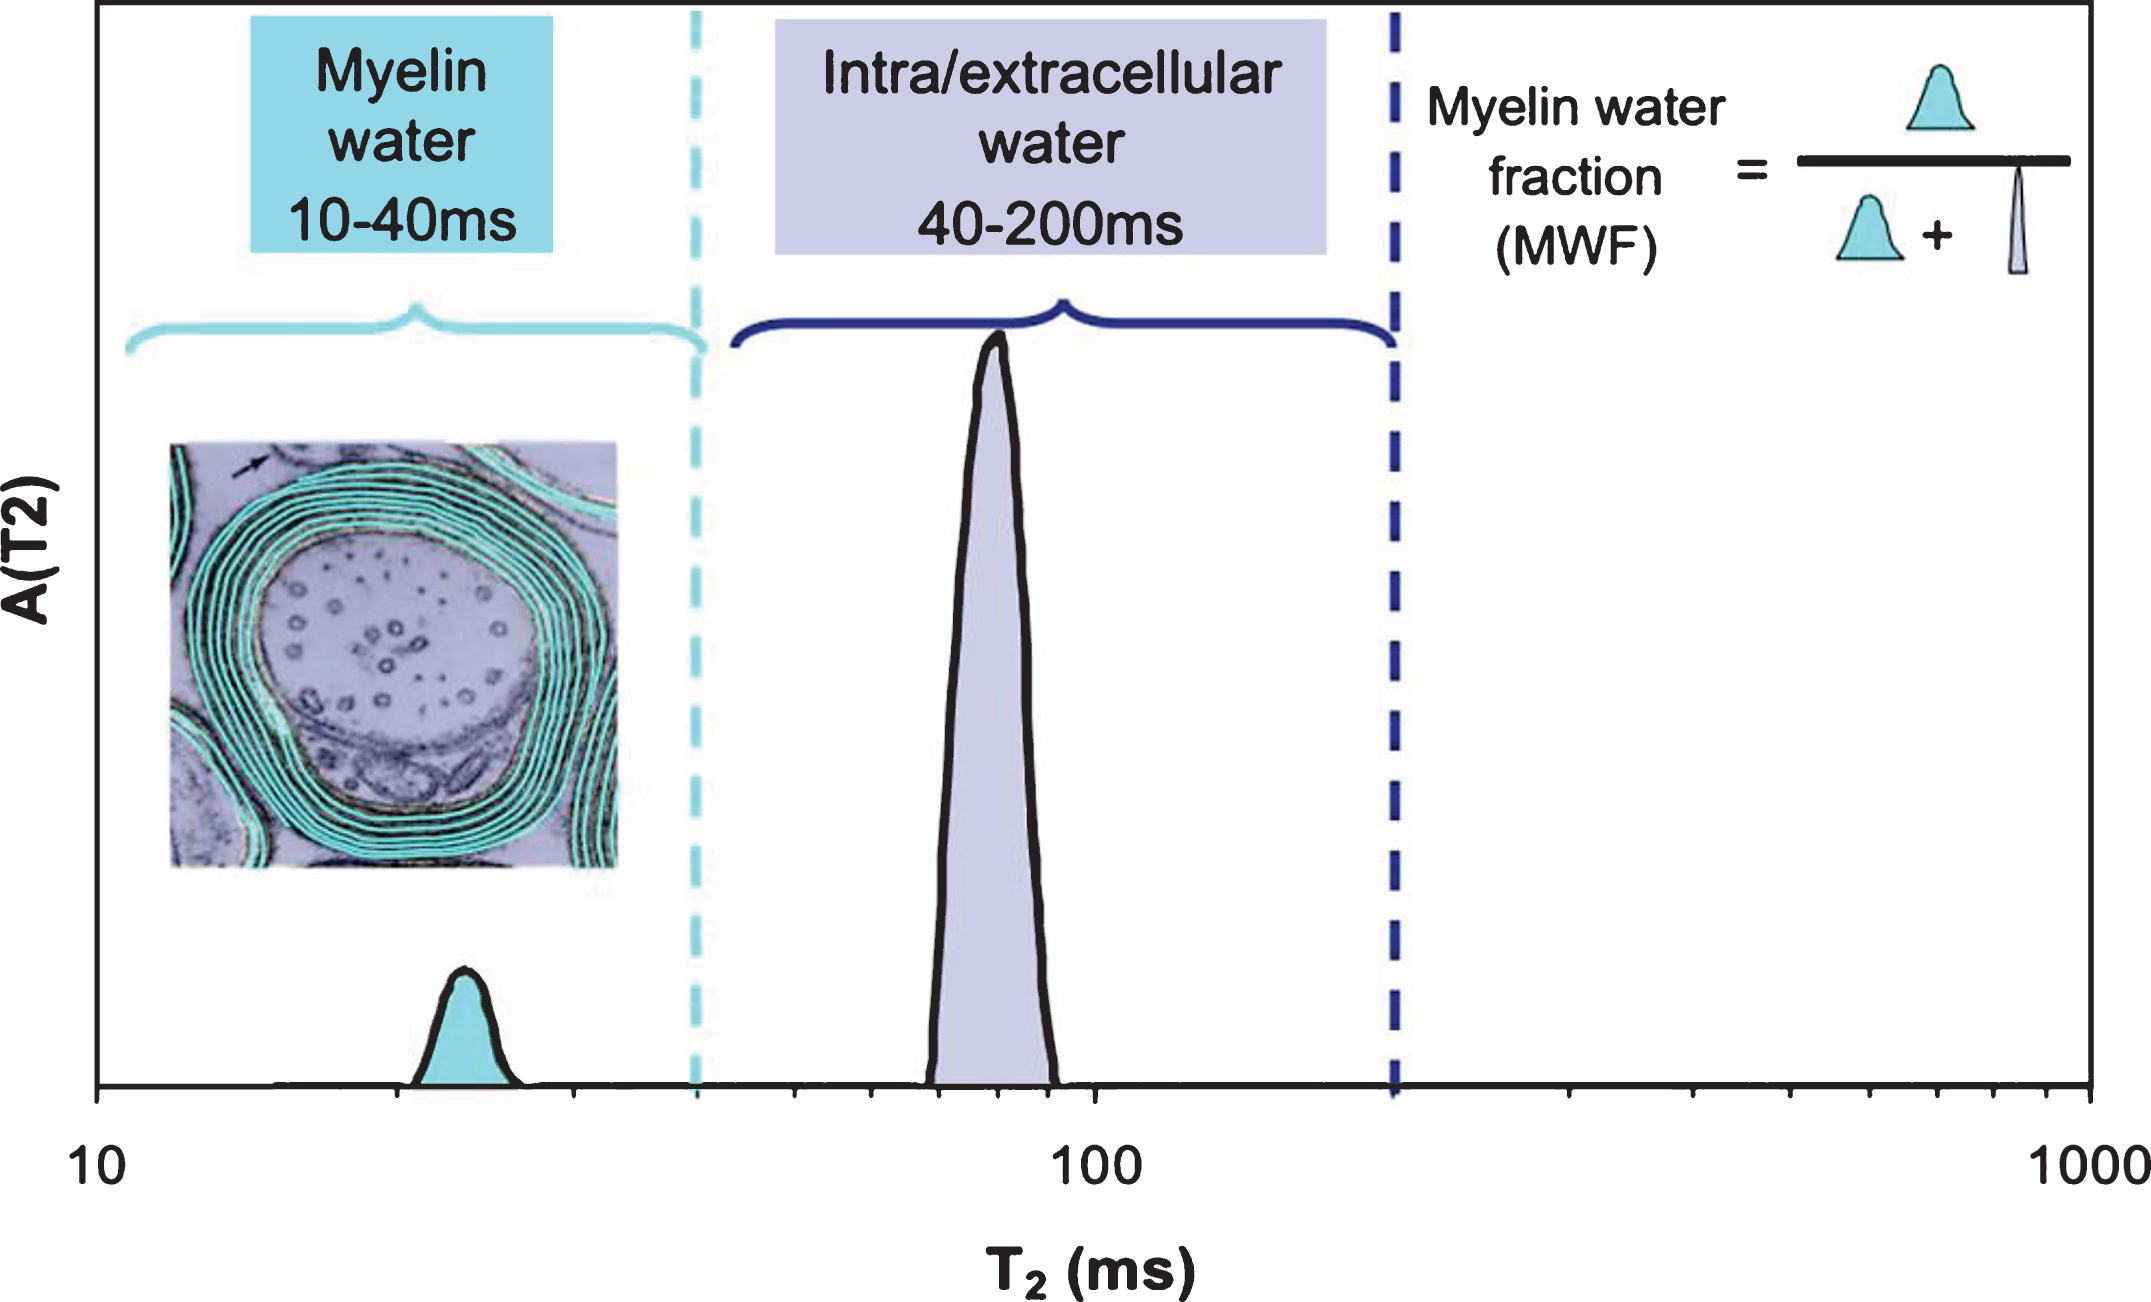
Fig.3
Myelin water fraction image from healthy brain.

Fig.4
Example of a 7T (a) TE = 20.1 ms image and (b) myelin water map, and (c) corresponding luxol fast blue histology image of the parieto-occipital region of an MS patient. A good qualitative correspondence is observed between the myelin water map and histology stain for myelin. The normal prominent myelination of the deeper cortical layers (arrows) is also visible on the myelin water image(Fig. 2, Laule C, Kozlowski P, Leung E, Li DK, Mackay AL, Moore GR. Myelin water imaging of multiple sclerosis at 7 T: Correlations with histopathology. Neuroimage. 2008;40:1575-80).

Fig.5
Gender-combined myelination trajectories for each white matter region and pathway spanning 83 through 2040 days of age. Points represent the mean values with error bars corresponding to the measurement standard deviation (Fig. 6, Deoni SC, Dean DC, 3rd, O’Muircheartaigh J, Dirks H, Jerskey BA. Investigating white matter development in infancy and early childhood using myelin water faction and relaxation time mapping. Neuroimage. 2012;63(3):1038-53).

Fig.6
Plots of frontal myelin water fraction in relation to age and education in healthy comparison subjects (control) and patients with schizophrenia. While statistically significant relations between frontal myelin water fraction and both age (r = 0.47, p = 0.01) and education (r = 0.51, p = 0.006) were observed in healthy subjects, no statistically significant relations were seen in patients with schizophrenia (Fig. 4, Flynn SW, Lang DJ, Mackay AL, Goghari V, Vavasour IM, Whittall KP, et al. Abnormalities of myelination in schizophrenia detected in vivo with MRI, and post-mortem with analysis of oligodendrocyte proteins. Mol Psychiatry. 2003;8(9):811-20).
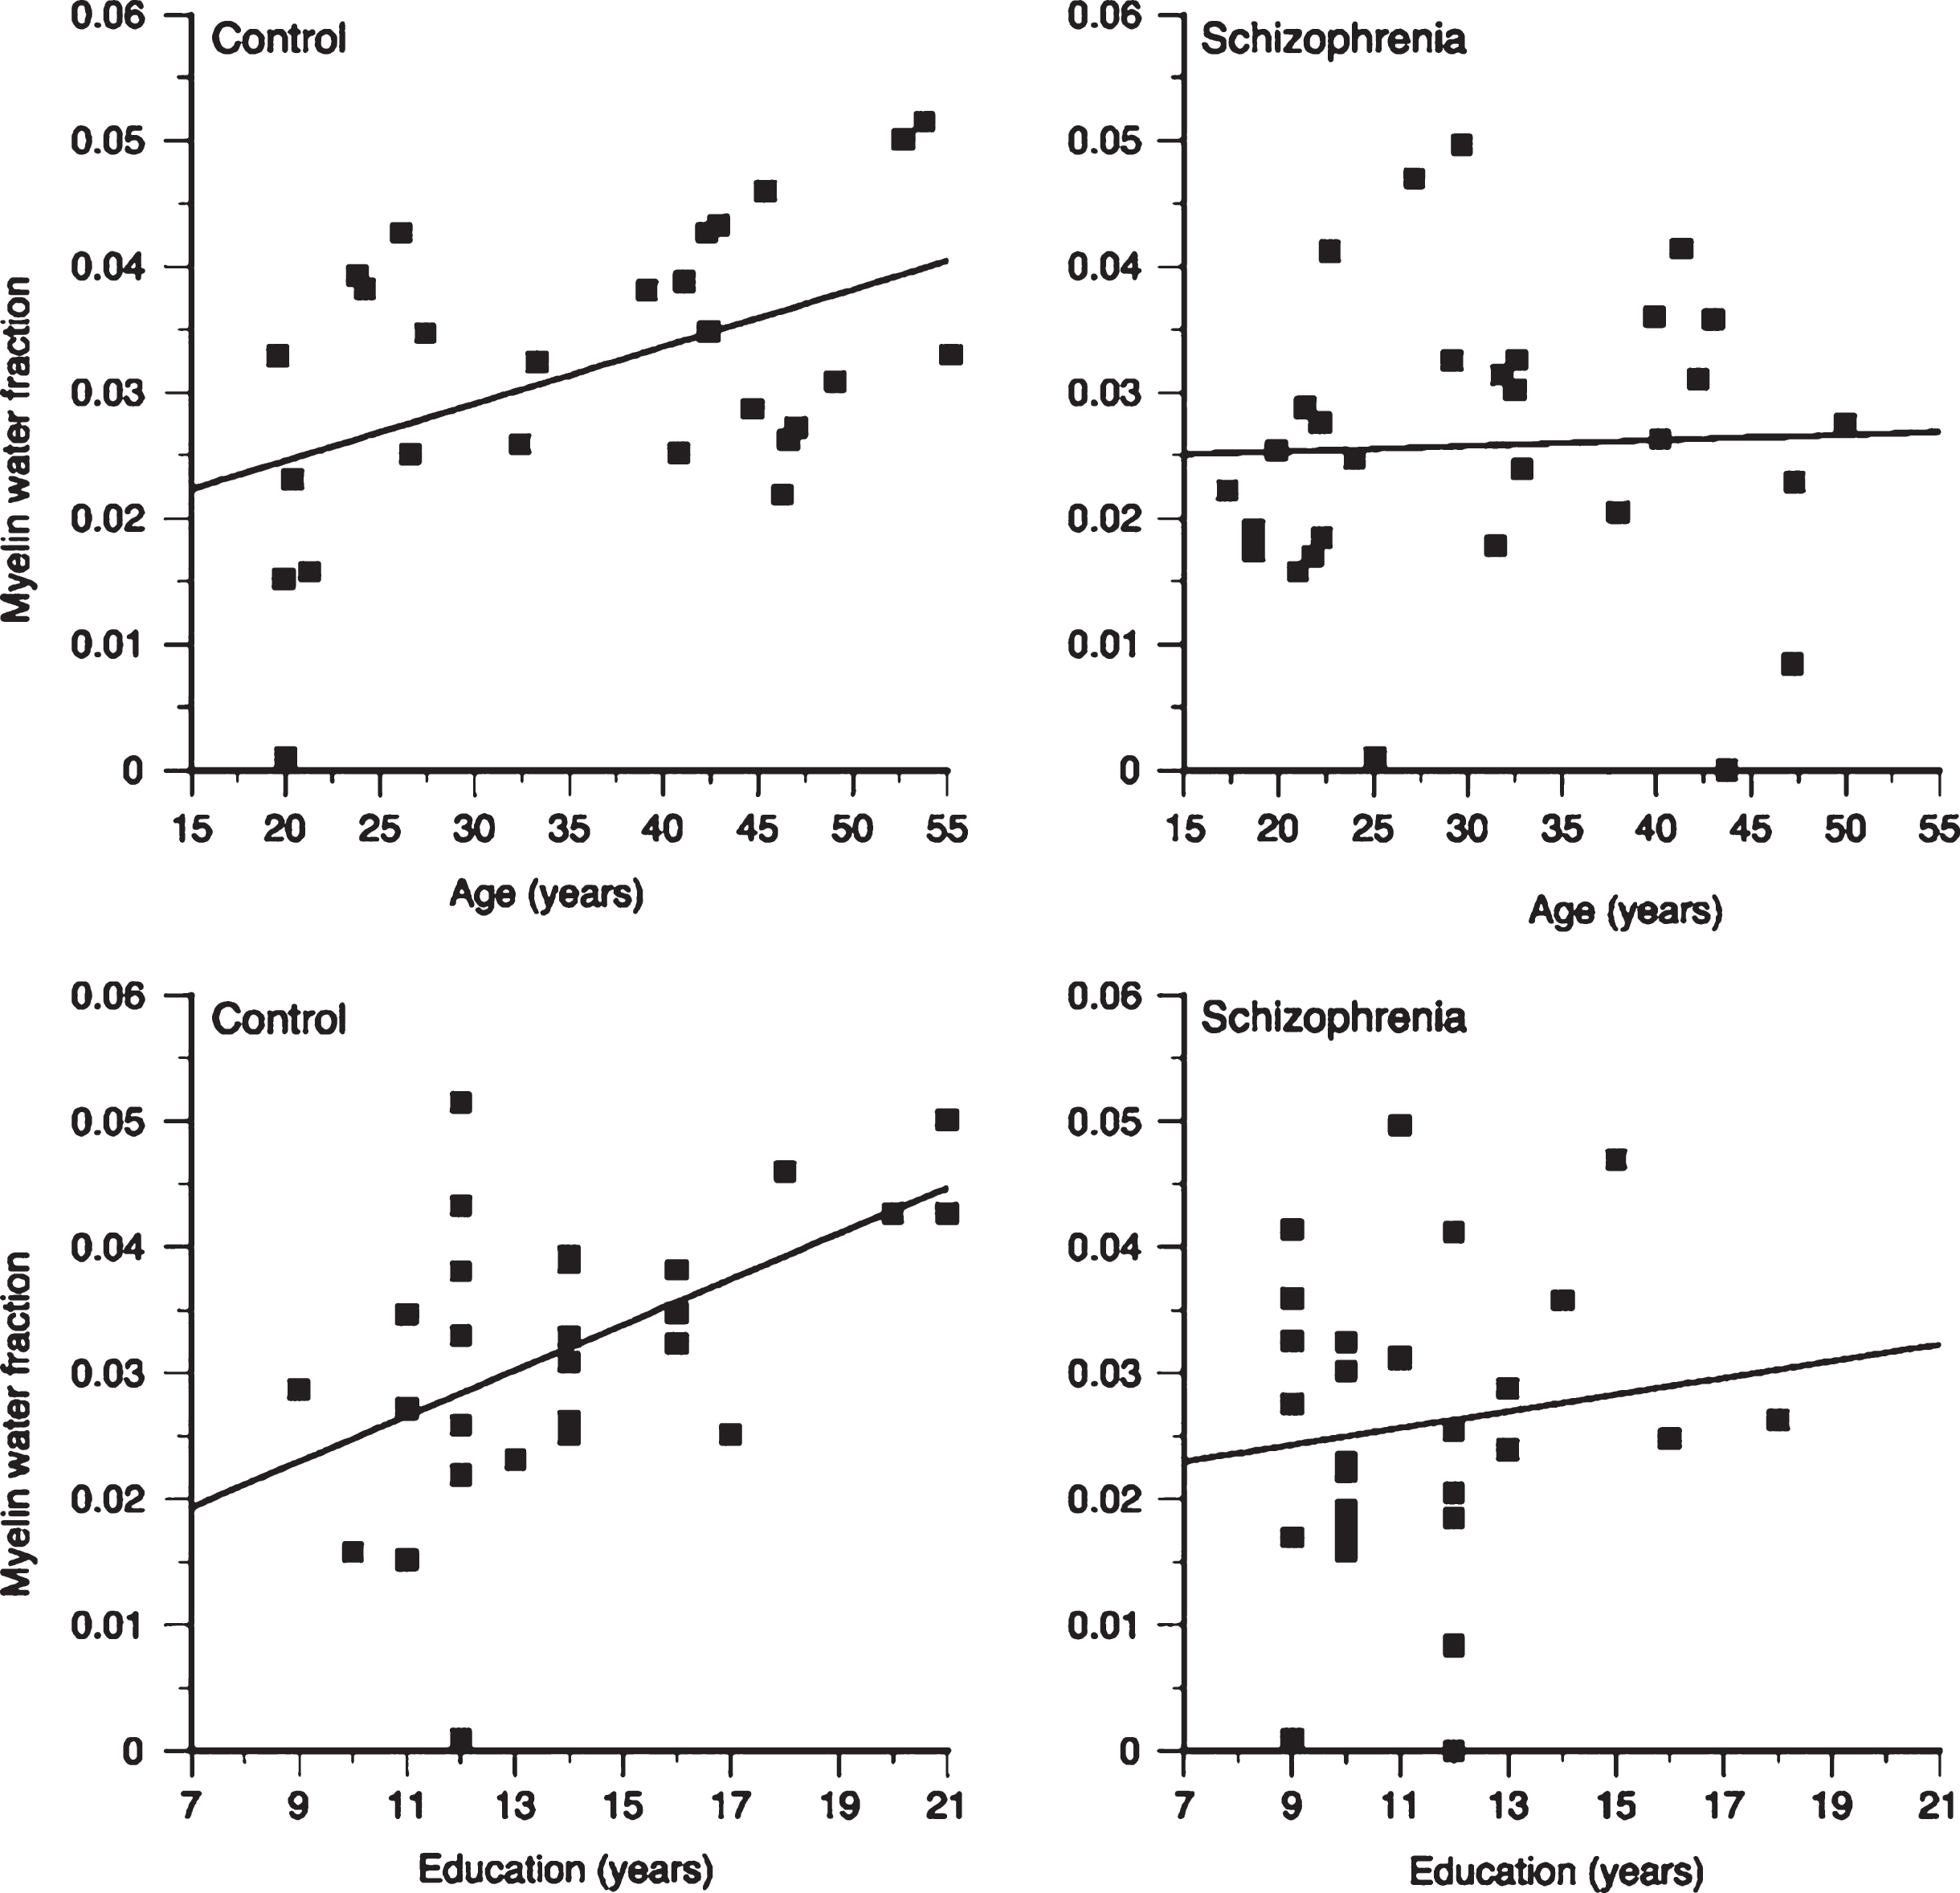
Fig.7
Heat map of myelin water fraction. Left side: T2w image of a Multiple-Sclerosis (MS) patient. Right side: heat map of a myelin water imaging (MWI). T2-hyperintense MS-lesions show clear reductions of myelin water fraction (MWF) (white arrows, right side) (Fig. 2, Faizy TD, Thaler C, Kumar D, Sedlacik J, Broocks G, Grosser M, et al. Heterogeneity of Multiple Sclerosis Lesions in Multislice Myelin Water Imaging. PLoS One. 2016;11(3):e0151496).

Fig.8
Group differences in myelin water fraction (MWF) between healthy controls and participants with chronic stroke. MWF was significantly reduced in whole-cerebrum normal appearing white matter (NAWM) in the stroke group comparedtowhole-cerebrum NAWMinthehealthy group(A),intheipsilesional posterior limb of internal capsule (PLIC) and non-dominant PLIC MWF in the healthy group (B) and in the contralesional PLIC for the stroke group versus dominant PLIC in the healthy group (C) (*p b 0.05). Error bars represent standard deviation (Fig. 5, Borich MR, Mackay AL, Vavasour IM, Rauscher A, Boyd LA. Evaluation of white matter myelin water fraction in chronic stroke. Neuroimage Clin. 2013;2:569-80).
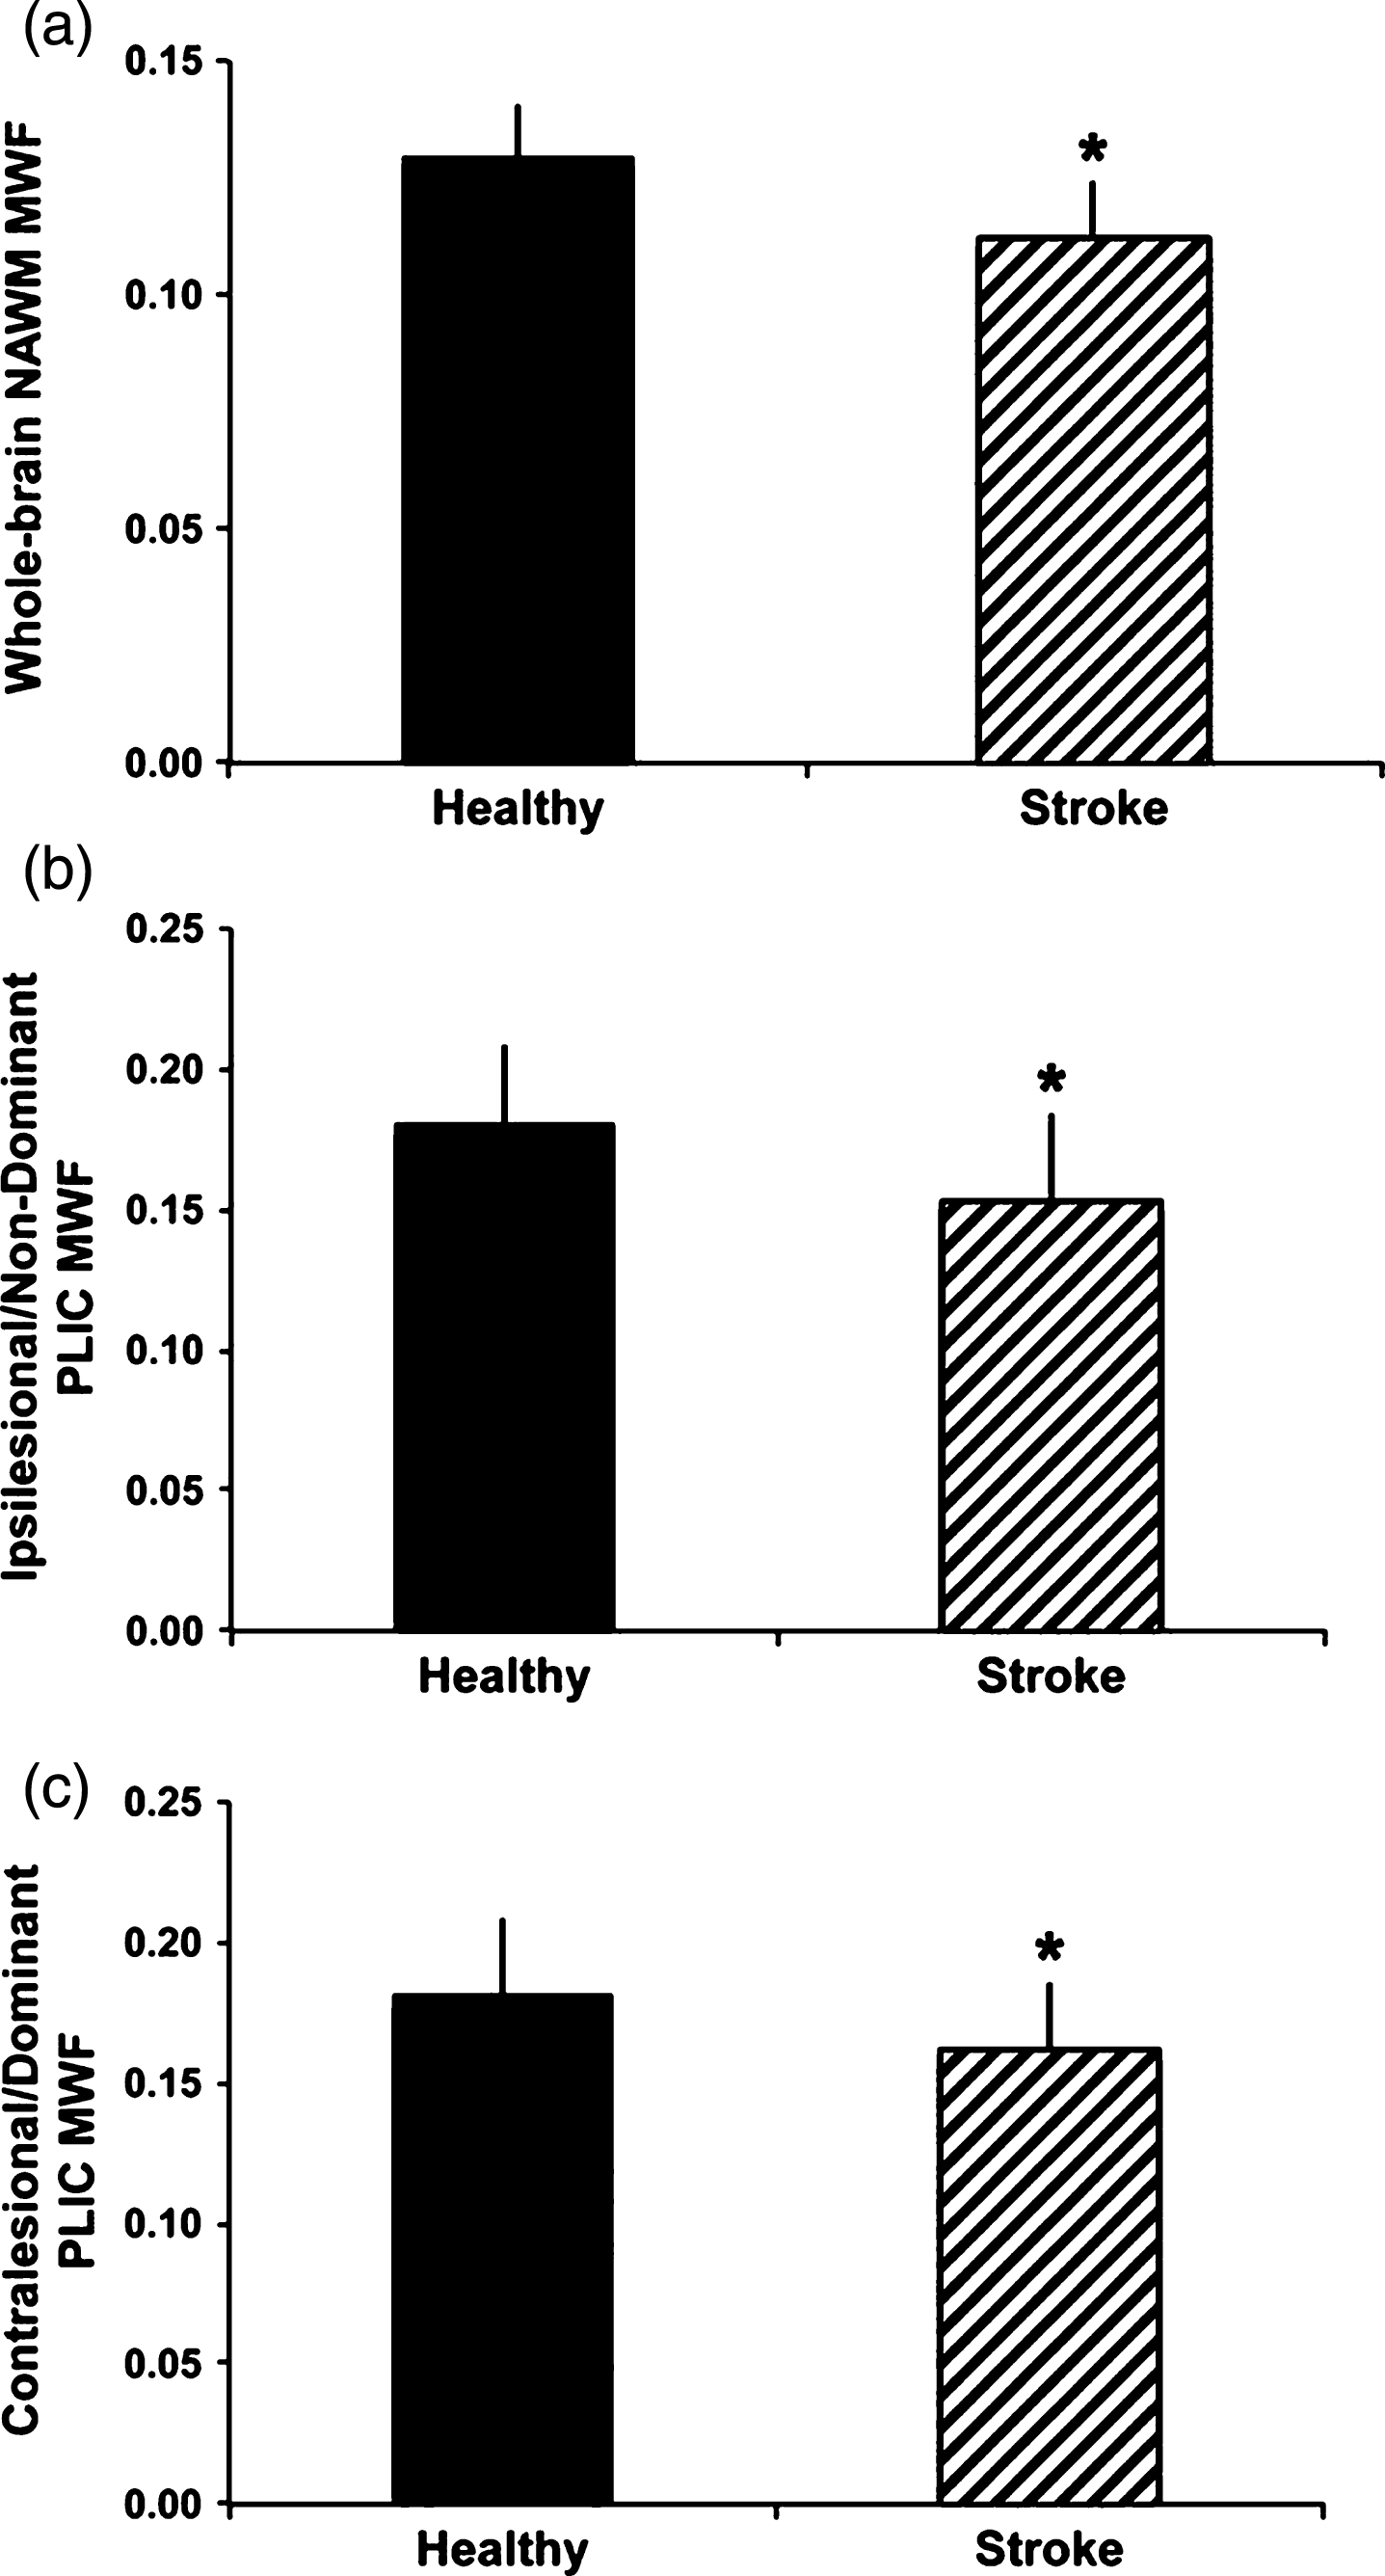
Fig.9
Boxplot representation (box containing median and 25th and 75th percentiles) of MWF. The left side of each panel (dark box) corresponds with values in contralaterial normal appearing white matter, the right side (light box) with values in contralateral unidentified bright objects (from Fig. 3, Billiet T, Madler B, D’Arco F, Peeters R, Deprez S, Plasschaert E, et al. Characterizing the microstructural basis of “unidentified bright objects” in neurofibromatosis type 1: A combined in vivo multicomponent T2 relaxation and multi-shell diffusion MRI analysis. Neuroimage Clin. 2014;4:649-58).
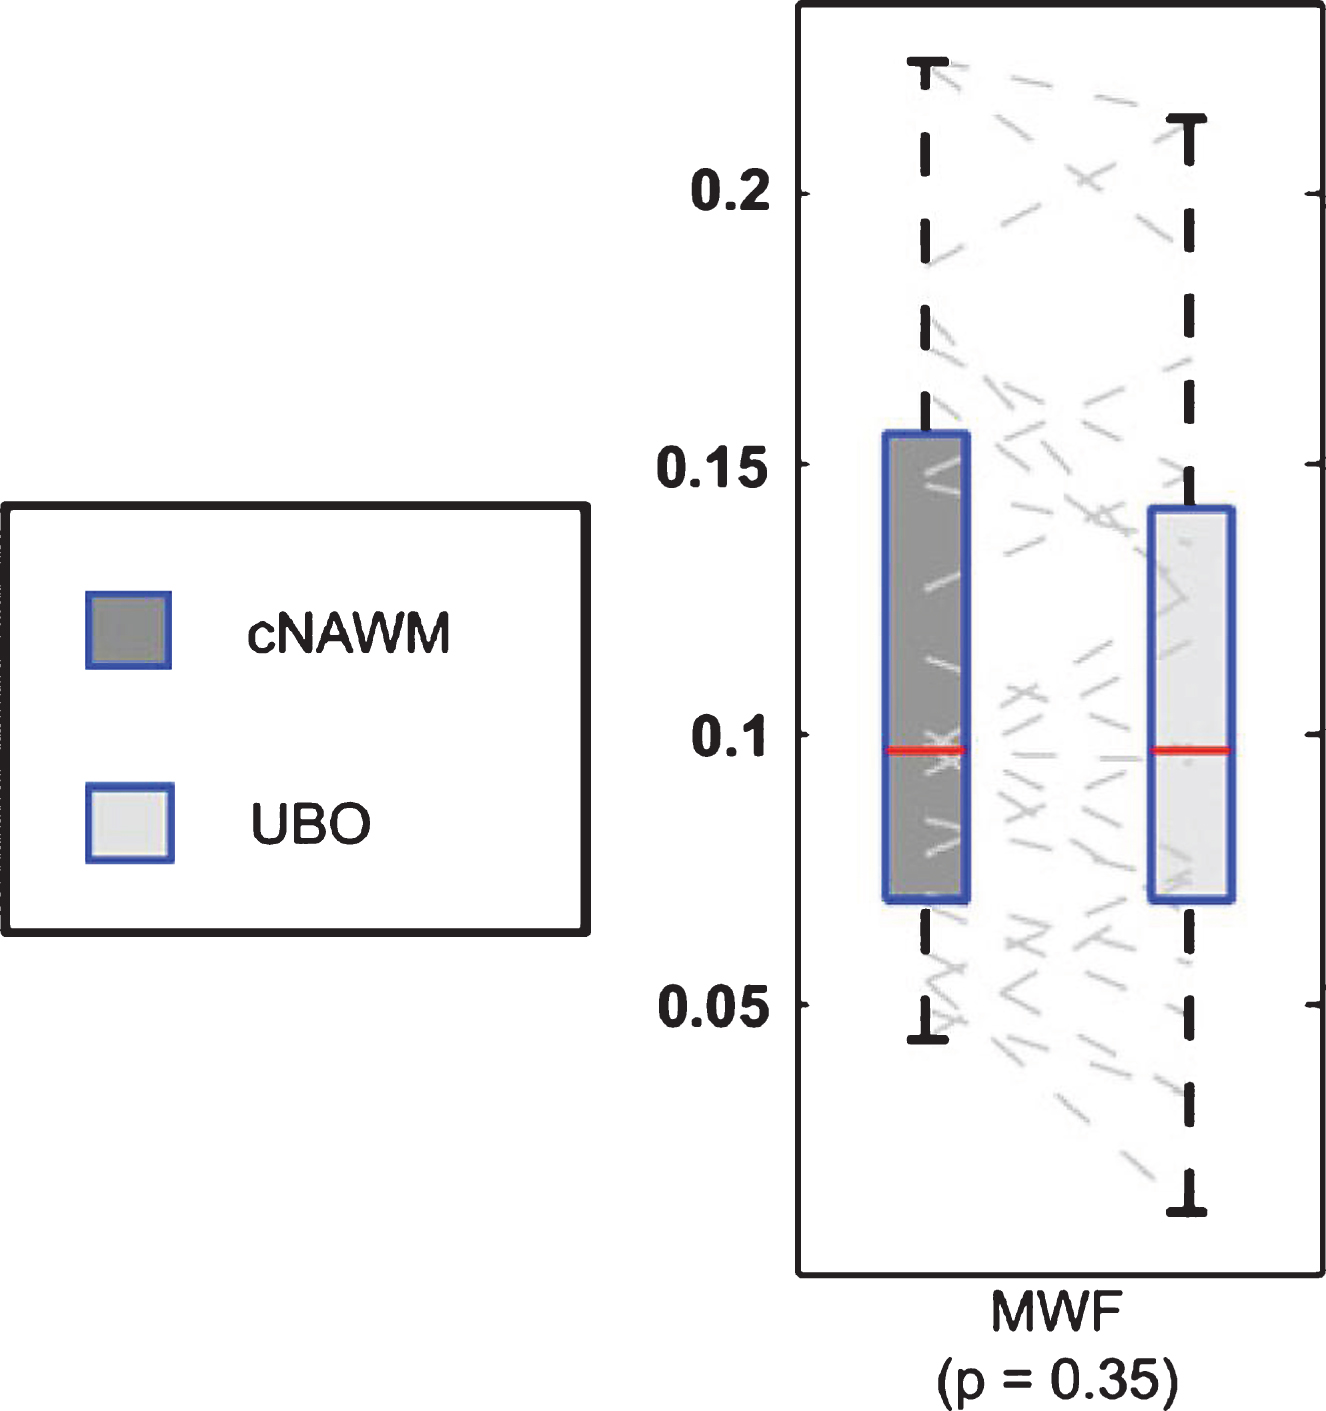
Fig.10
Representative myelin water fraction maps. Myelin water fraction maps from a concussed athlete at baseline (left) and two weeks post-injury (right). Myelin water fraction is measured as the T2-signal from 0–40ms divided by the total T2 signal. A region of the corpus callosum with visible reduction in MWF post-injury is highlighted by the red arrow (Fig. 1, Wright AD, Jarrett M, Vavasour I, Shahinfard E, Kolind S, van Donkelaar P, et al. Myelin Water Fraction Is Transiently Reduced after a Single Mild Traumatic Brain Injury - A Prospective Cohort Study in Collegiate Hockey Players. PLoS One. 2016;11(2):e0150215).
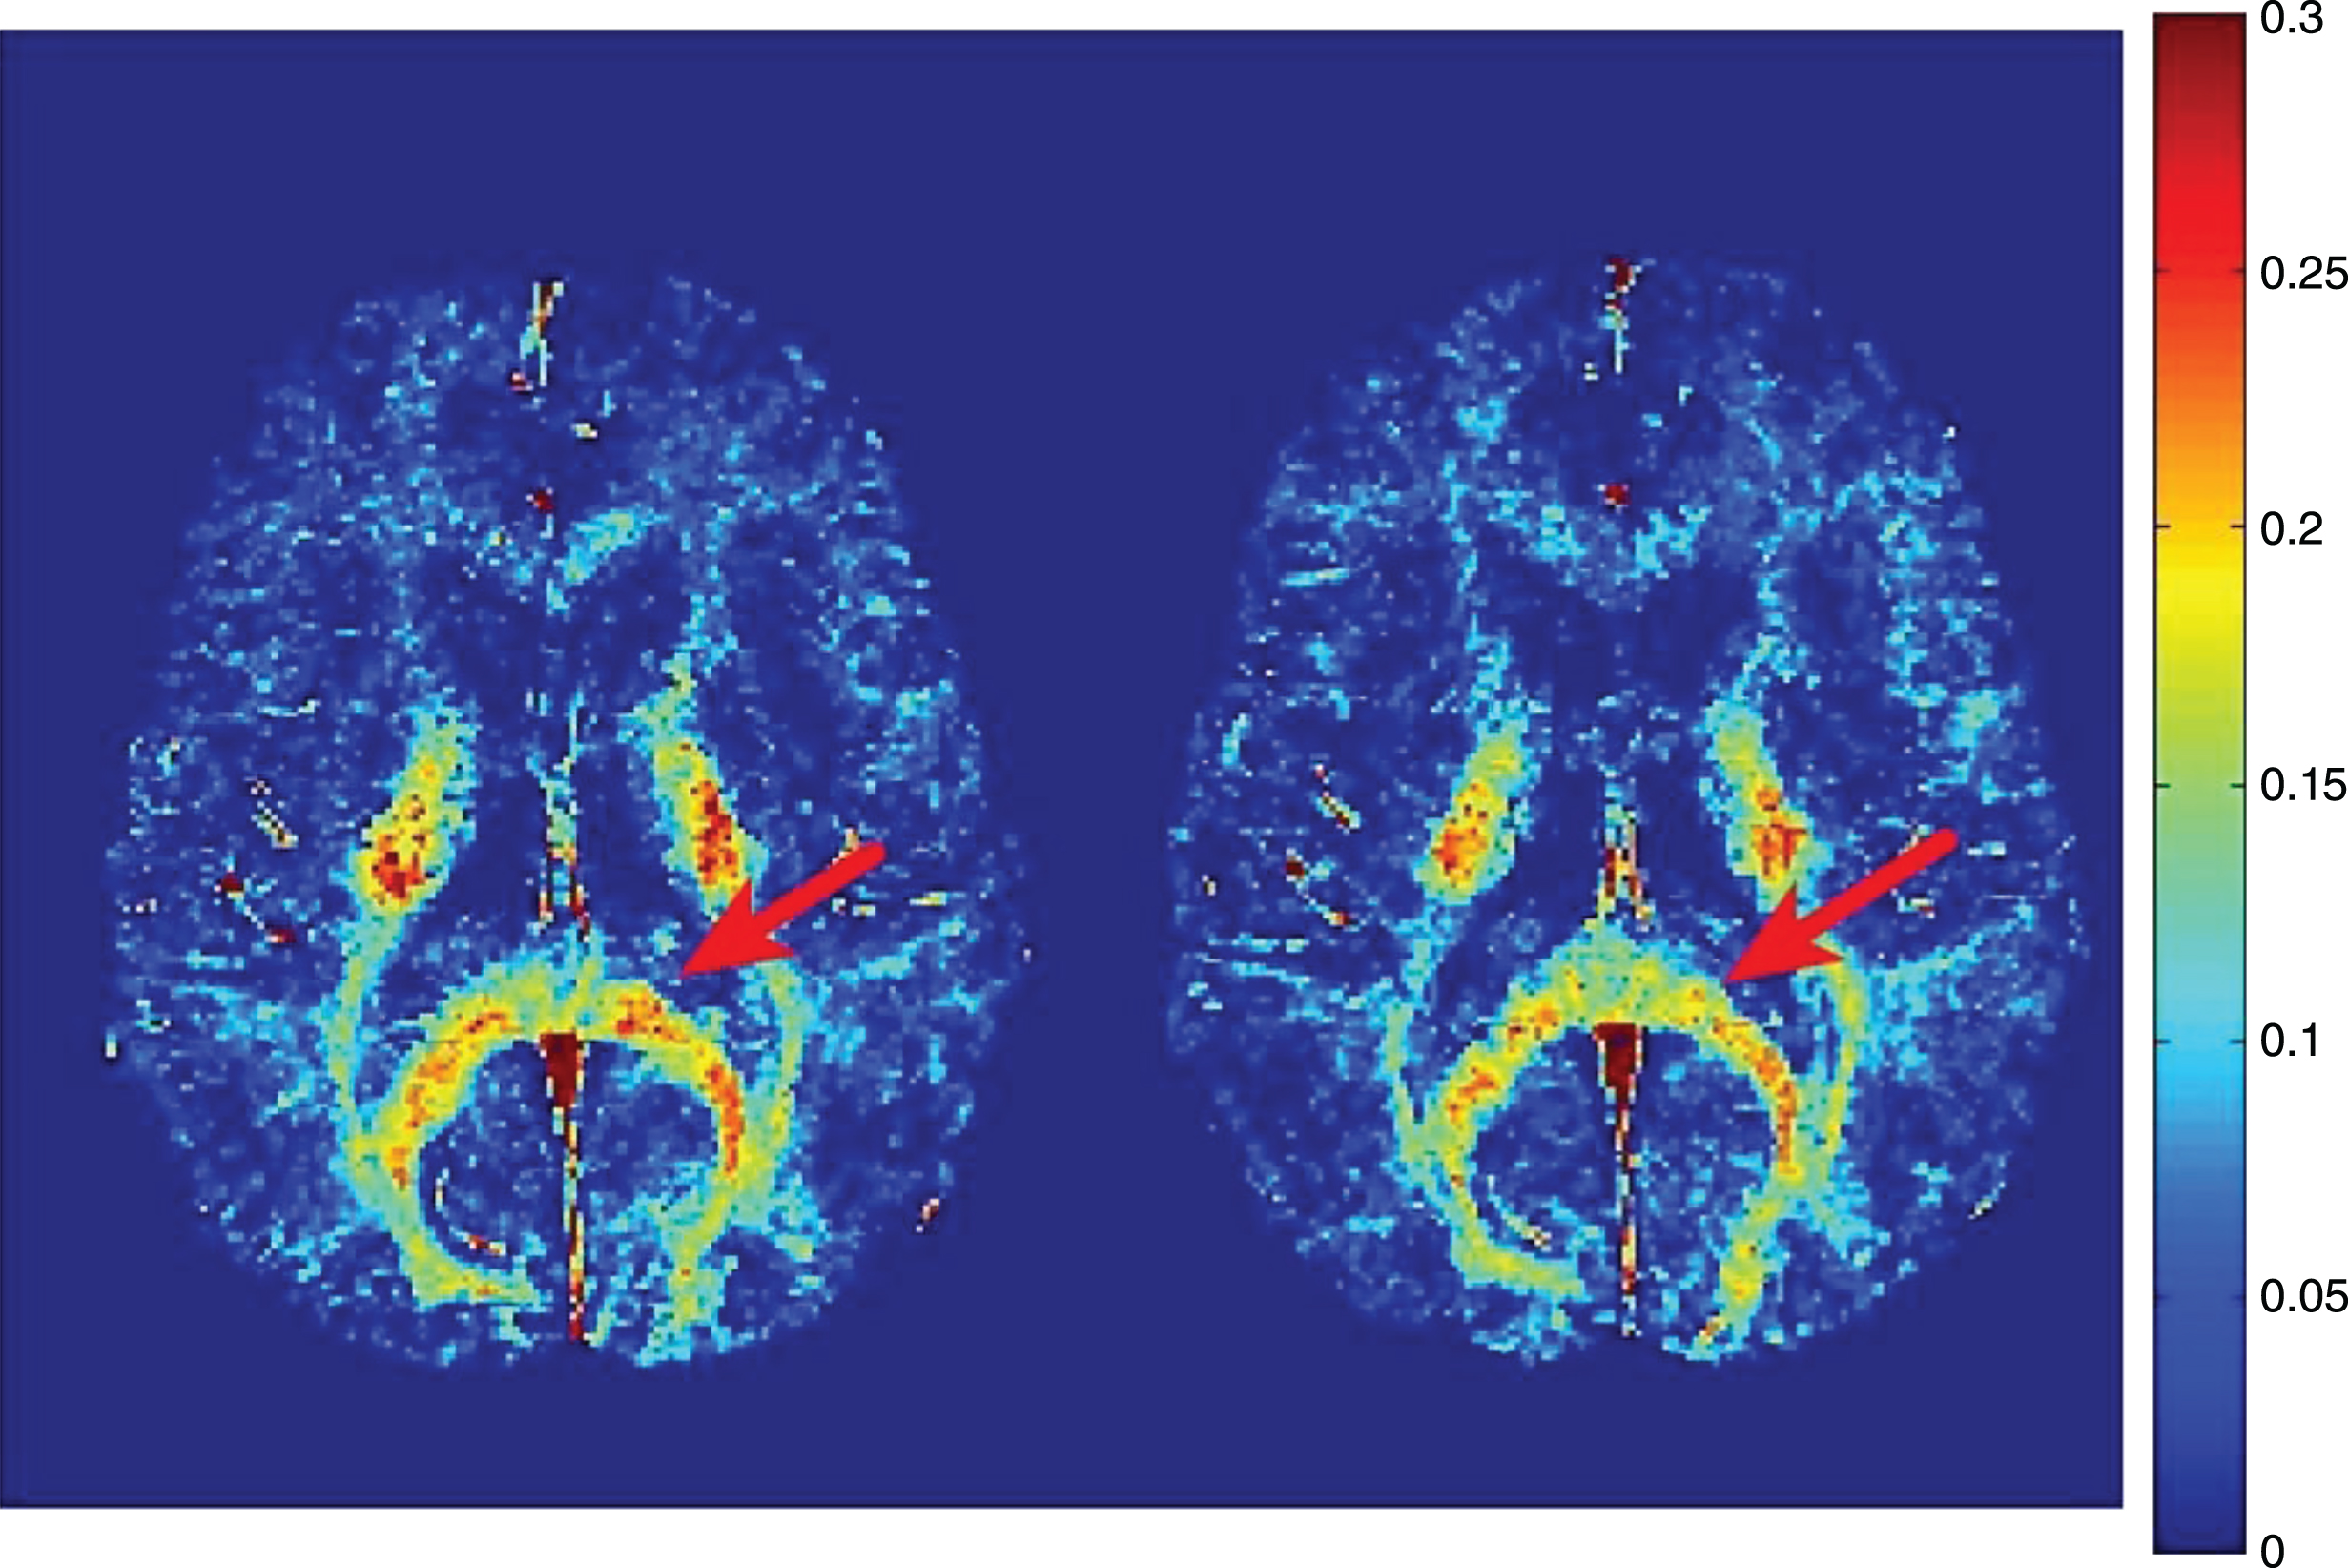
Fig.11
Relative myelin water fraction change post-injury. Change scores for myelin water fraction, relative to baseline, plotted against time for each subject with a mild traumatic brain injury in all significant voxels A) across the whole brain; B) in the splenium of the corpus callosum (a structure most commonly affected in mild TBI). Dots represent data points for each injured athlete (mean +/–standard error plotted in grey.) Note: time zero refers to baseline (Fig. 2, Wright AD, Jarrett M, Vavasour I, Shahinfard E, Kolind S, van Donkelaar P, et al. Myelin Water Fraction Is Transiently Reduced after a Single Mild Traumatic Brain Injury - A Prospective Cohort Study in Collegiate Hockey Players. PLoS One. 2016;11(2):e0150215).