
Hypoxia Marker GLUT-1 (Glucose Transporter 1) is an Independent Prognostic Factor for Survival in Bladder Cancer Patients Treated with Radical Cystectomy
Abstract
Background:
Tumour hypoxia, which is frequent in many cancer types, is associated with treatment resistance and poor prognosis. The role of hypoxia in surgically treated bladder cancer (BC) is not well described. We studied the role of hypoxia in two independent series of urothelial bladder cancers treated with radical cystectomy.
Methods:
279 patients from the University Hospital Network (UHN), Toronto, Canada, and Turku University, Finland were studied. Hypoxia biomarkers (HIF1-α, CAIX, GLUT-1) and proliferation marker Ki-67 were analyzed with immunohistochemistry using defined tissue microarrays. Kaplan-Meier methods and Cox proportional hazards regression models were used to investigate prognostic role of the factors.
Results:
In univariate analyses, strong GLUT-1 positivity and a high Ki-67 index were associated with poor survival. In multivariate model containing clinical prognostic variables, GLUT-1 was an independent prognostic factor associated with worse disease-specific survival (HR 2.9, 95% CI 0.7–12.6, Wald p = 0.15 in the Toronto cohort and HR 3.2, 95% CI 1.3–7.5, Wald p = 0.0085 in the Turku cohort).
Conclusion:
GLUT-1 is frequently upregulated and is an independent prognostic factor in surgically treated bladder cancer. Further studies are needed to evaluate the potential role of hypoxia-based and targeted therapies in hypoxic bladder tumours.
INTRODUCTION
Muscle-invasive, high-grade urothelial carcinoma of the urinary bladder is an aggressive malignancy. An important curative treatment is radical cystectomy (RC), pelvic lymph node dissection (PLND) and peri-operative chemotherapy. However, survival continues to be compromised by the presence of micrometastatic disease at the time of surgery. Up to 40–50% of bladder cancer (BC) patients with non-organ confined tumours and 60–80% with node metastases will die of disease [1, 2]. Compared to other solid tumours such as breast, colon or lung, the current clinical management of BC is lagging behind in terms of clinically robust and validated biomarkers that can identify patients at a high risk of disease recurrence after radical surgery. A better understanding of BC molecular biology has opened new avenues, especially with milestone projects like the Cancer Genome Atlas Project (TCGA) [3]. Genomic-based signatures that can better identify patients at risk for recurrence than clinical models alone, have been recently developed and validated [4].
Most solid tumours show intratumoural heterogeneity with respect to tumour oxygenation. High levels of tumour hypoxia are associated with poor prognosis in many cancer types [5]. This may be due to local and systemic treatment resistance through decreased apoptosis, increased genetic instability leading to a mutational phenotype, and increased capacity for metastatic spread due to altered gene expression and increased angiogenesis [6, 7]. Many studies have suggested that direct measurements of pO2 in tumours or indirect staining for tumour hypoxia markers (E.g. HIF1a-related markers) in situ can predict outcome following radiation therapy or surgery [6, 8, 9].
Indirect tumour hypoxia may be measured with immunohistochemistry using antibodies against intrinsic hypoxia biomarkers, such as hypoxia inducible factor-α (HIF1-α), carbonic anhydrase IC (CAIX), and glucose transporter-1 (GLUT-1). Whereas HIF1-α expression is rapidly induced in acute hypoxia, prolonged hypoxia is most likely required in order to induce detectable CAIX and GLUT-1 expression [6, 10]. More advanced analyses include measurement of systemically administered extrinsic hypoxia markers, 2-nitroimadazoles, such as pimonidazole, which undergo detectable structural changes under hypoxic conditions. Radiolabeled 2-nitroimadazoles may also be detected with positron emission tomography (PET) [5, 11].
Hypoxia is known to have an impact on treatment outcome in BC, especially on the effect of radiation. Hoskin and coworkers demonstrated in the BCON trial that hypoxia modification improves overall survival among BC patients undergoing radiation [12]. Furthermore, patient benefitting most from hypoxia modification may be identified with indirect hypoxia measurement, e.g. immunostaining for HIF1-α, as demonstrated by Hunter and coworkers using BCON trail material [13]. As the role of hypoxia is less known in surgically treated patients, we aimed to evaluate the potential role of hypoxia biomarkers measured with immunohistochemistry as prognostic factors for survival after radical surgery in two independent BC series.
Material and Methods
Patient inclusion criteria and characteristics
Two radical cystectomy cohorts (University Health Network (UHN), Toronto, Canada and University of Turku, Turku, Finland) were studied after research ethical board (REB) approval. After initial exclusion of 24 cases (6 patients with non-urothelial cancer and 18 patients with failed immunohistological analysis), the final study cohort included 279 patients selected with long follow-ups available: 99 cases up to 2008 (UHN) and 180 cases up to 2005 (University of Turku). Only urothelial BCs treated with radical cystectomy without neoadjuvant therapy were included in the study. There was a substantial difference in the practice of PLND between the two centers. In Turku, PLND was not performed before 1995, and a limited PLND was performed from 1995. In Toronto, most patients underwent extended PLND (cranial boundary of dissection being either the aortic bifurcation or mid common iliac vessels). After the surgery, patients were followed every 3 months for the first year and semi-annually thereafter.
Detailed clinicopathological data were collected retrospectively regarding general patient history (gender, age, smoking history), tumour characteristics (grade, stage, nodal status, lymphovascular invasion (LVI)), details of treatment (surgery, adjuvant therapy) and clinical follow-up (date of possible disease recurrence, last follow-up visit or death, and cause of death). Survival data were obtained from patient charts and hospital registries and confirmed from cancer registries and governmental death registries. Any death with recurrent or metastatic BC was defined as cancer-specific mortality.
Tissue microarray (TMA) construction and staining analyses
Tissue microarrays (TMAs) were independently constructed from archival formalin-fixed, paraffin-embedded donor blocks from radical cystectomy specimens collected at both institutions. For this study, expert GU-pathologists re-reviewed the radical cystectomy slides to confirm the histological tumour type, grade and TNM-stage in each case. From each donor block, two cores were included in the recipient block in Toronto TMA and three corer per patient were included in the Turku cohort. H&E sections from the each TMA block were reviewed by a GU pathologist (AE), to confirm the presence of urothelial carcinoma in each TMA core. TMA cores that lacked tumour were not included in the analysis.
For the IHC staining, 5μm sections from the TMA blocks were used to evaluate staining for hypoxia biomarkers (HIF1α, CAIX, GLUT-1) and proliferation index (Ki-67). Staining for HIF-1-alpha was done with a mouse monoclonal anti-HIF-1-alpha antibody (BD Transduction Lab /610959) at a dilution of 1:200, with overnight incubation. Each core was assessed for cytoplasmic HIF-1-alpha expression and scored as 0 = no staining; 1 = positive staining. HIF-1-alpha was assessed in terms of cytoplasmic, rather than nuclear, staining, since the cytoplasmic staining has been reported to be a stronger predictor of outcome, than nuclear staining [14]. Tissue from a Siha cervix cancer xenograft was used as a positive control. Staining for GLUT-1 was detected using a rabbit polyclonal anti-GLUT-1 antibody (Dako/A3536) at a dilution of 1:2000, with overnight incubation. Red blood cells were used as positive control.
Each core was assessed for GLUT-1 expression and scored as 0 = no staining; 1 = weak expression; 2 = intermediate expression; and 3 = strong expression. Staining for CaIX was done using a mouse monoclonal anti-CaIX antibody (Bayer/MN75) at a dilution of 1:200, with overnight incubation, as described previously [15]. Each core was assessed for CaIX expression and scored as 0 = no staining; 1 = weak expression; 2 = intermediate expression; and 3 = strong expression. Proliferation marker Ki-67 was detected with a rabbit monoclonal anti-Ki-67 antibody (NeoMarker/Sp6). Colon cancer tissue was used as a positive control. Each core was assessed for Ki-67 expression and scored as percentage of positive cancer cells. For all markers, experiments were repeated without the primary antibody as a negative control. Cores with insufficient numbers of identifiable cancer cells were excluded.
Three independent reviewers, who received training from an expert GU pathologist (AE), at UHN, Toronto, graded the IHC results. All three reviewers were blinded to patient outcome. Only identifiable areas of urothelial carcinoma within each core were scored. Each reviewer scored all TMA cores. A final score for each core was reached by a consensus of the three scores. Cores for which a consensus could not be reached between the three reviewers were reviewed and scored by the expert GU pathologist. For patients who had intra-patient heterogeneity in scoring between different cores, the worst or highest score for each patient was used, based on the a-priori assumption that tumour behaviour would be more closely associated with the presence of highly hypoxic regions than with the average oxygenation.
Statistical analyses
The difference in marker distribution between the two study cohorts were estimated with Fisher’s exact test for categorical data (HIF1α, GLUT-1, and CAIX score) and Mann-Whitney test was used to compare the median Ki-67 score between the two cohorts. Associations between different biomarkers were estimated using the Fisher’s exact test for categorical biomarkers (GLUT-1, HIF1α, and CAIX) and the Mann-Whitney test for the continuous Ki-67 biomarker. The association of clinicopathological variables and biomarkers with disease-specific survival (DSS) was estimated using the Kaplan-Meier method, the log-rank test, and univariate and multivariate Cox proportional hazards regression models. For the multivariate analysis, the best clinical model was chosen by first fitting Cox proportional hazards regression model with gender, LVI, CIS, grade, T-category (modeled as T3/T4 vs T1/T2), and nodal status for DSS. Biomarkers significant in the univariate analysis were added to the model. Two sided p-values of 0.05 were used to assess statistical significance. All statistical analyses were performed using the open-source software R 2.12.1 and SAS version 9.2.
RESULTS
Basic clinicopathological characteristics of the two study cohorts are presented in Table 1. A total of 279 patients (99 from Toronto, UHN and 180 from the University of Turku) were included in the analyses.The median follow-up was 3.6 and 8.5 years in the Toronto and Turku cohorts, respectively. In both cohorts, the majority of patients were males (77% and 81%). Median age was 68 and 65 years in Toronto, and Turku, respectively and most patients had a history of smoking (62% and 52%). The majority of tumours were high grade (93% and 85%).
In the Toronto cohort, all patients underwent PLND with nodal metastases detected in 26% of cases. In the Turku cohort, PLND was performed in 37% of patients with 7% being node positive. In the Toronto cohort, 50% of tumours were pT3-4 (compared to 32% in University of Turku cohort) and 23% of patients received adjuvant chemotherapy (versus 1% in Turku). The frequency of carcinoma in situ (48% and 35% in Toronto, Turku cohorts, respectively) and LVI (37% and 38%) were similar in both cohorts.
Representative examples of positive IHC staining of the hypoxia markers HIF1-α, CAIX and GLUT-1 are presented in Fig. 1. Marker scoring results and distribution of the IHC staining in the two cohorts are presented in Fig. 2 and Table 2. CAIX staining was negative in 67% of cases (71% in Toronto and 65% in Turku cohorts, respectively). In the total study population, weak, intermediate, or strong CAIX staining was noted in 16% , 11% , and 6% of cases respectively. HIF1-αstaining was positive in only 8% of cases in both study cohorts. GLUT-1 staining was detected in 79% of cases. The staining was weak, moderate and strong in 42% , 27% , and 9% , of the cases, respectively. No significant differences were noted in the hypoxia marker intensity distributions in the two cohorts (Fig. 2). The Ki-67 proliferation index was non-significantly higher in Toronto cohort (Mann-Whitney test p = 0.144).
Table 3 presents the association between different biomarkers. In both cohorts a significant association was found between CAIX and GLUT-1. Patients who stained positive for CAIX also tended to stain positive for GLUT-1. A significant association between Ki-67 and GLUT-1 was also observed as higher values of Ki-67 stains were noted for GLUT-1 positive stains.
The associations between the clinicopathological variables and biomarkers were studied using Kaplan-Meier plots, the log-rank test and Cox proportional hazards regression models. In both cohorts, high T-category, nodal metastases and presence of LVI were associated with increased disease-specific mortality risk (Table 4). Of the hypoxia markers, HIF1-α and CAIX were not associated with prognosis of either study cohorts. In contrast, positive GLUT-1 staining was associated with worse DSS in both cohorts and patients with most intense GLUT-1 staining had the worst survival (Fig. 3).
As the GLUT-1 was the most interesting biomarker based on survival analyses, the association of GLUT-1and clinicopathological variables was analyzed. The only variable with significant association withGLUT-1 immunosignal was tumor grade (p = 0.046). For the Cox proportional hazards regression model, the GLUT-1 signal was dichotomized (0 vs. +1 to +3).In univariate analyses, positive GLUT-1 signal was associated with HR for disease specific mortality of 3.8 (95% CI 0.9–16.2, log-rank p = 0.05), and 3.4 (95% CI 1.5–7.9, log-rank p = 0.0023), in the Toronto, and Turku cohorts, respectively (Table 4). Due to a limited sample size, the multivariate model for Toronto cohort included only two variables. When adjusted for T-category, GLUT-1 positive patients had HR of 2.9 (95% CI 0.7–12.6, Wald p = 0.15) for BC mortality (Table 4). In the Turku cohort, when adjusted for T-category, nodal status and LVI, GLUT-1 positivity was associated with HR of 3.2 (95% CI 1.3–7.5, p = 0.0085) for disease-specific mortality (Table 4).
When the reproducibility of scoring GLUT-1 immunostaining was analyzed, kappa coefficient for the three reviewers was 0.74 indicating substantial agreement between different reviewers.
DISCUSSION
In the present study, we demonstrate that GLUT-1 (Glucose Transporter 1), a marker of tumour hypoxia, is frequently positive in urothelial BC based on two independent clinical radical cystectomy cohorts with differential patient characteristics and overall clinical management. Furthermore, GLUT-1 positivity (of any intensity) turned out as an independent predictor of poor survival after radical cystectomy.
Standard clinico-pathological parameters such as stage, nodal status or LVI were also independent predictors, as one would have expected, adding to the robustness of our findings. The use of 2 different cohorts with 2 different management approaches further supports that hypoxia independently stratifies patients at higher risk of faring poorly after cystectomy. We also should acknowledge the results between the two cohorts were slightly different. The GLUT-1 failed to be independent predictor of outcome in the Toronto cohort, which is likely due to the limited sample size in the Toronto cohort as the hazard ratios for disease specific mortality were very similar but the 95% CI's were much wider in the smaller Toronto cohort. To our knowledge, this is the largest study investigating the prognostic role of GLUT-1 in BC.
GLUT-1 is a member of a transmembrane protein family and has been found to be upregulated in many tumour types. GLUT-1 has been demonstrated to be a reliable marker of tissue hypoxia [11]. Hoskin and coworkers demonstrated significant co-localization of GLUT-1 and pimonidazole, an extrinsic hypoxia marker [16]. In the same study, there was a significant correlation between GLUT-1 immunopositivity and poor survival in a univariate analysis among BC patients treated with external radiation therapy [16].
Non-neoplastic bladder urothelium is typically negative for GLUT-1, but positive staining is frequently detected frequently in urothelial BC [17]. Chang and coworkers found detectable GLUT-1 immunosignaling in 60% (n = 42) of non-invasive, and in 68% (n = 31) of invasive urothelial cancers, which is comparable with the 79% positivity rate in our cohort in invasive/advanced tumours [18]. A number of small surgical series have also demonstrated in univariate analyses that GLUT-1 positivity is an adverse prognostic factor [19, 20]. Our findings therefore confirm this earlier data suggesting a potential independent prognostic value for GLUT-1.
In addition to GLUT-1, other hypoxia markers have been reported to be associated with patient outcomes in BC. Klatte and coworkers found carbonic anhydrase IX (CAIX) to be positive in 71% of cases in a large TMA study (143 TUR-BT and 178 radical cystectomy cases) [21]. CAIX was also independently associated with worse survival. Also HIF1-α has been reported to be frequently upregulated frequently (53% –66%) in both non-invasive and invasive BCs and to be associated with adverse outcome [22–24]. In our study only GLUT-1 was frequently detectable whereas CAIX, and HIF1-α were detected only in 23% , and 8% of cases, respectively. This may be related to differences in the IHC staining process, such as antigen retrieval methods and/or the antibodies used for GLUT-1, CAIX and HIF-1α. There may have also been differences in the thresholds used to define positive staining. Nevertheless, the results together demonstrate that hypoxia is a frequent event in BC and is related to worse outcome following radical cystectomy. Hypoxia may select for a more aggressive phenotype associated with a higher risk for micrometastatic disease.
In addition to its prognostic value, hypoxia is extremely interesting as a potential treatment target in BC. As there is only limited sensitivity to cytotoxic agents such as cisplatin, novel agents are needed either in monotherapy or in combination with chemotherapy in the neo-adjuvant or adjuvant setting. Many available agents such as sunitinib and temsirolimus have potential activity against HIF and mammalian target of rapamycin (mTOR) pathway activation. Sunitinib has been demonstrated to be active against BC cells in vitro, but it failed to demonstrate activity in post first line chemotherapy setting [25, 26]. One possible approach is to combine HIF- and mTOR pathway inhibitors to cytotoxic agents and several such trials are planned or ongoing [27]. Another potential agent, especially in combination with chemotherapy, could be TH-302, hypoxia activated nitroimidazole prodrug of the cytotoxic alkylating agent bromoisophosphoramide mustard which has demonstrated potential efficacy in soft tissue sarcoma and pancreatic carcinoma [28, 29].
Future pre-clinical and clinical studies are warranted with these agents as a means to offset the adverse biology of hypoxic cells based on our clinical data.
Conclusions
This study demonstrates that GLUT-1 is frequently upregulated in urothelial BC treated with radical cystectomy and is an independent predictor of survival after surgery. Further larger multi-institutional validation trial is needed to investigate the true additional prognostic information provided by thisbiomarker.
DISCLAIMER
The authors have no disclosures.
REFERENCES
[1] | Stein J , Lieskovsky G , Cote R , Groshen S , Feng AC , Boyd S , Skinner E , Bochner B , Thangathurai D , Mikhail M , Raghavan D , Skinner D . Radical cystectomy in the treatment of invasive bladder cancer: Long-term results in 1,054 patients. J Clin Oncol (2001) ;19: (3):666–675. |
[2] | Madersbacher S , Hochreiter W , Burkhard F , Thalmann GN , Danuser H , Markwalder R , Studer UE . Radical cystectomy for bladder cancer today–a homogeneous series without neoadjuvant therapy. J Clin Oncol (2003) ;21: (4):690–696. |
[3] | Comprehensive molecular characterization of urothelial bladder carcinoma. Nature (2014) ;507: (7492):315–22. |
[4] | Mitra AP , Lam LL , Ghadessi M , Erho N , Vergara IA , Alshalalfa M , Buerki C , Haddad Z , Sierocinski T , Triche TJ , Skinner EC , Davicioni E , Daneshmand S , Black PC . Discovery and validation of novel expression signature for postcystectomy recurrence in high-risk bladder cancer. J Natl Cancer Inst (2014) ; 106: (11). |
[5] | Dhani N , Fyles A , Hedley D , Milosevic M . The clinical significance of hypoxia in human cancers. Semin Nucl Med (2015) ; (7492) ;45: (2):110–121. |
[6] | Bristow RG , Hill RP . Hypoxia and metabolism. Hypoxia, DNA repair and genetic instability. Nat Rev Cancer (2008) ;8: (3):180–192. |
[7] | Hill RP , Marie-Egyptienne DT , Hedley DW . Cancer Stem Cells, Hypoxia and Metastasis. Sem in Rad Oncol (2009) ;19: (2):106–111. |
[8] | Vergis R , Corbishley CM , Norman AR , Bartlett J , Jhavar S , Borre M , heeboll S , Horwich A , Huddart R , Khoo V , eeles R , Cooper C , Sydes M , Dearnalev D , Parker C . Intrinsic markers of tumour hypoxia and angiogenesis in localised prostate cancer and outcome of radical treatment: A retrospective analysis of two randomised radiotherapy trials and one surgical cohort study. Lancet Oncol (2008) ;9: (4):342–351. |
[9] | Lim K , Chan P , Dinniwell R , Fyles A , Haider M , Cho YB , Jaffray D , Manchul L , Levin W , Hill RP , Milosevic M . Cervical cancer regression measured using weekly magnetic resonance imaging during fractionated radiotherapy:Radiobiologic modeling and correlation with tumor hypoxia. Int J Radiat Oncol Biol Phys (2008) ;70: (1):126–133. |
[10] | Rademakers SE , Lok J , van der Kogel AJ , Bussink J , Kaanders JH . Metabolic markers in relation to hypoxia; staining patterns and colocalization of pimonidazole, HIF-1α, CAIX, LDH-5, GLUT-1, MCT1 and MCT4. BMC Cancer (2011) ;12: (11):167. |
[11] | Ljungkvist ASE , Bussink J , Kaanders JHA , van der Kogel AJ . Dynamics of Tumor Hypoxia Measured with Bioreductive Hypoxic Cell Markers. Rad Res (2007) ;167: (2):127–145. |
[12] | Hoskin PJ , Rojas AM , Bentzen Sm , Saunders MI . Radiotherapy with concurrent carbogen and nicotinamide in bladder carcinoma. J Clin Oncol (2010) ;28: (33):4912–4918. |
[13] | Hunter BA , Eustace A , Irlam JJ , Valentine HR , Denley H , Oguejiofor KK , Swindell R , Hoskin PJ , Choudhury A , West CM . Expression of hypoxia inducible factor-1α predicts benefit from hypoxia modification in invasive bladder cancer. BJC (2014) ;111: (3):437–443. |
[14] | Zhong H , De Marzo AM , Laughner E , Lim M , Hilton DA , Zadzag D , Isaacs WB , Semenza GL , Simons JW . Overexpression of hypoxia-inducible factor 1alpha in common human cancers and their metastases. Cancer Res (1999) ;59: (22):5830–5835. |
[15] | Hedley D , Pintilie M , Woo J , Nicklee T , Morrison A , Birle D , Fyles A , Milosevic M , Hill R . Up-Regulation of the Redox Mediators Thioredoxin and Apurinic/Apyrimidinic Excision (APE)/Ref-1 in Hypoxic Microregions of Invasive Cervical Carcinomas, Mapped Using Multispectral, Wide-Field Fluorescence Image Analysis. Am J Pathol (2004) ;164: (2):557–565. |
[16] | Hoskin PJ , Sibtain A , Daley FM , Wilson GD . GLUT1 and CAIX as intrinsic markers of hypoxia in bladder cancer: Relationship with vascularity and proliferation as predictors or outcomes of ARCON. Br J Cancer (2003) ;87: (7):1290–1297. |
[17] | Younes M , Lechago LV , Somoano JR , Mogharaf M , Lechago J . Wide expression of the human erythocyte glucose transporter 1 in human cancers. Cancer Res (1996) ;56: (5):1164–1167. |
[18] | Chang S , Lee S , Lee C , Kim JI , Kim Y . Expression of the human erythrocyte glucose transporter in transitional cell carcinoma of the bladder. Urology (2000) ;55: (3):448–452. |
[19] | Younes M , Juarex D , Lechago LV , Lerner SP . Glut 1 expression in transitional cell carcinoma of the urinary bladder is associated with poor patient survival. Anticancer Res (2001) ;21: (1B):575–557. |
[20] | Palit V , Phillips RM , Puri R , Shah T , Bibby MC . Expression of HIF-1alpha and Glut-1 in human bladder cancer. Oncol Rep (2005) ;14: (4):909–913. |
[21] | Klatte T , Seligson DB , Rao JY , Yu H , de Martino M , Kawaoka K , Wong SG , Belldegrun AS , Pantuck AJ . Carbonic anhydrase IX in bladder cancer. Cancer (2009) ;115: (7):1148–1158. |
[22] | Chai CY , Chen WT , Hung WC , Kang WY , Huang YC , Su YC , Su YC , Yang CH . Hypoxia-inducible factor-1α expression correlates with focal macrophage infiltration, angiogenesis and unfavourable prognosis in urothelial carcinoma. J Clin Pathol (2008) ;61: (5):658–664. |
[23] | Chen WT , Hung WC , Kang WY , Huang YC , Su YC , Yang CH , Chai CY . Overexpression of cyclooxygenase-2 in urothelial carcinoma in conjunction with tumor-associated-macrophage infiltration, hypoxia-inducible factor-1α expression, and tumor angiogenesis. APMIS (2009) ;117: (3):176–184. |
[24] | Theodoropoulos VE , Lazaris AC , Kastriotis I , Spiliadi C , Theodoropoulos GE , Tsoukala V , Patsouris E , Sofras F . Evaluation of hypoxia-inducible factor 1α overexpression as a predictor of tumor recurrence and progression in superficial urothelial bladder carcinoma. BJU Int (2005) ;95: (3):425–431. |
[25] | Sonpadve G , Jian W , Liu H , Wu MF , Shen SS , Lerner SP . Sunitinib malate is active against human urothelial carcinoma and enhances the activity of cisplatin in a preclinical model. Urol Oncol (2009) ;27: (4):391–399. |
[26] | Gallagher DJ , Milowsky MI , Gerst SR , Ishill N , Riches J , Regazzi A , Boyle MG , Trout A , Flaherty AM , Bajorin DF . Phase II study of sunitinib in patients with metastatic urothelial cancer. J Clin Oncol (2010) ;28: (8):1373–1379. |
[27] | Tickoo SK , Milowsky MI , Dhar N , Dudas ME , Gallagher DJ , Al-Ahmadie H , Gopalan A , Fine SW , Ishill N , Bajorin DF , Reuter VE . Hypoxia-inducible factor and mammalian target of rapamycin pathway markers in urothelial carcinoma of the bladder: Possible therapeutic implications. BJU Int (2010) ;107: (5):844–849. |
[28] | Chawla SP , Cranmer LD , Van Tine BA , Reed DR , Okuno SH , Butrynski JE , Adkins DR , Hendifar AE , Kroll S , Ganjoo KN . Phase II study of the safety and antitumor activity of the hypoxia-activated prodrug TH-302 in combination with doxorubicin in patients with advanced soft tissue sarcoma. J Clin Oncol (2014) ;32: (29):3299–3306. |
[29] | Borad MJ , Reddy SG , Bahary N , Uronis HE , Sigal D , Cohn AL , Schelman WR , Stephenson J , Chiorean EG , Rosen PJ , Ulrich B , Dragovich , Del Prete SA , Rarick M , Eng C , Kroll S , Ryan DP . Randomized phase II trial of gemcitabine plus TH-302 versus gemcitabine in patients with advanced pancreatic cancer. J Clin Oncol (2015) ;33: (13):1475–81m. |
Figures and Tables
Fig.1
Expression status of hypoxia related markers in bladder cancer tissue. Immunohistochemistry staining of HIF1a, CA-IX, GLUT-1 and Ki-67 in paraffin-embedded TMA sections of bladder cancer tissues.
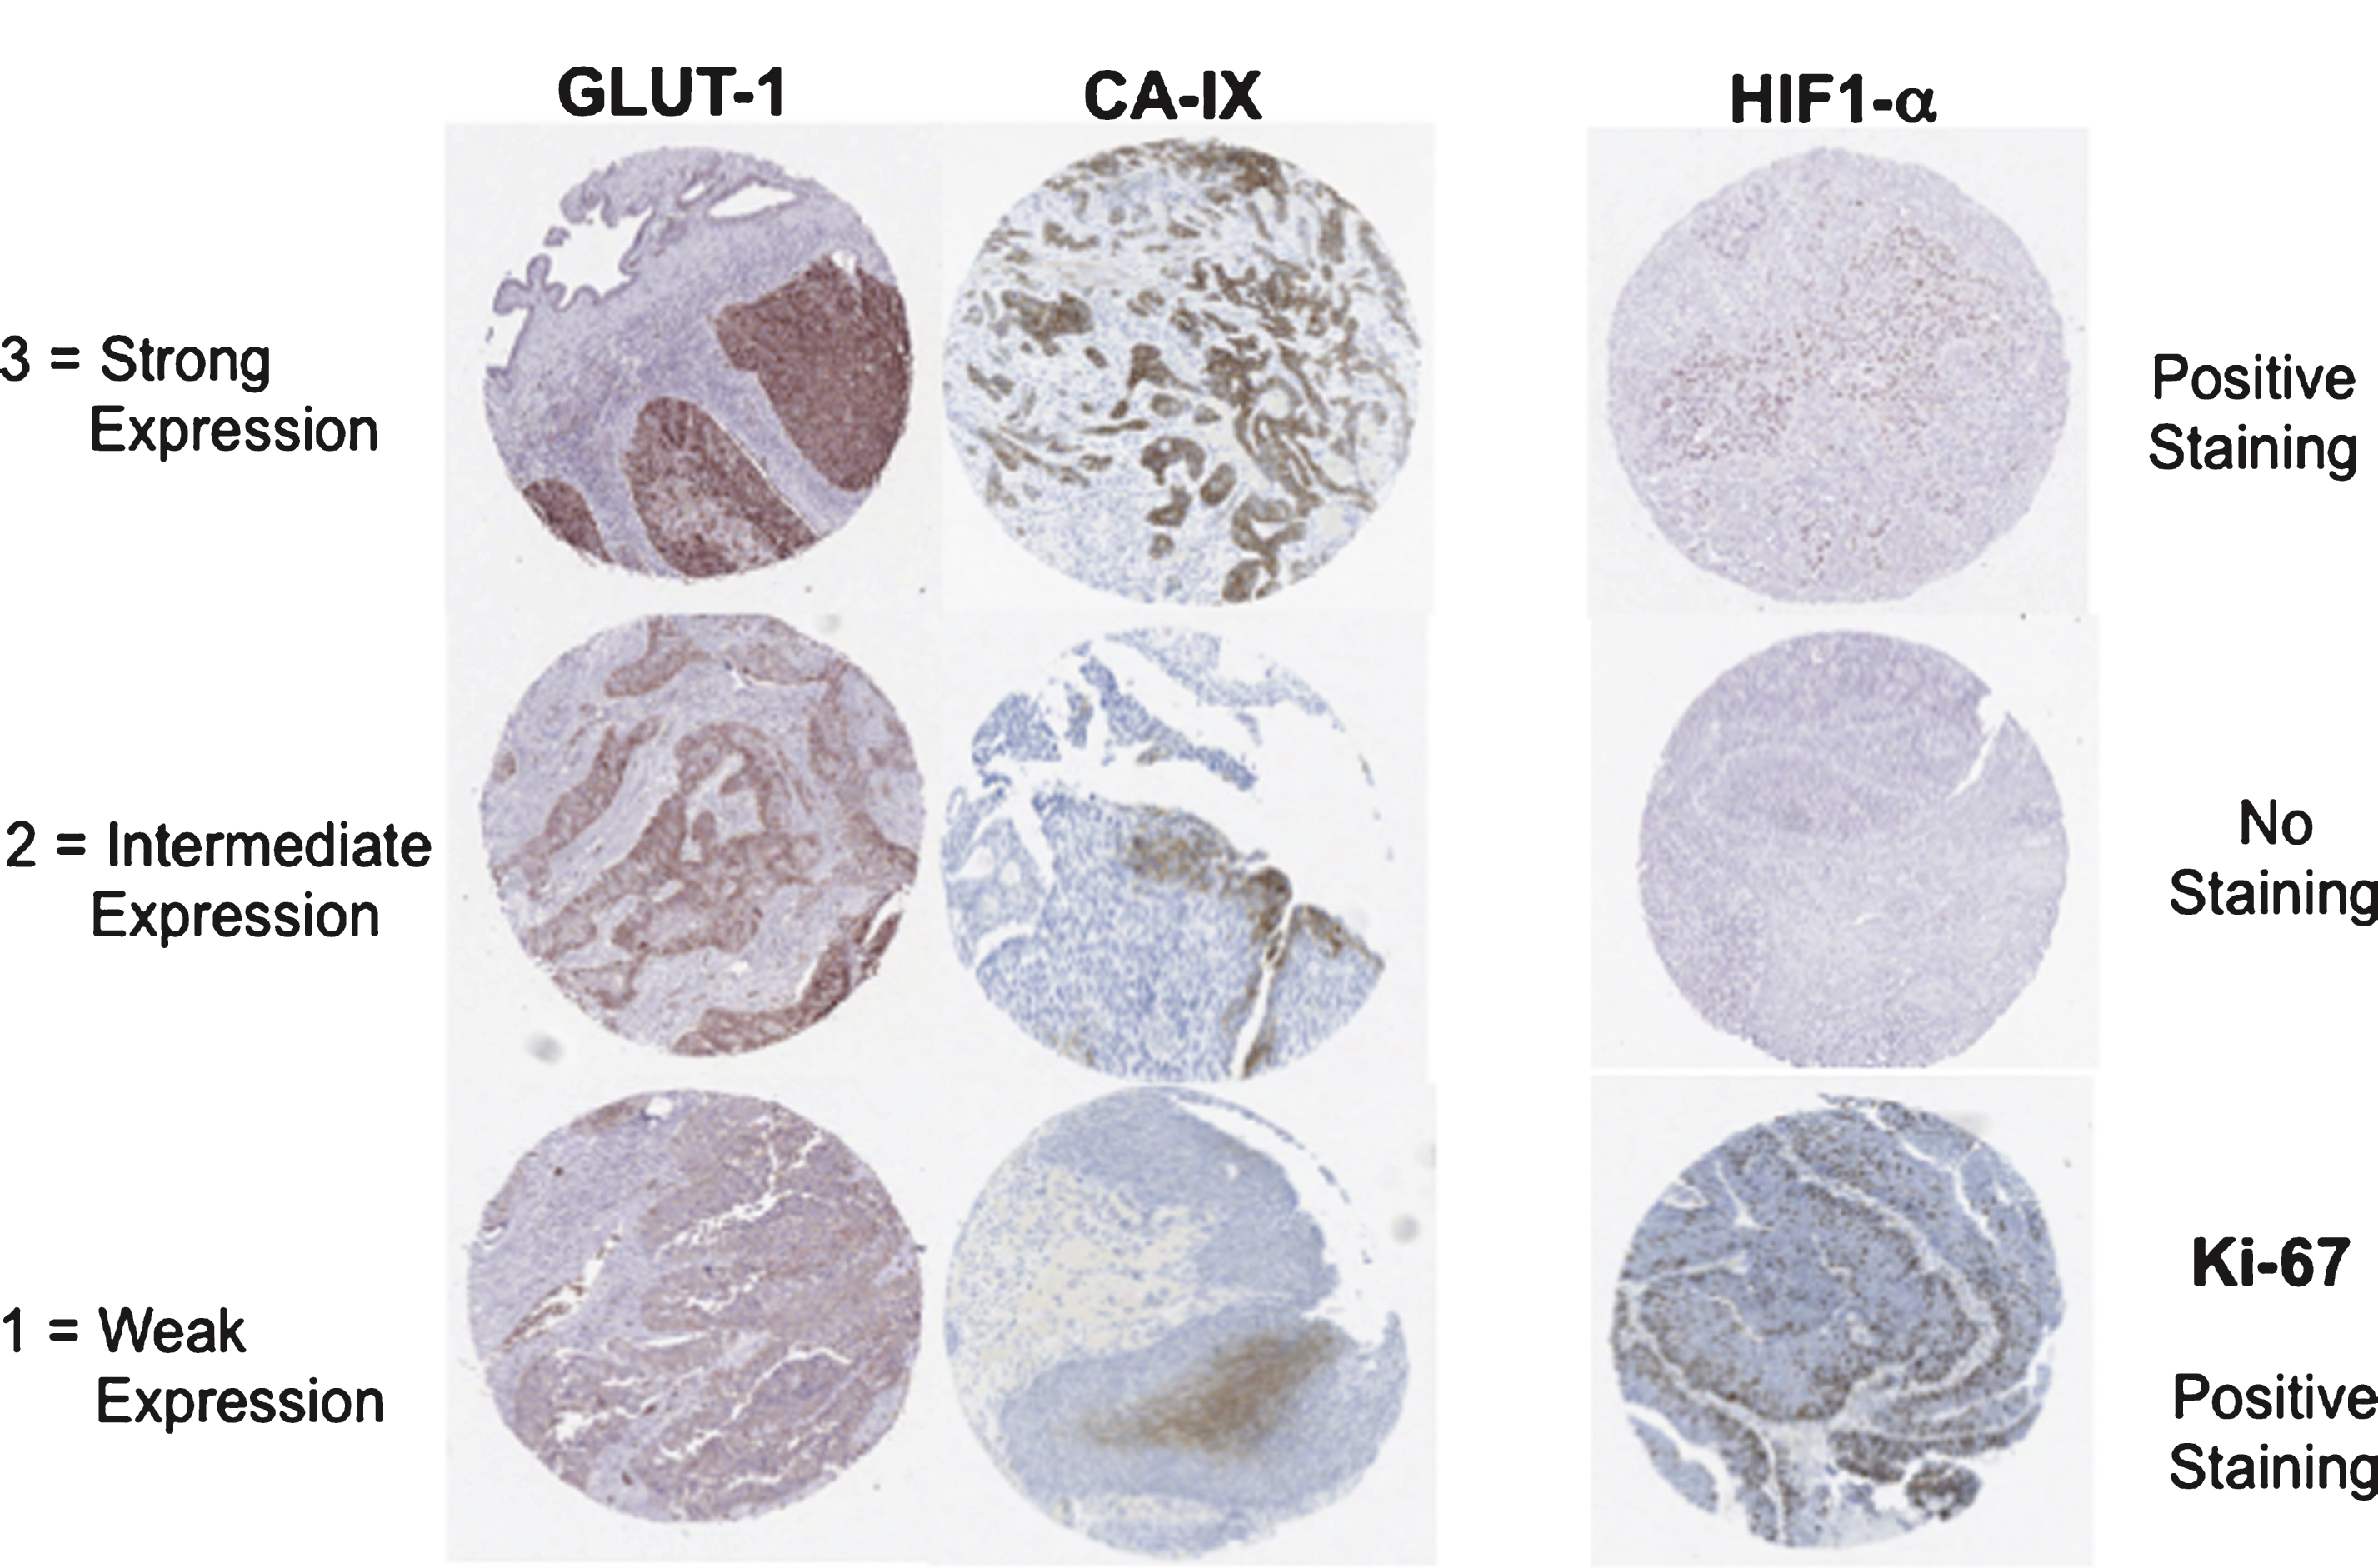
Fig.2
Hypoxia and Ki-67 marker distributions in the two cohorts. P-values refer to the significance of signal intensity distribution difference between the two cohorts (Fisher’s exact test for hypoxia markers, Mann-Whitney test for Ki-67).
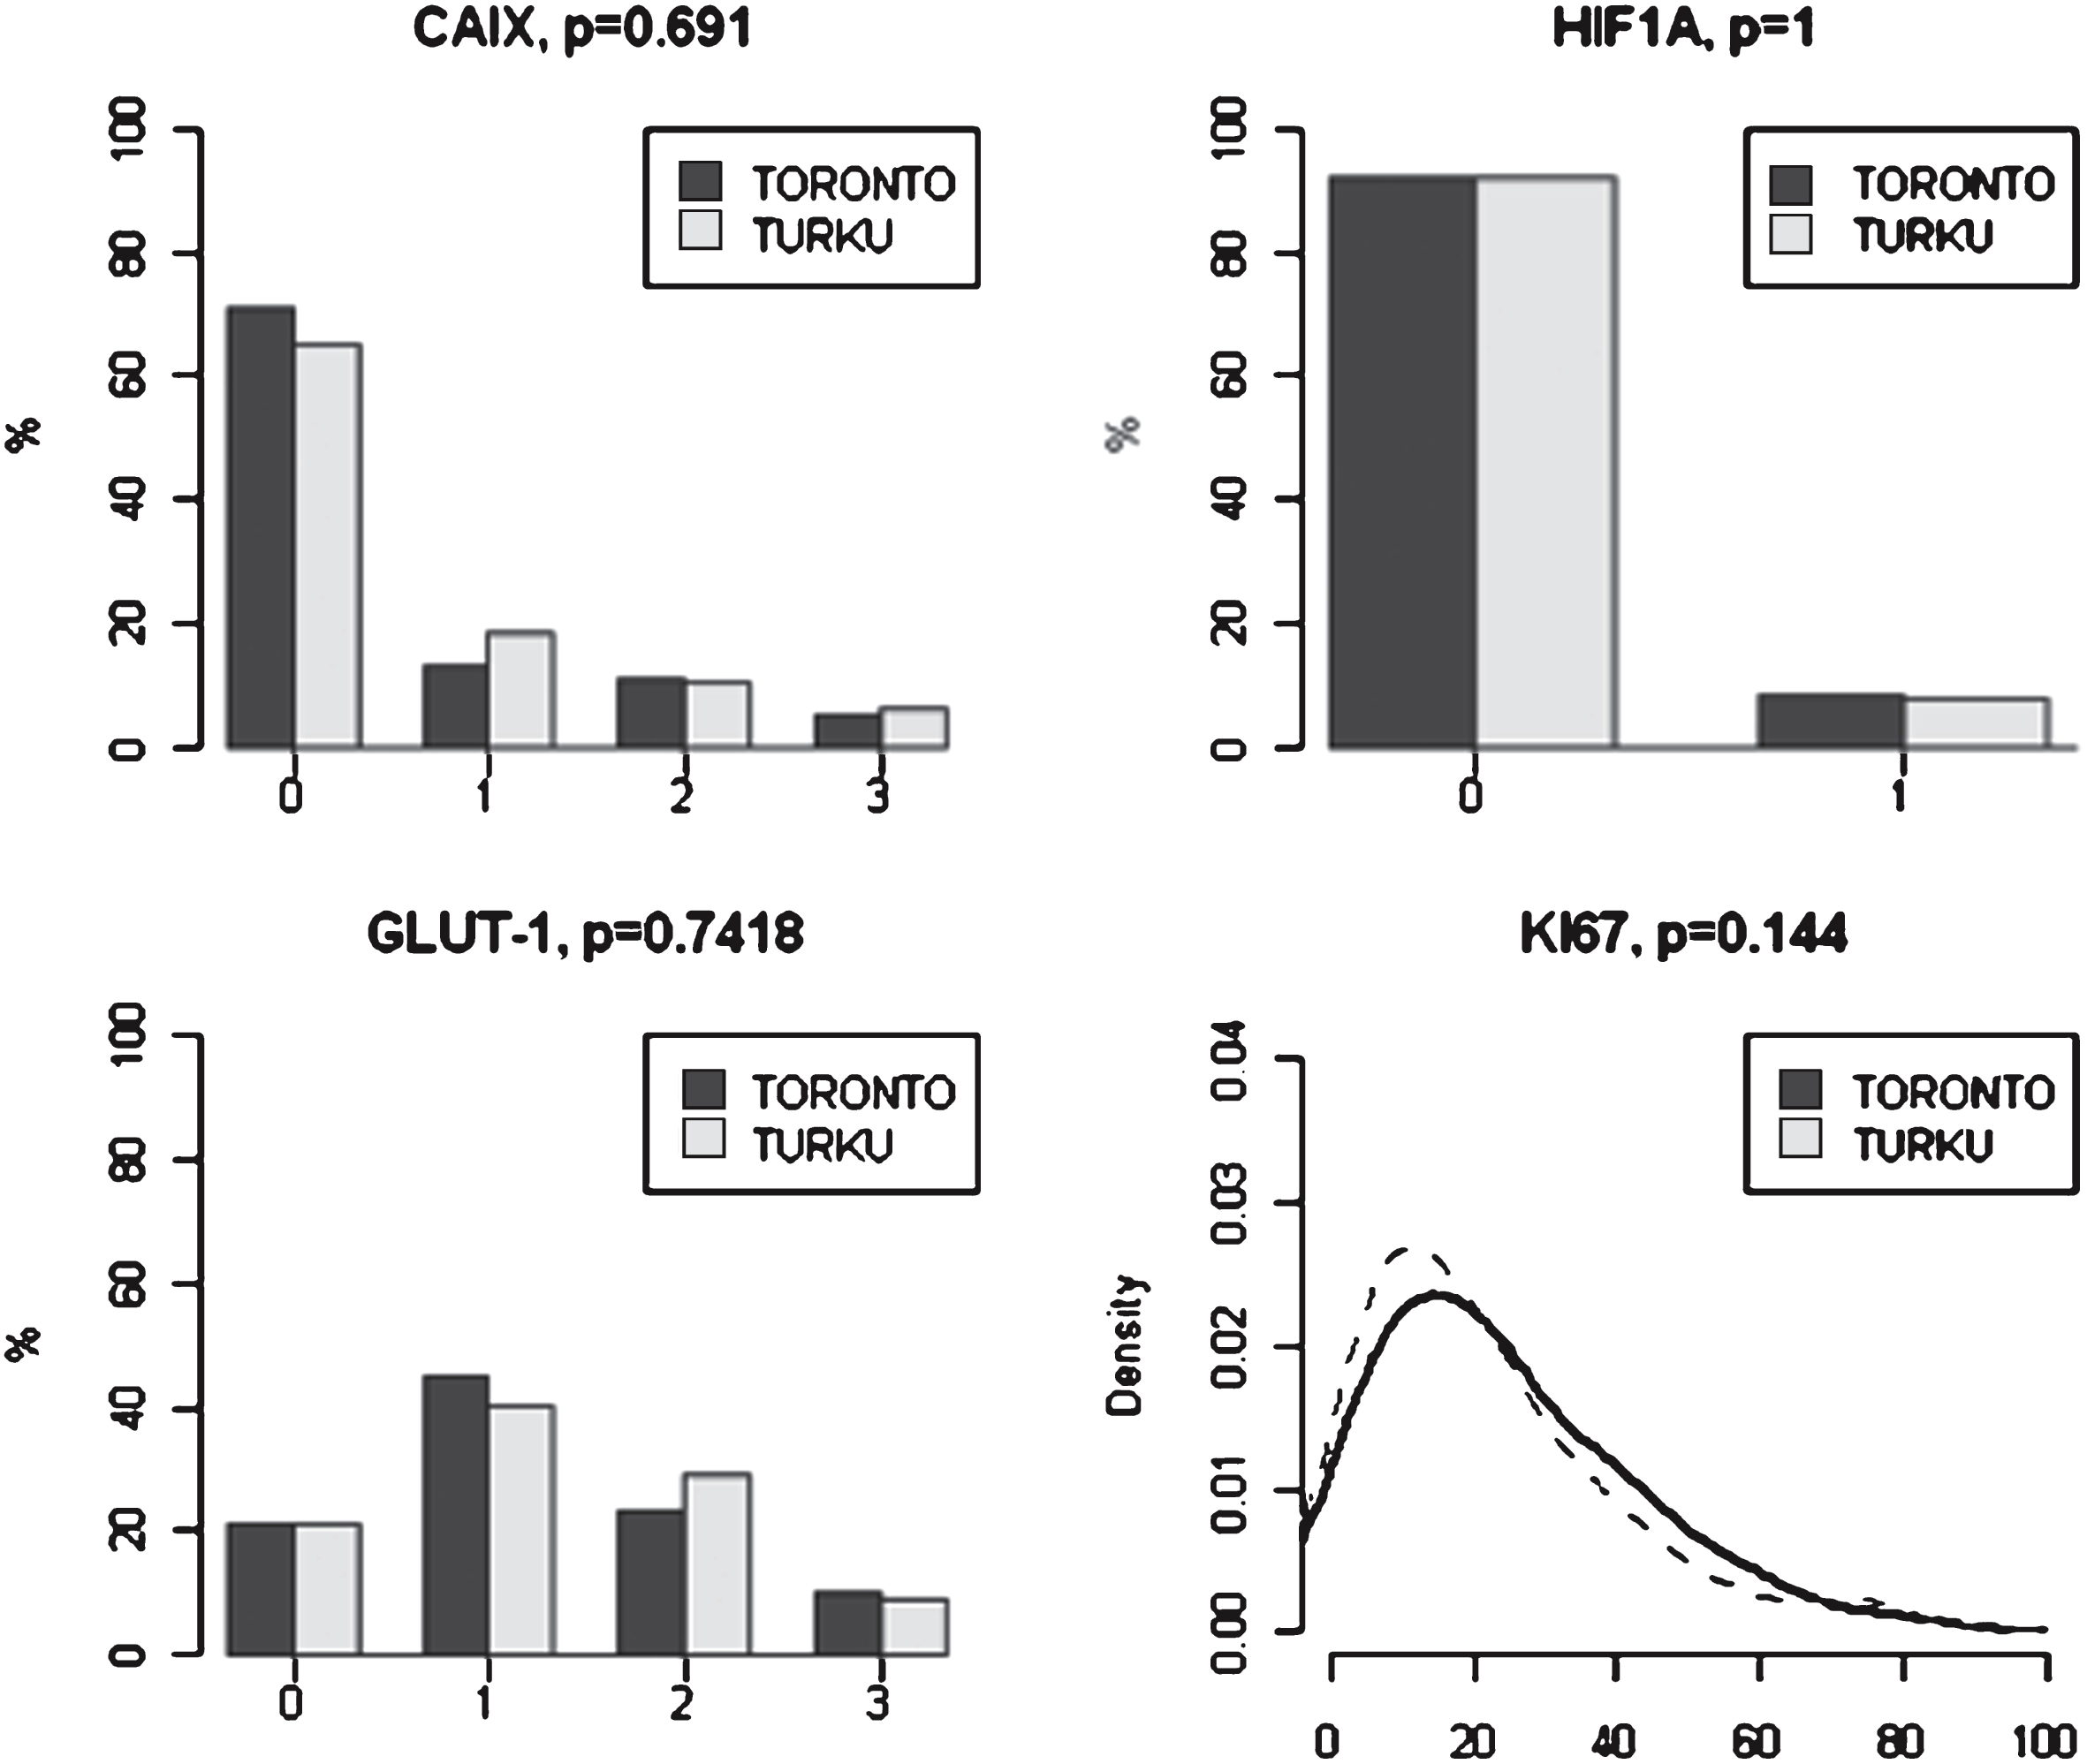
Fig.3
Univariate analyses of marker score association with disease-specific survival. For each hypoxia marker, Kaplan-Meier curves are presented for both study centers. For GLUT-1, in addition to detailed analysis on all intensity levels, also analysis for dichotomized (negative vs. any positive immunosignal) intensity scores are presented. P-values refer to log-rank test.
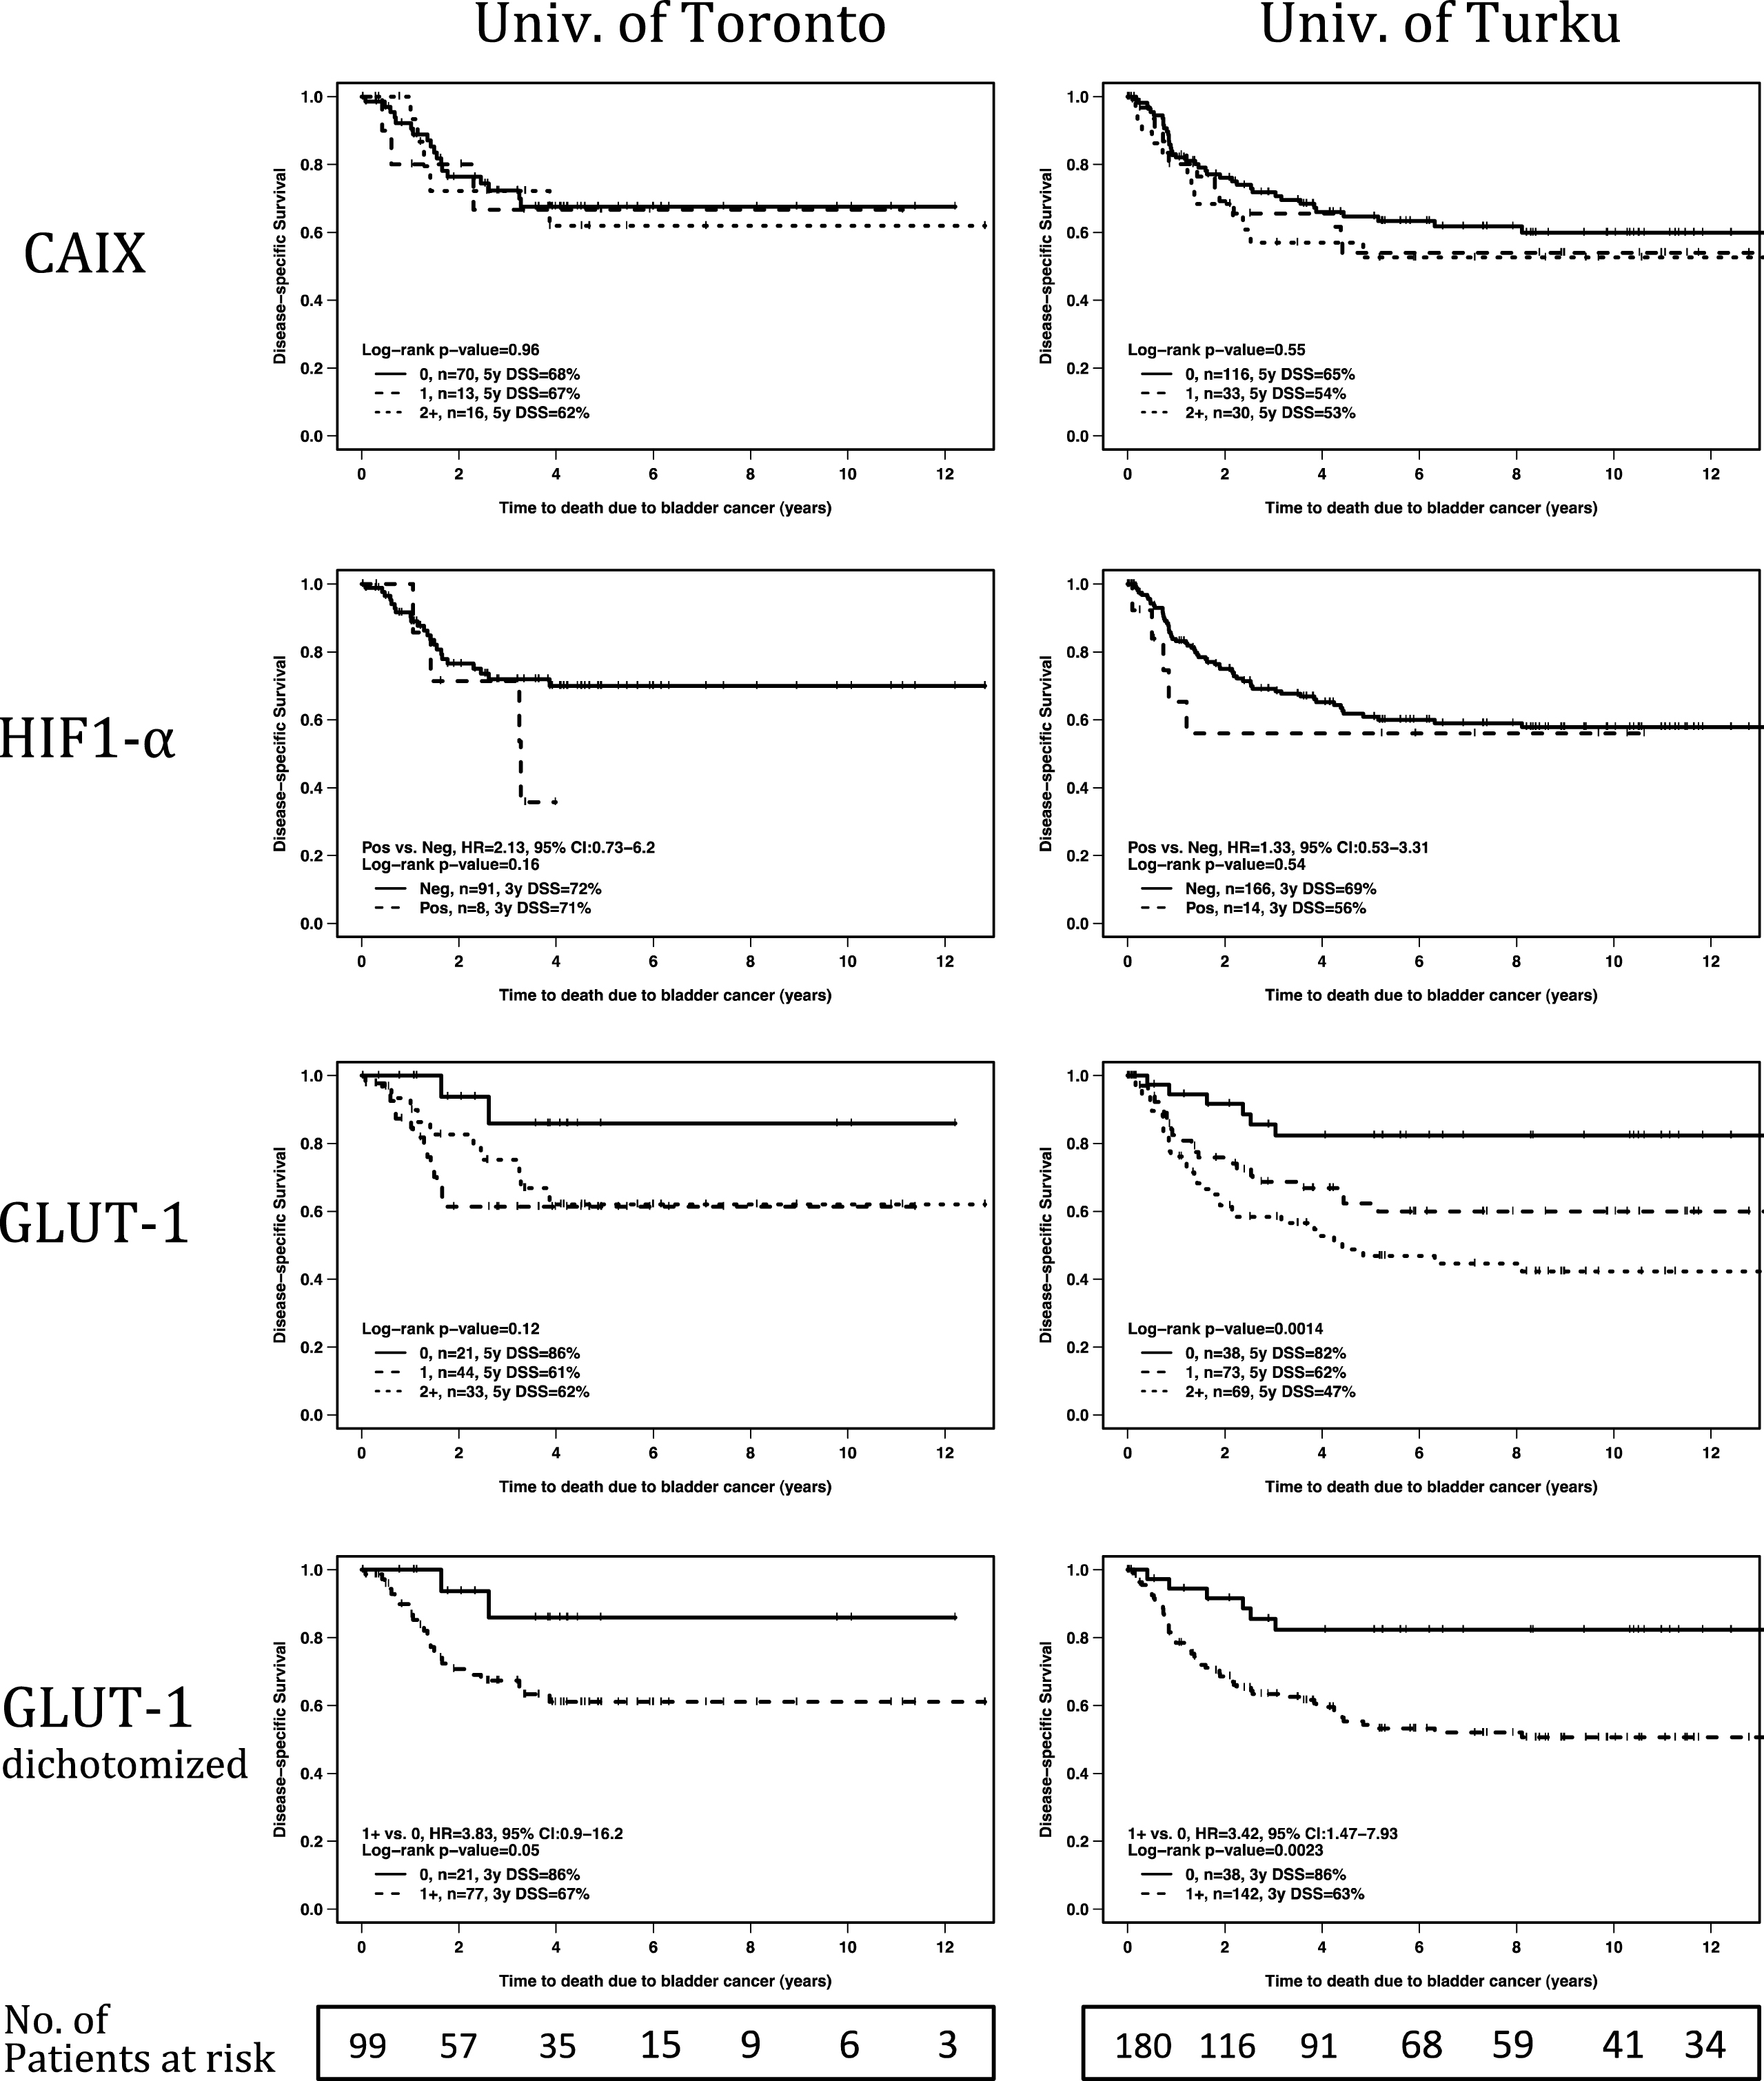
Table 1
Baseline clinicopathological characteristics
| UHN | University of Turku | |||
| (n = 99) | (n = 180) | |||
| Characteristic | No. | % | No. | % |
| Gender | ||||
| Male | 76 | 77 | 146 | 81 |
| Age | ||||
| Median (range) | 68 (39–88) | 65 (36–80) | ||
| Smoking status | ||||
| Current | 18 | 18 | 72 | 40 |
| Former | 44 | 44 | 21 | 12 |
| Never | 23 | 23 | 80 | 44 |
| Unknown | 14 | 14 | 7 | 4 |
| Grade | ||||
| Low grade/Grade 1-2 | 7 | 7 | 27 | 15 |
| High grade/Grade 3 | 92 | 93 | 153 | 85 |
| T-category | ||||
| ≤ pT1 | 22 | 22 | 85 | 47 |
| pT2 | 27 | 27 | 38 | 21 |
| pT3 | 39 | 39 | 44 | 24 |
| pT4 | 11 | 11 | 13 | 7 |
| Nodal status | ||||
| N0 | 73 | 74 | 54 | 30 |
| N1-3 | 26 | 26 | 13 | 7 |
| N unknown | 0 | 0 | 113 | 63 |
| CIS | ||||
| Present | 48 | 48 | 63 | 35 |
| LVI | ||||
| Present | 37 | 37 | 67 | 37 |
| Adjuvant therapy | ||||
| Chemotherapy | 23 | 23 | 1 | 1 |
| Radiation | 0 | 0 | 2 | 1 |
| Vital status | ||||
| Alive, NED | 51 | 52 | 57 | 32 |
| Alive with recurrence | 6 | 6 | 8 | 4 |
| Death, bladder cancer | 26 | 26 | 64 | 36 |
| Death, other cause | 16 | 16 | 51 | 28 |
| Follow-up | ||||
| Years, median | 3.6 (0.02–12.8) | 8.5 (0.1–22) | ||
| (range) | ||||
Abbreviations: CIS = carcinoma in citu; LVI = lymphovascular invasion; NED = no evidence of disease.
Table 2
Marker distribution in the two study cohorts
| UHN | University of | |||
| (n = 99) | Turku (n = 180) | |||
| Marker | No. | % | No. | % |
| CAIX | ||||
| 0, Negative signal | 70 | 71 | 116 | 65 |
| +1, Weak signal | 13 | 13 | 33 | 18 |
| +2, Intermediate signal | 11 | 11 | 19 | 11 |
| +3, Strong signal | 5 | 5 | 11 | 6 |
| HIF1- α | ||||
| Negative | 91 | 92 | 166 | 92 |
| Positive | 8 | 8 | 14 | 8 |
| GLUT-1 | ||||
| 0, Negative signal | 21 | 21 | 38 | 21 |
| +1, Weak signal | 44 | 44 | 73 | 41 |
| +2, Intermediate signal | 23 | 23 | 53 | 29 |
| +3, Strong signal | 10 | 10 | 16 | 9 |
| KI-67 | ||||
| Percent positive cells, | 21% (2–80%) | 17% (2–80%) | ||
| Median (range) | ||||
Abbreviations: NED = no evidence of disease.
Table 3
Association between different biomarkers in the two study cohorts
| HIF1α | CAIX | GLUT-1 | Ki-67 | |
| UHN | ||||
| HIF1α | NA | 0.43 | 0.20 | 0.73 * |
| CAIX | 0.43 | NA | 0.29 | 0.03 *** |
| GLUT-1 | 0.20 | 0.29 ** | NA | 0.0006 *** |
| University of Turku | ||||
| HIF1α | NA | 0.57 | 0.74 | 0.72 * |
| CAIX | 0.57 | NA | 7.1e–5 ** | 0.10 *** |
| GLUT-1 | 0.74 | 7.1e–5 ** | NA | 0.006 *** |
Data presented as p-values which were calculated using the Cochran-Armitage test for trend, except *used Mann-Whitney, **used Fisher’s exact test and ***used the Kruskal-Wallis test.
Table 4
Univariate and multivariate Cox proportional hazards regression analysis of factors affecting disease specific survival
| Variable | UHN | University Of Turku | |||||||||||
| Univariate | Multivariate | Univariate | Multivariate | ||||||||||
| HR | 95% CI | p-value | HR | 95% Ci | Wald | HR | 95% CI | p-value | HR | 95% CI | Wald | ||
| p-value | p-value | ||||||||||||
| Gender | male vs. female | 1.4 | 0.5–3.7 | 0.52 | 0.59 | 0.24–1.04 | 0.067 | ||||||
| Grade | high vs. low | 0.9 | 0.2–3.7 | 0.86 | 2.9 | 1.2–7.1 | 0.018 | ||||||
| T-category | T3-4 vs.T1/T2 | 3.5 | 1.4–8.2 | 0.003 | 2.9 | 1.2–7.1 | 0.02 | 4.3 | 2.6–7.1 | <0.0001 | 3.7 | 2.1–6.5 | <0.0001 |
| N-category | Npos vs. Nneg/x | 3.1 | 1.4–6.7 | 0.003 | 5.9 | 2.7–13.1 | <0.0001 | 3.2 | 1.5–6.6 | 0.0017 | |||
| CIS | present vs. absent | 0.6 | 0.3–1.3 | 0.16 | 0.9 | 0.5–1.5 | 0.62 | ||||||
| LVI | present vs. absent | 2.1 | 0.98–4.6 | 0.049 | 3.9 | 2.3–6.4 | <0.0001 | 1.6 | 0.9–3.0 | 0.11 | |||
| Ki-67 | continuous | 0.99 | 0.97–1.01 | 0.41 | 1.01 | 0.998–1.02 | 0.11 | ||||||
| Low vs. high* | 0.9 | 0.4–1.7 | 0.68 | 1.5 | 0.9–2.9 | 0.086 | |||||||
| CAIX | 1+ vs. 0 | 1.1 | 0.3–3.8 | 1.2 | 0.7–2.3 | ||||||||
| 2+ vs. 0 | 1.1 | 0.4–3.0 | 0.96 | 1.4 | 0.7–2.6 | 0.55 | |||||||
| HIF-1α | pos. vs. neg | 2.1 | 0.7–6.2 | 0.16 | 1.3 | 0.5–3.3 | 0.54 | ||||||
| GLUT-1 | 1+ vs. 0 | 4.2 | 0.96–18.7 | 2.6 | 1.1–6.5 | 0.0014 | |||||||
| 2+ vs. 0 | 3.4 | 0.7–15.4 | 0.12 | 4.2 | 1.8–10.1 | ||||||||
| any pos. vs. neg. | 3.8 | 0.9–16.2 | 0.05 | 2.9 | 0.7–12.6. | 0.15 | 3.4 | 1.5–7.9 | 0.0023 | 3.2 | 1.3–7.5 | 0.0085 | |
Abbreviations: CIS = carcinoma in situ; LVI = lymphovascular invasion; *20% cut-off used for Ki-67.

